Long-term changes in vegetation and land use in mountainous areas with heavy snowfalls in northern Japan: an 80-year comparison of vegetation maps
 Takuto Shitara1
  Hiroko Kurokawa2
  Michio Oguro2
  Takehiro Sasaki3
  Haruka Ohashi4 Kaoru Niiyama2 Mitsue Shibata2
  Tetsuya Matsui5,6*
- 1Tama Science Forest Garden, Forestry and Forest Products Research Institute, Tokyo, Japan
- 2Department of Forest Vegetation, Forestry and Forest Products Research Institute, Ibaraki, Japan
- 3Graduate School of Environment and Information Sciences, Yokohama National University, Yokohama, Japan
- 4Department of Wildlife Management, Forestry and Forest Products Research Institute, Ibaraki, Japan
- 5Center for Biodiversity and Climate Change, Forestry and Forest Products Research Institute, Ibaraki, Japan
- 6Faculty of Life and Environmental Sciences, University of Tsukuba, Ibaraki, Japan
Comparison of old and new vegetation maps is an effective way to detect vegetation dynamics. Recent developments in computer technology have made it possible to accurately compare old paper vegetation maps with current digitized vegetation maps to reveal long-term vegetation dynamics. Recently, a 1:50,000 scale vegetation map of the Hakkoda Mountains in northern Japan, located in the ecotone of cool temperate and subalpine forests in northern Japan under an East Asian monsoon climate, from 1930 was discovered. We compared the 1930s vegetation map with the most recent 2010 vegetation map to test the following hypotheses: 1) the occurrence of upward expansion of the upper limit of cool-temperate deciduous forests, and 2) whether designation as a national park in 1936 would have reduced forestry and land use, expanded beech forests, and cool-temperate deciduous forests. To compare vegetation changes, 67 types of vegetation legends for the 1930 and 2010 maps were unified to 21 based on plant species composition. Consequently, vegetation has changed substantially over the past 80 years. 1) In the subalpine zone above 1,000 m, the coniferous forest area decreased by half. In the cool temperate zone below 1,000 m, the area of beech forests increased 1.48 times, and some of them could be shifted upwards, replacing subalpine fir forests in the lower part of the subalpine zone. 2) In areas below 700 m, deciduous oak forests once used as thickets were almost halved. Instead, climax and beech forests expanded. However, we also found that even after the area was declared a national park, oak forests were cleared and converted to commercial forests such as cedar plantations, cattle ranches, and horse pastures in some areas. These results will be useful for future ecosystem and biodiversity research/conservation and will provide baseline information for climate change adaptation policies.
1 Introduction
Studies from permanent plots or resurveys of old plots improve our understanding of long-term vegetation dynamics and provide valuable information for ecosystem and biodiversity conservation, climate change adaptation, and historical natural resource use and management (Chytrý et al., 2019; Salinitro et al., 2019). Vegetation maps provide fundamental data for continuous environmental monitoring and are widely used in various disciplines such as ecology, environmental science, land use planning, biodiversity conservation, and natural resource management (Pedrotti, 2013). Comparing old and new vegetation maps is an effective way to detect vegetation dynamics spatially (Pedrotti, 2013). Recent developments in geographic information systems (GIS) and computer technology are improving the digitalization of old and analog paper maps (Pedrotti, 2013; Chytrý et al., 2019). Advances in these technologies have allowed vegetation scientists to easily and accurately compare old vegetation maps with current maps and identify vegetation dynamics over time.
Long-term vegetation monitoring and comparisons of vegetation maps have shown that climate change and land-use change (e.g., afforestation, cultivation, grazing, residential development, and long-term forest use) affect vegetation through direct or indirect impacts (Kapfer and Popova, 2019). Global land surface temperature has increased by an average of 1.59°C over the past century (IPCC, 2023), and vegetation has shifted poleward or upward in boreal, temperate, and tropical ecosystems since 1700 (e.g., Settele et al., 2014; Sittaro et al. 2017; Moret et al., 2019; Boisvert-Marsh et al., 2019; Parmesan et al., 2022). One-third of the world’s land area has undergone some form of land-use change in the last 60 years (Winkler et al., 2021). After World War II, there was a surge in demand for timber, which led to the clearing of natural forests in various regions, and the expansion of monospecific conifer plantations in Japan (Matsushita, 2015; Forestry Agency, Japan, 2019). Furthermore, the 1960s fuel revolution decreased the demand for firewood and charcoal, which led to the underutilization of formerly coppiced forests close to populated areas (Tsuji and Hoshino, 1992; Fujimura, 1994). Consequently, these secondary forests have transitioned to the final stage of old growth.
Despite this, little information is available on the long-term vegetation dynamics in mountainous areas over half a century by comparing old and new vegetation maps at the landscape scale (Kapfer et al., 2017). Since vegetation generally takes more than 100 years to return to its original natural state after land use is discontinued (Faliński, 2003), long-term monitoring is essential to detect these changes. Alternatively, if we had vegetation data from 100 years ago, we might have been able to compare it with current data to show the vegetation dynamics of the two periods, although continuous changes cannot be confirmed.
Recently, a 1:50,000 scale vegetation map and vegetation survey report of the Hakkoda Mountains, northern Honshu, Japan, was discovered at the Forestry and Forest Products Research Institute. It was believed that the Aomori Forestry Bureau’s Vegetation Survey Section created these materials in the 1930s (Figure 1; Niiyama et al., 2020; Shibata et al., 2023). Mt. Hakkoda is a heavy snowfall area with a maximum snow depth of approximately 3–5 m. In February 2013, a snow depth of 566 cm was recorded at Sukayu (890 m above sea level) on Mt. Hakkoda. This is the highest snow depth ever recorded in Japan since the start of measurements by the Japan Meteorological Agency’s Automated Meteorological Data Acquisition System (AMeDAS), which has been the country’s primary source of snow depth records since its inception (Tanaka et al., 2014). This area contains an ecotone between cool temperate deciduous broadleaf forests (mainly Fagus crenata forests) at lower elevations and subalpine evergreen coniferous forests (Abies mariesii forests) at higher elevations in the East Asian monsoon climate. Both species are endemic to Japan and are highly tolerant of climates with heavy snowfall. The distribution of forests on this mountain and the age of the vegetation map creates favorable conditions for detecting the effects of climate change on vegetation. In addition, since the area around Lake Towada, located south of the Hakkoda Mountains, has been inhabited for more than 300 years (Iwabuchi, 1999), it may be possible to detect the influence of the history of forest use in this area from 80 years ago to the present on the dynamics of vegetation. Mt. Hakkoda has been the focus of much attention as an important site for vegetation dynamics because the area is a unique region in the world, a volcanic island in East Asia with a heavy snowfall climate. In addition, as a large amount of pollen fossils have been found in the area, vegetation changes since the last glacial period have been revealed. As a site for monitoring vegetation changes due to recent climate change, it is also attracting attention (e.g., Tanaka et al., 2014; Tsuchihashi et al., 2023). Tanaka et al. (2014) found that the distribution of subalpine conifer forests has shifted to higher elevations in response to warming over a 30-year period. Tsuchihashi et al. (2023) resurveyed historical moorland plots in 2020, which were surveyed once in 1933, and observed a landscape-wide increase in the occurrence of woody species and non-moorland species despite potential resampling errors. By building upon previous research, our investigation will provide important insights into understanding long-term vegetation succession in the region.
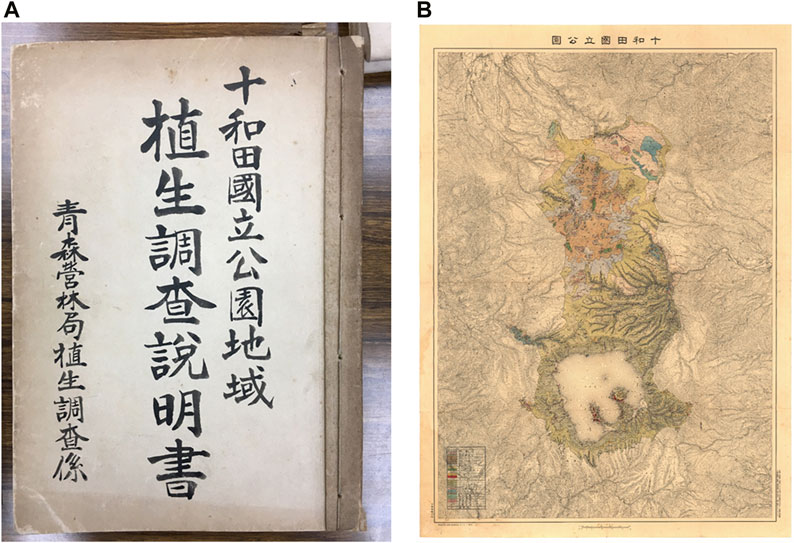
FIGURE 1. The title page of the 1930 vegetation survey report for the Hakkoda Mountains prepared by the then Vegetation Survey Section of the Aomori Forestry Bureau (A) and the 1:50,000 vegetation map of the study site (B). The report was handwritten and no printed or published material was found.
In this study, we compared an old vegetation map with a current vegetation map (Biodiversity Center of Japan, 2010) to elucidate vegetation dynamics over the past 80 years in the area and characterize these changes. Therefore, we formulated the following hypotheses: 1) We hypothesized that the upper limit of cool temperate deciduous forests would expand upward owing to climate change. Tanaka et al. (2014) reported that the distribution of fir forests has shifted to higher elevations owing to warming over a period of approximately 30 years. If this is the case, the vegetation map comparison in this study would yield similar results. Although northward range expansions of cool-temperate beech (F. crenata) forests at their northern range limit have been reported (Kitamura et al., 2015; Aiba et al., 2022), an upward shift has not been reported to our knowledge. 2) The lack of regular forest use, such as logging or coppicing for fuelwood and charcoal, particularly in the vicinity of human settlements, was our hypothesized cause of some of the vegetation change in the area. In Japan, the energy revolution in the 1960s led to the reduced use of coppice forests, and the transition from coppice to climax forests occurred. Moreover, human activities would have been regulated, and natural vegetation would have expanded because the study area was designated as Towada National Park in 1936. Most of the area changed from deciduous oak forests to beech forests. There was no increase in the number of plantations.
2 Materials and methods
2.1 Study area
The Hakkoda Mountains, the study area, are now registered as part of the Towada-Hachimantai National Park (Figure 2). This national park covers the Aomori, Iwate, and Akita prefectures and includes Lake Towada and the Hakkoda Mountains in the Aomori Prefecture (Ministry of the Environment, Japan: https://www.env.go.jp/park/towada/intro/index.html). The study area includes the Towada-Hakkoda region, which was formerly designated Towada National Park in 1936. More than ten peaks, with Mt. Odake (1,585 m) at its core, form the Mt. Hakkoda range, including Mt. Akakura (1,548 m) and Mt. Takada-Odake (1,552 m) (Miyawaki, 1987). Many wetland communities have developed on the slopes of the Hakkoda Mountains (Figure 3). Lake Towada (400 m above sea level) is the largest crater lake in Honshu, Japan (Figure 2). The Oirase River, which features numerous rapids, waterfalls, and a picturesque gorge, is the only river that drains the lake. This creates a picturesque combination of forests, wetlands, lakes, and rivers within the national park.
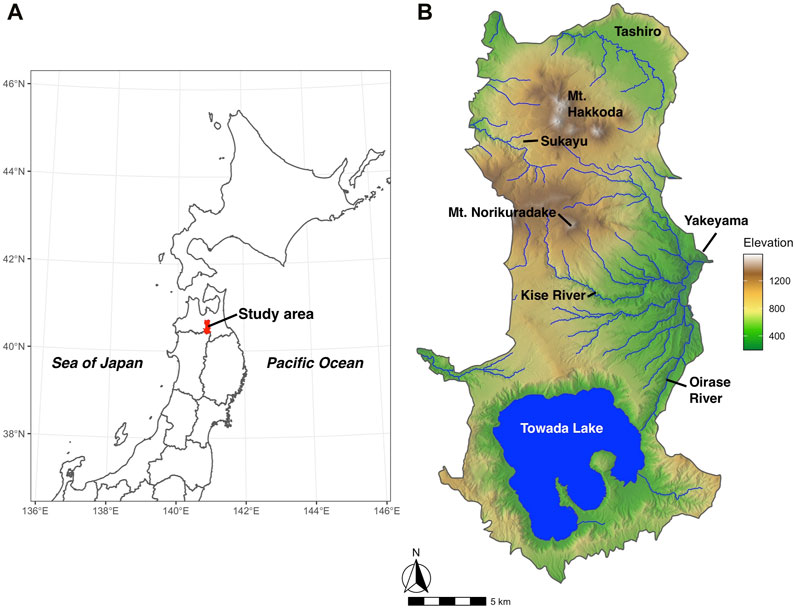
FIGURE 2. Location of the study area (A) and topography of the study area (B).
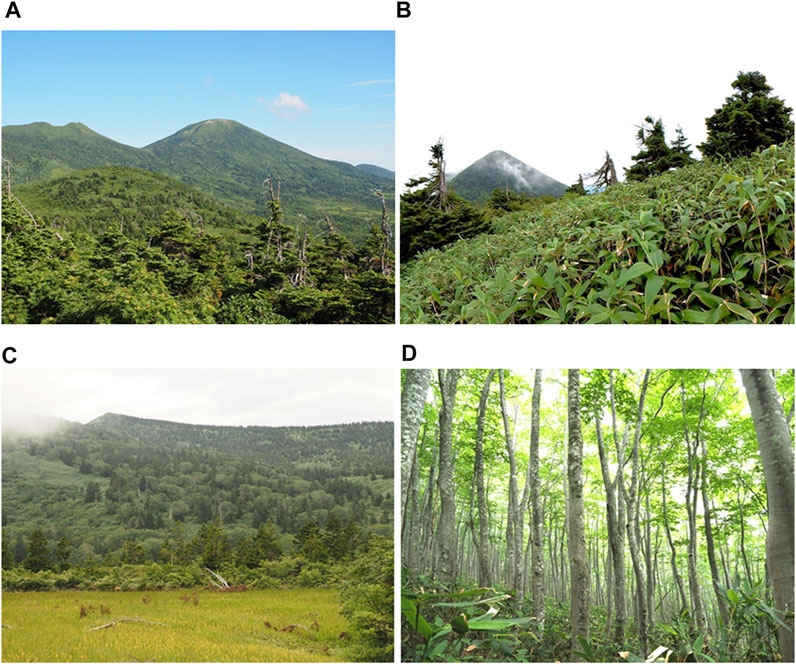
FIGURE 3. Views of the Hakkoda Mountains. (A) subalpine fir (Abies mariesii) forest; (B) sasa (Sasa kurilensis) grassland; (C) wetland and subalpine forest; and (D) regenerating beech (Fagus crenata) forest.
The region from approximately 1,000 m to the ridge is subalpine, with evergreen coniferous forests composed mainly of fir (A. mariesii). The nomenclature of the subalpine forests in this zone is confusing, and they are sometimes referred to as subarctic, subfrigid, or subboreal forests. They are referred to as subalpine forests because they best reflect their distribution in Japan (Sasse, 1998). In addition, alpine scrub communities grow in areas with strong winds and heavy snowfall and are dominated by Sorbus commixta, Acer tschonoskii, dwarf bamboo (mainly Sasa kurilensis). In contrast, cool-temperate deciduous broad-leaved forests dominated by beech (F. crenata) and oak (Quercus crispula var. crispula) developed below 1,000 m. Horse chestnuts (Aesculus turbinate), Pterocarya rhoifolia, and Cercidiphyllum japonicum are the main species found in the riparian forests that cover the valley’s sides.
The study area has an East Asian monsoon climate. The mean (1991–2020) annual temperature at Sukayu Hot spring Resort (890 m above sea level), located halfway up Mt. Odake, is 5.2°C (minimum −7.5°C in January, maximum 18.4°C in August), with annual precipitation of 1,832 mm and a maximum snow depth in January of 454 cm (Japan Meteorological Agency, 2023).
2.2 Digitization of vegetation map
The vegetation legends of a 1930 paper vegetation map were created based on the results of 412 survey sites. The legends in the map were mapped onto topographic maps at a scale of 1:50,000 based on vegetation units defined by physiognomy, which is defined by the dominant tree species and plants growing in the forest. We accurately scanned a 1930 paper vegetation map at 600 dpi, georeferenced it with latitudinal and longitudinal coordinates, and converted it into an ESRI shapefile format that can be read in GIS (Supplementary Figure S1). After scanning, all vegetation legends were accurately traced and polygonized to determine the area of each polygon. The map was projected using the UTM 54 coordinate system. Next, a 1:25,000 scale vegetation map was obtained from the Biodiversity Center of Japan (2010), and the same study area as the 1930 vegetation map was established. This made it possible to overlay old and new vegetation maps in GIS and detect changes in vegetation and land use over the past 80 years in the Hakkoda Mountains. Analyses were performed using R 4.1.2 software (R Core Team, 2021) using the raster sf package. The 1930 vegetation map in shapefile format was converted to 10 m grid cell data using a Digital Elevation Model based on Fundamental Geospatial Data (FGD) provided by GSI. The total number of grid cells for each vegetation type was used to calculate the area.
2.3 Unification of the vegetation legend
To compare vegetation changes, it was necessary to unify the legends of the 1930 and 2010 vegetation maps. This was because the authors of the old vegetation map used a different vegetation classification from that used in the current vegetation map (Supplementary Table S1). Therefore, we compared the legend of the 1930 vegetation map with that of the 2010 vegetation map and integrated them. We referred to the species composition of each legend in the report created by the Vegetation Survey Section of the Aomori Forestry Bureau in the 1930s (Supplementary Table S2) and the phytosociological study of Miyawaki (1987) when integrating the legends, taking into account not only the names of plant communities indicated by each legend, but also the types and composition of plant species in each legend. The Vegetation Survey Section of the Aomori Forestry Bureau presented a comprehensive report in the 1930s describing various vegetation types in the area. The report included information on the composition and distribution of major plant species (Shibata et al., 2023). Miyawaki (1987) described the vegetation type and species composition for the entire Tohoku region, and the legends are also used in a 1:25,000 vegetation map published in 2010 (Biodiversity Center of Japan, 2010).
2.4 Analysis of vegetation change
After converting the old and new vegetation maps into polygon data and integrating the legends, an overlay of the maps enabled the detection of changes in vegetation from the past to the present. This study identified the location and extent of (1) areas of vegetation change and (2) areas of no change. The nomenclature followed that of Yonekura and Kajita (2003).
3 Results
3.1 Overview of the vegetation in 1930 and 2010
After comparing the 1930 vegetation map of the study area with that of 2010, the vegetation was classified into 21 types (Table 1; Figures 4–6). Based on the area calculations for each integrated legend in GIS, the top five occupied areas in 1930 were deciduous oak forests (27.37%, represented by Q. crispula var. crispula), beech forest (26.03%, F. crenata), subalpine fir forest (16.86%, A. mariesii), riparian forest (11.06%, A. turbinate and Pterocarya rhoifolia), and birch forest (0.91%, Betula ermanii). These five vegetation types account for 82.23% of the study area.
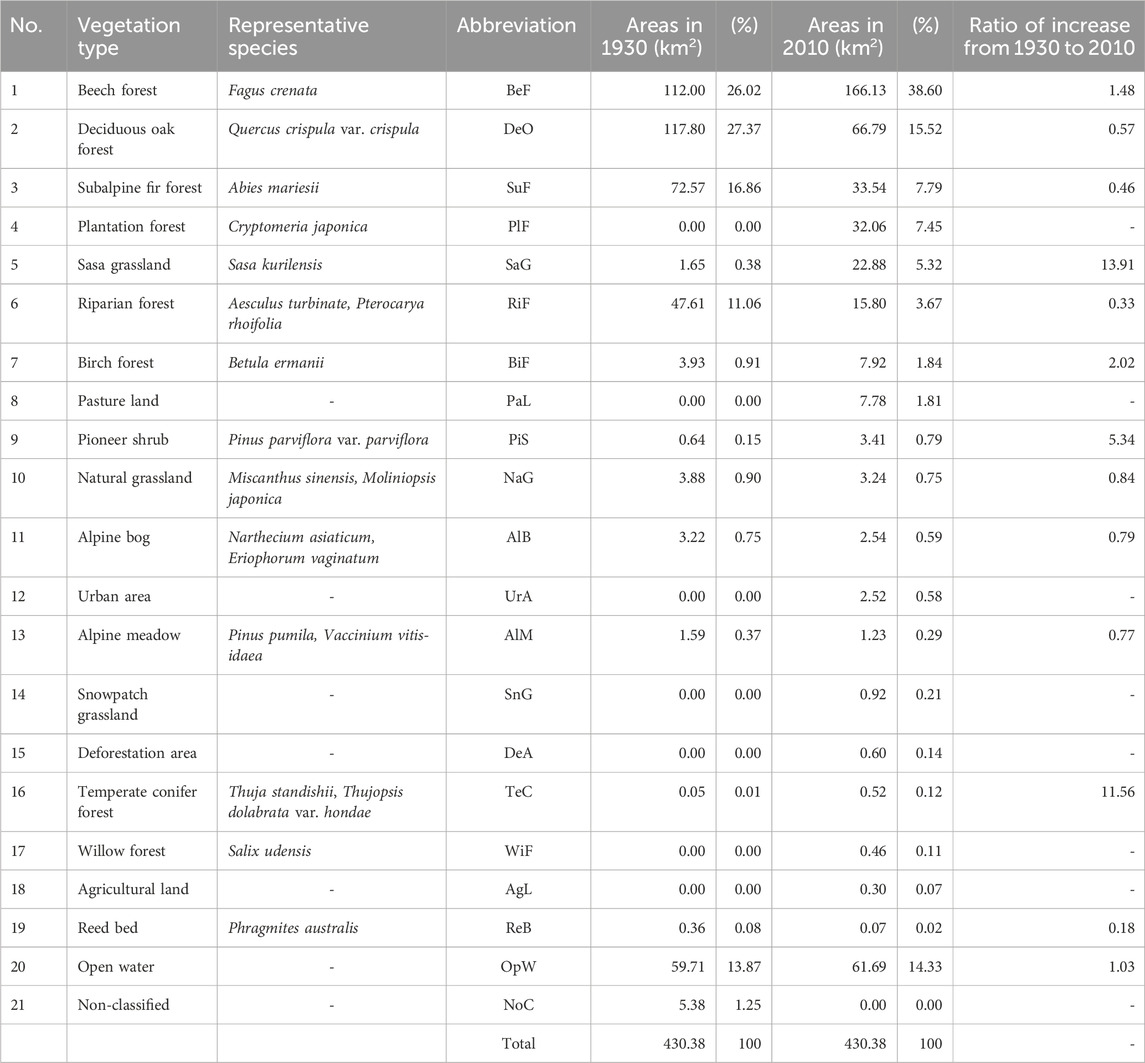
TABLE 1. Occupied area (km2) of the vegetation and its percentage (%) for the period (1930, 2010) in the Hakkoda Mountains.
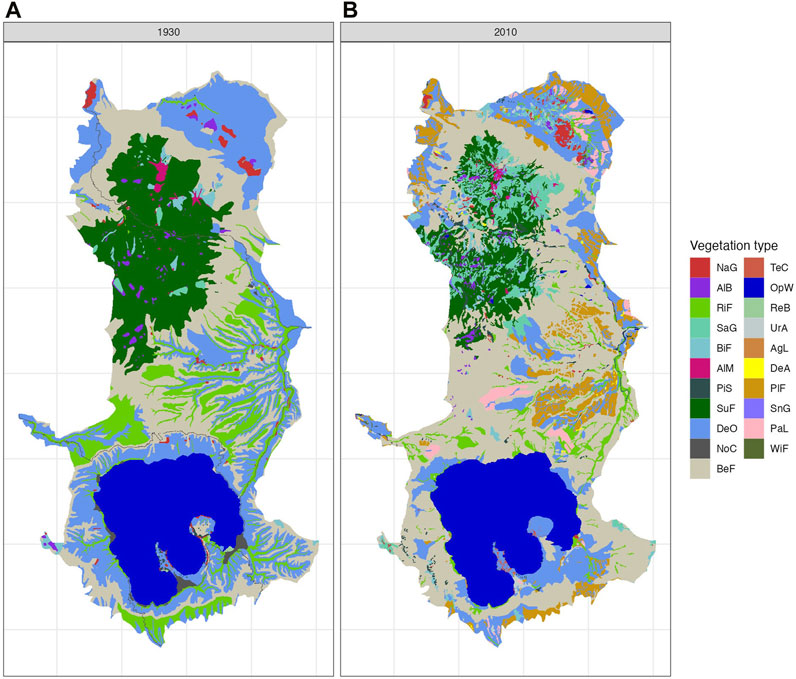
FIGURE 4. Vegetation map based on 21 uniform legends of the Hakkoda Mountains [(A) 1930; (B) 2010]. See Table 1 or Supplementary Table S1 for legend details.
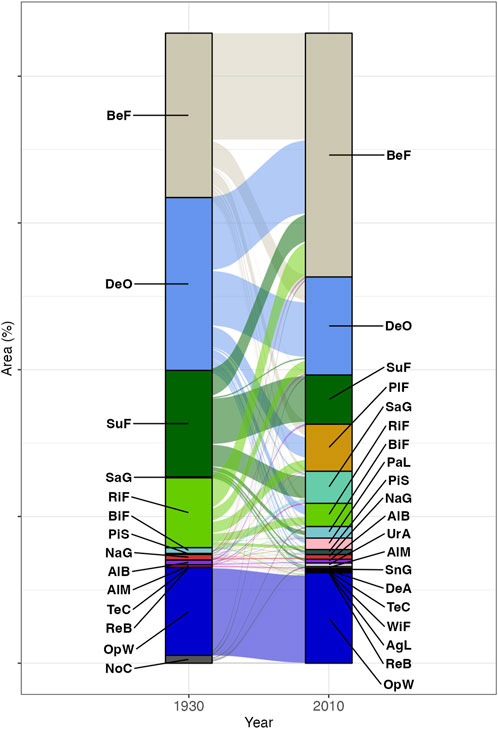
FIGURE 5. Changes in the percentage of area covered by vegetation in the Hakkoda Mountains based on 21 unified legends (left: 1930, right: 2010). See Table 1 for legend details.
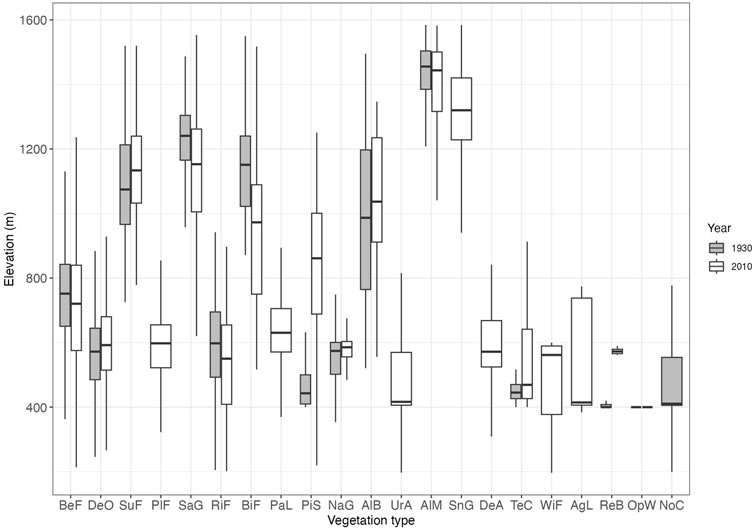
FIGURE 6. Elevation range for each of the 21 vegetation types in 1930 (gray) and 2010 (white). See Table 1 for legend details. Boxes for elevation range are shown with median, fifth, 25th, 75th, and 95th percentiles.
According to a 1:25,000 vegetation map published in 2010 (Biodiversity Center of Japan, 2010), of the 21 vegetation types, the top five occupied areas were beech forests (38.60%), deciduous oak forests (15.52%), subalpine fir forests (7.79%), plantation forests (7.45%, Cryptomeria japonica), and Sasa grassland (5.32%, S. kurilensis). These five vegetation types account for 74.68% of the study area. The results of past and current vegetation maps may differ for other types of vegetation with smaller areas because the former may have been created exclusively through field surveys, which would have limited the spatial resolution of those maps. Therefore, the following section focuses primarily on vegetation types with large areas.
3.2 Vegetation changes between 1930 and 2010
The above results were summarized and compared with the increases and decreases in each community, and the following trends in the ratio of increase were observed (Table 1 and Supplementary Table S3): The increased vegetation types in the last 80 years were as follows: beech forest (1.48-fold), plantation forest (nil to 7.45%), Sasa grassland (13.91-fold), birch forest (2.02-fold), pasture land (nil to 1.81%), and pioneer shrubs (Alnus spp. and Pinus spp., 5.34-fold). In contrast, the following vegetation types decreased: deciduous oak forest (0.57-fold), subalpine fir forest (0.46-fold), riparian forest (0.33-fold), natural grassland (0.84-fold), and alpine bog (0.79-fold).
3.3 Characteristic changes in vegetation
In the subalpine zone above 1,000 m, the area of subalpine fir forest decreased considerably (Figure 4; Table 1). In the lower elevation zone, beech forest increased (Figure 7B), whereas Sasa grassland increased in the middle and upper zones of the subalpine fir forest (Figure 7C).
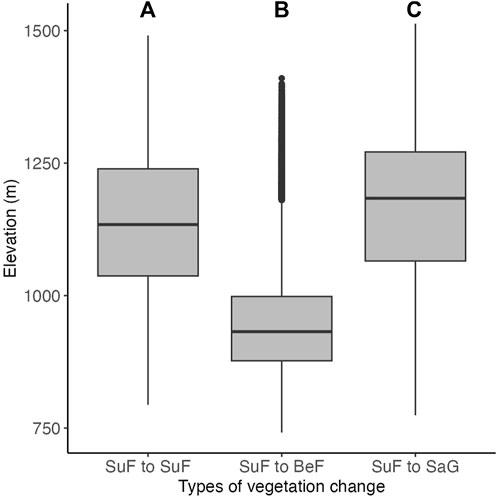
FIGURE 7. Comparison of elevation zones where vegetation change was detected (box-and-whisker plot). (A) elevation zone that remained unchanged as subalpine fir forest (SuF), (B) elevation zone that changed from subalpine fir forest to beech forest (BeF), (C) elevation zone that changed from subalpine fir forest to dwarf bamboo, Sasa grassland (SaG). See Table 1 for legend details.
In the cool temperate zone (below 600 m), the deciduous oak forest area decreased by almost half in 2010 (Table 1). Around Lake Towada, the deciduous oak forest changed to the beech forest, and in the northeastern plains of the study area, plantation forest and pastureland increased after the decline of the deciduous oak forest (Figures 4–6).
Riparian forests are communities that develop mainly along streams in cool, temperate climates. The study area covers a broad range, from stream banks to flats on river terraces in the Kise River Basin at relatively low elevations. However, large proportions have been converted to beech forests, deciduous oak forests, or plantation forests.
Plantation forests primarily replaced deciduous oak, riparian, and beech forests in terms of land use change. The majority of deciduous oak was converted to pastureland.
4 Discussion
In this study, a comparison of vegetation maps from 1930 to 2010 in the Hakkoda Mountains of northern Japan revealed long-term changes in vegetation. The 2010 vegetation map was more accurate than its 1930 counterpart despite differences in the resolution of the original map and the number of legends. Nevertheless, the necessary information was available to test our hypotheses.
4.1 Upward range shift of vegetation at the ecotone between cool temperate and subalpine forests
Our study suggests that the upward shift of the beech forest was characterized by an upper limit adjacent to the subalpine fir forest (Figures 4, 7). A possible reason for this is current climate change. The average temperature in Aomori City was 9.4°C in 1930, while it was 11.1°C in 2010: an increase of 1.7°C (Japan Meteorological Agency, 2023). If the rate of temperature increases of 1.7°C is converted to an altitude change using a lapse rate of 0.56°C/100 m, the altitude change is about 300 m. Beech (F. crenata) forms a zonal forest, and its nationwide distribution is mainly controlled by climate (Matsui et al., 2004). It can be assumed that the upper range limit of beech forests has shifted upwards over the last 80 years, competing with subalpine fir forests. Tanaka et al. (2014) examined aerial photographs taken over 30 years from 1967 to 2003 in the Hakkoda Mountains, reported a decrease in A. mariesii population density at the lower range limit of 1,000 m or less, and discussed the effects of climate change. Our results showed that beech forests increased in areas of subalpine fir forest decline below 1,000 m (Figure 6). One may speculate that such an upward shift in beech may be due to past logging of A. mariesii trees for timber. However, A. mariesii has not been considered suitable for timber production since the Edo era of the 17th century (Iwabuchi, 1999). In addition, no cut tree stumps were observed during our field observations in July 2021 and July and August 2022.
Alternatively, insect attacks could be the reason for the decrease in A. mariesii abundance. For example, the mass mortality of subalpine fir by the bark beetle (Polygraphus proximus Blandford) is possible (Chiba et al., 2020). The bark beetle is also distributed in the Hakkoda Mountains and flies when temperatures are above 15°C (Masuya, 2018; Chiba et al., 2020). Climate change may have increased the number of days with temperatures above 15°C, leading to increased insect activity. Considering the evidence discussed above, our first working hypothesis, “The upper limit of the cool temperate deciduous forest is expanding upward due to climate change” was likely supported.
However, the 1930s vegetation map may have missed the smaller patches of beech forest in the lower subalpine zone because the map was based only on a field vegetation survey, and the spatial resolution may have been coarser than the 2010 map. We were not able to determine the exact extent of small patches of beech forest at that time because no data showing the vegetation distribution and areas at that time were available other than the 1930s vegetation map shown in this study. Therefore, we conclude that future long-term observations are needed to fully demonstrate the replacement of subalpine fir forests by temperate beech forests.
4.2 Vegetation dynamics due to forest underutilization
In the vicinity of the villages around Lake Towada, at an elevation of less than 700 m, we found that oak forests, which have a high regeneration capacity due to the frequent use of firewood or charcoal by coppicing, were mainly converted to beech forests, which have a low regeneration capacity by coppicing (Tanimoto, 1993; Yagihashi et al., 2003). These vegetation dynamics were mainly due to vegetation succession caused by the cessation of traditional forest use for firewood and charcoal. These villages have been established around the lake for many centuries (Iwabuchi, 1999), and it is likely that the relatively open coppice forests dominated by oaks were maintained by regular felling or coppicing. Furthermore, grazing was practiced at the time (Yoshii et al., 1940a; Yoshii et al., 1940b; Iwabuchi, 1999). Grazing has often been reported to create gaps in high Sasa bamboo stands and promote beech regeneration (Nakashizuka and Numata, 1982; Ohchi et al., 2009). However, the designation of Hakkoda as Towada National Park in 1936 and the energy revolution after World War II reduced grazing and demand for firewood and charcoal. As a result, the forest type has changed to tall, closed forests dominated by beech, which is more shade-tolerant than oak and is potentially a climax species in the region (Matsui et al., 2018). Furthermore, disturbances resulting in the replacement of stands may have allowed even-aged beech forests to regenerate following clear-cutting. Therefore, we suggest that the proposed second hypothesis, “Designation as a national park in 1936 led to reduced forestry and land use and expanded beech forests,” was likely supported. A similar vegetation change after the abandonment of coppicing has been reported in the Czech Republic and Eastern Europe, where the former deciduous oak-hornbeam forest was changed to lime, ash, and maple forests (Müllerová et al., 2015).
However, some parts of the study area experienced changes in land use, despite the fact that the area is within the national park. Typical examples are the Kise River basin in the central part of the study area and the Tashiro area in the northeastern part of the study area, which is close to the center of Aomori City (Figures 2, 4). The Kise River Basin, which in 1930 was primarily covered by oak, beech, and riparian forests, was home to the majority of sugi cedar (Cryptomeria japonica) plantation forests (Figure 4A). The Kise River Basin is easily accessible from villages in the Yakeyama area at the confluence of the river. According to a 1:50,000 topographic map published by the Land Survey Department of the Dai Nippon Empire (1935), a forest horse railroad was established along the Kise River from Yakeyama at an elevation of 300 m above sea level, extending from 600 to 630 m above sea level to the southern slope of Mt. Norikuradake (1,449 m) in the southern part of the Hakkoda Mountains. River terraces in this area have been largely converted from natural forests to Sugi cedar plantations for economic purposes. In particular, regarding the riparian forests in the Kise River basin, it is believed that the narrow parts of the riparian forests along the Oirase River, which have been of great tourist value since ancient times, have remained untouched and are preserved to this day. However, the area around Tashirotai in the northeast of the study area is flat and easily accessible from Aomori City. Therefore, the demand for land use and development would have been high. As a result, many oak forests in the area were cleared and converted into pastures or Sugi cedar plantations. The study area has historically been a horse and cattle production area (Iwabuchi, 1999). It is thought that the goal of protecting and promoting local industry must have been behind the permission to convert the land from natural forest to pasture, even within the national park.
5 Conclusion
In this study, long-term vegetation changes over a period of approximately 80 years were quantitatively detected by digitizing a historical vegetation map, which contained analog data. In the upper part of the mountains, there has been an increase in the distribution of beech forests and a decrease in the distribution of coniferous forests, probably due to global warming. In lowland forests, there has been a shift from coppice forests for firewood and charcoal to beech forests, which are potential natural vegetation sources, probably due to a decrease in the frequency of human use. Various ecological studies have been conducted in the Hakkoda Mountains. Therefore, it is expected that the results of this study will be used by various researchers as important basic data, not only for understanding past vegetation changes and ecosystem conservation but also for climate change adaptation policies for the future.
Data availability statement
The original contributions presented in the study are included in the article/Supplementary Material, further inquiries can be directed to the corresponding author.
Author contributions
TS: Conceptualization, Data curation, Formal Analysis, Writing–original draft, Writing–review and editing. HK: Data curation, Investigation, Writing–review and editing. MO: Investigation, Methodology, Writing–review and editing. TSa: Investigation, Methodology, Writing–review and editing. HO: Formal Analysis, Investigation, Methodology, Writing–review and editing. KN: Data curation, Validation, Writing–review and editing. MS: Conceptualization, Data curation, Investigation, Project administration, Writing–review and editing. TM: Conceptualization, Funding acquisition, Investigation, Project administration, Writing–original draft.
Funding
The author(s) declare financial support was received for the research, authorship, and/or publication of this article. This research is part of the JSPS Grants-in-Aid for Scientific Research, KAKENHI, JP20H04380 and JP23K13986.
Acknowledgments
We thank reviewers for their helpful and valuable comments on the former version of our manuscript. The authors would like to thank Fuku Kimura, Mariko Oto, and Shimako Kawamura of the Forestry and Forest Products Research Institute for their assistance in cleaning and scanning the original materials, file management, and editorial assistance. We are grateful to them.
Conflict of interest
The authors declare that the research was conducted in the absence of any commercial or financial relationships that could be construed as a potential conflict of interest.
The handling editor TS declared a past co-authorship with the author HK.
Publisher’s note
All claims expressed in this article are solely those of the authors and do not necessarily represent those of their affiliated organizations, or those of the publisher, the editors and the reviewers. Any product that may be evaluated in this article, or claim that may be made by its manufacturer, is not guaranteed or endorsed by the publisher.
Supplementary material
The Supplementary Material for this article can be found online at: https://www.frontiersin.org/articles/10.3389/fenvs.2024.1306062/full#supplementary-material
References
Aiba, S., Namikawa, K., Matsui, T., Abo, E., Miyazaki, S., Tsuzuki, Y., et al. (2022). Stand dynamics over 15 years including an outlying population of Fagus crenata at the northern margin of its distribution range in Hokkaido, Japan. Ecol. Res., 1–13. doi:10.1111/1440-1703.12367
Biodiversity Center of Japan (2010). Existing vegetation map 1 : 25,000. (in Japanese) Available at: http://gis.biodic.go.jp/webgis/(Accessed February 21, 2022).
Boisvert-Marsh, L., Perie, C., and de Blois, S. (2019). Divergent responses to climate change and disturbance drive recruitment patterns underlying latitudinal shifts of tree species. J. Ecol. 107 (4), 1956–1969. doi:10.1111/1365-2745.13149
Chiba, S., Kawatsu, S., and Hayashida, M. (2020). Large-area mapping of the mass mortality and subsequent regeneration of Abies mariesii forests in the Zao Mountains in northern Japan. J. Jpn. For. Soc. 102, 108–114. (in Japanese with English abstract). doi:10.4005/jjfs.102.108
Chytrý, M., Chiarucci, A., Pärtel, M., Pillar, V. D., Bakker, J. P., Mucina, L., et al. (2019). Progress in vegetation science: trends over the past three decades and new horizons. J. Veg. Sci. 30, 1–4. doi:10.1111/jvs.12697
Faliński, J. B. (2003). Long-term studies on vegetation dynamics: some notes on concepts, fundamentals and conditions. Comm. Ecol. 4 (1), 107–113. doi:10.1556/comec.4.2003.1.15
Forestry Agency, Japan (2019). State of Japan’s forests and forest management -3rd country report of Japan to the Montreal process-. Tokyo: government report. Available at: https://www.maff.go.jp/e/policies/forestry/attach/pdf/index-8.pdf.
Fujimura, T. (1994). The changes of secondary forests due to the decline in farm forest type usage on the Tama hills. J. Jpn. Inst. Lands. Arch. 57 (5), 211–216. (in Japanese with English summary). doi:10.5632/jila1934.57.5_211
IPCC (2023). “Summary for policymakers,” in Climate change 2023: synthesis report. Contribution of working groups I, II and III to the sixth assessment report of the intergovernmental panel on climate change. Editors Lee, H.,, and Romero, J. (Geneva: IPCC). doi:10.59327/IPCC/AR6-9789291691647.001
Iwabuchi, T. (1999). Transition of Hakkoda - exploring the history of mountains and people through historical documents - Aomori city centennial commemoration. Aomori: Transition of Hakkoda Publication Committee. (In Japanese).
Japan Meteorological Agency (2023). Historical weather data search. (in Japanese)Available at: https://www.data.jma.go.jp/stats/etrn/index.php (Accessed August 26, 2023).
Kapfer, J., Hédl, R., Jurasinski, G., Kopecký, M., Schei, F. H., and Grytnes, J. A. (2017). Resurveying historical vegetation data – opportunities and challenges. Appl. Veg. Sci. 20, 164–171. doi:10.1111/avsc.12269
Kapfer, J., and Popova, K. (2019). Changes in subarctic vegetation after one century of land use and climate change. J. Veg. Sci. 32, e12854. doi:10.1111/jvs.12854
Kitamura, K., Matsui, T., Kobayashi, M., Saitou, H., Namikawa, K., and Tsuda, Y. (2015). Decline in gene diversity and strong genetic drift in the northward-expanding marginal populations of Fagus crenata. Tree Genet. Genom. 11, 36. doi:10.1007/s11295-015-0857-y
Land Survey Department of the Dai Nippon Empire (1935). Topographic map 1:50,000. Editor Hakkoda Mt. (in Japanese).
Masuya, Y. (2018). Outbreak of bark beetle (Polygraphus proximus). (in Japanese)Available at: https://www.ffpri.affrc.go.jp/thk/research/publication/another_organization/documents/vol_170_column.pdf (Accessed August 26, 2023).
Matsui, T., Nakao, K., Higa, M., Tsuyama, I., Kominami, Y., Yagihashi, T., et al. (2018). Potential impact of climate change on canopy tree species composition of cool-temperate forests in Japan using a multivariate classification tree model. Ecol. Res. 33, 289–302. doi:10.1007/s11284-018-1576-2
Matsui, T., Yagihashi, T., Nakaya, T., Tanaka, N., and Taoda, H. (2004). Climatic controls on distribution of Fagus crenata forests in Japan. J.Veg. Sci. 15, 57–66. doi:10.1111/j.1654-1103.2004.tb02237.x
Matsushita, K. (2015). Japanese forestation policies during the 20 Years following world war II, InTech eBooks. doi:10.5772/61268
Moret, P., Muriel, P., Jaramillo, R., and Dangles, O. (2019). Humboldt’s tableau physique revisited. PNAS 116 (26), 12889–12894. doi:10.1073/pnas.1904585116
Müllerová, J., Hédl, R., and Szabó, P. (2015). Coppice abandonment and its implications for species diversity in forest vegetation. For. Ecol. Manage. 343, 88–100. doi:10.1016/j.foreco.2015.02.003
Nakashizuka, T., and Numata, M. (1982). Regeneration process of climax beech forests II. Structure of forest under the influences of grazing. Jpn. J. Ecol. 2, 473–482. (In Japanese with English abstract). doi:10.18960/seitai.32.4_473
Niiyama, K., Shibata, M., Kurokawa, H., Matsui, T., Ohashi, H., and Sato, T. (2020). Discovering original research reports from government-owned natural forests in the early Showa era. Bull. FFPRI 19 (3), 275–324. (in Japanese with English abstract). Available at: https://www.ffpri.affrc.go.jp/pubs/bulletin/455/documents/455-5.pdf.
Ohchi, J., Katoh, M., and Tojo, A. (2009). Gap characteristic of cow path for beech regeneration on high sasa bamboo stands. Jpn. J. For. Plann. 42, 15–22. (In Japanese with English abstract). doi:10.20659/jjfp.42.1_15
Parmesan, C., Morecroft, M. D., Trisurat, Y., Adrian, R., Anshari, G. Z., Arneth, A., et al. (2022). “Terrestrial and freshwater ecosystems and their services,” in Climate change 2022: impacts, adaptation and vulnerability. Contribution of working group II to the sixth assessment report of the intergovernmental panel on climate change, H. O. Pörtner, D. C. Roberts, M. Tignor, E. S. Poloczanska, K. Mintenbeck, and A. Alegría, (Cambridge and New York: Cambridge University Press), 197–377. doi:10.1017/9781009325844.004
Pedrotti, F. (2013). “Types of vegetation maps,” in Plant and vegetation mapping. Geobotany studies (Berlin, Heidelberg: Springer). doi:10.1007/978-3-642-30235-0_6
R Core Team (2021). R: a language and environment for statistical computing. Vienna, Austria: R Foundation for Statistical Computing. Available at: https://www.R-project.org/.
Salinitro, M., Alessandrini, A., Zappi, A., and Tassoni, A. (2019). Impact of climate change and urban development on the flora of a southern European city: analysis of biodiversity change over a 120-year period. Sci. Rep. 9, 9464. doi:10.1038/s41598-019-46005-1
Settele, J., Scholes, R., Betts, R. A., Bunn, S., Leadley, P., Nepstad, D., et al. (2014). “Terrestrial and inland water systems,” in Climate change 2014: impacts, adaptation, vulnerability. Part A: global and sectoral aspects. contribution of working group II to the fifth assessment report of the IPCC. Editors C. B. Field, V. R. Barros, D. J. Dokken, K. J. Mach, M. D. Mastrandrea, T. E. Biliret al. (Cambridge: Cambridge University Press), 271–359.
Shibata, M., Kawamura, S., Shitara, T., Ohashi, H., Oguro, M., Kurokawa, H., et al. (2023). Digital archive of the national natural forest survey reports at the early showa era: scanning and modern Japanese translation of the towada-hakkoda national park vegetation survey reports. Bull. FFPRI 22 (4), 223–228. (in Japanese with English abstract).
Sittaro, F., Paquette, A., Messier, C., and Nock, C. A. (2017). Tree range expansion in eastern North America fails to keep pace with climate warming at northern range limits. Glob. Change Biol. 23, 3292–3301. doi:10.1111/gcb.13622
Tanaka, T., Shimazaki, M., Kurokawa, H., Hikosaka, K., and Nakashizuka, T. (2014). Impacts of climate change on forest dynamics of Abies mariesii (Pinaceae) in Hakkoda Mountains. Glob. Environ. Res. 19, 47–55. (In Japanese).
Tanimoto, T. (1993). Sprouting of beech (Fagus crenata Blume) in the regeneration of the beech forests and its environmental condition. Jpn. J. For. Environ. 35 (1), 211–216. (In Japanese with English abstract). doi:10.18922/jjfe.35.1_42
Tsuchihashi, Y., Ishii, N. I., Makishima, D., Oguro, M., Ohashi, H., Shibata, M., et al. (2023). Resurvey of historical moorland plots reveals a landscape-wide increase in the occurrence of woody and non-moorland species over 90 years. Plant Ecol. 224, 965–971. doi:10.1007/s11258-023-01351-z
Tsuji, S., and Hoshino, Y. (1992). Effects of the alteration of the management to the forest floor of the secondary forests of Quercus serrata on the species composition and the soil conditions. Jpn. J. Ecol. 42, 125–136. (In Japanese with English abstract). doi:10.18960/seitai.42.2_125
Yagihashi, T., Matsui, T., Nakaya, T., Taoda, H., and Tanaka, N. (2003). Classification of Fagus crenata forests and Quercus mongolica var. grosseserrata forests with regard to climatic conditions. Jpn. J. Ecol. 53, 85–94. (in Japanese with English abstract). doi:10.18960/seitai.53.2_85
Yonekura, K., and Kajita, T. (2003). Y-List. Available at: http://ylist.info/index.html (Accessed August 26, 2023).
Yoshii, Y., Yoshioka, K., and Iwata, E. (1940a). Ecological studies of pastoral areas (1) kayanohara pasture. Ecol. Rev. 6 (1), 25–48. (In Japanese).
Yoshii, Y., Yoshioka, K., and Iwata, E. (1940b). Ecological studies of pastoral areas (2) grazing land. Ecol. Rev. 6 (2), 125–145. (In Japanese).
Keywords: beech forest, climate change impact, cool temperate forest, deciduous oak forest, ecotone, forest underutilization, subarctic forest, vegetation monitoring
Citation: Shitara T, Kurokawa H, Oguro M, Sasaki T, Ohashi H, Niiyama K, Shibata M and Matsui T (2024) Long-term changes in vegetation and land use in mountainous areas with heavy snowfalls in northern Japan: an 80-year comparison of vegetation maps. Front. Environ. Sci. 12:1306062. doi: 10.3389/fenvs.2024.1306062
Received: 03 October 2023; Accepted: 27 February 2024;
Published: 13 March 2024.
Edited by:
Taku M. Saitoh, Gifu University, JapanReviewed by:
Satoshi Suzuki, The University of Tokyo, JapanSatheeshkumar Sekar, Department of Geology, Government arts college (Autonomous), India
Copyright © 2024 Shitara, Kurokawa, Oguro, Sasaki, Ohashi, Niiyama, Shibata and Matsui. This is an open-access article distributed under the terms of the Creative Commons Attribution License (CC BY). The use, distribution or reproduction in other forums is permitted, provided the original author(s) and the copyright owner(s) are credited and that the original publication in this journal is cited, in accordance with accepted academic practice. No use, distribution or reproduction is permitted which does not comply with these terms.
*Correspondence: Tetsuya Matsui, tematsui@affrc.go.jp