Recyclable, but not recycled—an indicator to quantify the environmental impacts of plastic waste disposal
 Venkateshwaran Venkatachalam
 Sebastian Spierling
 Hans-Josef Endres
- Institute of Plastics and Circular Economy, Leibniz University of Hannover, Garbsen, Germany
With an exponential increase in the production and consumption of plastic products over the last few years, the predominantly linear (take-make-dispose) economy of the plastic life cycle has captured global attention. Even though plastic products offer versatile benefits with their properties across different sectors, with a global recycling rate of less than 10%, it is challenging to reduce the pollution generated by plastic waste. Also, the loss of resources due to the uncontrolled disposal of plastic waste has been projected to cause long-term negative effects on the environment. To ensure a better circularity of the plastic flows across the world, it is essential to design plastic products that have an adequate infrastructure to recover and recycle the waste no matter where they are used. The polymer manufacturers and the plastics converters must account for the environmental impacts of the resources lost in the environment due to the lack of recycling infrastructure as a part of Extended Producer Responsibility. This study introduces an indicator that accounts for the loss of resources and proposes for a better methodology to quantify the environmental impacts of polymers and plastic products, based on their recyclability and the availability of recycling infrastructure to handle them. By integrating the loss of resources with the environmental impacts of specific polymers used in specific plastic products, the stakeholders across the value chain have the choice to select the polymers and products that are actually recycled, thereby reducing their environmental impacts and increasing the circularity.
1 Introduction
Plastics, being a ubiquitous material have become an indispensable part of our lives. In this era of globalization, it is difficult to track the complete value chain of plastics as each lifecycle phase (production, use, and recovery of the wastes) can take place in different regions (Ryberg et al., 2018; James, 2019). Owing to the increasingly negative effects of climate change and the loss of natural resources, the usage of plastics and disposal of plastic waste has come under critical focus (Hahladakis et al., 2018; Johansen et al., 2022; OECD, 2022). Despite most of the polymers being theoretically recyclable, the recovery of the plastic waste (out of these polymers) after use phase faces challenges like the lack of separate collection of plastic waste, the market for recyclates, mechanical properties of the recyclates to name a few (Hopewell et al., 2009; Vogt et al., 2021). To quantify the environmental performance of these products, manufacturers (refers to the polymer manufacturers and the plastic converters, who process these polymers into plastic products, from here on) conduct Life Cycle Assessment (LCA), an internationally standardized tool to calculate the potential environmental impacts of the product system across the lifecycle (ISO 14040:2021-02, 2021; ISO 14044:2021-02, 2020; Vlasopoulos et al., 2023). However, the manufacturers usually communicate the results of LCA or the carbon footprint of their materials to their stakeholders on a cradle-to-gate basis, i.e., from the extraction of crude oil to polymer manufacture and if necessary, processing of these polymers into different plastic products. They do not usually consider the use and end-of-life (EoL) phase of the plastic products due to the comparability and unavailability of data regarding the application, where they are used, and how they are disposed or recovered after use phase (Resalati et al., 2021; Miller, 2022).
When calculating the environmental impacts of different EoL options, there have been several methodological approaches developed over the years with some of them achieving the scientific consensus (Allacker et al., 2014; Allacker et al., 2017; Ekvall et al., 2020). These approaches distribute the environmental impacts and credits for recovering the wastes between the manufacturers and the recyclers. While academia is currently working on developing an impact indicator to quantify the plastic leakage caused by the disposal of plastic waste in the environment (Stefanini et al., 2021; Maga et al., 2022; Corella-Puertas et al., 2023), the manufacturers are seldom made accountable to the environmental impacts of the resources lost in the regions where their products are sold as ‘recyclable’ but are not recycled due to the lack of infrastructure. This can also be partly attributed to the mismanagement of plastic waste in the global south and if left unchecked, can have a harmful impact on the environment (Conversio, 2018; Neo et al., 2021).
This study, based on the already existing methodological approaches (Ekvall et al., 2020), proposes to include an indicator that quantifies the loss of plastic waste based on the availability of polymer-specific recycling infrastructure and application-specific quality of recyclates. This loss of resources is then added back to the environmental impacts of the polymers, i.e., if the polymer is used in a region where the recycling infrastructure is inadequate, the loss of resources that are not recovered are added to the environmental impacts of virgin polymer, which will then be used to calculate the total environmental impacts of the product across the whole lifecycle.
Finally, a case study is conducted, where the environmental impacts of the virgin polymer (with and without the loss of resources) are used in the Circular Footprint Formula (CFF) developed by the European Commission (European Commission, 2020; European Union for Environment, 2023) to calculate the environmental impacts of the polymer across the whole lifecycle.
2 Methodology
2.1 Plastic value chain
The value chain of plastic is complex, even for the stakeholders in it, as shown in Figure 1 - Polymer manufacturers (extraction of crude oil to produce monomers, which then undergo polymerisation to produce polymers like Polyethylene Terephthalate (PET)), who might not know where and how the polymers are used; Plastic converters (converting the polymers into plastic products through different processing techniques like extrusion), despite knowing the applications have little idea on how they are recovered in regions where they are disposed after use; Recyclers (conversion of the collected plastic waste into granules and flakes, which can then be reused), even if they have set up separate recycling streams to recover different plastic waste have challenges like contamination, quality, and market of the recyclates; Waste handlers, who, despite lacking infrastructure in some regions, are expected to manage the disposal of plastic waste. Thus, the manufacturers must consider these aspects when conducting an LCA of their material across the whole lifecycle and communicate the results that best reflect reality. They should not only communicate the amount of recyclates used in the production but also communicate the recycling rate of products in the regions where they are used.
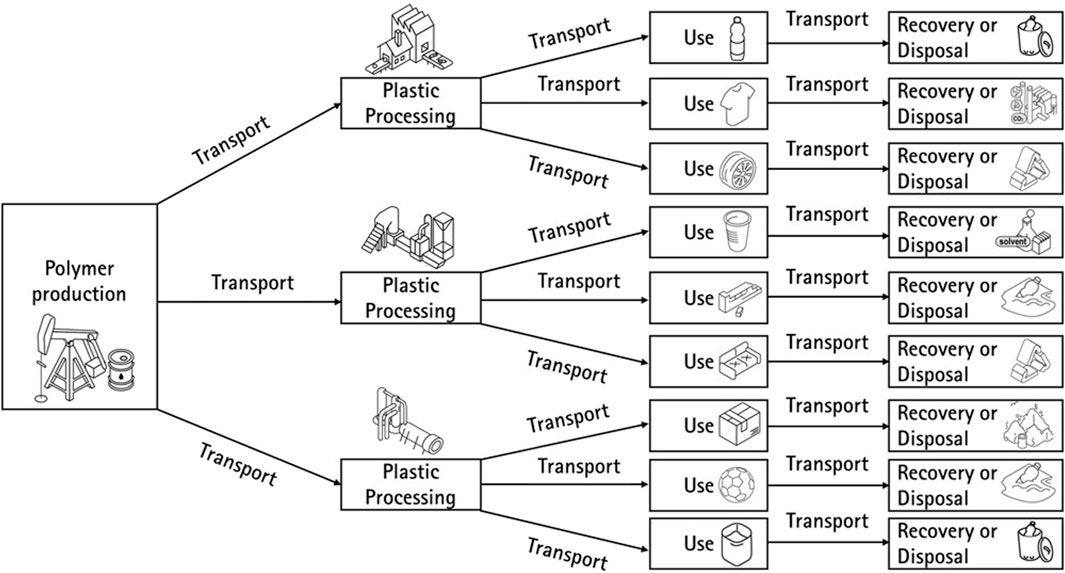
FIGURE 1. Value Chain of Plastic - Starting from the polymer production till the end of life with different processing techniques, applications, modes of transportation, and methods of recovery and disposal all taking place in different regions across the world.
2.2 LCA of the EoL options of plastic waste
When it comes to the EoL phase of the plastic products, once the plastic waste is collected and sorted, depending on the policy and availability of infrastructure, the plastic waste is usually mechanically recycled, and the rest of them being incinerated or disposed. Incineration, in some regions, takes place as controlled burning with energy recovery (electricity and heat) but in many regions done without energy recovery. In the case of disposal, the plastic waste is either disposed safely in a landfill and is sealed or dumped mindlessly in regions, where they lack stringent policies, adequate infrastructure and financial incentives (Evode et al., 2021). Incineration (despite energy recovery) and landfilling are never considered as EoL options that promote circularity (Ellen MacArthur Foundation, 2017) and are therefore considered as disposal options for plastic wastes in this study. Recycling, along with reuse, recovery, reduce are considered to be the drivers of the circular economy.
Recycling, in comparison to these EoL options, has a lesser Global Warming Potential (GWP) (an impact indicator that calculates the potential greenhouse effect caused by the use of resources and generation of emissions and wastes in a product system), only when the generated recyclates replace the use of virgin material in the production, also known as credits. Yet, when it comes to the LCA studies comparing different EoL options of plastic waste, landfilling results in less GWP in comparison to incineration (Demetrious et al., 2018; Hou et al., 2018; Nuraiti Tengku Izhar and Voon May 2020). This is due to the assumption that the plastic waste, once they are disposed in landfills will stay inert and they neither degrade nor emit methane or other greenhouse gases inside the landfills (Hauschild et al., 2008). But, if other impact indicators like Eutrophication Potential (EP) or Abiotic Depletion Potential (ADP) are interpreted, the results show landfill as the worst choice for an EoL option due to the possible effects of leachates and the loss of resources. However, the manufacturers, despite the robustness of LCA, are interested mostly in the value of GWP, also known as carbon footprint due to the comparability of results and increasing significance of decarbonization (Gentil et al., 2009; Bernardo et al., 2016; Anshassi et al., 2021). By focusing only on GWP when communicating the environmental impacts of their products across the lifecycle, manufacturers do not give the complete picture of the environmental performance of their materials. If they have manufactured products, that are recyclable after use, they do claim the credits for avoiding the production of virgin material as they might be recycled, which need not be true for all the applications and regions as there is no certainty to procure high-quality recyclates that can substitute virgin materials for the same applications.
2.3 Regional recycling infrastructure
If the loss of resources due to unrecovered wastes is quantified as environmental impacts and is allocated to the virgin material, it can be seen that the environmental impacts of the products and polymers would differ from region to region. This will, at some point stop the manufacturers with the ‘100% recyclable’ claims and work on their value chain to reduce their own environmental impacts, which also includes the loss of resources by not recycling them. Regional Recycling Infrastructure (RRI) quantifies the recycling rate of plastic waste according to the polymer type. Generally, recycling rates of the wastes are classified based on material types like paper, glass, and plastics or on sectors like packaging, automotive, and so forth. To calculate RRI, it is important to collect the recycling rates of plastic waste according to their applications, polymer types and sectors. By quantifying the recycling rate of different polymers in regions where they will be used, the polymer manufacturers can choose between sending their polymers to regions with better recycling infrastructure or investing in the regions where there is inadequate infrastructure as early as during the design phase. This is one of the Design for Recycling (DfR) strategies that must be followed by polymer manufacturers and plastic converters moving forward (Venkatachalam et al., 2022).
The loss of resources (LRn), which is region-specific, is the quantity of plastic waste of a certain polymer type that is not recycled in a particular region. It is the proportion of virgin materials that end up as waste due to the lack of recycling infrastructure. This is calculated based on RRI, where this polymer is used and the environmental impacts per kg (EV) of virgin polymer that was calculated and communicated by the polymer manufacturer. The environmental impacts here refer to the specific impact indicators like GWP, EP and ADP of the polymer per functional unit. Thus, the actual or the total environmental impacts, for example, refer to the actual GWP or total GWP of the polymer per functional unit respectively.
The LRn is then added to EV to account for the loss of resources (which is nothing but the virgin materials after the use phase) in the upstream process to give the actual environmental impacts of the virgin polymer per kg (EVRn). Based on the quantity of polymers sent to the particular region (MRn), the total environmental impacts of polymers sent to that region are then calculated (EVARn). The sum of the environmental impacts of polymers sent to different regions is then added to give the total environmental impacts (EVtot) of the polymer manufactured for a particular environmental impact indicator.
LRn - Loss of resources in a region due to disposal of plastic waste (kg CO2 eq./kg of polymer)
Rn - Regions, where the manufactured polymers are used for different applications.
RRI - Regional Recycling Infrastructure, recycling rate of wastes of a polymer type in a region.
EV - Environmental impacts of virgin polymers (kg CO2 eq./kg of polymer)
EVRn - Environmental impacts of virgin polymers including the loss of resources (kg CO2 eq./kg of polymer)
EVARn - Total environmental impacts of virgin polymers sent to a region (kg CO2 eq.)
MRn - Amount of polymers sent to a region to convert them into plastic products (kg)
EVtot - Total environmental impacts of the polymers manufactured (kg CO2 eq.)
The unit of the environmental impacts (EV, EVRn, EVARn, and EVtot) depends on the type of impact indicator and the choice of impact assessment method, manufacturers choose when they conduct LCA. In this study, the environmental impacts refer only to the GWP, which is measured across the different impact assessment methods in kg CO2 equivalents. If the manufacturers want to quantify the environmental impacts like acidification, eutrophication, or toxicity, they can use the corresponding environmental impact indicators in the above formula. Both EV and EVRn are then used in the Circular Footprint Formula (CFF).
2.4 Integration of loss of resources with the Circular Footprint Formula
To quantify the environmental credits and burdens that arise out of recycling, incinerating, and landfilling, the European Commission developed the Circular Footprint Formula (CFF) which also considers the use of secondary material (referred to as recyclates from here on), along with the market mechanisms and quality of recyclates used in the production (European Commission, 2020; European Union for Environment, 2023). The components of a CFF include a) Material component, which includes the environmental impacts of virgin material, share of recyclates in the primary production, their market allocation and quality, and recycling process at the EoL; b) Energy component, which includes the incineration share at the EoL, environmental impacts of incineration process, heating value of wastes and the efficiency of energy recovery during incineration; c) Disposal component, which includes the remaining share of the wastes that are disposed at the EoL and the environmental impacts of landfilling process.
Material component:
A- Allocation factor of burdens and credits between the supplier and the user of recyclates
QSin - Quality of the recyclates in the primary production.
QSout - Quality of the recyclate at the EoL.
QP - Quality of the virgin material.
R1 - Proportion of recyclate in the production.
R2 - Proportion of the material recycled at the EoL.
Erecycled - Environmental impacts of the recycling process (kg CO2 eq./kg polymer)
ErecEoL - Environmental impacts of the recycling process at the EoL (kg CO2 eq./kg polymer)
EV - Environmental impacts of the virgin material (kg CO2 eq./kg polymer)
EV* - Environmental impacts of virgin polymer to be substituted by recyclates (kg CO2 eq./kg polymer)
Energy component:
B- Allocation factor of the incineration process.
R3 - Proportion of the material in the product that is incinerated at the EoL.
EER - Environmental impacts of the incineration process (kg CO2 eq./kg polymer)
ESE,heat and ESE,elec - Environmental impacts of the substitution of heat and electricity from incineration (kg CO2 eq./kg polymer)
XER,heat and XER,elec - Efficiency of heat and energy recovery in the incineration process.
LHV - Lower heating value of the material in the product that is used for energy recovery (MJ/kg polymer)
Disposal component:
ED - Environmental impacts of the disposal of wastes at the EoL.
Finally, the sum of the three components along with the environmental impacts of transportation, and processing gives the total environmental impacts of the polymer across the whole lifecycle. The system boundaries of the product considered for this study are shown below in Figure 2.
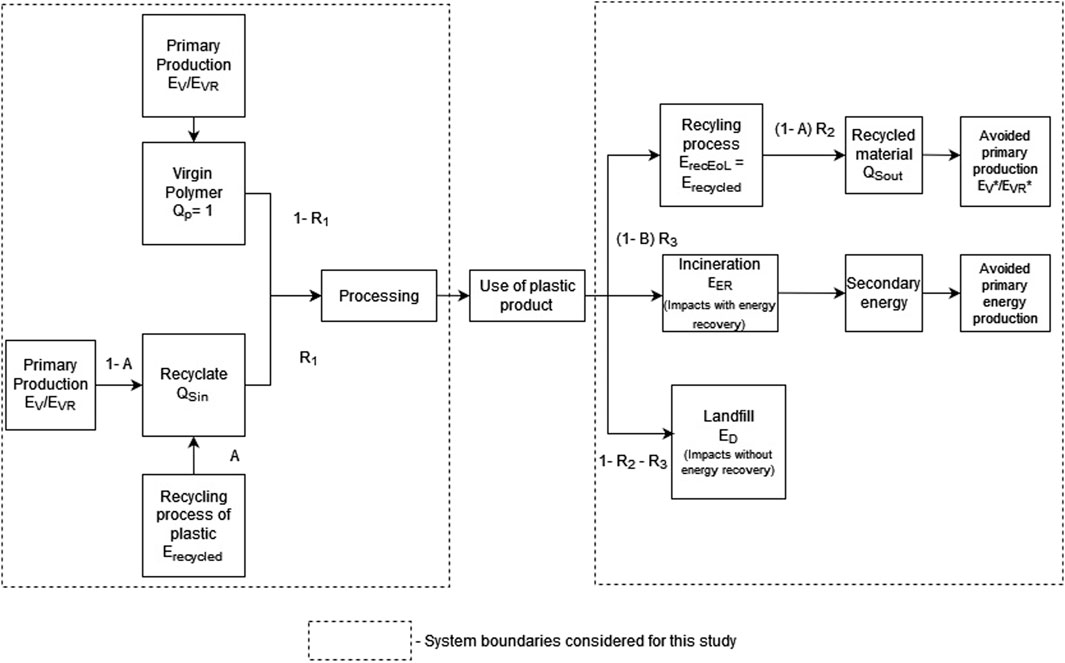
FIGURE 2. System boundaries considered for the case study to calculate the environmental impacts of a polymer from cradle (primary production of polymers) to grave (recovery and disposal of plastic waste) [Own figure, modified based on (European Commission, 2020)].
2.5 Assumptions for the case study
The environmental impacts of the virgin polymer are calculated based on the methodology explained in Section 2.3 and the assumptions to calculate the impacts on a cradle-to-grave (raw material extraction to the EoL phase) basis using CFF for the case study are as follows:
1) Environmental impacts of virgin polymers, processing, and other EoL phases along with the recycling rates of polymers and products assumed for this case study are fictive and are used only to show how the methodology quantifies the impacts
2) The use phase of the products along with their utility and lifetime are not considered but can be integrated in the future if necessary
3) Recycling rate refers to the amount of plastic waste that is not only collected and sorted but is also sent to processing plants to produce the recyclates
4) As the market factor for the plastic recyclates is region-specific and unavailable, the A factor in CFF is assumed to be 0.5 for this study (Hermansson et al., 2022)
5) Environmental impacts of the recycling process to produce recyclates are assumed to be the same as the impacts of the recycling process at the EoL (Erecycled = ErecycledEoL)
6) The quality of the recyclates used in the primary production is assumed to be the same as the quality of the recyclates produced from the recycling at the EoL (QSin = QSout)
7) Environmental impacts of the polymer in the primary production and the virgin polymers substituted by the recyclates are assumed to be the same (EV = EV*; EVRn = EVRn*)
8) All the environmental impacts of the product system are expressed per kg of polymer unless otherwise specified. Multiplying these impacts with the mass of polymers required to manufacture the product gives the corresponding impacts of the product across the lifecycle
9) Environmental impacts of the incineration process include the credits for the energy recovery, heating value, and the efficiency of the energy recovery
3 Results and discussion
3.1 Environmental impacts of virgin polymer production
By conducting a case study, the implications of adding the loss of resources with the environmental impacts of the virgin polymer can be better understood. In this case study, PET is chosen as the polymer, which is manufactured in Germany. The polymers are then used in the Netherlands, Belgium, and Germany for different applications. The GWP of virgin PET production is assumed to be 2.62 kg CO2 eq./kg of polymer. However, when including the loss of resources based on the recycling rate of PET in those regions, using the formula from Section 2.3, the environmental impacts of virgin polymers change in each region where they will be used as shown in Table 1 and are visualized in Supplementary Figure S1.
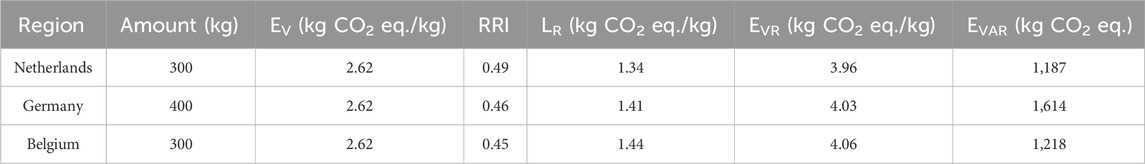
TABLE 1. Environmental impacts of the virgin polymer used in different regions using the proposed methodology of including the loss of resources based on the recycling rate of plastics in each region.
From the above table, it can be seen that to quantify the loss of resources with the environmental impacts in the proposed methodology, the manufacturers need to know the share of polymers sent to different regions and the average recycling rate of the polymers in that region. Collecting the polymer-specific recycling rate can be difficult given the fact that the recycling data on plastic waste are mostly application-specific (bottles, textiles, trays) or sector-specific (automotive, consumer goods, construction). However, if the manufacturers know the applications and polymers used in them, the polymer-specific recycling rate in different regions can be calculated. Using the proposed methodology, EVR of the polymers used in different regions is at least 51% more than the EV. The total environmental impact in the production of 1,000 kg of virgin polymers (EVtot) is 4,019 kg CO2 eq., in comparison to the conventional value of 2,620 kg CO2 eq., which is a 53% increase when the loss of PET due to lack of recycling from different regions is considered. The calculated impacts are used further across other lifecycle phases of the product system.
3.2 Environmental impacts of polymer used in different applications and recovered after use
For this case study, it was assumed that the PET polymer, which is used in Germany would be used for different applications like bottles, foil, and textiles. The applications are chosen in such a way that one of them (bottle) is assumed to have a high share of recyclates in the production with another with almost no recyclates used in the primary production (textile). Between these two applications, another application is chosen which has a small share of recyclates in the production (foil). Each application has its own recycling and disposal rate at the EoL along with the quality of recyclates produced. The application-specific parameters assumed for this case study are shown in Table 2. These parameters are used in the CFF along with region-specific EVR (4.03 kg CO2 eq./kg polymer) and EV (2.62 kg CO2 eq./kg polymer) from the above table to calculate the environmental impacts of the polymer across the lifecycle. This will be done in two scenarios:
a) Applying EVR only on the material component of the CFF (as the loss of resources through landfill and incineration are already accounted for in the environmental impacts of the virgin polymer)
b) Using EV on all three components of the CFF. The two values are then compared to understand how the environmental impacts of polymer are calculated with and without including the loss of resources.
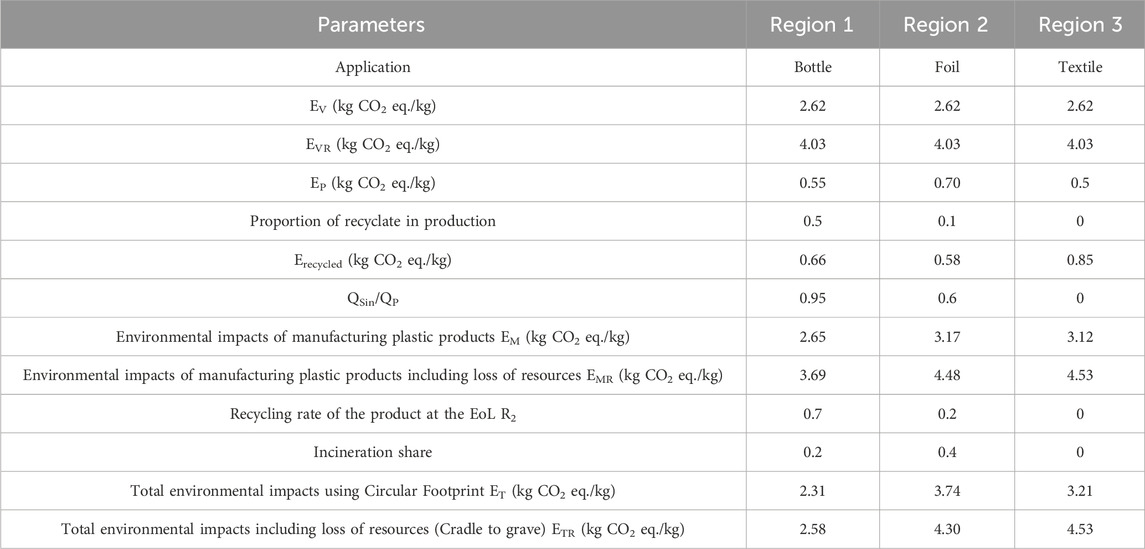
TABLE 2. Parameters used for calculating the environmental impacts of a polymer that is used in different applications from cradle to grave (raw material extraction to the disposal/recovery of the wastes after use).
The environmental impacts caused by the use of virgin polymer and recyclates in the production (first and second part of the material component of CFF) are added to the environmental impacts of processing EP, which gives the environmental impacts of 1 kg of polymer required to produce different products with and without the loss of resources (EM and EMR). When comparing EV and EVR with EM and EMR across three applications, it can be seen that the EM (2.65 kg CO2 eq./kg polymer) of the bottle despite using the recycled content in primary production has a slightly higher impact than EV (2.62 kg CO2 eq./kg polymer) which is due to the quality of recyclates and impacts due to processing the product and recyclates. But in the case of EMR of the bottle (3.69 kg CO2 eq./kg polymer), the use of recycled content in the production is rightly rewarded and has lesser impacts in comparison to its EVR (4.03 kg CO2 eq./kg polymer). In the case of foil and textile, due to the lesser to no share of recyclate and a lower quality of recyclate in foils, there is a 21% and 19% increase in EMR in comparison to EVR as against the 11% and 12% increase in EM for foil and textile respectively, in comparison to their EV. The cradle to gate (Production of the polymer to the processing of the plastic product) impacts of the different products with (EMR) and without (EM) the loss of resources from Table 2 is shown graphically in Supplementary Figure S2.
When extending the scenarios to the EoL phase to calculate the environmental impacts of the whole lifecycle, the recycling rate of bottle at the EoL is assumed to be higher than that of foil and textiles. From the table above, it can be seen that by increasing the recycling rate along with the quality of recyclates produced, there is only a 12% increase in the total impacts ETR in comparison to ET. But for textile, there is a 41% increase in ETR (4.53 kg CO2 eq./kg polymer) in comparison to ET (3.21 kg CO2 eq./kg polymer) due to the assumption that 100% of the textile after use phase are sent to the landfills. The cradle to grave or the total environmental impacts of the different products with (ETR) and without (ET) the loss of resources from Table 2 is shown graphically in Supplementary Figure S3.
Thus, the impacts calculated using this methodology increase the total impacts after each phase, if the resources are not properly recovered. However, if the recyclates are added to the primary production and if the resulting products are recycled after EoL, the credits reduce the total impacts of the product system.
4 Conclusion and outlook
A methodology was proposed to quantify the loss of resources as environmental impacts due to the inadequate recycling infrastructure to recover the plastic waste in different regions where they are used. The loss of resources and ultimately the environmental impacts of the virgin polymer can be subsequently reduced if the recyclates of higher quality are used along with the virgin polymers in the plastic processing and recycling of the finished products after use. However, this methodology results in higher environmental impacts for products that are not properly recovered after the use phase. As the stakeholders use the higher environmental impacts of the virgin polymer in their value chain, it becomes significant to look into the recycling infrastructure which will not only improve the environmental performance of the virgin polymer and products but also the whole product system.
The proposed methodology of including the loss of resources within the environmental impacts of plastic products could be misunderstood by the manufacturers at first glance, as it unnecessarily ‘punishes’ them despite their efforts to make their products recyclable. This methodology could be seen as one of the Extended Producer Responsibility (EPR) initiatives, but from an environmental point of view as the EPR is found to be effective in mitigating negative environmental impacts of the wastes (Ramasubramanian et al., 2023). Based on the results of the case study, it is highlighted that the extended methodology to quantify the loss of resources as environmental impacts help to understand the actual impacts of plastics that are not recovered and thereby closing the research gap of estimating the actual recyclability of the polymers and plastic products. This will also help manufacturers to invest more in the plastic recycling infrastructure, include more recyclates in their value chain, keep their products within the system, and most importantly improve the environmental performance of the product system as a part of decarbonization strategies. This methodology also strives for the same goal as most of the global policies and initiatives that aim to reduce plastic pollution. (Knoblauch and Mederake, 2021). In the future, this methodology will be developed further by integrating the region-specific, polymer-specific quality losses when the plastic wastes are recovered and recycled in that particular region. Also, the factors that affect the development of a regional recycling infrastructure will be identified and integrated within this methodology. This will be done initially on a regional level, which can then be extended to national and international levels.
In this study, mechanical recycling was considered as an EoL option promoting circularity. However, this same methodology can be extended to other EoL options like chemical recycling in the future. Increasing the circularity of plastic flows is possible only when the ecodesign/design for recycling strategies are applied right at the beginning of the design phase and this methodology can support the manufacturers to better understand their value chain at the earlier stage and pave the way to prevent unnecessary plastic waste in the environment after use.
Data availability statement
The original contributions presented in the study are included in the article/Supplementary Material, further inquiries can be directed to the corresponding author.
Author contributions
VV: Conceptualization, Formal Analysis, Methodology, Project administration, Visualization, Writing–original draft, Writing–review and editing. SS: Conceptualization, Formal Analysis, Methodology, Project administration, Supervision, Validation, Writing–review and editing. H-JE: Formal Analysis, Investigation, Project administration, Resources, Supervision, Validation, Writing–review and editing.
Funding
The author(s) declare financial support was received for the research, authorship, and/or publication of this article. The publication of this article was funded by the Open Access Fund of Leibniz Universität Hannover.
Conflict of interest
The authors declare that the research was conducted in the absence of any commercial or financial relationships that could be construed as a potential conflict of interest.
Publisher’s note
All claims expressed in this article are solely those of the authors and do not necessarily represent those of their affiliated organizations, or those of the publisher, the editors and the reviewers. Any product that may be evaluated in this article, or claim that may be made by its manufacturer, is not guaranteed or endorsed by the publisher.
Supplementary material
The Supplementary Material for this article can be found online at: https://www.frontiersin.org/articles/10.3389/fenvs.2024.1316530/full#supplementary-material
References
Allacker, K., Mathieux, F., Manfredi, S., Pelletier, N., Camillis, C. d., Ardente, F., et al. (2014). Allocation solutions for secondary material production and end of life recovery: proposals for product policy initiatives. Resour. Conservation Recycl. 88, 1–12. doi:10.1016/j.resconrec.2014.03.016
Allacker, K., Mathieux, F., Pennington, D., and Pant, R. (2017). The search for an appropriate end-of-life formula for the purpose of the European Commission Environmental Footprint initiative. Int. J. Life Cycle Assess. 22, 1441–1458. doi:10.1007/s11367-016-1244-0
Anshassi, M., Sackles, H., and Townsend, T. G. (2021). A review of LCA assumptions impacting whether landfilling or incineration results in less greenhouse gas emissions. Resour. Conservation Recycl. 174, 105810. doi:10.1016/j.resconrec.2021.105810
Bernardo, C. A., Simões, C. L., and Pinto, L. M. C. (2016). “Environmental and economic life cycle analysis of plastic waste management options. A review,” in PROCEEDINGS OF THE REGIONAL CONFERENCE GRAZ 2015 – POLYMER PROCESSING SOCIETY PPS, October 2016. doi:10.1063/1.4965581
Conversio (2018). Global plastics flow. Available at: https://www.bkv-gmbh.de/studien/studie-global-plastics-flow-2018-conversio.html (Accessed October 10, 2023).
Corella-Puertas, E., Hajjar, C., Lavoie, J., and Boulay, A.-M. (2023). MarILCA characterization factors for microplastic impacts in life cycle assessment: physical effects on biota from emissions to aquatic environments. J. Clean. Prod. 418, 138197. doi:10.1016/j.jclepro.2023.138197
Demetrious, A., Verghese, K., Stasinopoulos, P., and Crossin, E. (2018). Comparison of alternative methods for managing the residual of material recovery facilities using life cycle assessment. Resour. Conservation Recycl. 136, 33–45. doi:10.1016/j.resconrec.2018.03.024
Ekvall, T., Björklund, A., Sandin, G., and Jelse, K. (2020). Modeling recycling in life cycle assessment.
Ellen MacArthur Foundation (2017). The New Plastics Economy: rethinking the future of plastics and catalysing action.
European Commission (2020). “The Circular Footprint Formula (CFF) and its practical application. Training; Environmental Footprint (EF) transition phase,” https://wayback.archive-it.org/org-1495/20221006205351mp_/https://ec.europa.eu/environment/eussd/smgp/pdf/TrainingCFF%20Circular%20Footprint%20Formula10Nov2020_final_corr.pdf.
European Union for Environment (2023). The Circular Footprint Formula as a means to encourage recycling. Available at: https://www.eu4environment.org/news/circular-footprint-formula-or-how-to-calculate-the-emissions-associated-with-the-recycled-content/.
Evode, N., Qamar, S. A., Bilal, M., Barceló, D., and Iqbal, H. M. (2021). Plastic waste and its management strategies for environmental sustainability. Case Stud. Chem. Environ. Eng. 4, 100142. doi:10.1016/j.cscee.2021.100142
Gentil, E., Christensen, T. H., and Aoustin, E. (2009). Greenhouse gas accounting and waste management. Waste Manag. Res. J. Int. Solid Wastes Public Clean. Assoc. ISWA 27, 696–706. doi:10.1177/0734242X09346702
Hahladakis, J. N., Velis, C. A., Weber, R., Iacovidou, E., and Purnell, P. (2018). An overview of chemical additives present in plastics: migration, release, fate and environmental impact during their use, disposal and recycling. J. Hazard. Mater. 344, 179–199. doi:10.1016/j.jhazmat.2017.10.014
Hauschild, M., Olsen, S. I., Hansen, E., and Schmidt, A. (2008). Gone but not away—addressing the problem of long-term impacts from landfills in LCA. Int. J. Life Cycle Assess. 13, 547–554. doi:10.1007/s11367-008-0039-3
Hermansson, F., Ekvall, T., Janssen, M., and Svanström, M. (2022). Allocation in recycling of composites - the case of life cycle assessment of products from carbon fiber composites. Int. J. Life Cycle Assess. 27, 419–432. doi:10.1007/s11367-022-02039-8
Hopewell, J., Dvorak, R., and Kosior, E. (2009). Plastics recycling: challenges and opportunities. Philosophical Trans. R. Soc. Lond. Ser. B, Biol. Sci. 364, 2115–2126. doi:10.1098/rstb.2008.0311
Hou, P., Xu, Y., Taiebat, M., Lastoskie, C., Miller, S. A., and Xu, M. (2018). Life cycle assessment of end-of-life treatments for plastic film waste. J. Clean. Prod. 201, 1052–1060. doi:10.1016/j.jclepro.2018.07.278
ISO 14040:2021-02 (2021). Environmental management - life cycle assessment - principles and framework (ISO 14040:2006 + Amd 1:2020). Berlin: Beuth Verlag GmbH. doi:10.31030/3179655
ISO 14044:2021-02 (2020). Environmental management - life cycle assessment - requirements and guidelines (ISO 14044:2006 + amd 1:2017 + amd 2:2020). Berlin: Beuth Verlag GmbH. doi:10.31030/3179656
Johansen, M. R., Christensen, T. B., Ramos, T. M., and Syberg, K. (2022). A review of the plastic value chain from a circular economy perspective. J. Environ. Manag. 302, 113975. doi:10.1016/j.jenvman.2021.113975
Knoblauch, D., and Mederake, L. (2021). Government policies combatting plastic pollution. Curr. Opin. Toxicol. 28, 87–96. doi:10.1016/j.cotox.2021.10.003
Maga, D., Galafton, C., Blömer, J., Thonemann, N., Özdamar, A., and Bertling, J. (2022). Methodology to address potential impacts of plastic emissions in life cycle assessment. Int. J. Life Cycle Assess. 27, 469–491. doi:10.1007/s11367-022-02040-1
Miller, S. A. (2022). The capabilities and deficiencies of life cycle assessment to address the plastic problem. Front. Sustain. 3, 1007060. doi:10.3389/frsus.2022.1007060
Neo, E. R. K., Soo, G. C. Y., Tan, D. Z. L., Cady, K., Tong, K. T., and Low, J. S. C. (2021). Life cycle assessment of plastic waste end-of-life for India and Indonesia. Resour. Conservation Recycl. 174, 105774. doi:10.1016/j.resconrec.2021.105774
Nuraiti Tengku Izhar, T., and Voon May, Y. (2020). Life cycle analysis of plastic packaging. IOP Conf. Ser. Earth Environ. Sci. 616, 012036. doi:10.1088/1755-1315/616/1/012036
Ramasubramanian, B., Tan, J., Chellappan, V., and Ramakrishna, S. (2023). Recent advances in extended producer responsibility initiatives for plastic waste management in Germany and UK. Mater Circ. Econ. 5, 6. doi:10.1007/s42824-023-00076-8
Resalati, S., Okoroafor, T., Henshall, P., Simões, N., Gonçalves, M., and Alam, M. (2021). Comparative life cycle assessment of different vacuum insulation panel core materials using a cradle to gate approach. Build. Environ. 188, 107501. doi:10.1016/j.buildenv.2020.107501
Ryberg, M., Laurent, A., and Hauschild, M. (2018). Mapping of global plastics value chain and plastics losses to the environment (with a particular focus on marine environment).
Stefanini, R., Borghesi, G., Ronzano, A., and Vignali, G. (2021). Plastic or glass: a new environmental assessment with a marine litter indicator for the comparison of pasteurized milk bottles. Int. J. Life Cycle Assess. 26, 767–784. doi:10.1007/s11367-020-01804-x
Venkatachalam, V., Pohler, M., Spierling, S., Nickel, L., Barner, L., and Endres, H.-J. (2022). Design for recycling strategies based on the life cycle assessment and end of life options of plastics in a circular economy. Macro Chem. Phys. 223, 2200046. doi:10.1002/macp.202200046
Vlasopoulos, A., Malinauskaite, J., Żabnieńska-Góra, A., and Jouhara, H. (2023). Life cycle assessment of plastic waste and energy recovery. Energy 277, 127576. doi:10.1016/j.energy.2023.127576
Keywords: plastic waste, recycling, infrastructure, circular economy, LCA, ecodesign, sustainability, carbon footprint
Citation: Venkatachalam V, Spierling S and Endres H-J (2024) Recyclable, but not recycled—an indicator to quantify the environmental impacts of plastic waste disposal. Front. Environ. Sci. 12:1316530. doi: 10.3389/fenvs.2024.1316530
Received: 10 October 2023; Accepted: 09 January 2024;
Published: 23 January 2024.
Edited by:
Adriana Estokova, Technical University of Košice, SlovakiaReviewed by:
Zuzana Štefunková, Slovak University of Technology in Bratislava, SlovakiaEva Krídlová Burdová, Technical University of Košice, Slovakia
Copyright © 2024 Venkatachalam, Spierling and Endres. This is an open-access article distributed under the terms of the Creative Commons Attribution License (CC BY). The use, distribution or reproduction in other forums is permitted, provided the original author(s) and the copyright owner(s) are credited and that the original publication in this journal is cited, in accordance with accepted academic practice. No use, distribution or reproduction is permitted which does not comply with these terms.
*Correspondence: Venkateshwaran Venkatachalam, venkatachalam@ikk.uni-hannover.de