Optimizing the construction of ecological networks in Beijing using a morphological spatial pattern analysis—minimal cumulative resistance model
 Yueqi Na
 Zhujun Hong2
 - 1College of Landscape Architecture, Beijing University of Agriculture, Beijing, China
- 2College of Landscape Architecture, Beijing Forestry University, Beijing, China
- 3China Aero Geophysical Survey and Remote Sensing Center for Natural Resources, Beijing, China
- 4College of Culture and Development, Beijing University of Agriculture, Beijing, China
Introduction: With the increasing fragmentation of landscapes caused by rapid urbanisation, constructing ecological networks strengthen the connectivity between fragmented habitat patches. As the capital of China, Beijing has a rapid development, resulting in a serious landscape fragmentation, and needing an urgent demand for this study to improve the ecological network system.
Methods: In this study, we choose the elevation, slope, Normalized Difference Vegetation Index and land use data of Beijing in 2020 as the data use. Morphological spatial pattern analysis (MSPA) was used to identify ecological source areas for Beijing, Minimal cumulative resistance (MCR) and gravity models were used to construct ecological network, and stepping stones to improve it.
Results: The core area of Beijing had the highest proportion (96.17%) of all landscape types, forest accounting for 82.01% thereof. Ten core areas were identified as ecological source areas. Forty-five ecological corridors (8 major and 37 ordinary) were constructed. The ecological corridors are mainly concentrated in the middle and eastern regions where ecological mobility is limited. Constructing stepping stones would help uphold the region’s ecological service functions and ecosystem balance. Twenty-nine stepping stones and 32 ecological obstacles were used to create the optimised ecological network, consisting of 171.
Discussion: The results provide an optimised ecological model for Beijing and a reference constructing ecological spatial networks for the sustainable development of ecological environments in high-density urban areas.
1 Introduction
Accelerated urbanisation resulting from increasing population migration has led to the intensive utilisation of different land cover types, which have severely deteriorated ecosystems, presenting significant challenges for regional sustainable development (Fragkias, 2013; Chen et al., 2022). This process has intensified the fragmentation of the urban ecological landscape, weakened the effective connectivity between ecological patches, and affected the sustainability of the regional ecosystem (Lambert and Donihue, 2020; Liu W. et al., 2023; Du et al., 2023). This impedes the functioning of ecosystems, resulting in various ecological and environmental issues, including heat islands and waterlogging (Cheng et al., 2018), deteriorating air quality, and decreasing biodiversity (Wei et al., 2022). It has been demonstrated that mitigating ecological destruction by exclusively safeguarding species' habitats is difficult (Ahmed et al., 2020). Therefore, research on methods for reconciling urban expansion and ecological renewal is urgently needed.
Ecological networks represent a pattern of ecological security seamlessly linked by the flows of organisms into a spatially coherent system, which is consistent with the optimisation theory of landscape patterns (Opdam et al., 2006a). The construction of ecological networks has been considered a successful approach for attaining a sustainable landscape in fragmented urban areas (Fleury and Brown, 1997; Brose, 2010). An ecological network comprises ecological sources, nodes, and corridors (Bascompte, 2010; Cui et al., 2020). The construction of ecological networks can connect fragmented habitat patches, promote the migration and diffusion of species gene exchange among habitat patches, maintain the dynamic circulation of energy flow in the region, and strengthen the stability of the ecosystem (Ersoy et al., 2019). Accordingly, for various purposes, many methods have been studied, such as protecting biodiversity, optimising urban green spaces, assessing urban ecological risks, formulating sustainable land-use policies and maintaining regional ecosystem services (Vuilleumier and Prélaz-Droux, 2002; Opdam et al., 2006b; Kong et al., 2010; Baguette et al., 2013; Peng et al., 2019; Yang et al., 2020; Zhang et al., 2020).
Since the 1970s, studies on ecological networks have focused on model construction, ecosystem protection, and landscape connectivity analysis (LaPoint et al., 2013; Hong et al., 2017; Liang et al., 2018; Liccari et al., 2022). The development of ecological networks has become a widely adopted approach involving a three-step process of selecting sources, constructing ecological resistance surfaces, and extracting ecological networks (Zhai and Huang, 2022). Various research tools are constantly being developed, including the minimal cumulative resistance (MCR) model, morphological spatial pattern analysis (MSPA), ecosystem service value evaluation circuit theory, and network analysis.
The MSPA-MCR model received significant attention in earlier studies because of its practicability in creating ecological networks and offering scientific evidence to support the planning of ecosystem restoration and land remediation. The MSPA method uses mathematical morphology principles to determine the overall connection between patches. By employing a raster data land-use bivariate map to classify landscape structure with utmost accuracy, this technique identifies important species habitats based on scientific grounds (Huang X. et al., 2021; Yang et al., 2022). This methodology aimed to extract the core area for sustaining landscape connectivity. The MCR model, which comprehensively analyses the connectivity between various factors, is used to extract potential ecological corridors by constructing ecologically resistant surfaces (Ye et al., 2020; Zhang et al., 2021). The important corridors were extracted in combination with the gravity model and mapping theory (Tang et al., 2020). The integration of these two methods has the potential to enhance the efficacy of ecological constructing and optimising. However, the selection of ecological sources by this method usually can not consider the correlation of landscape fragments, because it focuses on the expression of spatial morphological attributes, the functional attributes such as patch habitat quality cannot be fully considered, and the identification of network centers is limited (Wang et al., 2022). Therefore, we introduce the connectivity index to screen ecological sources and gravity model to judge important corridors.
Methods used to optimise ecological networks include constructing ecological corridors and stepping stones (Dai et al., 2021; Luo et al., 2021). Ecological stepping-stones serve as corridors for species to move through natural landscapes (Saura et al., 2014). This is a key mechanism for connectivity in fragmented landscapes, providing a more practical and suitable habitat for urban ecologies (An et al., 2020a). It is necessary to identify and consider the stepping stones in the construction and optimisation of urban ecological networks.
Beijing, a historic city and the capital of China, is renowned for its political, economic, and cultural significance. Rapid expansion of cities continues to put immense pressure on the ecological environment of central urban areas, posing a high risk of geological disasters such as landscape fragmentation, water resource shortages, air pollution, water pollution, groundwater depletion, biodiversity loss, and soil erosion, thus restricting the sustainable development of Beijing (Berling-Wolff and Wu, 2004; Ma et al., 2005; Xian et al., 2016; Huang Q. et al., 2021). To reduce the ecological threat and to ensure sustainable development, the Beijing Municipal People’s Government has issued the “Beijing Urban Master Plan (2016–2035)”, which puts forward the goal of building a new pattern of urban development in Beijing. To implement green infrastructure, the Beijing government has implemented several policies, including the Ecological Remediation Guidance Area through the Beijing Recent Land Space Planning (2021–2025). However, the sustainability of land-use patterns in the Beijing region still faces significant challenges. It is necessary to construct an ecological network to maintain the stability of urban ecosystems in northern China.
We selected Beijing as a research area with the following goals: 1) identifying ecological landscape patterns; 2) screening ecological source areas; 3) constructing the ecological resistance surface; 4) constructing the ecological network based on MSPA and the MCR model; 5) optimizing the ecological network by adding stepping stone patches. The results of this study can be used as a guide in the construction of ecological networks, which may be useful for urban planning in Beijing and other similar cities worldwide (Jonas et al., 1991; Li et al., 2021).
2 Materials and methods
2.1 Study area
Beijing, situated in the north of China (39.4°–41.6° N, 115.7°–117.4° E), serves as the capital of China. The total area spans approximately 16,410.54 km2. It borders Liaodong Peninsula to the north and Shandong Peninsula to the south, and Tianjin to the east. Beijing has a total area of 16,410.54 km2. The city boasts a monsoon climate of medium latitudes with an average mean temperature of 21°C and an average mean annual precipitation of 461.4 mm. The terrain is elevated in the northwest and comparatively flat in the southeast. Beijing’s rivers flow from the west to the east through five major water systems. Vegetation consists of warm temperate deciduous broadleaf forests interspersed with temperate coniferous forests. The city’s forest cover is 44.8%, with a forest stock of 31.64 km3. In 2023, the number of species on the “Beijing Terrestrial Wildlife List (2023)" has increased to 608, mainly contain with birds. As China’s political, economic, and cultural center, Beijing is densely populated (Yang et al., 2011). Beijing’s urban resident population in 2020 was 21.893 million, with a GDP of 4.16 trillion yuan in 2022. The growth of population and the rapid expansion of the city subject Beijing to long-term water shortage, intensified pollutant discharge, decline of biodiversity, reduction of lakes and rivers, ecological degradation and other environmental problems (Biao et al., 2010; Wang et al., 2016; Xie et al., 2018).
2.2 Data sources and processing
The data mainly included Beijing administrative boundary data, 2020 land-use data, 2020 vegetation cover data, and digital elevation data.
All the data required for mapping were obtained from the following: land cover data with 30 m spatial resolution in 2020 through GlobeLand30 (http://www.globallandcover.com/), and the required data were cropped through the GIS mask; DEM data through the Geospatial Data Cloud site (https://www.gscloud.cn) to obtain the NDVI data (Liu and Lei, 2020), and the Beijing Municipal Vector Boundary Map was obtained and normalised using the Ecology Discipline Data Centre of the Chinese Academy of Sciences (http://www.nesdc.org.cn/). The basic production of the map was carried out and the data imported into ArcGIS10.8 (GIS platform developed by Esri Corporation in the United States) for UTM projection, with the coordinate system of WGS_1984 (Figure 1).
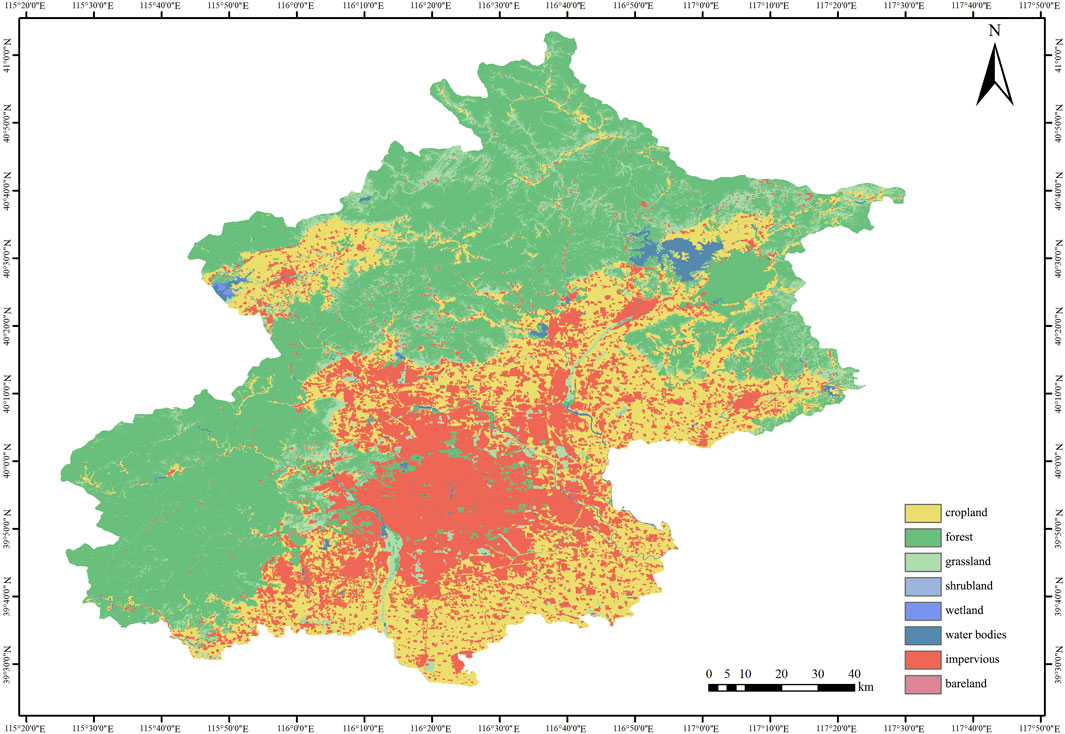
FIGURE 1. Land-cover map in Beijing.
A slope distribution map was produced using the ArcGIS10.8’s Spatial Analyst tool. Additionally, the geometric centre was computed as the ecological source point using ArcGIS10.8. The land cover data, in ArcGIS10.8 reclassification, extracted forest, grass, shrubland, wetland, and water bodies as foreground; arable land, man-made land surface, and bare land type were extracted as background. The assigned two-valued raster file was imported into the Guidos Toolbox software for MSPA analysis (Shi et al., 2021). The core area generally serves as the ecological source, which is important for protecting the stability of ecosystems and species diversity. The bridge area connected each source areas, served as the ecological corridor (An et al., 2020b).
2.3 Identification of ecological source areas
Raster images were recognised based on graphical principles. Land-use types are deciphered, which in turn generates landscape ecological patches at the image element level. In this way, landscape types with different ecological significance can be identified, and the selection of ecological sources can be made more scientific. Referring to previous research methods, forest, grass, shrubland, and wetland water bodies were used as the foreground, and cropland, bare land, and impervious areas were used as the background. All data were binarized and raster processed using Guido Toolbox 2.8 software to perform eight-domain image refinement analysis for MSPA analysis (Figure 2).
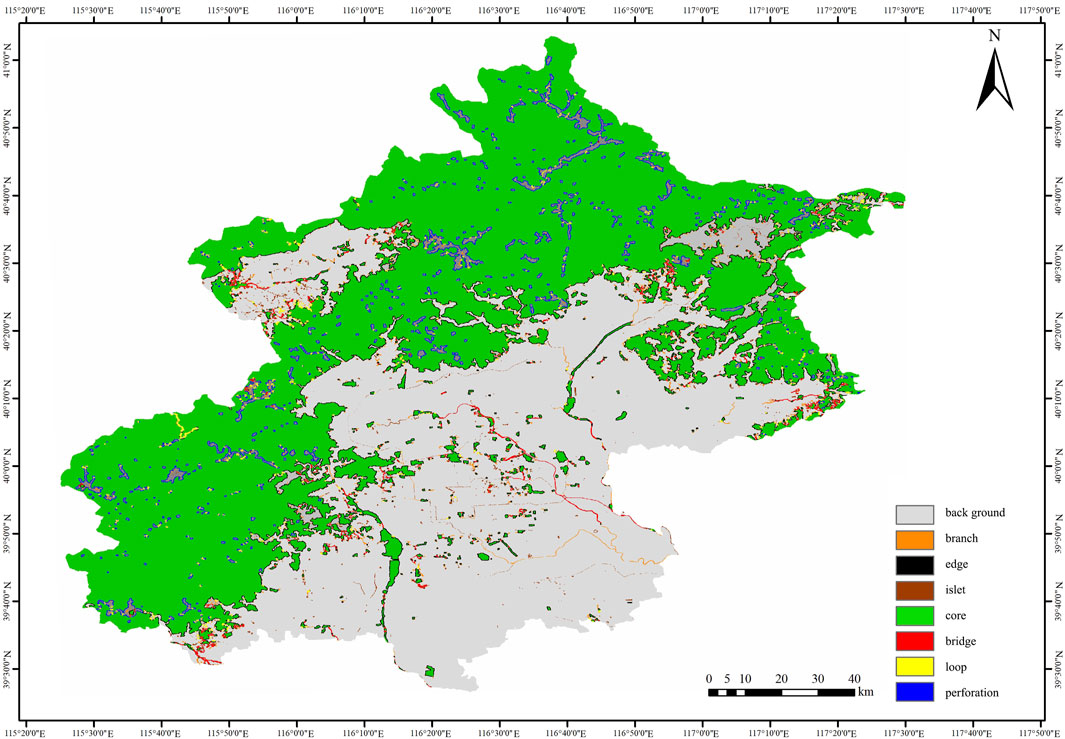
FIGURE 2. Spatial distribution of landscape patterns in Beijing.
2.4 Landscape connectivity index method to identify ecologically important source areas
Landscape connectivity is a measurement index that quantitatively describes the interconnections and continuity between landscapes (Xu et al., 2023). This is an important parameter for identifying and evaluating ecological source areas. Conefor version 2.6 was used to calculate the IIC, PC, and dPC to visualise the level of connectivity indices among different patches. The calculation is as follows:
where n is the number of core areas; nl refers to the connections between patches i and j; and are the areas of cores i and j; is the maximum likelihood of species dispersal from patch i to patch i; denotes the total value of the landscape; IIC denotes the index of overall connectivity of the patch; PC denotes the index of probable connectivity of a particular landscape, with the range of PC value domains ranging from 0 to 1. The larger the value of PC, means the better connection of the patch; dPC denotes the importance of a patch; and PCremove denotes the index of possible connectivity after patch deletion.
Based on previous research, a threshold value of 2000 m was established for the patch connectivity distance, and 0.5 for the probability of connectivity. The dPC was computed using the Conefor software to select the top ten core patches with higher dPC values for extracting vital ecological sources.
2.5 Ecological resistance surface construction
Biological communication is strongly influenced by resistance factors, natural conditions and human intervention. The MCR model is of the resistance that a species has to overcome in travelling from the originating source to the target source. In general, influencing factors are assigned corresponding resistance coefficients based on the actual situation. The MCR model generates the Least-cost Path (LCP), which is a corridor (Pelorosso et al., 2017). The MCR model is calculated as follows:
where f represents the positive correlation. is the number of raster units of patch i and j. is the resistance coefficients for landscape type i. Interconnections between species must overcome site resistance. The proximity of land-use type to the protection source correlates negatively with resistance to exchange and spread of species; elevation also has a certain impact. When the species migrate at a similar elevation, it will be easier to pass through, and vice versa. Slope is one of the influencing factors related to land-based environmental problems, such as landslides and soil erosion, and also impacts the exchange of species. For the NDVI, the higher the value, the lower the resistance. In summary, there were four influencing factors: land cover type, NDVI, elevation, and slope. Referring to relevant studies, weights were assigned and resistance orientations were determined (Table 1).
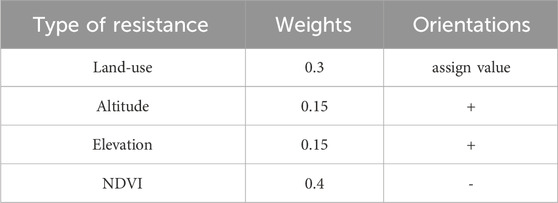
TABLE 1. Resistance setting table.
The different resistance factors were dimensionless and standardised for uniformity. The type of resistance involves several indicators, and owing to the different scales and magnitudes, the different indicator values need to be dimensionless before calculation using the following formula:
In particular, to indicate the varying degrees of land-cover resistance, we used a scale of 1–5, although it should be noted that this determination is subjective. Resistance to land cover is largely determined by predominant terrestrial animals, with a particular focus on rare and endangered bird species in Beijing. Forest land was assigned a score of 1 as it had higher vegetation coverage. Grasslands and shrublands ranked second, with scores of 2. Wetlands and croplands received a score of 3, water bodies and bare land received a score of 4, and impervious areas received a score of 5. Each resistance type was standardised using a raster calculator. Using the cost-distance tool in ArcMap, four-factor resistance surface data was then obtained for land-use type, elevation, slope, and NDVI. The resistance surfaces of the four resistance factors were superimposed based on the weights, and the superimposed formula was as follows:
A minimal cumulative resistance surface model was obtained using a superimposed formula. The starting source sites and target source selected using spatial analysis, distance analysis, and cost distance tools. The cost distance raster data and backlink data were thereby obtained. Finally, cost paths were generated to obtain the paths. Based on the above steps, the starting and destination sources were selected sequentially, and the data were overlaid to obtain the final corridor.
2.6 Evaluation and optimization of the ecological network
Gravity modelling can measure the intensity of interactions among different patches to evaluate the significance of potential ecological corridors. Corridors with stronger interaction forces are more important. The formula for calculating corridor strength is as follows:
where is the interaction between patches i and j, is the weight value of patches i and j, is the standardised value of the potential corridor resistance between patches i and j, is the resistance value of patches i and j, is the cumulative resistance value of patches i and j, and is the maximum resistance value.
Analysis the optimised ecological network is compared with the original ecological network, calculating the network closure index (α), network connectivity degree index (β), and the network connectivity rate index (γ) (Knaapen et al., 1992). Higher ecological network connectivity was indicated by higher values for these three indices. The equations are as follows:
where L is the number of corridors. V is the number of nodes.
3 Results
3.1 Landscape pattern analysis based on the morphological spatial pattern analysis (MSPA)
In the study area, the core area is 8,610.45 km2 accounts for the largest (96.17%) of the ecological source area. It is large and stable and distributed in the north and west. However, the core areas in the central and southern landscapes are fragmented. The bridge area is 6.23 km2, accounting for 2.24%, a relatively small proportion. As a corridor connecting patches in the ecological network, it appears near each core patch. It is distributed in the southeast, indicating that there are fewer primitive channels in the north and west. The edge area is 200.16 km2, accounting for 2.78%, the second largest proportion. Phenomenon of patch fragmentation has been discovered in Beijing, and it is necessary to increase the connectivity between patches. The islet area is 7.79 km2, accounting for 0.09%. It has a fragmented distribution, which serves as a temporary habitat for the flow of ecological elements. Ecological stepping stones can be planned to improve the connectivity between patches. In the remaining landscape types, the loop area is 3.68 km2, accounting for 0.04%; the perforation area is 103.67 km2, accounting for 1.16%; and the branch area is 21.13 km2, accounting for 0.24% (Table 2).
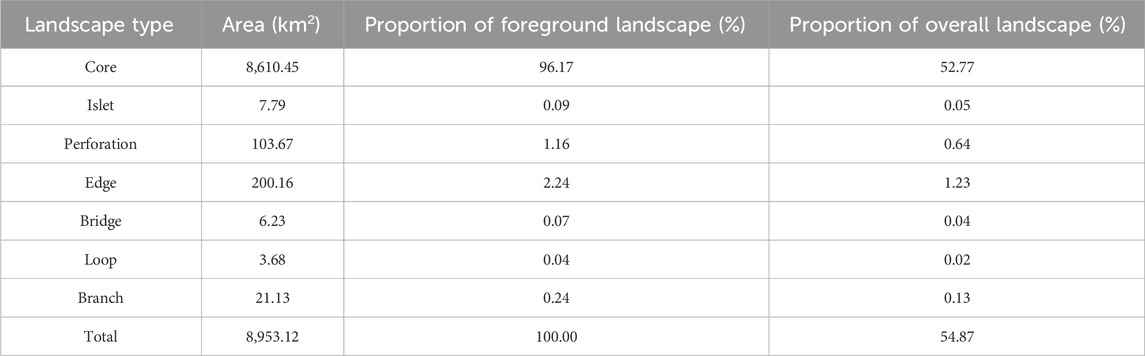
TABLE 2. Area of each landscape type based on the morphological spatial pattern analysis (MSPA).
3.2 Ecological source identification
After extracting a core area larger than 5 km2, ten core area patches with high dPC were selected as important ecological sources (Table 3). The chosen ecological sources were predominantly located in the Northern area. Patch 1, situated in the northern region of Beijing, has the largest area (7,505.36 km2) and a significantly higher dPC value than the other ecological sources, consisting of forest resources and reservoirs; patch 2 is the second, with an area of 454.24 km2, located in the eastern part of Beijing, as well as patches 3, 5, 7, 9, and 10; patches 4, 6, and 8 are located in the western part of the city, were small and fragmented. The non-selected ecological patches were too small to contribute to connectivity and most were scattered throughout Beijing’s parks and green spaces (Figure 3).
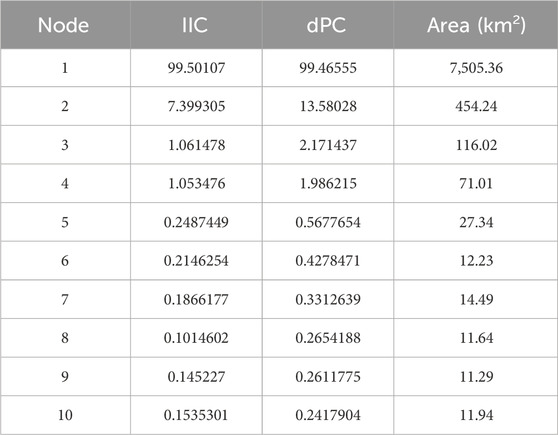
TABLE 3. Landscape connectivity index and area statistics.
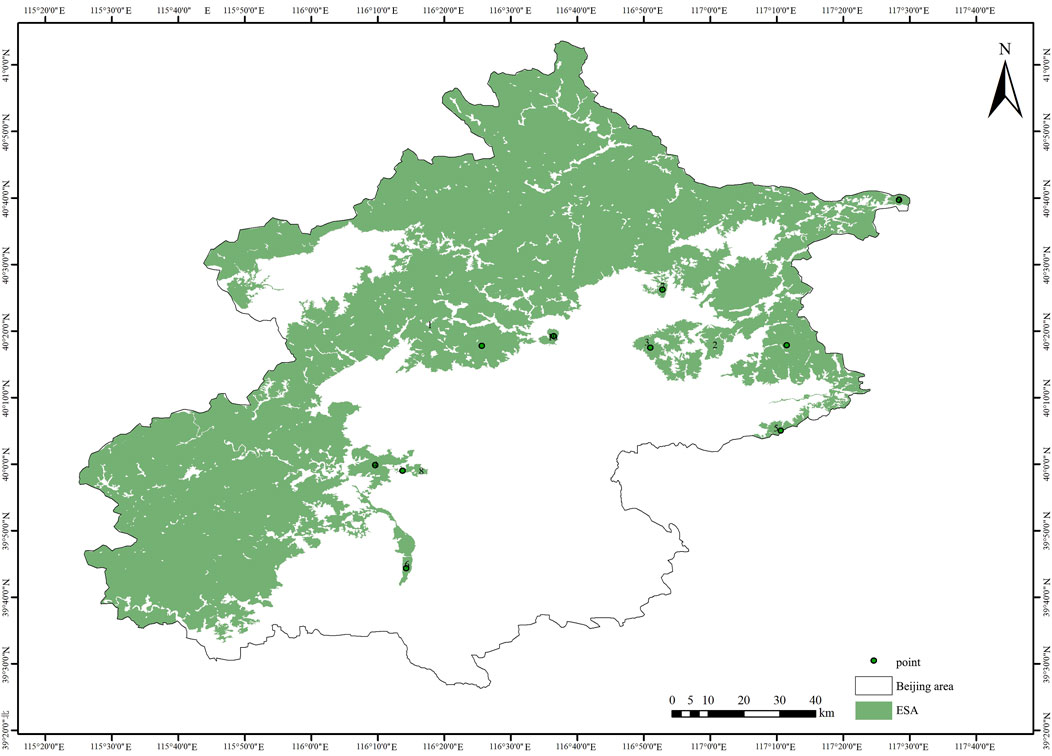
FIGURE 3. Distribution of ecological source areas (ESA) in Beijing.
3.3 Construction of the integrated ecological resistance surface
The proposed weighted-index method combines the weighting coefficients of each resistance layer and the corresponding resistance values to derive the integrated resistance surface (Figures 4A–D). The integrated resistance surface in the Beijing decreased from south to west and north. The northeast and northwest of Beijing exhibited the highest comprehensive resistance values, with a resistance value of about 0.74, distributed in water bodies, which impact the migration of small species between patches. Resistance tends to spread from central urban areas to the surrounding areas. Lowest resistance values were mainly in the forests and gently sloped regions, in the southern and eastern Beijing, with a resistance value of about 0.04 (Figure 5).
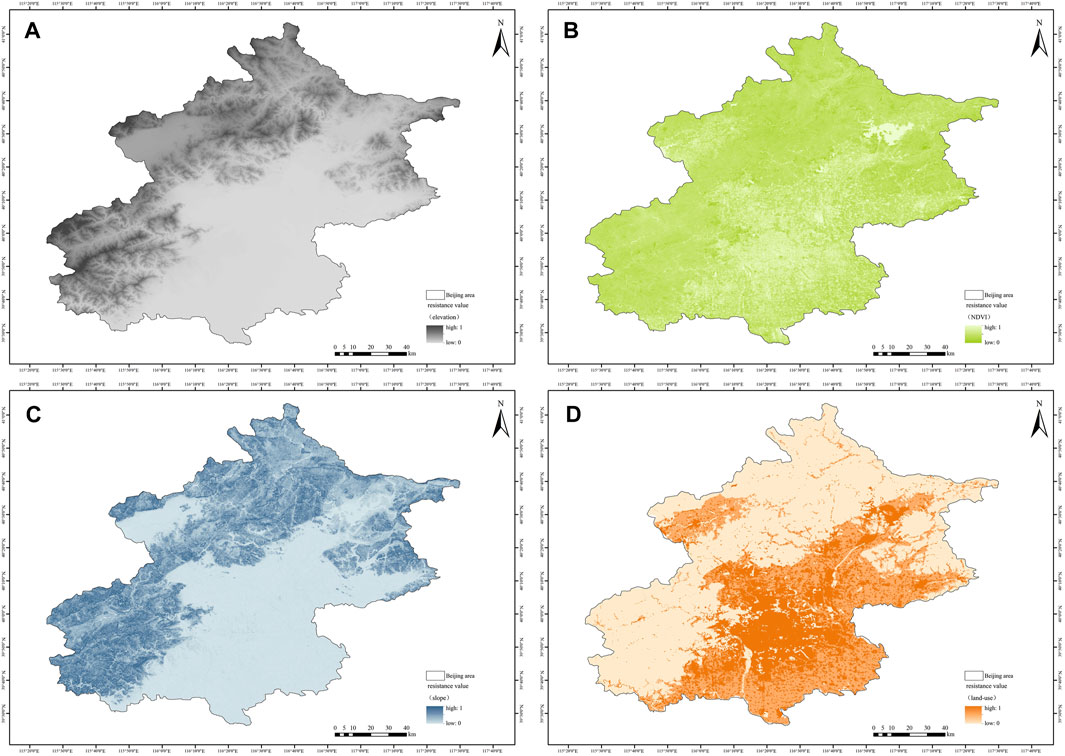
FIGURE 4. Resistance surface (A): Elevation, (B) NDVI (C) Slope (D) Land-use.
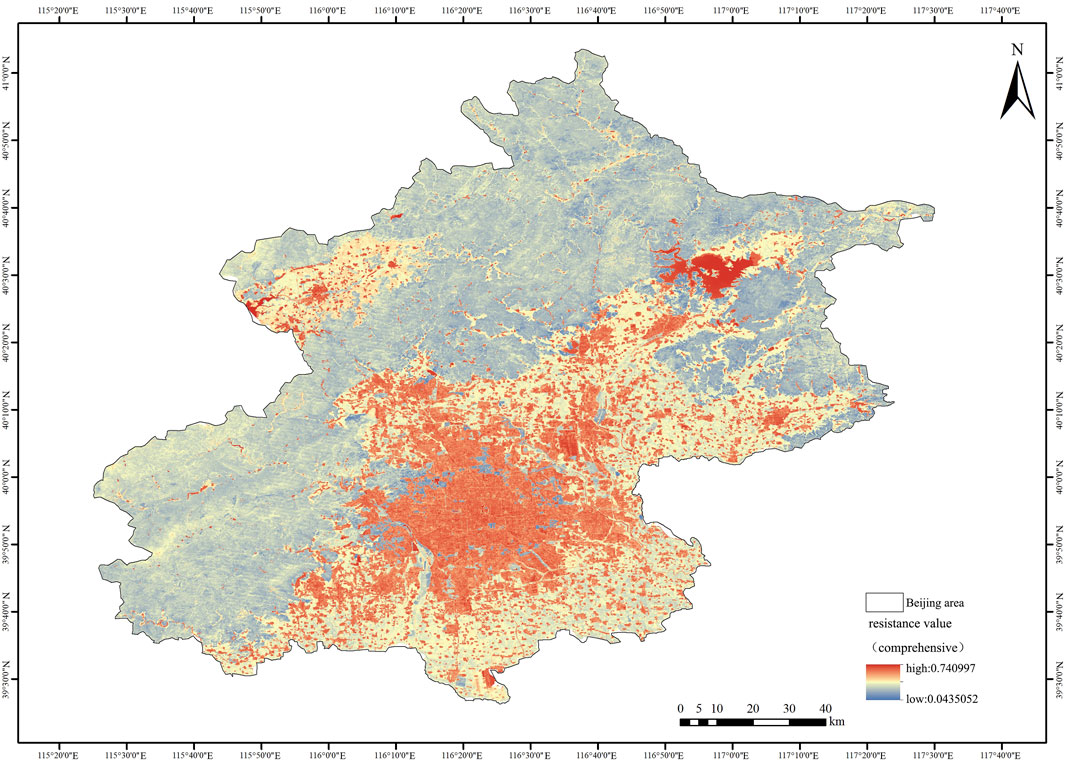
FIGURE 5. Integrated resistance surface.
3.4 Ecological corridor construction
Use the cost-distance analysis technology of ArcGS10.8, 45 ecological corridors were constructed, combined length of 980,308.64 m. According to the interaction matrix between the core areas, eight corridors with gravity values greater than 0.1 were classified as significant. There were a further thirty-seven general corridors. The most significant interaction force was between sources 4 and 8, with a value about 5.37. The force of interaction between patches 9 and 10 is smaller in comparison, with a value of 0.0026 (Table 4). The distribution corridors are dense in the east part of Beijing. Large ecological barriers remain in the central and south-eastern regions. The longest corridor crossing ecological barriers is the corridor connected patches 2 and 8 (Figure 6). As for the landscape proportion of the corridor, we selected 100 m as the ideal width of ecological corridors in Beijing. The forest located within this corridor covers 62.03 km2, representing 63.27% of the total corridors, while the water area covers 0.33 km2, equivalent to only 0.33% of the corridor’s total area. The ecological corridor through the impervious area was relatively small, 2.96 km2, accounting for 3.02% (Table 5).
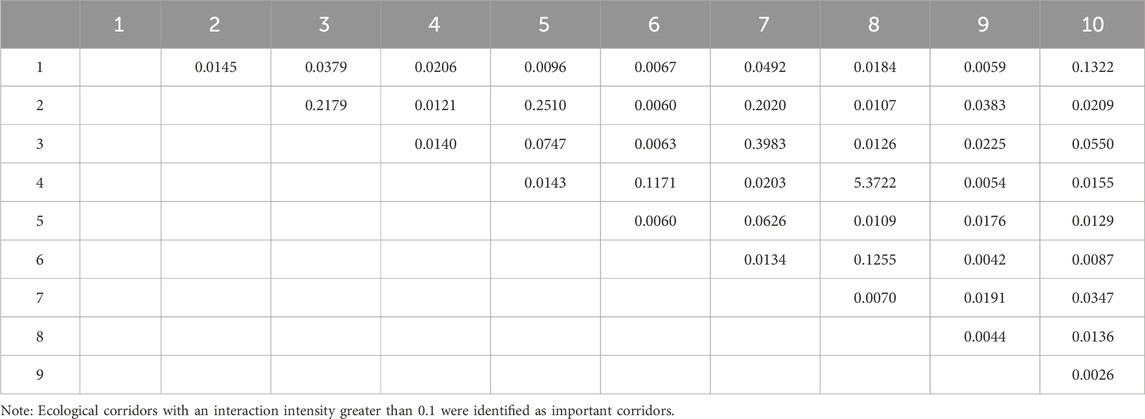
TABLE 4. Gravity values between ecological sources.
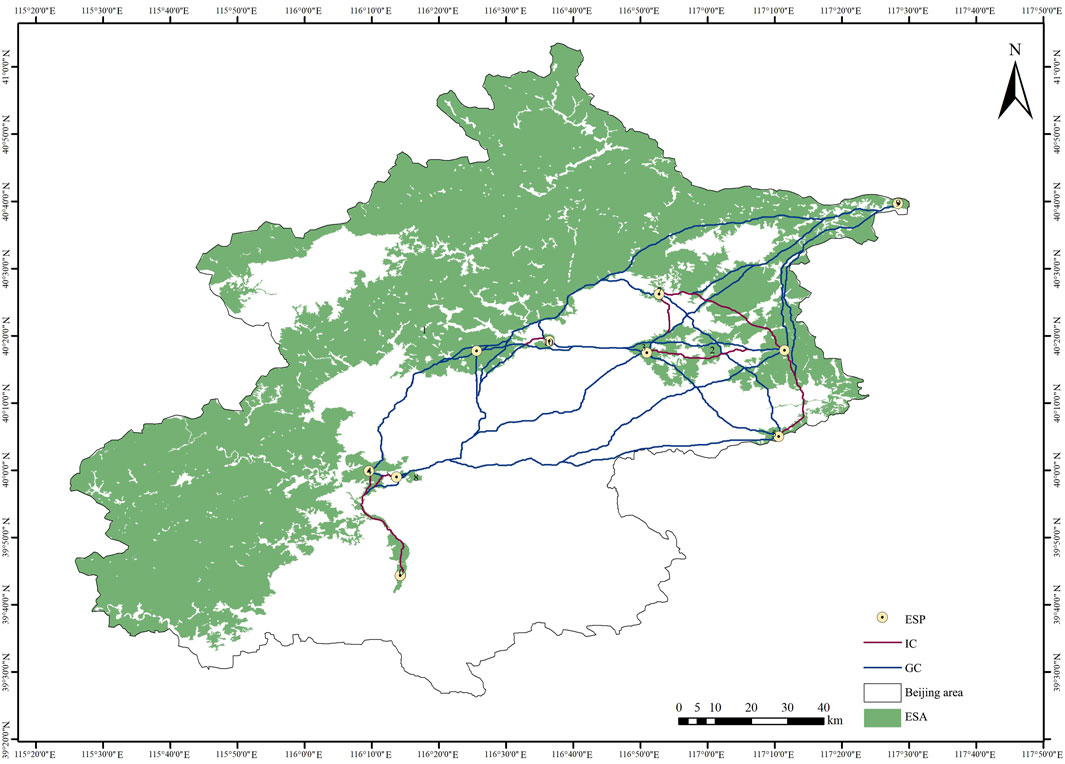
FIGURE 6. Distribution of ecological corridors in Beijing.

TABLE 5. Length of corridor per land-use type.
3.5 Optimisation of ecological corridors
In summary, 29 stepping stone patches were selected. Optimising the ecological network with stepping stones can provide temporary habitats for animals and improve network integrity. Ecological stepping stones are formed by the intersections of existing corridors. Thirty-two ecological breakpoint study areas were identified by analysing the resistance surfaces and actual conditions. According to the generated ecological stepping stones, a large patch located on the stepping stones is selected as the added source area, and 9 patches are finally selected as the buffer ecological areas. After optimising the ecological network, 152 potential corridors were added, which were mainly in the middle east of Beijing (Figure 7). The corridor network structure displayed a rise in the α, β and γ indices. The number of corridors increased from 45 to 171, and the number of ecological sources increased from 10 to 19. a value increased from 2.40 to 4.64; ß value increased from 4.5 to 9, with the largest increase; γ value increased from 1.88 to 3.35 with the smallest increase. This indicates the connectivity of the ecological sources increased after optimisation (Table 6).
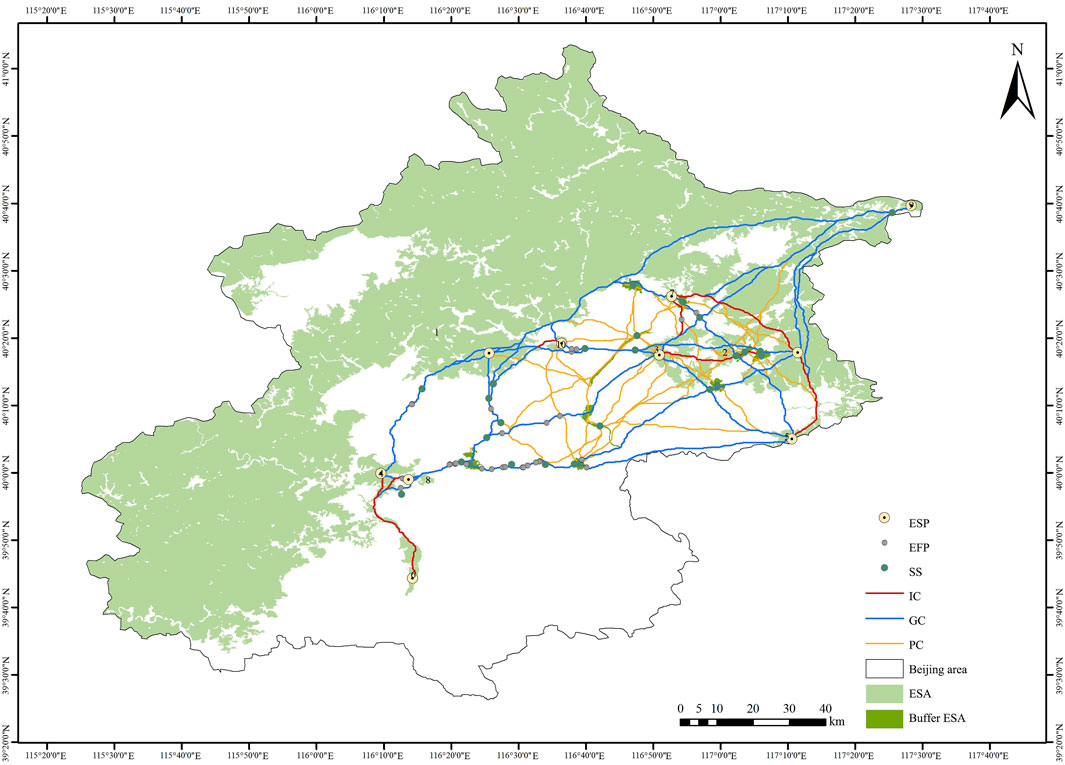
FIGURE 7. Optimized ecological networks in Beijing.
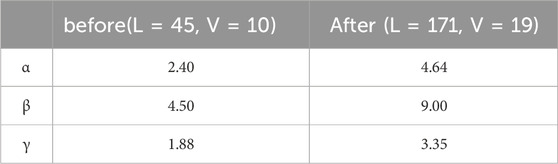
TABLE 6. The indices of α, β and γ.
4 Discussion
In order to solve the problem of landscape fragmentation in Beijing, we analyzed the landscape pattern of Beijing with MSPA, identified the ecological source area according to the values of landscape indices dPC and dIIC, constructed the ecological resistance surface, and constructed the ecological corridor with MCR model, optimized the ecological corridor by adding ecological stepping stones. In the results, the α, ß and γ values of the optimized corridor were higher than the original ecological corridor. It is proved that the optimized Beijing landscape connectivity has been improved.
(1) When making landscape pattern analysis by MSPA. Setting of edge effect is an important part of this study, which is affected by different landscape types, areas and shapes, and relate to the species amount, community dynamics, and habitat (Ostapowicz et al., 2008; Puma et al., 2013; Willmer et al., 2022). We set the edge width to 1 by default, however, this value may not work for all species, which has limitations (Liu J. et al., 2023). Therefore, the shape and suitability of the landscape type, the study area, and the species should be consider in the study area, then compare and analyse the influence of different values.
(2) When identifying ecological source, to get the values of landscape indices dPC and dIIC, the connection distance threshold should be set by considering the diffusion distance of different species, which has an effect on the result of patch connectivity (Ng et al., 2013). The threshold distance was set to 2000 m, and the connected probability was 0.5 in this study. Du Z set 11 distance thresholds (from 100 to 8,000 m), and computed the Number of Links (NL), Number of Components (NC), Equivalent Connectivity Area (ECA), and Landscape Coincidence Probability (LCP), to analyse and screen the most proper distance threshold (Du et al., 2018). In future studies, we can set several different threshold values and computed the corresponding index to screen the most adapted value.
The distribution of ecological sources was uneven, being mainly located in the north and west. However, the vegetation coverage of the southern region is lower, which present as an important area for urban construction in Beijing, with a large distribution range of construction land, and scattered urban green spaces and parks, which cannot be used as an ecological source (Dondina et al., 2018). The largest patch of dPC is Patch 1, which is located in the northwest with more ecological functions and should be given prioritized protection. Furthermore, the protection of poor connectivity patches should be emphasized too. These areas contribute significantly to the ecosystem and are minimally affected by human activities. Most of these regions are covered by forests, grasslands, and several natural scenic spots, which are regarded as ecologically important. The northern and western forest areas of Beijing are the most important ecological sources, with superior ecological and environmental qualities. In particular, the northern region of the city is the primary distribution area for ecological protection.
(3) The MCR model is used to simulate the corridors through which organisms traverse between patches (Lin et al., 2021). However, some researchers have chosen circuit theory in their studies to determine the importance of corridors (Kwon et al., 2021). The difference between the corridors generated by circuit theory and MCR model is that the destination and origin of organisms in MCR model is the center of each patch, while the starting position between the patches in circuit theory is at the edge of the patch. This theory is widely used as a research method to study species migration, which can scientifically generate urban ecological corridors and optimize ecological network system.
(4) As the result of the ecological network construction, the corridors between the northern and southern parts of the city that could not facilitate ecological circulation. Thus, the ecological protection of northern and southern patches is necessary, to reduce the impact of ecological landscape fragmentation. In general, in the southern parts of the city, small or medium-sized stepping stones should be constructed to address habitat gaps and improve the balance of ecosystem services in the region. As for the width of corridors, previous studies have indicated that 100-m corridors can satisfy the migratory requirements of small animals such as birds. Beijing has impervious surfaces that cover less than 5% of its land area and ecological corridors therefore have practical utility in this context (Kong, 2005; Ford et al., 2020).
(5) For the ecological network constructed, the northern and southern parts are poor connected. Besides, some corridors have to across urban roads as well as residential and commercial areas. Therefore, we should add new ecological sources and ecological corridors to maintain the balance. Stepping stone patches can potentially be used to improve the connections of ecological network systems (Luo et al., 2020). By adding stepped stone patches, 152 additional ecological corridors were obtained. These additional ecological corridors are broadly consistent with the ecological remediation guide areas planned by the Beijing Municipal Government, comprehensively covers almost all the sites, nature reserves, forest parks, and rural parks that are important for urban land protection; however, the buffer of corridors and stepping stones is still missing in the western and southern Beijing (Figure 8). The solution to the problem is to supplement planting of vegetation to form a natural ecological barrier to reduce human disturbance and connectivity to the corridor in close proximity. In addition, the patches that cross the ecological network need to increase in size to ensure integrity; linking fragmented ecological corridors to form an integrated structure is conducive to reducing fragmentation, thereby achieving sustainable development of the ecological environment.

FIGURE 8. Optimized ecological networks overlaid on the ecological remediation guide areas in Beijing.
In these optimized corridor, the contiguous areas between the central and eastern urban areas are well-connected to the reservoir and mountain corridors, the distribution is more concentrated, indicating that this area assumes an important function as a corridor in the flow of bio-materials. However, the southwestern and northern ecological corridors are poorly connected, the land use is a clear barrier to the ecological corridors. Therefore, we should increase the number of ecological corridors in the north-south direction through adding afforestation, construction of parks, greenways, to improve the ecological network system in Beijing. The primary step involves safeguarding core habitat source areas, particularly smaller patches. By strengthening their protection, these areas can be transformed into habitat sources and their numbers and scales can be expanded (Ai et al., 2022). In addition, fragmented green spaces and isolated lands must improve both the quality and scale of habitats. Integrating fragmented patches can strengthen ecological integrity and connectivity. The quality and scale of ecological networks can be improved through integration and enhanced connectivity. Impermeable surfaces indicate higher levels of human interference in regions with lower vegetation cover. Human activity hinders species migration and decreases habitat quality in the area. Consequently, we should creating reasonable ecological corridors to enhance connections between various landscape elements, without affecting human activities.
However, there are still some limitations. First, when constructing the MCR surface, the impacts of objective factors such as road were neglected. Second, when operating MSPA, there was a need to supplement the edge width and distance threshold limitations for applicability in the study area. Next, we constructed an ecological network system through important ecological sources, which spatially reflects the connectivity of ecological landscapes, but because of the large area and the disparity of individual patches, the overall characteristics of the landscape pattern were not considered for the analyses, such as in the patch areas and perimeters. Therefore, the complexity of ecological networks should be strengthened in the future, to obtain an identifiable and optimal model for ecological network construction. Finally, there is a need to expand the time scale changes in the study.
5 Conclusion
In this study, the highly urbanised city of Beijing was used as an example to integrate the MSPA and MCR models to construct and optimise an urban ecological network. 1) The core area of Beijing was 8,610.45 km2, accounting for the largest (96.17%) of the ecological source area, and 52.77% of the total sutdy area, which was mainly distributed in the north and west region. The bridge area was distributed in the southeast. The edge area was the second largest proportion, which shown a poor connectivity in Beijing. The loop area had the smallest landscape area. 2) The dPC values was less in the south and higher in the north. The patch 1 had the largest dPC values were in the north, with the highest connectivity. Finally, Ten core areas with dPC>0.23, and IIC>0.15 were extracted as the ecological sources. 3) The integrated ecological resistance surface in Beijing decreased from south to west and north. The northeast and northwest of Beijing exhibited the highest resistance values about 0.74. Lowest resistance values were in the southern and eastern Beijing, with about 0.04. 4) Forty-five corridors were constructed. The distribution corridors are dense in the east part of Beijing. Eight corridors with gravity values greater than 0.1 were classified as significant. Accroding to the gravity values the most important corridor linked sources 4 and 8, had the highest value about 5.37. 5) After selected 29 stepping stones and 32 ecological fault points, 9 patches are added. The optimised ecological network was increased to 171 ecological corridors. The connectivity of the corridors is increased, as the α, ß and γ indices was much higher than before.
These findings provide guidelines for the ecological networks in Beijing. Combining the MSPA and MCR models for landscape connectivity analysis provides scientific support for constructing and optimising ecological networks in similar regions.
Data availability statement
The original contributions presented in the study are included in the article/Supplementary material, further inquiries can be directed to the corresponding author.
Author contributions
YN: Conceptualization, Methodology, Writing–original draft. ZH: Conceptualization, Methodology, Writing–review and editing. SR: Conceptualization, Methodology, Writing–review and editing. KH: Project administration, Writing–review and editing.
Funding
The author(s) declare that no financial support was received for the research, authorship, and/or publication of this article.
Conflict of interest
The authors declare that the research was conducted in the absence of any commercial or financial relationships that could be construed as a potential conflict of interest.
Publisher’s note
All claims expressed in this article are solely those of the authors and do not necessarily represent those of their affiliated organizations, or those of the publisher, the editors and the reviewers. Any product that may be evaluated in this article, or claim that may be made by its manufacturer, is not guaranteed or endorsed by the publisher.
Abbreviations
MSPA, morphological spatial pattern analysis; MCR, minimal cumulative resistance; dPC, the probability of connectivity; IIC, integral index of connectivity; PC, probability connectivity; ESP: ecological source point; ESA, ecological source area; IC, important corridor; GC, general corridor; PC, potential corridor; SS, stepping stones; EFP, ecological fault points.
References
Ahmed, Z., Asghar, M. M., Malik, M. N., and Nawaz, K. (2020). Moving towards a sustainable environment: the dynamic linkage between natural resources, human capital, urbanization, economic growth, and ecological footprint in China. Resour. Policy 67, 101677. doi:10.1016/j.resourpol.2020.101677
Ai, J., Yang, L., Liu, Y., Yu, K., and Liu, J. (2022). Dynamic landscape fragmentation and the driving forces on haitan island, China. Land 11, 136. doi:10.3390/land11010136
An, Y., Liu, S., Sun, Y., Shi, F., and Beazley, R. E. (2020a). Construction and optimization of an ecological network based on morphological spatial pattern analysis and circuit theory. Landsc. Ecol. 36, 2059–2076. doi:10.1007/s10980-020-01027-3
An, Y., Liu, S., Sun, Y., Shi, F., and Beazley, R. E. (2020b). Construction and optimization of an ecological network based on morphological spatial pattern analysis and circuit theory. Landsc. Ecol. 36, 2059–2076. doi:10.1007/s10980-020-01027-3
Baguette, M., Blanchet, S., Legrand, D., Stevens, V. M., and Turlure, C. (2013). Individual dispersal, landscape connectivity and ecological networks. Biol. Rev. 88, 310–326. doi:10.1111/brv.12000
Bascompte, J. (2010). Structure and dynamics of ecological networks. Science 329, 765–766. doi:10.1126/science.1194255
Berling-Wolff, S., and Wu, J. (2004). Modeling urban landscape dynamics: a review. Ecol. Res. 19, 119–129. doi:10.1111/j.1440-1703.2003.00611.x
Biao, Z., Wenhua, L., Gaodi, X., and Yu, X. (2010). Water conservation of forest ecosystem in Beijing and its value. Ecol. Econ. 69, 1416–1426. doi:10.1016/j.ecolecon.2008.09.004
Brose, U. (2010). Improving nature conservancy strategies by ecological network theory. Basic Appl. Ecol. 11, 1–5. doi:10.1016/j.baae.2009.11.003
Chen, W., Zhou, T., and Liang, J. (2022). Urbanization, ecosystem services, and their interactive coercive relationship in Hunan Province, China. Environ. Sci. Pollut. Res. 30, 3416–3431. doi:10.1007/s11356-022-22370-9
Cheng, X., Chen, L., Sun, R., and Kong, P. (2018). Land use changes and socio-economic development strongly deteriorate river ecosystem health in one of the largest basins in China. Sci. total Environ. 616-617, 376–385. doi:10.1016/j.scitotenv.2017.10.316
Cui, L., Wang, J., Sun, L., and Lv, C. (2020). Construction and optimization of green space ecological networks in urban fringe areas: a case study with the urban fringe area of Tongzhou district in Beijing. J. Clean. Prod. 276, 124266. doi:10.1016/J.JCLEPRO.2020.124266
Dai, L., Liu, Y., and Luo, X. (2021). Integrating the MCR and DOI models to construct an ecological security network for the urban agglomeration around Poyang Lake, China. Sci. total Environ. 754, 141868. doi:10.1016/j.scitotenv.2020.141868
Dondina, O., Orioli, V., Colli, L. E., Luppi, M., and Bani, L. (2018). Ecological network design from occurrence data by simulating species perception of the landscape. Landsc. Ecol. 33, 275–287. doi:10.1007/s10980-017-0600-1
Du, X., Lyu, F., Wang, C., and Yu, Z. (2023). Construction of ecological network based on MSPA-Conefor-MCR at the county scale: a case study in Yanqing District, Beijing, China. J. Appl. Ecol. 34 4, 1073–1082. doi:10.13287/j.1001-9332.202303.023
Du, Z., Meng, W., and Li, H. (2018). The selection of distance threshold of wetland landscape connectivity in Tianjin binhai new area. IOP Conf. Ser. Mater. Sci. Eng. 392, 062094. doi:10.1088/1757-899X/392/6/062094
Ersoy, E., Jorgensen, A., and Warren, P. H. (2019). Identifying multispecies connectivity corridors and the spatial pattern of the landscape. Urban For. Urban Green. 40, 308–322. doi:10.1016/J.UFUG.2018.08.001
Fleury, A. M., and Brown, R. D. (1997). A framework for the design of wildlife conservation corridors with specific application to southwestern Ontario. Landsc. Urban Plan. 37, 163–186. doi:10.1016/S0169-2046(97)80002-3
Ford, A. T., Sunter, E. J., Fauvelle, C., Bradshaw, J. L., Ford, B. M., Hutchen, J., et al. (2020). Effective corridor width: linking the spatial ecology of wildlife with land use policy. Eur. J. Wildl. Res. 66, 69. doi:10.1007/s10344-020-01385-y
Fragkias, M. (2013). Urbanization, biodiversity and ecosystem services: challenges and opportunities. A Glob. Assess., doi:10.1007/978-94-007-7087-4
Hong, W., Guo, R., Su, M., Tang, H., Chen, L., and Hu, W. (2017). Sensitivity evaluation and land-use control of urban ecological corridors: a case study of Shenzhen, China. Land Use Policy 62, 316–325. doi:10.1016/J.LANDUSEPOL.2017.01.010
Huang, Q., Chen, G., Xu, C., Jiang, W., and Su, M. (2021b). Spatial variation of the effect of multidimensional urbanization on PM2.5 concentration in the beijing–tianjin–hebei (BTH) urban agglomeration. Int. J. Environ. Res. Public Health 18, 12077. doi:10.3390/ijerph182212077
Huang, X., Ye, Y., Zhang, Z., Ye, J., Gao, J., Bogonovich, M., et al. (2021a). A township-level assessment of forest fragmentation using morphological spatial pattern analysis in Qujing, Yunnan Province, China. J. Mt. Sci. 18, 3125–3137. doi:10.1007/s11629-021-6752-0
Jonas, J., Hall, S. A., and Casey, J. F. (1991). Gravity anomalies over extinct spreading centers: a test of gravity models of active centers. J. Geophys. Res. 96, 11759–11777. doi:10.1029/91JB00617
Knaapen, J. P., Scheffer, M., and Harms, B. (1992). Estimating habitat isolation in landscape planning. Landsc. Urban Plan. 23, 1–16. doi:10.1016/0169-2046(92)90060-D
Kong, F., Yin, H., Nakagoshi, N., and Zong, Y. (2010). Urban green space network development for biodiversity conservation: identification based on graph theory and gravity modeling. Landsc. Urban Plan. 95, 16–27. doi:10.1016/J.LANDURBPLAN.2009.11.001
Kong, Y. (2005). The width of ecological corridor in landscape planning. Acta Ecol. Sin., (in Chinese with English abstract). doi:10.3321/j.issn:1000-0933.2005.09.037
Kwon, O., Kim, J., and Ra, J. (2021). Landscape ecological analysis of green network in urban area using circuit theory and least-cost path. Land 10, 847. doi:10.3390/land10080847
Lambert, M. R., and Donihue, C. M. (2020). Urban biodiversity management using evolutionary tools. Nat. Ecol. Evol. 4, 903–910. doi:10.1038/s41559-020-1193-7
LaPoint, S. D., Gallery, P. K., Wikelski, M., and Kays, R. W. (2013). Animal behavior, cost-based corridor models, and real corridors. Landsc. Ecol. 28, 1615–1630. doi:10.1007/s10980-013-9910-0
Li, Y., Zhang, Y., Jiang, Z., Guo, C., Zhao, M., Yang, Z., et al. (2021). Integrating morphological spatial pattern analysis and the minimal cumulative resistance model to optimize urban ecological networks: a case study in Shenzhen City, China. Ecol. Process. 10, 63–15. doi:10.1186/s13717-021-00332-2
Liang, J., He, X., Zeng, G., Zhong, M., Gao, X., Li, X., et al. (2018). Integrating priority areas and ecological corridors into national network for conservation planning in China. Sci. total Environ. 626, 22–29. doi:10.1016/j.scitotenv.2018.01.086
Liccari, F., Boscutti, F., Bacaro, G., and Sigura, M. (2022). Connectivity, landscape structure, and plant diversity across agricultural landscapes: novel insight into effective ecological network planning. J. Environ. Manag. 317, 115358. doi:10.1016/j.jenvman.2022.115358
Lin, Q., Eladawy, A., Sha, J., Li, X., Wang, J., Kurbanov, E., et al. (2021). Remotely sensed ecological protection redline and security pattern construction: a comparative analysis of pingtan (China) and durban (South Africa). Remote Sens. 13, 2865. doi:10.3390/RS13152865
Liu, J., Chen, J., Yang, Y., You, H., and Han, X. (2023b). Construction and optimization of an ecological network in the yellow river source region based on MSPA and MCR modelling. Int. J. Environ. Res. Public Health 20, 3724. doi:10.3390/ijerph20043724
Liu, L., and Lei, Y. (2020). Dynamic changes of the ecological footprint in the Beijing-Tianjin-Hebei region from 1996 to 2020. Ecol. Indic. 112, 106142. doi:10.1016/j.ecolind.2020.106142
Liu, W., Zhan, J., Zhai, Y., Zhao, F., Asiedu Kumi, M., Wang, C., et al. (2023a). Linking ecosystem service supply and demand to evaluate the ecological security in the pearl river delta based on the pressure-state-response model. Int. J. Environ. Res. Public Health 20, 4062. doi:10.3390/ijerph20054062
Luo, Y., Wu, J., Wang, X., and Peng, J. (2021). Using stepping-stone theory to evaluate the maintenance of landscape connectivity under China’s ecological control line policy. J. Clean. Prod. 296, 126356. doi:10.1016/J.JCLEPRO.2021.126356
Luo, Y., Wu, J., Wang, X., Wang, Z., and Zhao, Y. (2020). Can policy maintain habitat connectivity under landscape fragmentation? A case study of Shenzhen, China. Sci. total Environ. 715, 136829. doi:10.1016/j.scitotenv.2020.136829
Ma, K., Zhou, L., Niu, S., and Nakagoshi, N. (2005). Beijing urbanization in the past 18 years. J. J. of Biom., doi :doi:10.15027/29762
Ng, C., Xie, Y. J., and Yu, X. J. (2013). Integrating landscape connectivity into the evaluation of ecosystem services for biodiversity conservation and its implications for landscape planning. Appl. Geogr. 42, 1–12. doi:10.1016/j.apgeog.2013.04.015
Opdam, P., Steingröver, E. G., and Rooij, S. V. (2006a). Ecological networks: a spatial concept for multi-actor planning of sustainable landscapes. Landsc. Urban Plan. 75, 322–332. doi:10.1016/j.landurbplan.2005.02.015
Opdam, P., Steingröver, E. G., and Rooij, S. V. (2006b). Ecological networks: a spatial concept for multi-actor planning of sustainable landscapes. Landsc. Urban Plan. 75, 322–332. doi:10.1016/J.LANDURBPLAN.2005.02.015
Ostapowicz, K., Vogt, P., Riitters, K. H., Kozak, J., and Estreguil, C. (2008). Impact of scale on morphological spatial pattern of forest. Landsc. Ecol. 23, 1107–1117. doi:10.1007/s10980-008-9271-2
Pelorosso, R., Gobattoni, F., Geri, F., and Leone, A. P. (2017). PANDORA 3.0 plugin: a new biodiversity ecosystem service assessment tool for urban green infrastructure connectivity planning. Ecosyst. Serv. 26, 476–482. doi:10.1016/J.ECOSER.2017.05.016
Peng, J., Wang, A., Luo, L., Liu, Y., Li, H., Hu, Y., et al. (2019). Spatial identification of conservation priority areas for urban ecological land: an approach based on water ecosystem services. Land Degrad. Dev. 30, 683–694. doi:10.1002/ldr.3257
Puma, I. P., Lathrop, R. G., and Keuler, N. S. (2013). A large-scale fire suppression edge-effect on forest composition in the New Jersey Pinelands. Landsc. Ecol. 28, 1815–1827. doi:10.1007/s10980-013-9924-7
Saura, S., Bodin, Ö., and Fortin, M. (2014). EDITOR'S CHOICE: stepping stones are crucial for species' long-distance dispersal and range expansion through habitat networks. J. Appl. Ecol. 51, 171–182. doi:10.1111/1365-2664.12179
Shi, X., Qin, M., Li, B., and Zhang, D. (2021). A framework for optimizing green infrastructure networks based on landscape connectivity and ecosystem services. Sustainability 13, 10053. doi:10.3390/su131810053
Tang, Y., Gao, C., and Wu, X. (2020). Urban ecological corridor network construction: an integration of the Least cost path model and the InVEST model. ISPRS Int. J. Geo Inf. 9, 33. doi:10.3390/ijgi9010033
Vuilleumier, S., and Prélaz-Droux, R. (2002). Map of ecological networks for landscape planning. Landsc. Urban Plan. 58, 157–170. doi:10.1016/S0169-2046(01)00218-3
Wang, H., Zhou, S., Li, X., Liu, H., Chi, D., and Xu, K. (2016). The influence of climate change and human activities on ecosystem service value. Ecol. Eng. 87, 224–239. doi:10.1016/j.ecoleng.2015.11.027
Wang, Y., Qu, Z., Zhong, Q., Zhang, Q., Zhang, L., Zhang, R., et al. (2022). Delimitation of ecological corridors in a highly urbanizing region based on circuit theory and MSPA. Ecol. Indic. 142, 109258. doi:10.1016/j.ecolind.2022.109258
Wei, Q., Halike, A., Yao, K., Chen, L., and Balati, M. (2022). Construction and optimization of ecological security pattern in Ebinur Lake Basin based on MSPA-MCR models. Ecol. Indic. 138, 108857. doi:10.1016/j.ecolind.2022.108857
Willmer, J. N., Püttker, T., and Prevedello, J. A. (2022). Global impacts of edge effects on species richness. Biol. Conserv. 272, 109654. doi:10.1016/j.biocon.2022.109654
Xian, C., Ouyang, Z., Li, Y., Xiao, Y., and Ren, Y. (2016). Variation in nitrate isotopic signatures in sewage for source apportionment with urbanization: a case study in Beijing, China. Environ. Sci. Pollut. Res. 23, 22871–22881. doi:10.1007/s11356-016-7498-z
Xie, W., Huang, Q., He, C., and Zhao, X. (2018). Projecting the impacts of urban expansion on simultaneous losses of ecosystem services: a case study in Beijing, China. Ecol. Indic. 84, 183–193. doi:10.1016/j.ecolind.2017.08.055
Xu, Z., Dong, B., Wang, C., Gao, X., Xu, H., Wei, Z., et al. (2023). Construction of international important wetland White-headed crane ecological corridor in Chongming Dongtan, China. Ecol. Indic. 149, 110156. doi:10.1016/j.ecolind.2023.110156
Yang, C., Guo, H., Huang, X., Wang, Y., Li, X., and Cui, X. (2022). Ecological network construction of a national park based on MSPA and MCR models: an example of the proposed national parks of “ailaoshan-wuliangshan” in China. Land 11, 1913. doi:10.3390/land11111913
Yang, J., Zeng, C., and Cheng, Y. (2020). Spatial influence of ecological networks on land use intensity. Sci. total Environ. 717, 137151. doi:10.1016/j.scitotenv.2020.137151
Yang, W., Li, F., Wang, R., and Hu, D. (2011). Ecological benefits assessment and spatial modeling of urban ecosystem for controlling urban sprawl in Eastern Beijing, China. Ecol. Complex. 8, 153–160. doi:10.1016/j.ecocom.2011.01.004
Ye, H., Yang, Z., and Xu, X. (2020). Ecological corridors analysis based on MSPA and MCR model—a case study of the tomur world natural heritage region. Sustainability 12, 959. doi:10.3390/su12030959
Zhai, T., and Huang, L. (2022). Linking MSPA and circuit theory to identify the spatial range of ecological networks and its priority areas for conservation and restoration in urban agglomeration. Front. Ecol. Evol. 10. doi:10.3389/fevo.2022.828979
Zhang, W., Liu, G., and Yang, Z. (2020). Urban agglomeration ecological risk transfer model based on Bayesian and ecological network. Resour. Conservation Recycl. 161, 105006. doi:10.1016/j.resconrec.2020.105006
Keywords: MSPA analysis, MCR model, gravity model, ecological corridor, Beijing
Citation: Na Y, Hong Z, Ren S and Huang K (2024) Optimizing the construction of ecological networks in Beijing using a morphological spatial pattern analysis—minimal cumulative resistance model. Front. Environ. Sci. 12:1325880. doi: 10.3389/fenvs.2024.1325880
Received: 22 October 2023; Accepted: 08 January 2024;
Published: 19 January 2024.
Edited by:
Jose Navarro Pedreno, Miguel Hernández University of Elche, SpainReviewed by:
Wei Liu, Shandong Normal University, ChinaDavid Blanco, Metropolitan University of Technology, Chile
Copyright © 2024 Na, Hong, Ren and Huang. This is an open-access article distributed under the terms of the Creative Commons Attribution License (CC BY). The use, distribution or reproduction in other forums is permitted, provided the original author(s) and the copyright owner(s) are credited and that the original publication in this journal is cited, in accordance with accepted academic practice. No use, distribution or reproduction is permitted which does not comply with these terms.
*Correspondence: Kai Huang, 1693802774@qq.com