Spatiotemporal analysis of drought severity using SPI and SPEI: case study of semi-arid Borana area, southern Ethiopia
 Mitiku Adisu Worku
- Department of Environment and Climate Change, Ethiopian Civil Service University, Addis Ababa, Ethiopia
Drought is a complex natural hazard that can cause damage to socio-economic and biophysical systems in any climatic region. The main objective of this paper was to analyze the spatiotemporal drought in the semi-arid Borana area of southern Ethiopia from 1981 to 2018. The climate data was obtained from the Ethiopian Meteorological Institute. Standardized precipitation index (SPI) and Standardized Precipitation Evapotranspiration Index (SPEI) at 3- and 12-month timescales were adopted to characterize drought during these periods and wet seasons in time and space. The results revealed that moderate to extreme drought conditions at various stations frequently hit months stretching from March to June and September to November. The years 1984, 1985, 1992, 1999, 2000, 2001 and 2011 were known to be the driest years, among others. A total of 484, 563, 573 and 620 combined moderate, severe and extreme drought events were observed across all stations using SPI-3, SPEI-3, SPI-12 and SPEI-12, respectively. Internal variability among the stations was noticed regarding the frequency and magnitude of drought. Ganna (March to May), the season that was supposed to be the main rainy season in the region, was by far drier than Hagayya (September to November), the short rainy period. In general, this study found a high frequency and intense magnitude of drought that varies across the stations. Therefore, any localized adaptation and mitigation strategies intended to tackle or minimize drought-associated impacts should take into account this local variability.
1 Introduction
Consumption of non-renewable energy sources in production systems cause carbon emissions, climate change and extreme weather events (Abbas et al., 2022a; Abbas et al., 2022b). In particular, drought is possibly the most complex and damaging natural hazard (Senay et al., 2015) and its overall impact is determined based on its duration, severity, frequency and areal extent (Mehr and Vaheddoost, 2020). It can occur in all climatic zones when precipitation drops below normal or long-term average (Wilhite and Smith, 2005) and its characteristics differ from one region to another (Zelek et al., 2017). Available reports suggest the recurrence period of drought is shortening (Guteirrez et al., 2014; Mera et al., 2018). Palmer (1965) classified drought as meteorological, agricultural, hydrological and socio-economic drought (Yihdego et al., 2019; Mehr and Vaheddoost, 2020), which all originate from a deficiency of precipitation (meteorological drought) and others cascade from it (Wilhite and Glantz, 1985; Yihdego et al., 2019). Meteorological and agricultural droughts are the consequences of precipitation and soil moisture deficit, respectively. Hydrological drought is then cascaded from these and leads to scarcity in surface water resources (Danandeh et al., 2020; Pekpostalci et al., 2023). The Intergovernmental Panel on Climate Change IPCC, (2014) has indicated that tropical areas to experience a significant change in the frequency and intensity of droughts in the mid to late 21st century and this has come as a serious concern for many developing countries in Africa and Asia (Mera et al., 2018).
Drought in Ethiopia occurs during the different seasons when seasonal rainfall drops below normal by almost 30%–50% (Wilhite and Glantz, 2005). Borana rangelands in southern Ethiopia are known for their rising temperature coupled with unpredictable rainfall amount and distribution, which becomes a bottleneck for the livestock sector for declining pasture and water availability (Coppock et al., 2008). The study area is known for its deteriorating rangeland conditions with a marked decrease in grass species and increases in shrubs (Terefe et al., 2012). The grazing system is becoming increasingly unsustainable in recent decades because the area has been affected by cyclical and prolonged drought (Coppock et al., 2008) and food insecurity (Desalegn et al., 2018).
Many studies have been carried out on drought in Ethiopia from different perspectives. Zeleke et al. (2017) studied the trend and periodicity of drought over the country using various indices, while Mera et al. (2018) analyzed drought and its impacts in Ethiopia. Teshome and Zhang (2019) on the other hand, studied the prevalence of extreme drought in the country under warming conditions. Moreover, Kassaye et al. (2021) quantified drought severity changes in Ethiopia for an extended period (1952–2017) while Morsy et al. (2022) studied drought prevalence over Ethiopia using SPEI with the help of observed and CRU gridded dataset. At an even larger spatial scale, Kalisa et al. (2020) analyzed the spatiotemporal characteristics of drought over the East African regions using a standardized precipitation index (SPI). They identified severe drought years across the region. These studies were conducted at relatively larger spatial scales where it is difficult to look at more localized variability and drought characteristics.
In addition, some studies recently investigated the spatiotemporal characteristics and trend of drought at the basin or sub-basin level in the country. Anose et al. (2022) characterized drought at Omo Ghibe River Basin; Haile et al. Haile et al. (2022) analyzed drought at Bilate watershed (sub-basin of Rift Valley Lakes) and Tesfamariam et al. (2019) at Rift Valley Lakes Basin whereas Getachew and Temesgen (2021) in the upper Awash River Basin and Yared et al. (2015) in the upper Blue Nile Basin. These studies found more or fewer similarities in drought variability in their respective study regions. Gidey et al. (2018), Adnew et al. (2021) and Yirga (2021) were more localized drought papers conducted in the country. They proved that drought conditions are recurrent and its magnitude, duration and geographical coverage are increasing.
In this study, it is intended to characterize the spatiotemporal characteristics of drought in Borana rangelands, a semi-arid region that makes up a portion of the Genale plains, Southern Ethiopia using SPI and SPEI at 3- and 12-month timescales. The analysis focuses on drought frequency, magnitude, and duration in a very local area (station-based). Although the community’s livelihood is exclusively dependent on climate-sensitive sectors, either small-holder farming or livestock-based, a previous study that deal with the spatiotemporal characteristics of drought in the entire semi-arid Borana rangelands does not exist in this region. Therefore, the study result could significantly help in devising more localized adaptation and mitigation strategies to overcome drought-associated risks.
2 Materials and methods
2.1 Study area
Borana rangeland is a semi-arid region located in the southernmost part of the country. Its highest proportion lies within the Genale Dawa River Basin, largely covering the southern region and only a very small part of it in the west lies within the Rift Valley Lakes Basin. Geographically, it extends from 3° 30’—5° 25′ N latitude and 36° 43’—39° 45’ E longitude. It is characterized by a warm semi-arid type of climate. The region and its surroundings are known by four (two wet and two dry) distinct seasons. The wet seasons occur from March to May (Ganna) and September to November (Hagayya).
In contrast, the dry season occurs from December to February (Bona) and from June to August (Adolessa) (Korecha and Barnston, 2007). The mean annual rainfall received in the study area ranges between 285 mm and 741 mm, as investigated by Worku et al. (2022), although previously reported between 300 mm and 900 mm by Debela et al. (2019); hence it signifies a reduction of average rainfall recently. The study area is almost dry during June to August when most parts of the country receive rainfall due to its rain-shadow location (lee-ward side) and therefore, the main rainy season here is ‘Ganna’. The mean annual maximum and minimum temperatures observed in Borana were 29.66 °C and 16.31°C, respectively (Worku et al., 2022).
The topography of the study area varies between 450 m above mean sea level on the western edge where it is the lowest and 2,487 m above mean sea level in the central and north-central areas of Borana as shown in Figure 1. The region is dominated by tropical savanna vegetation comprising a varying proportion of grasslands and woody vegetation as reported by (Gemedo et al., 2006). The Borana communities are exclusively pastoral and very recently, some areas started small-holder farming as a coping mechanism for recurring droughts in the region.
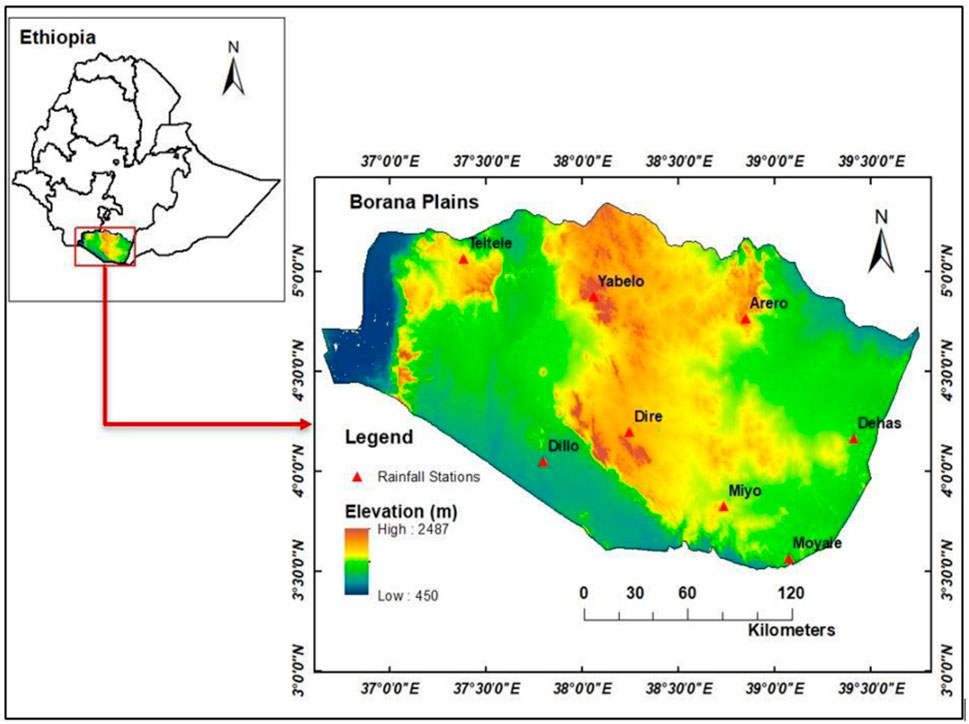
FIGURE 1. Location map of the study area.
2.2 Datasets
Meteorological data used in this study, including mean monthly precipitation, mean monthly maximum and minimum temperature of stations (Table 1) in the study area for the period 1981 to 2018, were collected from the Ethiopian Meteorological Institute (EMI). Station data are not free from missing values which is a drawback of employing these data types. Therefore, we fill the data gaps using another version of data, namely, gridded (4 km × 4 km) climate data obtained from EMI. These gridded data are the product of enhancing the national climate services (ENACTS) initiative, developing and implementing a tool for quality control of observations at national weather services, and then blending with freely available global products (Tufa et al., 2017). This was accomplished by the international research institute’s (IRI) climate Data Tool (CDT)—at Earth Institute, Columbia University (https://iri.columbia.edu/resources/enacts/). The complete data for the entire stations were then summarized for use in R-statistical package to calculate the index values for SPI/SPEI at 3- and 12-month timescales. The consistency of measurements for precipitation across the meteorological stations was tested through double mass curve analysis (Pekpostalci et al., 2023). Hence, it was found there is consistency in the observed rainfall dataset and all points lie on the trend line (Figure 2). Therefore, there was no any consistency adjustment required.
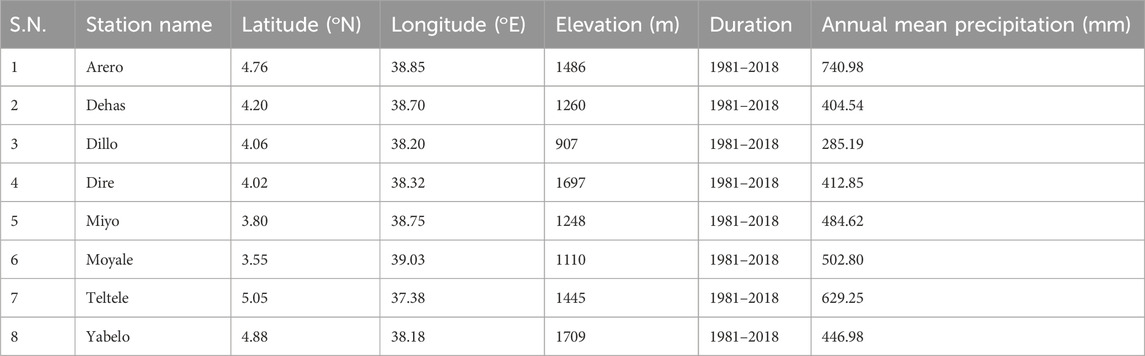
TABLE 1. Geographical location of stations.
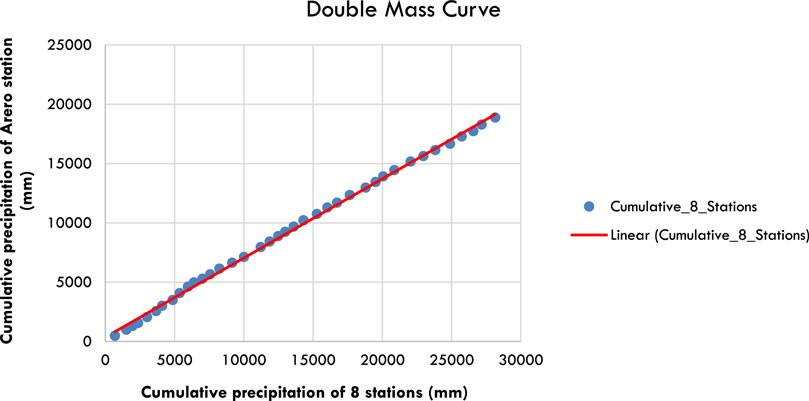
FIGURE 2. Double mass curve of rainfall stations in the semi-arid Borana area.
2.3 Drought indices
Drought indices are crucial in assessing drought as they help clearly understand the complex interrelationships between multiple climate parameters (Zeleke et al., 2017). Most of these indices depend on climate parameters such as precipitation, temperature and evapotranspiration measurements. Some of the widely used indices include the Palmer Drought Severity Index (PDSI) (Palmer, 1965), the Percent of Normal and the Deciles approach Gibbs and Maher, 1967), the Standardized Precipitation Index (SPI) (McKee et al., 1993) and Standard Precipitation Evapotranspiration Index (SPEI) (Vicente-Serrano et al., 2010). For a number of advantages including simplicity, versatility and applicability to any location or ability to consistently detect drought in time and space (World Meteorological Organization [WMO], 2012; Degefu and Bewket, 2013; Kassaye et al., 2021), SPI was employed in this study. SPI is the only precipitation-based parameter. Howard et al. (2014) explained the need to incorporate temperature in arid and semi-arid areas where potential evapotranspiration (PET) is significant. Both SPI and SPEI drought indices were widely used in the assessment of drought severity and for their multiple advantages (Danandeh et al., 2020; Mehr and Vaheddoost, 2020; Kassaye et al., 2021; Morsy et al., 2022; Pekpostalci et al., 2023). Due to this reason, Standardized Precipitation Evapotranspiration Index (SPEI) was also considered in this study.
2.3.1 Standardized precipitation index (SPI)
The SPI was proposed by (McKee et al., 1993; McKee et al., 1995) and has been used frequently during the past 2 decades. Viste et al. (2013) suggested this index for countries like Ethiopia with limited data access (El-Kenawy et al., 2016; Kassaye et al., 2021). The SPI was designed to assess drought conditions based on the probability distribution of long-term precipitation using the gamma function (McKee et al., 1993). Precipitation is transformed into normalized numerical values and the SPI is given as the number of standard deviations by which the observed precipitation deviates from the long-term mean for a normally distributed random variable. It compares the precipitation over a specific period with the precipitation totals from the same period for all the years included in the record and, consequently, facilitates the temporal analysis of drought phenomena (Shahid and Behrawan, 2008).
The cumulative probability H(x) in SPI calculation is transformed to the standard normal distribution with mean of 0 and a variance of 1. Because, SPI is based on the cumulative probability of a given timescales, the total amount of precipitation in the current month and the previous months are used to calculate SPI (Ullah et al., 2021). The detailed procedures used to compute SPI values can be obtained from (McKee et al., 1993; McKee et al., 1995; Ullah et al., 2021).
2.3.2 Standardized precipitation evapotranspiration index (SPEI)
Unlike SPI, which is a precipitation-only-based index, SPEI takes into account temperature and the effect of PET, hence recommended in arid and semi-arid regions. SPEI is a multi-scalar index calculated based on the non-exceedance probability of the differences between precipitation and potential evapotranspiration, adjusted using a three-parameter log-logistic distribution (Vicente-Serrano et al., 2010).
In this study, the potential evapotranspiration (PET) which takes in to account the effect of temperature in addition to precipitation was estimated by the Thornthwaite method (Thornthwaite, 1948). This method uses daily average temperature and the coordinate (latitude) of the location it seems simple to calculate PET than available methods including Hargreaves and Penman methods. The climatic water balance in the timeseries data was estimated by deducting the cumulative PET from the cumulative precipitation at a specific timescale (Quenum et al., 2019; Ullah et al., 2021). The difference (Di) between precipitation (P) and PET for the month (i) is given in Eq. 1.
The calculated D values are aggregated at different time scales and are given by:
Where k (months) is the timescale of the aggregation and n is the specific calculation month.
The SPEI is obtained by normalizing the water balance into the log-logistic probability distribution (Vicente-Serrano et al., 2017). The probability function of a log-logistic distribution is calculated as follows:
where α, β and y are scale, shape and origin parameters respectively for y > D < ∞. For the D series, the probability distribution function is then given as:
With f(x), the SPEI can be obtained as the standardized values of f(x) according to (Vicente-Serrano et al., 2010).
Where
and
P is the probability of exceeding a determined Di value and is given as p = 1—f(x) while the constants are given as: C0 = 2.515517, C1 = 0.802853, C2 = 0.010328, d1 = 1.432788, d2 = 0.189269, d3 = 0.001308.
The SPI/SPEI values were interpreted based on the scales provided by McKee et al. (1993), WMO (2012), Mehr and Vaheddoost (2019), Danandeh et al. (2020) and Pekpostalci et al. (2023) as given in Table 2.
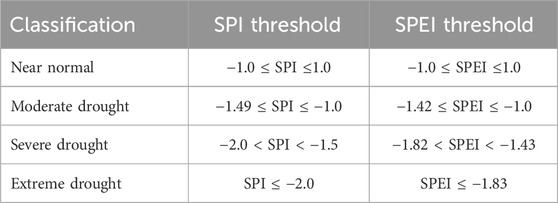
TABLE 2. Classification scale for SPI/SPEI values for dry conditions.
The duration of drought (D) is the length of time (the number of months) between the onset and termination of drought (Mao et al., 2017). It is computed using o formula provided by (Xu et al., 2018).
Where di is the duration of the ith drought event in an area and n is the total number of drought events in the area.
Drought frequency (F) is the number of drought occurrences in a given time (Yu et al., 2014). Wang et al. (2018) estimated it as the ratio of the number of drought months to the total number of months in a time series.
Where nm is the number of drought months and Nm is the total number of months.
2.4 Spatial analysis of drought
The inverse distance weighted (IDW) interpolation technique (Shepard, 1968) in ArcGIS was employed to generate spatial drought maps across the study area. To do this, the frequency of drought at 3- and 12-month timescales for SPI/SPEI as well as wet season mean index values, were considered to produce the drought maps. Hence, spatial drought maps showing variability across stations were produced in this study.
3 Results
3.1 Temporal analysis of drought
The occurrence of drought is observed using indices including standardized precipitation index and Standardized Precipitation Evapotranspiration Index at 3-month (SPI/SPEI-3) and 12-month (SPI/SPEI-12) timescales. Different drought magnitudes were observed at various stations using SPI-3. Extreme drought (SPI ≤ −2), in particular, was frequently observed in the study area during March (at Dillo, Teltele and Yabelo stations), April and May (at the majority of the stations, including Arero, Dehas, Dillo, Dire and Miyo) and June (at almost all stations except Dehas station). In addition, September at Miyo and October, November and December at Teltele stations were also among the extreme drought events (Figure 3). Moderate and severe drought events were also observed as shown in the same figure in the study region.
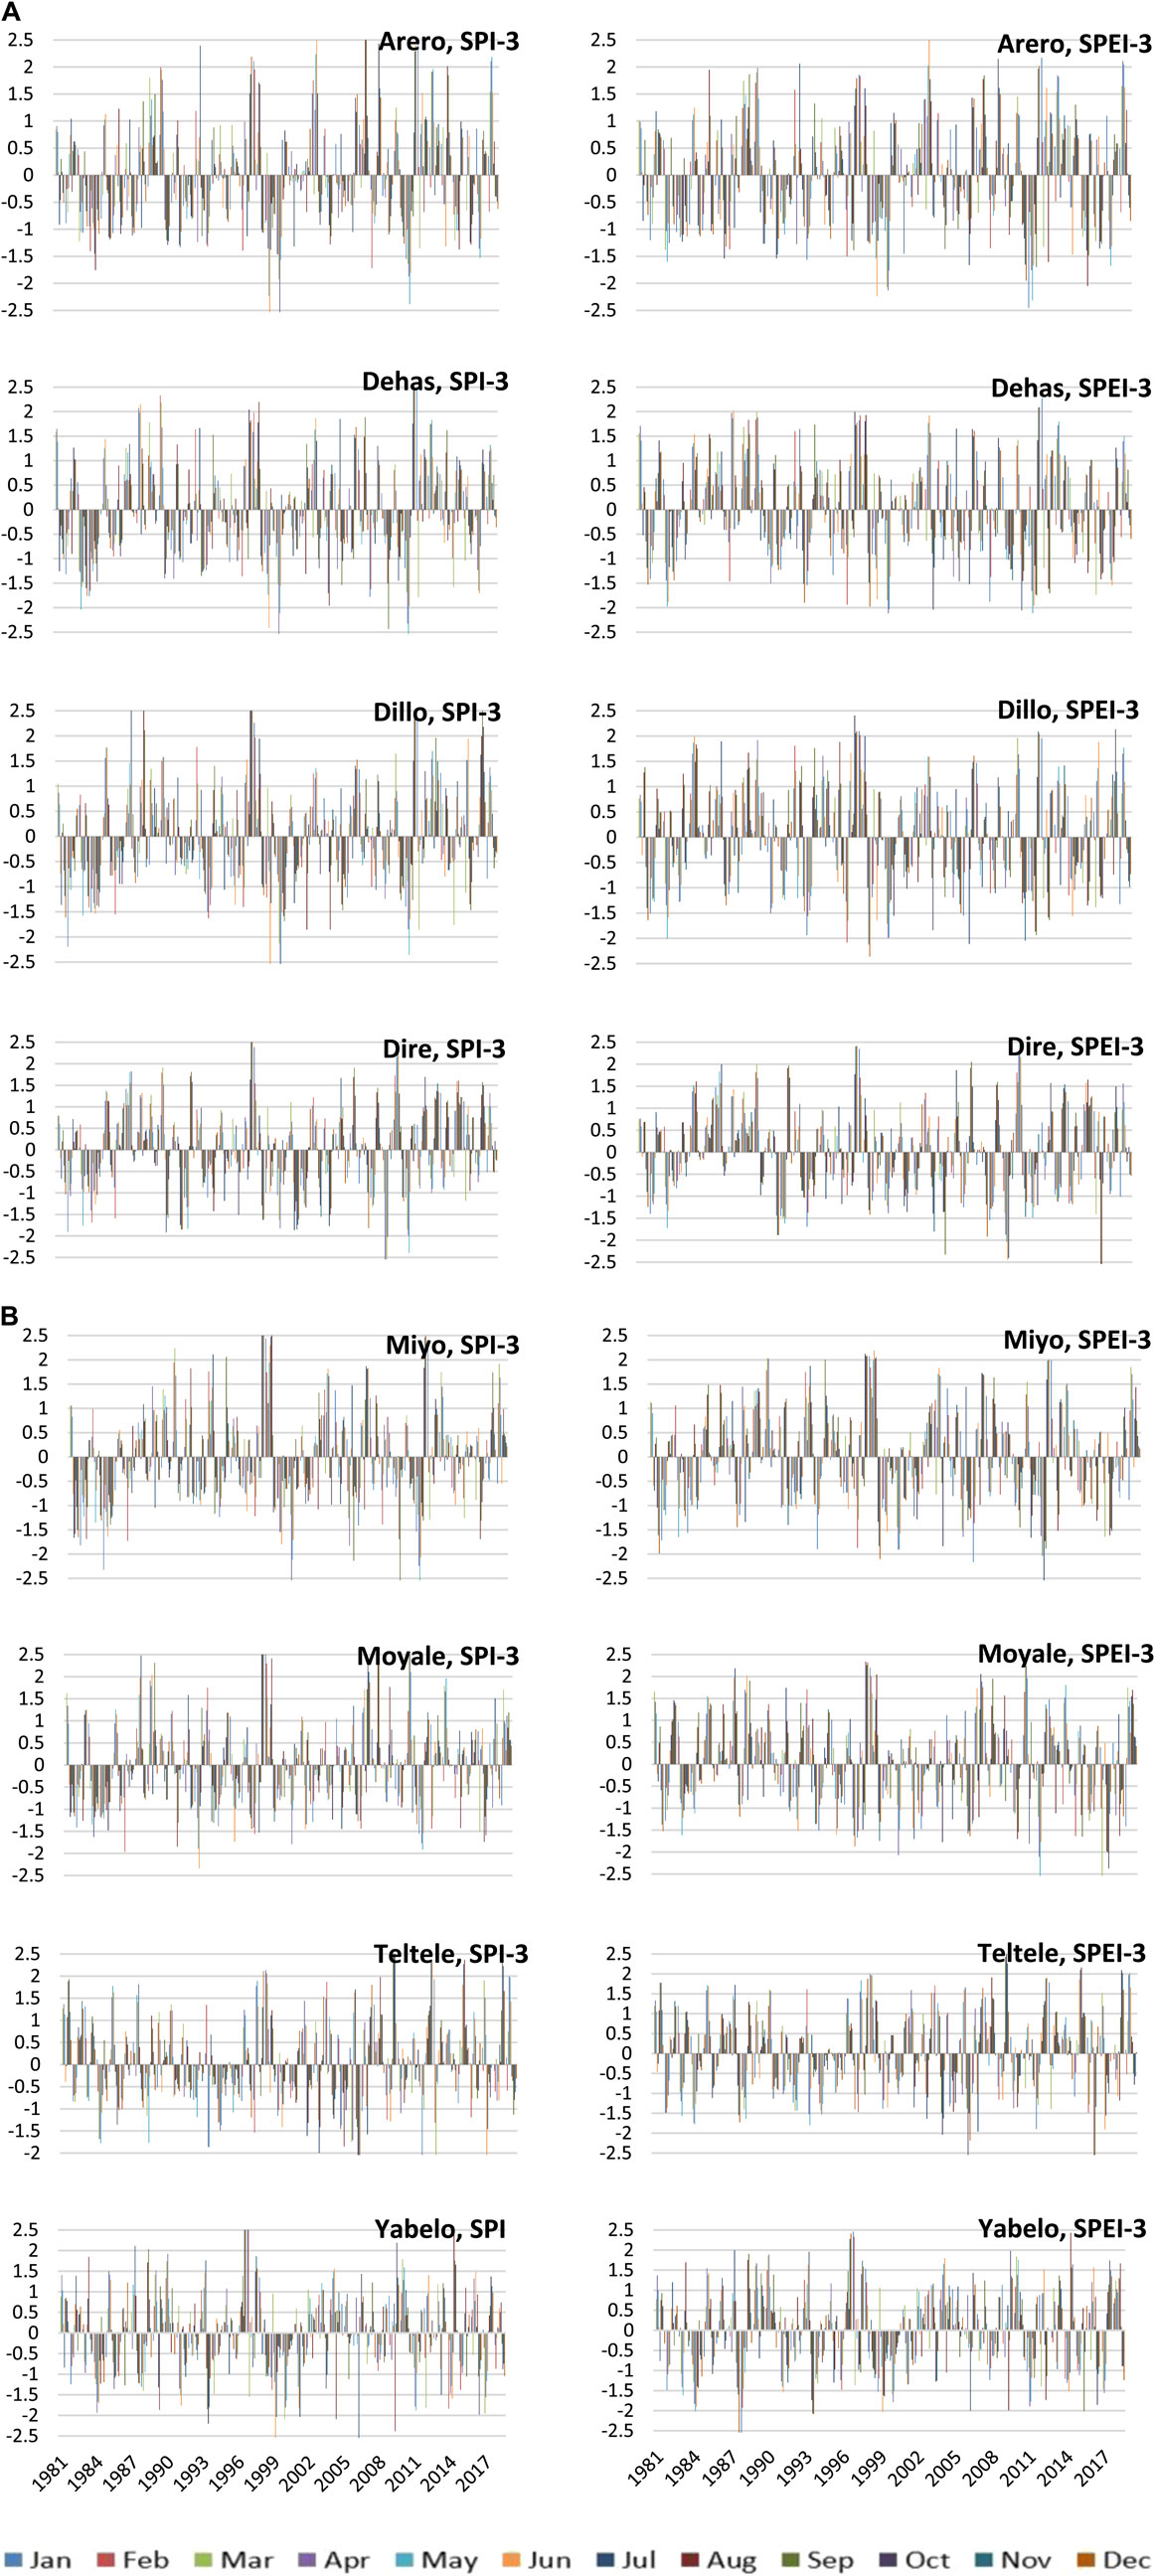
FIGURE 3. (Continued).
On the other hand, SPEI-3 also detected extreme drought events and other scales of drought during various years at stations located in the study area. May was extremely dry at all stations except Teltele (Figure 3). In addition, April at Arero, Dehas, Dillo and Moyale as well as October at Dehas, Teltele and Moyale stations were also extremely dry months in the study area. Apart from this, August, June and December were among the months that exhibited extreme drought events during different periods.
The study emphasizing the drier conditions with SPI/SPEI-3 and -12 values less than or equal to −1 (SPI/SPEI ≤ −1) over the studied years. Accordingly, SPI-3 revealed 322, 117 and 45 events of moderate, severe and extreme droughts, at all stations during the study period (Table 3). Whereas, based on SPEI-3 results, even more events of drought were seen; for example, moderate (388), severe (128) and extreme (47) droughts. Among the drought events detected, moderate drought makes up the highest proportion (66.5%) while extreme drought was the lowest (9.3%) for SPI-3. Moderate drought was very frequent (68.9%) while extreme drought shares about 8.3% as per the SPEI-3 results. The remaining proportion goes to severe drought (−1.5 < SPI/SPEI < −2.0).
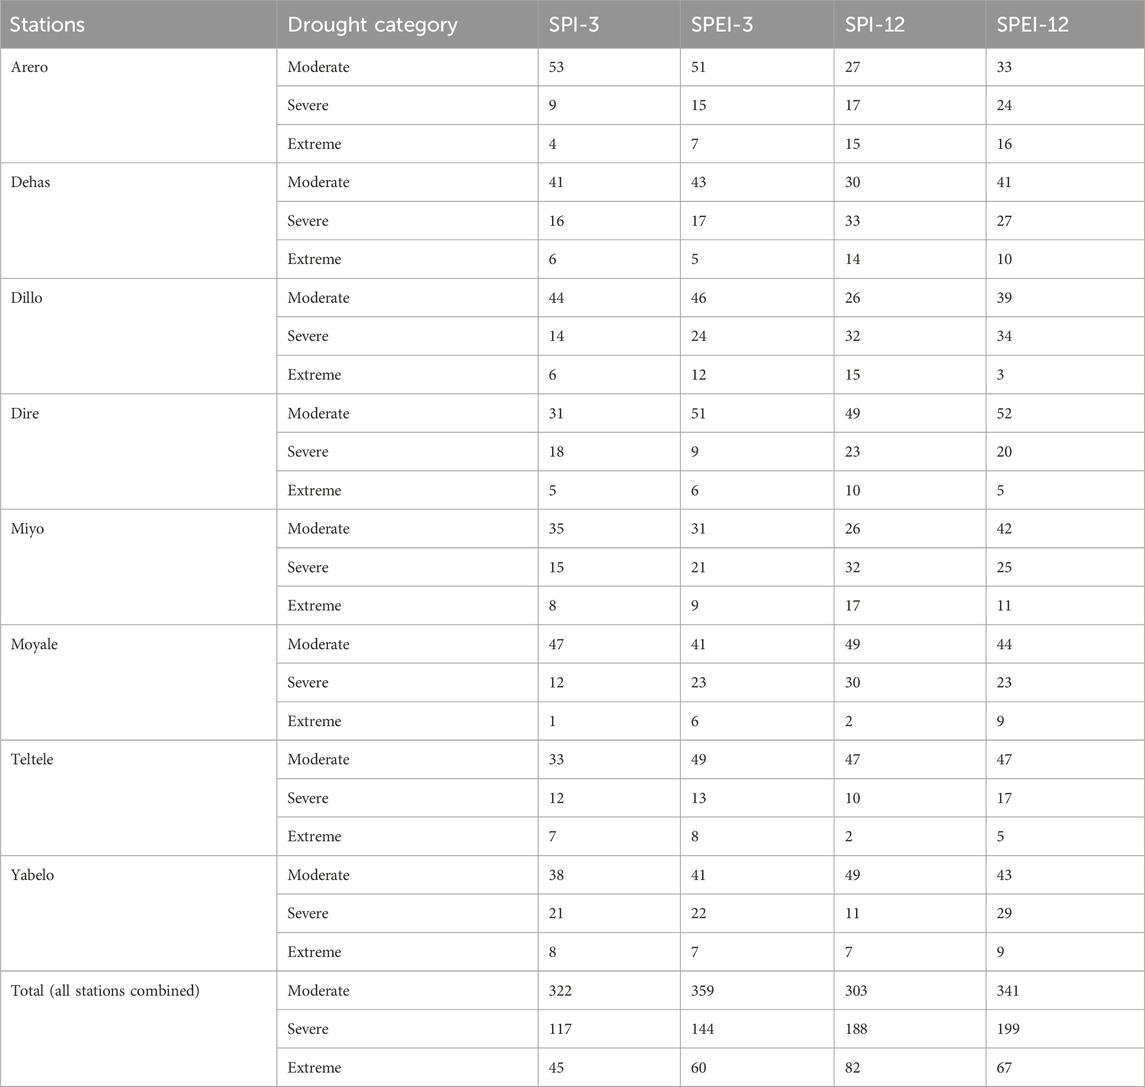
TABLE 3. Scale of drought and its frequency across all stations (SPI/SPEI ≤ −1).
The 12-month SPI for the studied period was computed for all stations as shown in Figure 4. The results show severe to extreme drought in 1992, 1994, 1999, 2000, 2001, 2002, 2008 and 2012 in most of the stations. On the contrary, severe to extreme wet conditions were observed in 1990, 1998, 2003, 2013 and 2014 in different areas of the lowland and these periods were where good pasture conditions are available for livestock and during these times the communities are a little bit stationary unlike their experience during drought periods where they travel along with their herd in search of pasture and water.
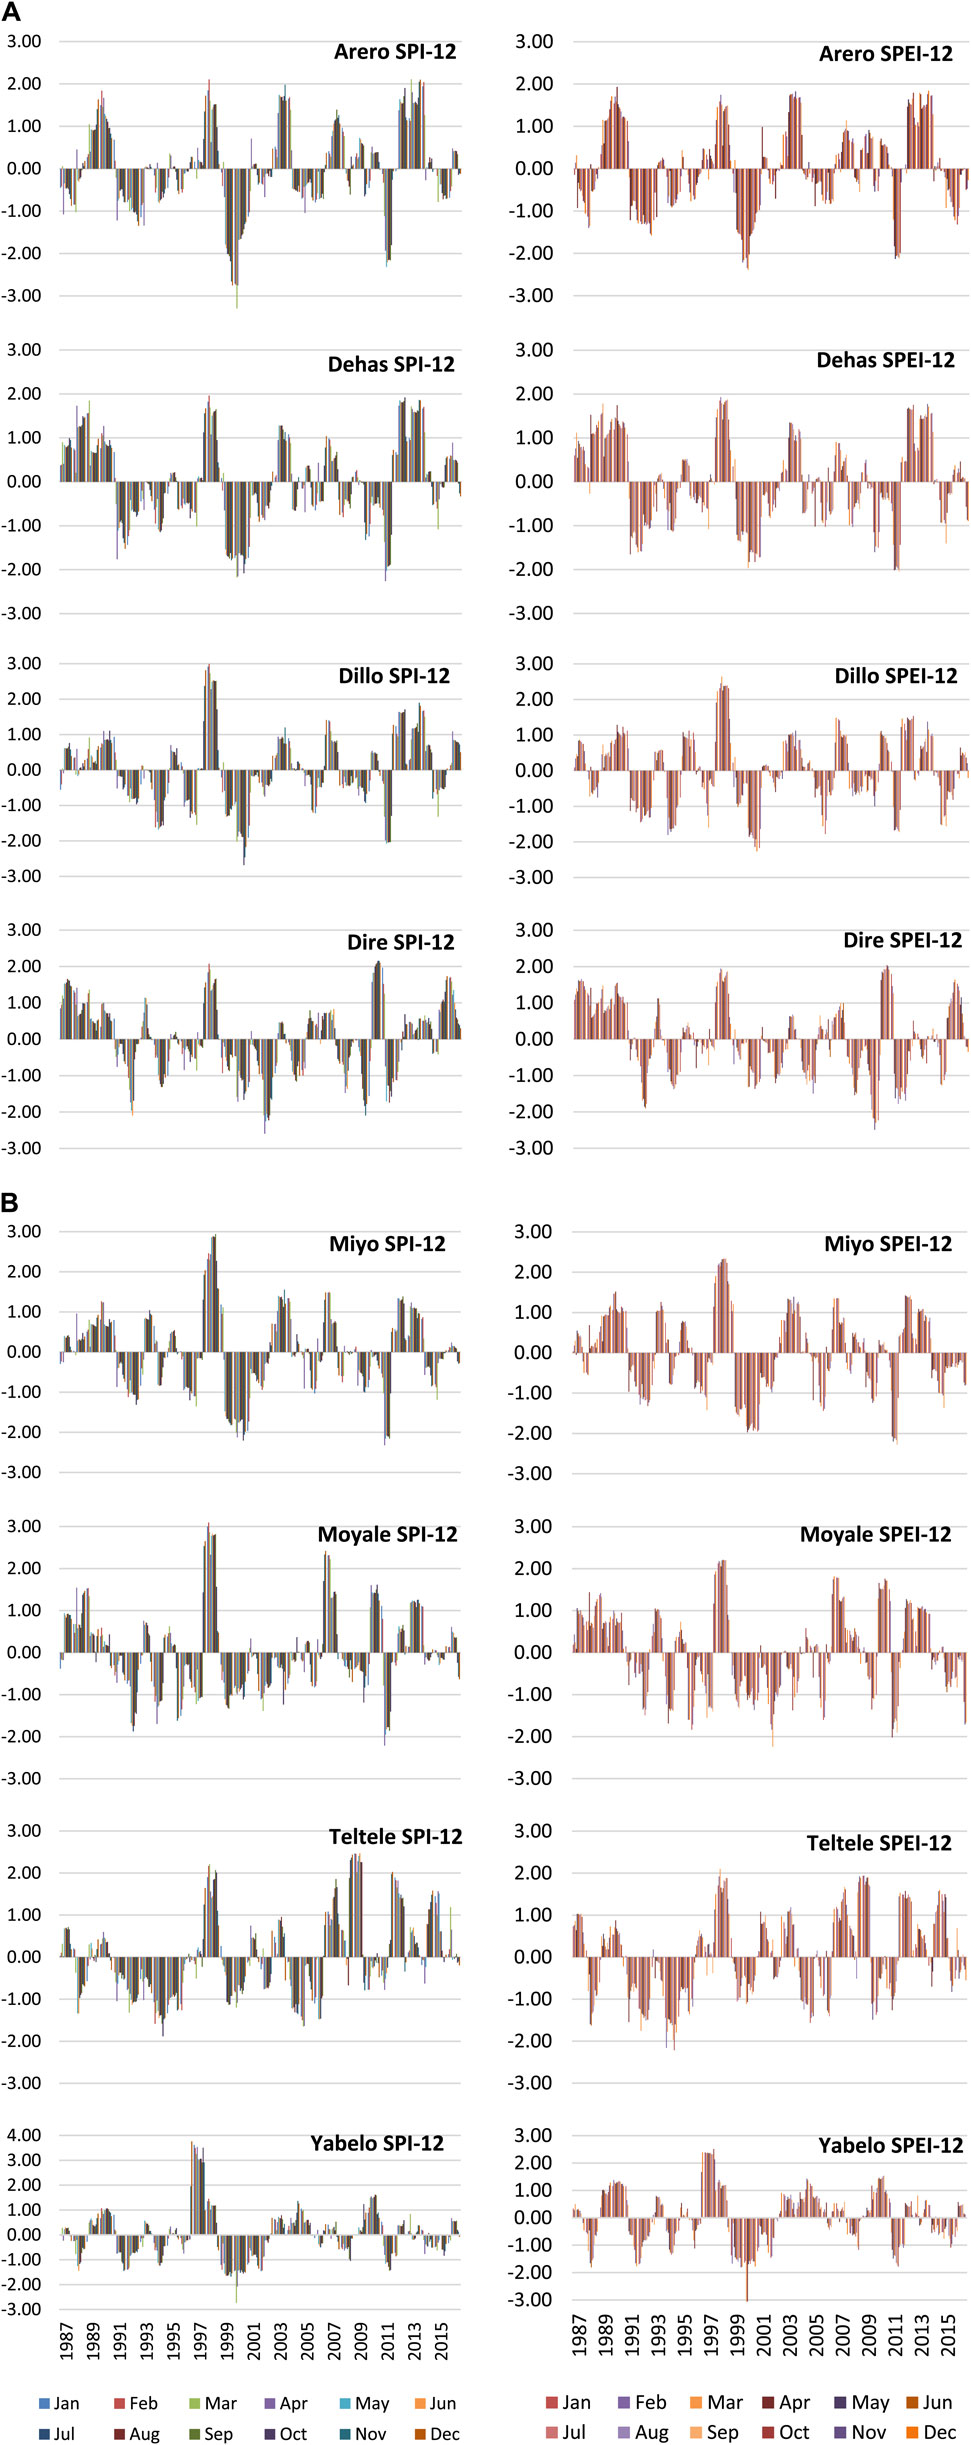
FIGURE 4. (Continued).
The assessment of drought using 12-month SPEI (SPEI-12) was undertaken for the study area and therefore drought years with different magnitude identified. The 12-month SPEI which is an ideal indicator of hydrological drought is also computed for the Borana lowland stations. Therefore, based on the calculated annual average SPEI value, 1992 is moderately dry in all the stations except in Moyale and Yabelo. The same is true for 2011, where moderate drought is experienced in Arero, Dehas and Miyo stations. Apart from that, average mild drought is observed in 1994 (Dillo and Dire) and 1999 (Arero and Dire) and 2002 in Moyale. Most importantly, the year 2000 was severely dry in Arero, Dehas, Dillo, Miyo and Yabelo; but there was high monthly disparity, for example, in Yabelo where SPEI values for March and April were −3.08 and −3.39 respectively. Another severe drought event is also seen in Teltele during 1994 and the detailed results are presented in Figure 4.
3.2 Drought severity across stations
During the studied years, various magnitudes and frequencies of droughts were observed across the stations. We analyzed this phenomenon at different timescales considered in this study and came up with the following results. SPI-3 revealed a combined drought scale of 52 (at Teltele) to 67 (at Yabelo) stations. Yabelo station was the driest station with a share of 13.8% combined moderate, severe and extreme drought events, followed by Arero (13.6%) as shown in Table 3. Most extreme drought events were observed at Miyo and Yabelo stations with 8 occurrences each. Whereas, according to SPEI-3, the occurrences of total drought events range between 65 (Dehas) to 82 (Dillo) stations. Therefore, Dillo, at this timescale, was the driest station with 14.56%, followed by Arero (13%). The occurrences of extreme drought among the stations vary between five to seven, where the most are observed again at Yabelo station (Table 3).
The drought frequency is also analyzed at a 12-month timescale using SPI/SPEI-12 and a different result is obtained. To this end, the frequency ranges between 59 at Arero and 82 at Dire station. Dire and Moyale stations were the two driest stations, with 14.3% and 14.14% of droughts observed respectively as revealed by SPI-12. The most extreme drought event was observed at Miyo with 17 followed by Arero and Dillo stations (15 each) as indicated in Table 3. The other 12-month timescale (SPEI-12) even exhibited a greater number of total droughts than others. 69 combined moderate, severe, and extreme drought events were observed at Teltele which is the lesser compared to 88, the most frequent, and observed at Miyo station. Hence, Miyo station, followed by Yabelo were the driest station with 14.2% and 13.06% proportions respectively. And also, the most frequent extreme drought events were observed at Arero station during the same period. Overall, a total of 484, 563, 573 and 620 combined moderate, severe and extreme drought events were observed using SPI-3, SPEI-3, SPI-12 and SPEI-12 respectively in the study area between 1981 and 2018.
Drought measured using SPI/SPEI-12 was more frequent in Borana rangelands than in SPI/SPEI-3. The ratio of drought (combined moderate, severe and extreme) to several years or study period ranges from 1.6 at Arero station to 2.16 at Dire station for SPI-12. Even the frequency is more for SPEI-12, where the ratio was 1.8 per year at Teltele station to 2.34 per year at Miyo station. SPI12 revealed there were at least two drought events usually in a year at Dehas, Dire, and Moyale stations. On the other hand, as observed by SPEI-12, there were two or more observations of drought at all stations except at Arero (1.87) and Teltele (1.81), although the scale and magnitude of drought vary from one station to another (Table 3).
The spatial distribution of combined moderate, severe and extreme drought was not uniform across the study area as given by 3- and 12-month SPI/SPEI. SPI-3 shows the most frequent drought events occurred at Arero and Yabelo, the northern stations and Dillo station in the southwestern (Figure 5). The frequency decreased towards the northwestern station, Teltele. But SPEI-3 revealed more frequency of drought concentrated at Dillo station in the southwestern parts of the study region which decreased towards Dehas in the east. Other regions of semi-arid Borana, including Arero, Teltele and Yabelo have shown similar drought frequencies.
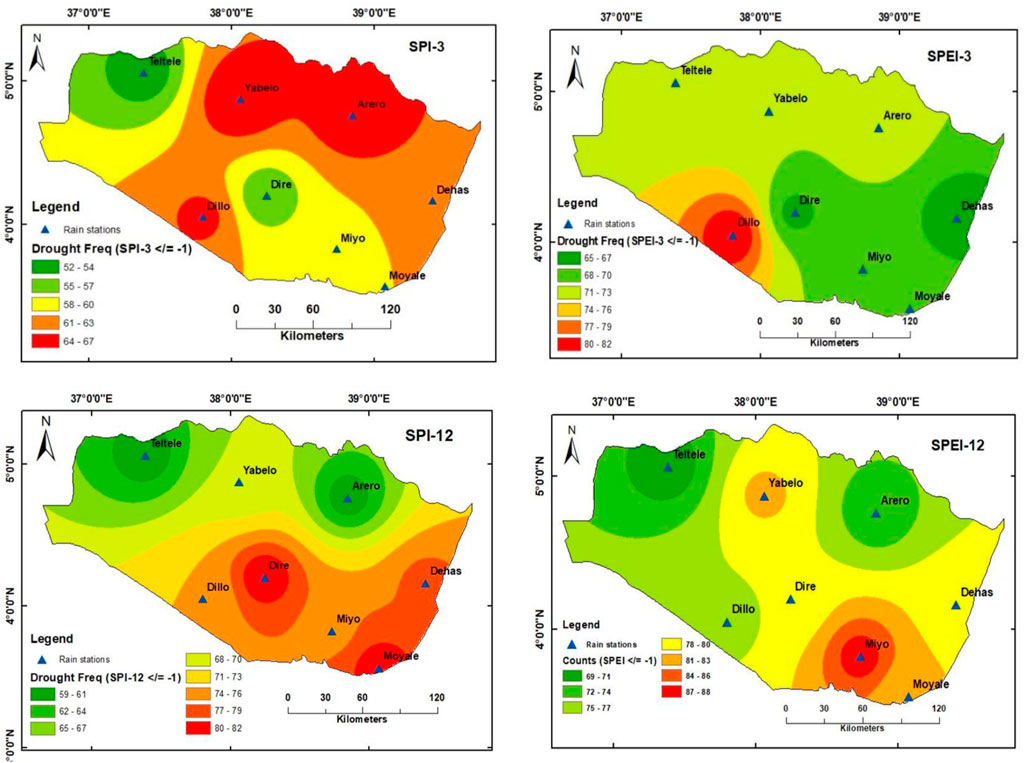
FIGURE 5. Spatial distribution of drought with index value ≤ −1 (1981–2018).
On the other hand, the longer timescale SPI/SPEI-12 exhibited more frequency than the shorter timescale SPI/SPEI-3 particularly for severe drought. But for moderate and extreme dryness, the indices indicated more or less similar frequency across the study region. SPI/SPEI-12 indicates that drought was very frequent at stations near the southern and southeastern regions and decreased towards the northeastern and northwestern areas in the Borana plains (Figure 5). Overall, the spatial distribution of drought varies across stations between the shorter and longer timescales. Therefore, any strategy related to combating drought should consider this internal variability.
3.3 Wet seasons observations of drought
The study area, Borana and its surroundings are characterized by four distinct seasons as described earlier. Here we analyzed SPI/SPEI for both the main (Ganna) and the short (Hagayya) wet seasons and found drought is a common phenomenon even when the region expects rainfall. More droughts (combined moderate, severe and extreme) were observed by SPEI as well as SPI during the Ganna season. Extreme drought was dominantly observed during Ganna than Hagayya where the later was dominated by moderate drought for both SPI and SPEI (Figure 6).
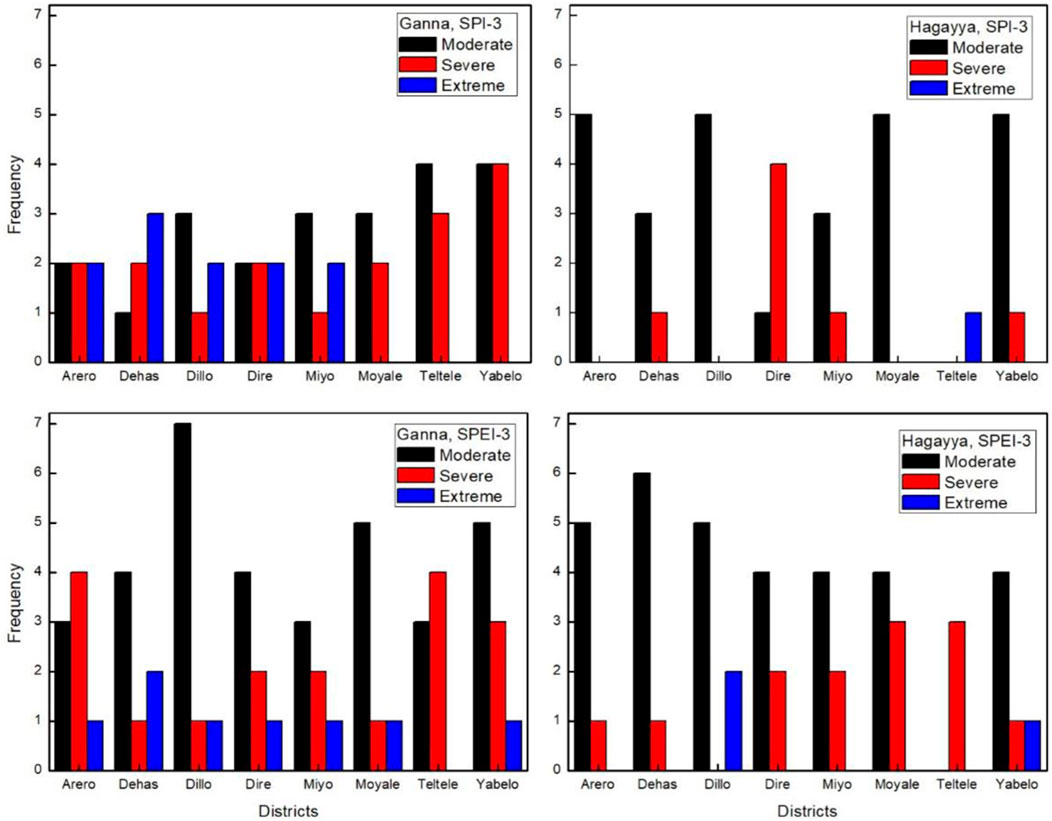
FIGURE 6. Wet seasons, Ganna (March to May) and Hagayya (September to November) drought observations (1981–2018).
Station-wise, the Ganna-SPI revealed that Dehas station was hit most by extreme drought, followed by Arero, Dillo, Dire and Miyo stations. On the other hand, the Ganna-SPI showed at least one extreme drought event at every station except Dehas exhibited twice and none for Teltele during the whole period. When it comes to Hagayya-SPI/SPEI, only Teltele was extremely dry during this short rainy period, as given by SPI whereas, the Hagayya-SPEI exhibited that Dillo and Yabelo were the only stations in the study area hit by extreme drought twice and once through the study period (1981–2018). Figure 6 presents more concerning the occurrences of dry events during these wet seasons.
The spatial distribution of moderate, severe and extreme drought across the study area was mapped and shown in Figure 7. The map provided only considers index values ≤ −1 which signifies all scales of drought combined. The Ganna-SPI here revealed that the magnitude of drought at Dehas in the eastern and Dire in the central parts of the study area was stronger compared to other areas. On the contrary, Moyale, Teltele and Yabelo and their surroundings were regions of severe drought with lesser magnitude. Regarding Hagayya-SPI, the mean values show that Dire and its immediate surroundings were characterized by severe drought, whereas areas in the southeastern and southwestern were moderately dry with less magnitude.
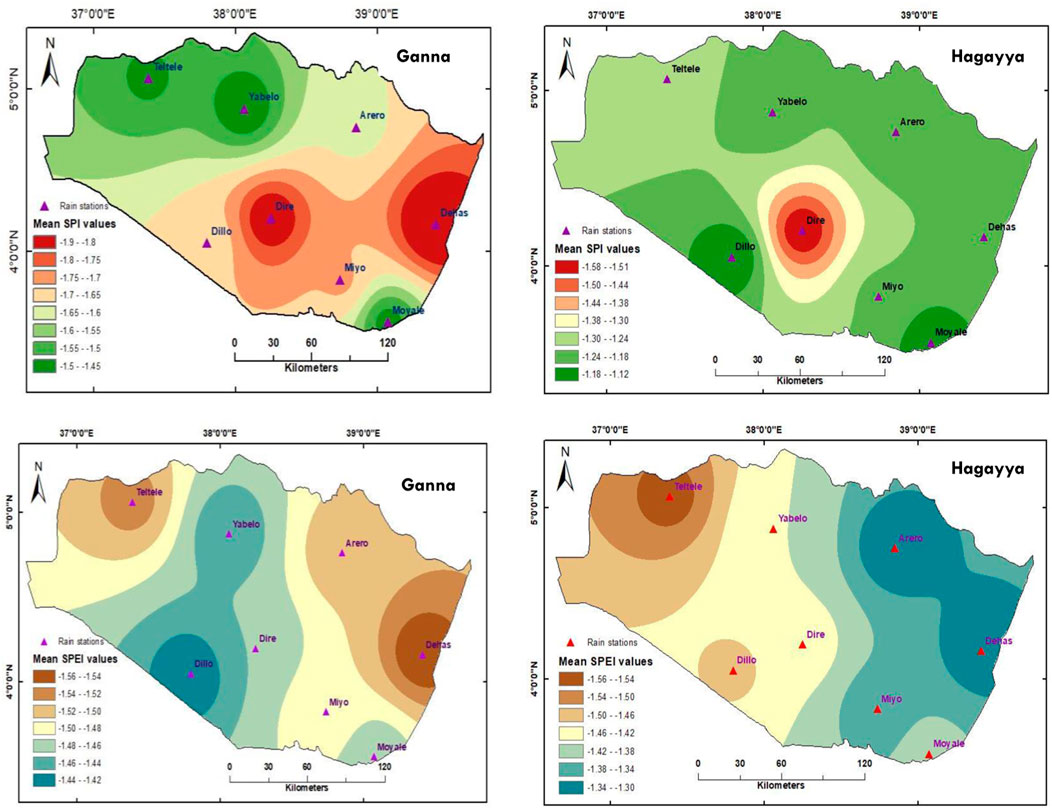
FIGURE 7. Drought magnitudes across the semi-arid Borana rangelands (1981–2018).
The average SPEI for both Ganna and Hagayya indicated that the magnitude of drought decreased from severe in the eastern and northwest to moderate in the southwest during Ganna, the main rainy period (Figure 7). Whereas the Hagayya-SPEI shows the magnitude of drought decreases from west to east and of course, the drought scale looks similar to that of Ganna-SPEI. Overall, the mean values for SPI/SPEI during both seasons determined that severe drought (SPI = -1.9) was observed at Dehas and Dire stations during Ganna, while moderate drought (SPEI = -1.3) was observed at Arero and Dehas stations during Hagayya. Therefore, the frequency and magnitude of drought across the study area were not similar. This local variability might help decision makers where to act first while devising an intervention strategy.
4 Discussion
Both SPI and SPEI at 3-month (shorter) and 12-month (longer) timescales were computed to analyze the spatial and temporal characteristics of drought at eight (8) stations of Borana rangelands, which is a part of Genale Dawa River Basin in southern Ethiopia. Drought in this semi-arid region is a common phenomenon, and the study area is frequently affected by drought. The shorter timescale drought indices investigated in March, April, May, June, September, October and November were known for frequent drought events with different magnitudes at various stations. April and May were extremely dry months at most stations. This result agrees with (Getachew and Temesgen, 2021), who found high spatiotemporal drought variability during the months from February to May in the upper Awash River Basin. Adnew et al. (2021) further investigated the significantly increasing trends of drought in southeastern Ethiopia from March to May, where their finding is consistent with the current study. Teshome and Zhang (2019) also reported the increase in extreme drought in Ethiopia that is associated with climate warming.
The longer timescale (SPI/SPEI-12) revealed the existence of a wide range of moderate to extreme drought events across the study area. In particular, 1984, 1985, 1992, 1994, 1999, 2000, 2001 and 2011 were identified as severe to extreme drought years, among others in Borana. In their study, Yared et al. (2015) identified similar annual drought episodes with devastating impacts in many parts of the country. Zeleke et al. (2017) also noticed frequent and more severe drought conditions centered in 1983/84, particularly in Ethiopia’s northern and northwest regions. Yimer et al. (2018) on the other hand, identified 1984, 1987/1988, 1992/1993, 1999, 2003/2004 and 2007/2008 as the worst drought years in Ethiopia. Anose et al. (2022) and Ayal et al. (2021) in their respective paper found consistent results that agree with this paper. Furthermore, Mutsotso et al. (2018) and Chitedze and Chikabvumbwa (2021) analyzed drought episodes by employing SPEI and SPI, respectively, in Kenya and Malawi. Hence their finding supported the current result.
A total of 484, 563, 573 and 620 combined moderate, severe and extreme drought events were determined respectively by SPI-3, SPEI-3, SPI-12 and SPEI-12 across all the stations between 1981 and 2018. Yabelo was the driest station with 13.8% drought frequency according to SPI-3, whereas SPEI-3 makes Dillo station as the driest ever with 14.56% drought frequency. On the other hand, Dire (14.3%) and Miyo (14.2%) were the driest stations as given by 12-month SPI and SPEI, respectively, over the studied years. Drought was so frequent that at least one or more drought events were observed annually at all stations. Drought frequency has increased from time to time, as investigated by Haile et al. (2022) in the Bilate watershed and the Rift Valley Lakes Basin by Tesfamariam et al. (2019) where their findings agree with the results of this paper. Yirga (2021) also observed frequent and extreme drought conditions in the eastern parts of the Guraghe zone in the central part of Ethiopia between 1989 and 2017.
Regarding the magnitude and duration of drought, the longest duration of drought in Borana plains occurred from 1999 to 2001 in most of the stations, even though it varies from one station to another in months. An increasing magnitude of drought was observed in Borana during the studied years. Gidey et al. (2018) observed mild to severe meteorological drought once every 2–3 years with high incidence over the last 3 decades in northern Ethiopia. According to Zeleke et al. (2017), drought has become more frequent and intense in Ethiopia, particularly in the southern regions since 1997.
Borana and its surroundings are one of those areas in the country characterized by a bimodal rainfall pattern. Hence, the wet seasons here appear during Ganna (March to May)—the main rainy season and Hagayya (September to November)—the short-wet season. Ganna rain in this region is the most useful where smallholder farmers and livestock sector-dependent communities need it very badly. Although it varies from one station to another, Ganna rain is more seriously threatened by drought than Hagayya season. Ganna is characterized by a greater number of drought events than Hagayya season and the extreme drought conditions observed during Belg were also far greater than that of Hagayya season. Getachew and Temesgen (2021) and Adnew et al. (2021) observed the increasing drought frequency from February to May. Zeleke et al. (2017) also noticed the increasing drying trend over the southern and southwestern during Ganna, although it corresponds to the season of maximum precipitation. Yimer et al. (2018) again noticed the increased drought tendencies during Ganna season in the country. Overall, the high incidence of extremely dry conditions during Ganna (MAM), seeks the attention of policymakers and practitioners to devise a way out since it has a devastating impact on communities and the environment.
5 Conclusion
In this study, we analyzed the spatial and temporal characteristics of drought in Borana rangelands in southern Ethiopia using SPI/SPEI at 3- and 12-month timescales. SPI and SPEI drought indices were selected as the best ones due to their advantages compared to other indices in the study area. One should know that the applicability of a drought index should be tested in order to reduce or avoid the uncertainties with the use. After this is proven, one can proceed after justifying this although not every index free from some sort of limitation and this was presented in detail under methods section. The study area is a semi-arid region that makes up a portion of the southeastern lowlands (the most extensive) in Ethiopia. Drought is a common and frequent phenomenon here and the rainy months of March, April, May, September and October experienced moderate to extreme drought conditions. Years particularly 1984–1985, 1992, 1995, 1999–2001 and 2011 were identified as drought years. The drought frequency was more for longer timescales (SPI/SPEI-12) than the shorter (SPI/SPEI-3) timescales and a station observed a drier condition at least once or more in a year. There was an experienced drought during the wet seasons in the study area where the frequency and magnitude of the drought were stronger during ‘Ganna’ (March to May) than ‘Hagayya’ (September to November) which could have significant impacts on small-holder farmers and livestock systems. Hence, the nature and characteristics of drought vary temporally and across the entire Borana rangelands. This study can help policymakers and practitioners devise the necessary adaptation and mitigation strategies including identification of drought prone areas and mapping drought affected areas, involvement of local communities in drought preparedness plans and responses, infrastructural development such as roads and digging of deep wells, sustainable natural resources management, establishing strong local institutions, improving communication and dissemination of relevant information to help tackle or minimize drought and associated impacts. It is also recommended that future studies could deal with the impacts of drought on specific socio-economic and biophysical systems.
Data availability statement
The original contributions presented in the study are included in the article/Supplementary material, further inquiries can be directed to the corresponding author.
Author contributions
MW: Conceptualization, Data curation, Formal Analysis, Investigation, Methodology, Resources, Software, Supervision, Validation, Writing–original draft, Writing–review and editing.
Funding
The author(s) declare that no financial support was received for the research, authorship, and/or publication of this article.
Acknowledgments
The author thanks the Ethiopian Meteorological Institute for providing the data used in this study free of charge. The author also thanks the editor and the reviewers who provided their genuine comments that really improved the manuscript.
Conflict of interest
The author declares that the research was conducted in the absence of any commercial or financial relationships that could be construed as a potential conflict of interest.
Publisher’s note
All claims expressed in this article are solely those of the authors and do not necessarily represent those of their affiliated organizations, or those of the publisher, the editors and the reviewers. Any product that may be evaluated in this article, or claim that may be made by its manufacturer, is not guaranteed or endorsed by the publisher.
References
Abbas, A., Waseem, M., Ahmad, R., Ahmed-khan, K., Zhao, C., and Zhu, J. (2022a). Sensitivity analysis of greenhouse gas emissions at farm level: case study of grain and cash crops. Environ. Sci. Pollut. Res. 29, 82559–82573. doi:10.1007/s11356-022-21560-9
Abbas, A., Zhao, C., Waseem, M., Ahmed-khan, K., and Ahmed, R. (2022b). Analysis of energy input-output of farms and assessment of greenhouse gas emissions: a case study of Cotton growers. Front. Environ. Sci. 9, 826838. doi:10.3389/fenvs.2021.826838
Adnew, M., Tadesse, Y., and Bewket, W. (2021). Spatiotemporal variability and trends of drought episode in southeastern Ethiopia. Phys. Geogr. 43, 534–561. doi:10.1080/02723646.2021.1930654
Anose, F. A., Beketie, K. T., Zeleke, T. T., Ayal, D. Y., Feyisa, G. L., and Haile, B. T. (2022). Spatiotemporal analysis of droughts characteristics and drivers in the Omo-Gibe River basin, Ethiopia. Environ. Syst. Res. 11, 3. doi:10.1186/s40068-022-00246-8
Ayal, D. Y., Tilahun, K., Ture, K., and Zeleke, T. T. (2021). Psychological dimensions of climate change: perceptions, collective efficacy, and responses in Berehet District, north Shoa, Ethiopia. Clim. Change 165 (32), 32. doi:10.1007/s10584-021-03033-z
Chitedze, I., and Chikabvumbwa, S. R. (2021). Assessing the impact of spatio-temporal drought regimes using timescale standardized precipitation index in Malawi. J. Sustain. Dev. energy water Environ. Syst. 9 (4), 1–13. doi:10.13044/j.sdewes.d8.0341
Coppock, L., Getachew, G., Solomon, D., Sintayehu, M., and Seyoum, T. (2008). “Are cattle dieoffs predictable on the Borena Plateau?,” in Global livestock research support program (Los Angeles, CA, United States: University of California).
Danandeh, M. A., Sorman, A. U., Kahya, E., and Hesami, A. M. (2020). Climate change impacts on meteorological drought using SPI and SPEI: case study of Ankara, Turkey. Hydrological Sci. J. 65 (2), 254–268. doi:10.1080/02626667.2019.1691218
Debela, N., McNeil, D., Bridle, K., and Mohammed, C. (2019). Adaptation to climate change in the pastoral and agropastoral systems of Borana, south Ethiopia: options and barriers. Am. J. Clim. Change 8, 40–60. doi:10.4236/ajcc.2019.81003
Degefu, M. A., and Bewket, W. (2013). Trends and spatial patterns of drought incidence in the Omo Ghibe River Basin, Ethiopia. Geogr. Ann. Ser. A, Phys. Geogr. 97, 395–414. doi:10.1111/geoa.12080
Desalegn, Y. A., Maren, R., Solomon, D., and Getachew, G. (2018). Climate variability, perceptions of pastoralists and their adaptation strategies: implications for livestock system and diseases in Borana zone. Int. J. Clim. Change Strategies Manag., doi:10.1108/IJCCSM-06-2017-0143
El Kenawy, A. M., Mc Cabe, M. F., Vicente Serrano, S. M., López Moreno, J. I., and Robaa, S. M. (2016). Changes in the frequency and severity of hydrological droughts over Ethiopia. Cuad. De. Investig. Geográfca 42 (2), 145–156. doi:10.18172/cig.2925
Gemedo, D., Maass, B. L., and Isselstein, J. (2006). Rangeland condition and trend in the semiarid Borana lowlands, southern Oromia, Ethiopia. Afr. J. Range Forage Sci. 23 (1), 49–58. doi:10.2989/10220110609485886
Getachew, B., and Temesgen, G. (2021). Spatiotemporal variability of agricultural drought and its association with climatic variables in the Upper Awash Basin, Ethiopia. SN Appl. Sci. 3, 465. doi:10.1007/s42452-021-04471-1
Gibbs, W., and Maher, J. (1967). Rainfall deciles as drought indicators. Bureau of Meteorology Bulletin, No. 48. Melbourne: Commonwealth of Australia.
Gidey, E., Dikiniya, O., Sebego, R., Segosebe, E., and Zenebe, A. (2018). Modeling the spatio-temporal meteorological drought characteristics using the standardized precipitation index (SPI) in raya and its environs, northern Ethiopia. Earth Syst. Environ. 2, 281–292. doi:10.1007/s41748-018-0057-7
Guteirrez, A. P. A., Engle, N. L., Erwin, D. N., Molejon, C., and Martins, E. S. (2014). Drought preparedness in Brazil. Weather Clim. Extrem. 3, 95–106. doi:10.1016/j.wace.2013.12.001
Haile, B. T., Beketie, K. T., Zeleke, T. T., Ayal, D. Y., Feyisa, G. L., and Anose, F. A. (2022). Drought analysis using standardized evapotranspiration and aridity index at bilate watershed: sub-basins of Ethiopian Rift Valley. Sci. World J. 2022, 1–14. doi:10.1155/2022/1181198
Howard, A., Gurrapu, S., Chipansh, A., and Sauchyn, D. (2014). “Comparison of the SPI and SPEI on predicting drought conditions and streamflow in the Canadian Prairies,” in 28th Conference on Hydrology, American Meteorological Society, Atlanta, USA, February, 2014.
IPCC (2014). Contribution of working group I to the fifth assessment report of the intergovernmental Panel on climate change. Cambridge, UK: Cambridge University Press.
Kalisa, W., Zhang, J., Igbawua, T., Ujoh, F., Ebohon, O. J., Nnamugize, J. N., et al. (2020). Spatio-temporal analysis of drought and return periods over the East African region using Standardized Precipitation Index from 1920 to 2016. Agric. Water Manag. 237, 106195. doi:10.1016/j.agwat.2020.106195
Kassaye, A. Y., Shao, G., Wang, X., and Wu, S. (2021). Quantification of drought severity change in Ethiopia during 1952-2017. Environ. Dev. Sustain. 23, 5096–5121. doi:10.1007/s10668-020-00805-y
Korecha, D., and Barnston, A. G. (2007). Predictability of june–september rainfall in Ethiopia. J. Am. Meteorological Soc. 135 (2), 628–650. doi:10.1175/MWR3304.1
Mao, Y., Wu, Z., He, H., Lu, G., Xu, H., and Lin, Q. (2017). Spatiotemporal analysis of drought in a typical plain region based on the soil moisture anomaly percentage index. Sci. Total Environ. 576, 752–765. doi:10.1016/j.scitotenv.2016.10.116
McKee, T. B., Doesken, N. J., and Kleist, J. (1993). “The relationship of drought frequency and duration to timescales,” in 8th conference on applied climatology, Anaheim, January, 1993.
McKee, T. B., Doesken, N. J., and Kleist, J. (1995). Drought monitoring with multiple time scales. Appl. Climatol., 233–236.
Mehr, A. D., and Vaheddoost, B. (2020). Identification of the trends associated with the SPI and SPEI indices across Ankara, Turkey. Theor. Appl. Climatol. 139, 1531–1542. doi:10.1007/s00704-019-03071-9
Mera, G. A. (2018). Drought and its impacts in Ethiopia. Weather Clim. Extrem. 22, 24–35. doi:10.1016/j.wace.2018.10.002
Morsy, M., Moursy, F. I., Sayad, T., and Shaban, S. (2022). Climatological study of SPEI drought index using observed and CRU gridded dataset over Ethiopia. Pure Appl. Geophys. 179 (2022), 3055–3073. doi:10.1007/s00024-022-03091-z
Mutsotso, R. B., Sichangi, A. W., and Makokha, G. O. (2018). Spatio-temporal drought characterization in Kenya from 1987 to 2016. Adv. Remote Sens. 7, 125–143. doi:10.4236/ars.2018.72009
Palmer, W. C. (1965). Meteorological drought. Washington, DC: US Department of Commerce, Weather Bureau.
Pekpostalci, D. S., Tur, R., and Mehr, A. D. (2023). Spatiotemporal variations in meteorological drought across the Mediterranean region of Turkey. Pure Appl. Geophys. 180, 3089–3104. doi:10.1007/s00024-023-03312-z
Quenum, G. M. L. D., Klutse, N. A. B., Dieng, D., Laux, P., Arnault, J., Kodja, J. D., et al. (2019). Identification of potential drought areas in west Africa under climate change and variability. Earth Syst. Environ. 3, 429–444. doi:10.1007/s41748-019-00133-w
Senay, G. B., Velpuri, N. M., Bohms, S., Budde, M., Young, C., Rowland, J., et al. (2015). Hydro-meteorological hazards, risks, and disasters. Amsterdam, Netherlands: Elsevier Science. doi:10.1016/B978-0-12-394846-5.00009-6
Shahid, S., and Behrawan, H. (2008). Drought risk assessment in the western part of Bangladesh. Nat. Hazards 46, 391–413. doi:10.1007/s11069-007-9191-5
Shepard, D. (1968). “A two-dimensional interpolation function for irregularly spaced data,” in Proceedings of the 1968 23rd ACM national conference, New York, NY, United States, August, 1968, 517–523. doi:10.1145/800186.810616
Terefe, A., Ebro, A., and Tessema, Z. K. (2012). Rangeland dynamics in south Omo zone of southern Ethiopia: assessment of rangeland condition in relation to altitude and grazing types. Livest. Res. Rural Dev. 22 (10). https://edepot.wur.nl/156798.
Tesfamariam, B. G., Gessesse, B., and Melgani, F. (2019). Characterizing the spatiotemporal distribution of meteorological drought as a response to climate variability: the case of rift valley lakes basin of Ethiopia. Weather Clim. Extrem. 26, 100237. doi:10.1016/j.wace.2019.100237
Teshome, A., and Zhang, J. (2019). Increase of extreme drought over Ethiopia under climate warming. Adv. Meteorology 2019, 1–18. doi:10.1155/2019/5235429
Thornthwaite, C. W. (1948). An approach toward a rational classification of climate. Geogr. Rev. 38 (1), 55–94. doi:10.2307/210739
Tufa, D., Madeleine, C. T., Remi, C., John, del C., Pietro, C., James, H., et al. (2017). Enhancing national climate services (ENACTS) for development in Africa. Clim. Dev. 10, 664–672. doi:10.1080/17565529.2017.1405784
Ullah, I., Ma, X., Yin, J., Asfaw, T. G., Azam, K., Syed, S., et al. (2021). Evaluating the meteorological drought characteristics over Pakistan using in situ observations and reanalysis products. Int. J. Climatol. 41, 4437–4459. doi:10.1002/joc.7063
Vicente-Serrano, S., Miralles, D., Dominguez-Castro, F., Azorin-Molina, C., El Kenawy, A., McVicar, T., et al. (2017). “A proposed robust approach for calculating the standardized evapotranspiration deficit index (SEDI) at the global scale,” in Proceedings of First International Electronic Conference on the Hydrological Cycle. Basel: MDPI, November, 2017. doi:10.3390/chycle-2017-04832
Vicente-Serrano, S. M., Begueria, S., and Lopez-Moreno, J. I. (2010). A multi-scalar drought index sensitive to global warming: the Standardized Precipitation Evapotranspiration Index. J. Clim. 23, 1696–1718. doi:10.1175/2009JCLI2909.1
Viste, E., Korecha, D., and Sorteberg, A. (2013). Recent drought and precipitation tendencies in Ethiopia. Theor. Appl. Climatol. 112, 535–551. doi:10.1007/s00704-012-0746-3
Wang, F., Wang, Z., Yang, H., and Zhao, Y. (2018). Study of the temporal and spatial patterns of drought in the Yellow River basin based on SPEI. Sci. China Earth Sci. 61, 1098–1111. doi:10.1007/s11430-017-9198-2
Wilhite, D. A., and Glantz, M. H. (1985). Understanding the drought phenomenon: the role of definitions. Water Int. 10, 111–120. doi:10.1080/02508068508686328
Wilhite, D. A., and Smith, M. B. (2005). Drought and water crisis: science, Technology and management issues. Oxfordshire, United Kingdom: Taylor and Francis. doi:10.1201/9781420028386
Worku, M. A., Feyisa, G. L., and Beketie, K. T. (2022). Climate trend analysis for a semi-arid Borana zone in southern Ethiopia during 1981–2018. Environ. Syst. Res. 11, 2. doi:10.1186/s40068-022-00247-7
World Meteorological Organization (2012). Standardized precipitation index user guide. Geneva, Switzerland: WMO.
Xu, L., Chen, N., and Zhang, X. (2018). Global drought trends under 1.5 and 2 C warming. Int. J. Climatol., 1–11. doi:10.1002/joc.5958
Yared, A. B., Semu, A. M., Xuan, Y., Van Andel, S. J., Maskey, Sh., Solomatine, D. P., et al. (2015). Spatio-temporal assessment of meteorological drought under the influence of varying record length: the case of Upper Blue Nile Basin, Ethiopia. Hydrological Sci. J., 1–16. doi:10.1080/02626667.2015.1032291
Yihdego, Y., Vaheddoost, B., and Al-Weshah, R. A. (2019). Drought indices and indicators revisited. Arabian J. Geosciences 12, 69. doi:10.1007/s12517-019-4237-z
Yimer, M., Fantaw, Y., Menfese, T., and Kindie, T. (2018). Meteorological drought assessment in north east highlands of Ethiopia. Int. J. Clim. Change Strategies Manag. 10 (1), 142–160. doi:10.1108/IJCCSM-12-2016-0179
Yirga, S. A. (2021). Spatio-temporal analysis of drought variability in central Ethiopia. J. Water Clim. Change 12, 1778–1787. doi:10.2166/wcc.2020.226
Yu, M., Li, Q., Hayes, M. J., Svoboda, M. D., and Heim, R. R. (2014). Are droughts becoming more frequent or severe in China based on the standardized precipitation evapotranspiration index: 1951-2010? Int. J. Climatol. 34, 545–558. doi:10.1002/joc.3701
Keywords: drought severity, semi-arid Borana, spatiotemporal, SPI, SPEI, Ganna, Hagayya
Citation: Worku MA (2024) Spatiotemporal analysis of drought severity using SPI and SPEI: case study of semi-arid Borana area, southern Ethiopia. Front. Environ. Sci. 12:1337190. doi: 10.3389/fenvs.2024.1337190
Received: 14 November 2023; Accepted: 16 February 2024;
Published: 01 March 2024.
Edited by:
Abu Reza Md. Towfiqul Islam, Begum Rokeya University, BangladeshReviewed by:
Babak Vaheddoost, Bursa Technical University, TürkiyeAdnan Abbas, Nanjing University of Information Science and Technology, China
Devendra Singh, Dr. Rajendra Prasad Central Agricultural University, India
Copyright © 2024 Worku. This is an open-access article distributed under the terms of the Creative Commons Attribution License (CC BY). The use, distribution or reproduction in other forums is permitted, provided the original author(s) and the copyright owner(s) are credited and that the original publication in this journal is cited, in accordance with accepted academic practice. No use, distribution or reproduction is permitted which does not comply with these terms.
*Correspondence: Mitiku Adisu Worku, adismite2011@gmail.com