Industrial and agricultural land uses affected the water quality and shaped the bacterial communities in the inflow rivers of Taihu Lake
 Shuang Liu
 Jing Lu
 Evelien M. Adriaenssens
 Jianjun Wang
 Alan J. McCarthy
 Raju Sekar
- 1Department of Biological Sciences, School of Science, Xi’an Jiaotong-Liverpool University, Suzhou, China
- 2Department of Forestry and Environmental Management, Universidad Politécnica de Madrid (UPM), Madrid, Spain
- 3Quadram Institute Bioscience, Norwich, United Kingdom
- 4State Key Laboratory of Lake Science and Environment, Nanjing Institute of Geography and Limnology, Chinese Academy of Sciences, Nanjing, China
- 5Institute of Infection, Veterinary and Ecological Sciences, University of Liverpool, Liverpool, United Kingdom
Taihu Lake is the third-largest freshwater lake in China and is vital as a drinking water source, as well as for irrigation water, flood control, and other functions. Taihu Lake is connected to many inflow rivers, which contribute to the water resource but also to its pollution. Investigating the correlation between water quality, bacterial community structure, and land-use types is essential for pollution control. Yet, few studies have been conducted on all the major inflow rivers of Taihu Lake. This study aimed to assess the bacterial community composition of major inflow rivers of the lake and determine the relationship between the bacterial community, water quality, and land-use. Water samples were collected from ten inflow rivers across four seasons in 2019–2020. DNA extracted from the samples was used for 16S rRNA gene-targeted next-generation sequencing to determine the bacterial community structures. Thirteen physicochemical and microbiological parameters were used to assess the water quality, and the land-use pattern surrounding each sampling location was also profiled. The bacterial community composition demonstrated significant seasonal variation. In summer, the community variation was correlated with chlorophyll a, pH, and phosphate-P, and electric conductivity, nitrate-N, and ammonium-N in winter. Rivers in the northwest were more nutrient-rich than those in the southwest. The industrial, residential, and agricultural land-use categories correlated strongly with the bacterial community composition and water nutrient parameters. Accordingly, farmland drainage, untreated domestic wastewater, and industrial pollution were identified as the major objectives for more effective water quality management in the region.
1 Introduction
Freshwater is an essential source of life on earth, as it provides water for human consumption, functions in agriculture, aquaculture, industries, flood control, and power generation, while also contributing positively to ecology and biodiversity (Nyingi et al., 2013; Biddanda, 2017; Guo et al., 2020). However, deterioration of surface water quality has become a significant worldwide problem (UNESCO, 2019; Yi et al., 2019). Freshwater systems are being polluted by excessive levels of inorganic nutrients, pharmaceutical compounds, heavy metals, and pathogenic microbes (Okada et al., 2018; Koch et al., 2019; Yi et al., 2019).
Water quality in China has declined in recent decades due to rapid urbanization and industrialization (Liu and Raven, 2010; Ma et al., 2022). Although measures have been continuously taken to control pollution, the problems of eutrophication, antibiotics, heavy metals, microbial pathogens, and other pollutants persist (Xu et al., 2014; Mekonnen and Hoekstra, 2015; Zhang et al., 2015; Zhao et al., 2018; Yang et al., 2020). Deaths and illnesses including diarrhoea and liver and gastric cancers caused by the consumption of contaminated water have been reported in some areas of China over the past decade (Tao and Xin, 2014; Chen et al., 2019). Eutrophication, the major concern for freshwater ecology in China, has been reported in lakes and rivers nationwide (Wang et al., 2019a; Wang et al., 2019b; Lin et al., 2021) and algal blooms remain a common unresolved issue in some water bodies (Paerl et al., 2011; Yu et al., 2020; Ma et al., 2022). As a consequence, it is important that pollution sources are identified and efficiently tracked, and management strategies properly developed.
Pollution is introduced into surface water systems through various natural and anthropogenic point and non-point sources (Vega et al., 1998; Yotova et al., 2021). Point sources are single identifiable entities such as wastewater treatment plant effluents (faecal pollution) and factory outlets (chemical pollution) (Islam et al., 2018). Non-point source pollution usually involves large land areas, with transportation of pollutants occurring overland, underground, or even through the atmosphere (USEPA, 2021). Examples include land runoff, precipitation, rainfall, melting snow, seepage and drainage (Liu et al., 2020). Excessive manure, chemical fertilizer or pesticides from agricultural land, toxic chemicals and oil from urban-domestic lands, and soil erosion from forestry or farmlands are the common sources of these pollutions (Bu et al., 2014; Rissman and Carpenter, 2015; USEPA, 2021). Correlating land-use types with sources of pollution will be helpful in the management and control of water quality. Previous studies conducted worldwide showed that the hotspots of water pollution lies around urban, agricultural, industrial and forest land uses (Wijesiri et al., 2018; Xu et al., 2019; Camara et al., 2019; Githinji et al., 2019). Some also concluded that human activity and land-use could have more influence on freshwater ecosystems than seasonal changes (Yu et al., 2018).
In addition to the chemical environment, the microbiological communities need to be considered as they play essential roles in biochemical cycles, food webs and ecosystem functioning (Liu et al., 2018). Next-generation sequencing (NGS) of environmental DNA has been used more recently to describe microbial community structures in freshwater habitats (Zheng et al., 2017; Tang et al., 2018; Ren et al., 2019; Shang et al., 2022). It has been reported that community structures varied in response to temperature, pH, salinity, geographical region, anthropogenic activities, and pollution (Sunagawa et al., 2015; Yang et al., 2016a; Yang et al., 2016b; Chi et al., 2021). Therefore, community structures can be a good indicator of perturbation in ecosystems. Microbial community profiling also provides information on the occurrence, or potential presence, of pathogenic bacteria, which should be monitored in relation to public health protection (Tan et al., 2015; Pereira et al., 2018). NGS has also been successfully used to identify faecal contamination in freshwater (Ashbolt, 2015; Unno et al., 2018; Vadde et al., 2019a). Studying the microbial community structure also provides data for the development of pollution tracking methods, such as microbial source tracking markers for faecal contamination (Vadde et al., 2019b; Mathai et al., 2020).
Taihu Lake is the third largest freshwater lake in China, and is essential for water supply, flood control, recreational activities, fisheries, tourism, transportation, and a drinking water source for approximately 30 million residents (Hu et al., 2017). The greater Taihu watershed is also essential for aquaculture and as a wildlife ecology resource (Cai et al., 2013; Cheng et al., 2014). However, the watershed is now facing environmental issues including deterioration of water quality and eutrophication, which lead to cyanobacterial blooms and cyanotoxin occurrence (Wu et al., 2018; Wang et al., 2021; Xu et al., 2021). These are believed to be the consequences of human and animal waste discharges, farmland runoff, as well as urban domestic, industrial, agriculture and wastewater treatment plant effluents (Ti et al., 2011; Huang et al., 2013; Xu et al., 2019; Zhang et al., 2019). Both small-scale (Guo et al., 2004; Tang et al., 2018) and macroscopic (Zhao et al., 2014; Sunagawa et al., 2015) land-use analyses were conducted in cities and rural towns around Taihu Lake. It was concluded that agricultural land, low- and mid-density residential areas, industrial and poultry factories were the main land-use types that could introduce pollution into the Lake. However, the pollution into Taihu Lake is not always discharged into the lake directly, especially under the strict control of the government in the recent decade. The inflow rivers, as reported previously, are the major contributors to eutrophication and algal blooming in Taihu Lake (Wang et al., 2011a; Du et al., 2017; Wu et al., 2018). Our previous study also reported heavy contamination including faecal pollution in Tiaoxi River, the major inflow river contributing 60% of water into Taihu Lake (Vadde et al., 2018).
The general ecological status and associated environmental parameters of the inflow rivers of Taihu Lake are of paramount importance, but there have been no comprehensive and systematic studies of their water quality and microbiology and also on the impacts of land-use on bacterial communities in the Taihu watershed. Here, the aim was to determine and correlate water quality parameters, bacterial community compositions, and land-use patterns for ten major inflow rivers of Taihu Lake to provide a much more complete environmental profile that will inform pollution and management practices. The results will help our understanding of how pollution sources affect freshwater ecology, enabling the prediction of pollution risks, the development of water quality management regimes, and urban planning.
2 Materials and methods
2.1 Study area and sampling locations
This study was conducted in the Taihu watershed, particularly targeting the inflow rivers located on the west side of the Taihu Lake (Figure 1). Among the 200 rivers connected to the lake, thirteen are considered as the main inflow rivers. Here, ten of these main inflow rivers selected for the study were Taige Canal (R1), Caoqiao River (R2), Yincun River (R3), Shedu River (R4), Chendong River (R5), Yang Jia Pu River (R6), Wuxi River (R7), Changxing River (R8), Tiaoxi River (R9) and Daqian River (R10). These rivers were selected largely because they contribute the highest volume of water (Wang et al., 2011a) and are the primary contributors of pollution including eutrophication-related nutrients (Qin et al., 2007; Wang et al., 2011a; Du et al., 2017; Vadde et al., 2018). In each river, three points (upstream, middle-stream and downstream) were selected as sampling locations. Three points in the Taihu Source Water Protection Area in Wuzhong district, Suzhou were selected as the control locations (Figure 1). At least two group members participated in all the sampling trips to avoid biases introduced during sampling and sample processing.
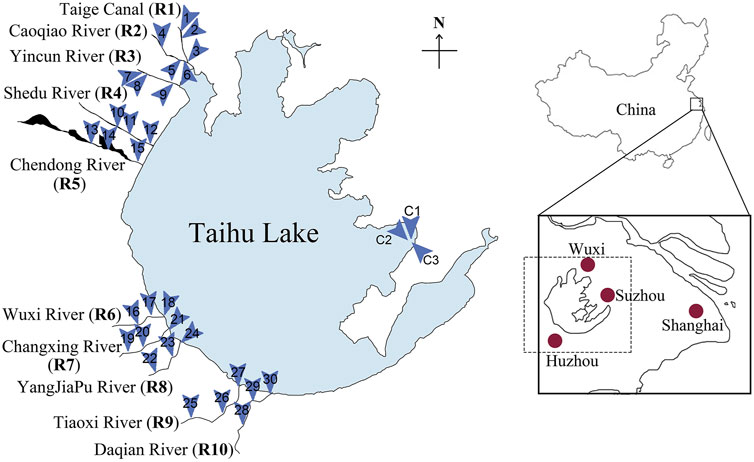
FIGURE 1. The locations of Taihu Lake, the inflow rivers and the selected sampling locations. The ten major inflow rivers (R1-R10) are located on the west side of Taihu Lake. Three sampling locations were selected for each inflow river; thirteen locations were selected in total (1-30). The control locations (C1-C3) in the Taihu Source Water Protection area can be found on the east side of Taihu Lake.
2.2 Collection of water samples
Water sampling was conducted once per season in spring 2019, summer 2019, summer 2020 and winter 2020. The surface water samples were collected from the 33 sampling locations including the controls. In total, 132 samples were collected. For each location, 5 L of surface water was directly collected using sterile polyethylene containers and kept at ambient temperature until brought to the laboratory for filtration and DNA extraction. Five hundred mL of water was directly collected in sterile polyethylene bottles and kept on ice during transport to the laboratory, where they were transferred to −20°C until processed for nutrient analyses. Fifty mL of water was also collected using sterile polypropylene centrifuge tubes. This sample was kept on ice until used for microbiological analyses. The air temperature (AT) and water temperature (WT), pH and electrical conductivity (EC) were measured on-site and recorded.
2.3 DNA extraction
Water samples (250 mL each) were filtered through an isopore™ 0.22 µm polycarbonate membrane filter (Merck, Germany) to collect the cellular fraction, with at least six filters prepared for each location. The filters were kept at −20°C until they were used for DNA extraction using the PowerSoil DNA Isolation Kit (MoBio Inc., Carlsbad, CA) according to the manufacturer’s instructions. This kit and procedure were used in our previous studies (Vadde et al., 2019b; Fernanda et al., 2022). At least three DNA extracts were prepared for each location and season. The concentrations and the quality of the DNA were measured using a NanoDrop 2000/2000c spectrophotometer (Thermo Fisher Scientific Inc., United States). Replicates were prepared until all the DNA samples achieved 1.8 < A260/A280 < 2.0 and A260/A230 > 1.5. The samples were stored at −80°C until required for further processing.
2.4 Bacterial community analysis by next-generation sequencing
Composite DNA samples from each inflow river were prepared by mixing DNA extracts from three locations. DNA extracts from each location with good quality and quantity (determined by Nanodrop measurement) were selected, and forty-four composite samples in total were prepared. The bacterial community composition of the pooled inflow river surface water DNA extracts was analysed by next-generation sequencing (NGS) of 16S rRNA gene amplicons. Sequencing was carried out at GENEWIZ Suzhou, China on an Illumina MiSeq (Illumina, San Diego, CA, United States) platform. Specially designed primers (Forward: 3′-CCTACGGRRBGCASCAGKVRVGAAT-5’; Reverse:3′-GGACTACNVGGGTWTCTAATCC-5′) were used in the 16S MetaVx™ method, targeting V3 and V4 hypervariable regions of the 16S rRNA genes. Indexed adapters were added to the ends of the amplicons by limited cycle PCR. The PCR products were then purified with magnetic beads. The concentration of the PCR products was determined using a microplate reader. The fragment sizes were examined by agarose gel electrophoresis. The library was then quantified to 10nM, and PE250/FE300 paired-end sequencing was performed as outlined in the Illumina MiSeq (Illumina, San Diego, CA, United States) manual. The MiSeq Control Software (MCS) was used to read the sequence information.
The sequences obtained in this study were submitted to the NCBI Short Read Archive (SRA) database under the accession numbers 29255681 to 29255724.
2.5 Processing of sequencing data and further analysis
Raw sequence data was processed in QIIME (1.9.1) and VSEARCH (1.9.6). Poor quality reads, chimaeras or short sequences (<200bp) were filtered out. Adaptor, primers, and barcode sequences were trimmed off to get the non-chimera effective reads. Sequences that appeared only once were removed, and the remaining reads were used for clustering of Operational Taxonomic Units (OTU) with a 97% similarity, using VSEARCH (version 1.9.6). The OTU sequences were aligned with the SILVA 138 16S rRNA reference database (Quast et al., 2012; Yilmaz et al., 2014), and the RDP (Ribosomal Database Program) Classifier (Wang et al., 2007a) was used to make taxonomic assignments. Consequently, community structure was analyzed at different phylogenetic levels.
2.6 Water physicochemical analysis
In addition to the parameters measured on-site, total nitrogen (TN), Total phosphorus (TP), nitrate nitrogen (NO3-N), nitrite nitrogen (NO2-N), ammonium nitrogen (NH4-N), phosphate (PO4-P), total organic carbon (TOC) and chlorophyll a (Chl a) were measured in the lab. TN and TP were determined by peroxodisulphate oxidation and spectrophotometric methods (Ebina et al., 1983). NO3-N, NO2-N, NH4-N, and PO4-P were determined as described by Wang et al. (2011b). TOC was analysed by high-temperature oxidation using a Shimadzu analyser (model 5,000; Tokyo, Japan). Chl a values were quantified by acetone extraction and spectrophotometry methods as described by American Public Health Association (APHA, 2005).
2.7 Microbiological analyses
Total coliform (TC) and faecal coliform (FC, or thermotolerant coliforms) were quantified as described previously (Vadde et al., 2018) within 24 h of sample collection. For TC quantification, 100 μL of each sample was plated on Harlequin™ Escherichia coli/coliform medium (LabM, Heywood, UK) and the plates were incubated at 37°C for 24 h. The blue colonies (E. coli) and pink-purple colonies (coliforms) were counted, and the TC expressed in cfu/mL. FC values were determined by filtering 2 mL of water samples through isopore™ 0.45 µm gridded mixed cellulose ester (MCE) membrane filters (Merck, Germany). The membranes were placed with gridded side up on mFC agar plates (HopeBio, Qingdao) and incubated at 45.5°C for 24 h. Colonies with blue shades were counted and the FC values were expressed in cfu/100 mL.
2.8 Land-use pattern analysis
The land-use maps were prepared using the geographical information system software ArcGIS 10.3 and ArcGIS Pro. Based on the Google Earth China Service Map of cities around Taihu Lake, a layer of buffer zones with a radius of 1 km around each sample point was created. The 1 km catchment radius was selected based on the 15-min pedestrian-scale neighbourhood with a complete provision of required basic services and facilities in accordance with the Chinese national standard for urban residential area planning and design (GB 50180-2018) (MOHURD, 2018). This could fully represent the diversity of land-use types around one particular point in a typical Chinese city, with avoidance of biases due to selection of the location (Yang, 2008). By referencing the official land-use maps of Changzhou, Wuxi, and Huzhou, as well as Google Earth and Baidu maps covering the sample areas, the detailed land-use classifications were digitized within these buffer zones per the national Code for classification of urban land-use and planning standards of development land (GB50137-200) (MOHURD, 2011) and the recently released national Guidance of Territorial Spatial Investigation, Plan, Land use control Classification (MOHURD, 2020). The Tier-2 classification percentages were averaged for three sampling locations in each river to represent the land-use status, and this was used in the clustering analysis.
2.9 Statistical analyses
Microsoft Excel was used for data entry and basic processing of raw data. R (version 4.0.3) and R studio (version 1.4.1717) were used for further data analyses. Spatial and seasonal variations of physicochemical and microbiological parameters were analysed by one-way analysis of variance (ANOVA) in R. Principal Component Analysis (PCA) of water quality was done using the R code “princomp” after confirmation with Kaiser-Meyer-Olkin (KMO) and Bartlett’s tests. WT was not included in the PCA to avoid its impact on the seasonal distribution pattern.
The rivers were clustered for each season based on both water quality (EC, pH, TN, TP, NO3-N, NO2-N, PO4-P, NH4-N, TOC, Chl a) and Tier-2 land-use status (municipal and services, logistics and transportation, industrial, residential, green spaces, semi-artificial landscape, semi-natural landscape and others). Hierarchical clustering was performed using normalized data with a target of four clusters for each season.
For the microbial community analyses, alpha diversity calculations, including Shannon diversity index, Simpson diversity index, abundance-based coverage estimator (ACE), Chao1 richness estimator and good’s coverage were calculated using QIMME (1.9.1). Permutational Multivariate Analysis of Variance (PERMANOVA, performed in R using “adonis2” in the “vegan” package) was used to identify the differences in the microbial community between four seasons and between rivers in different locations.
3 Results
3.1 Alpha-diversity of the bacterial community
Forty-four composite DNA samples extracted from inflow rivers and control locations were profiled by sequencing the 16S rRNA gene amplicons and the diversity and community compositions were analysed. A total of 2,423,270 non-chimera effective reads were generated, and the number of reads in the individual samples ranged from 35,202 to 86,820. The read number was normalized to 21,268 after removing the sequences that appeared only once. In total, 868 OTUs were generated (similarity <97%). The rarefaction curves based on these data are shown in Supplementary Figure S1. The read and OTU numbers, Good’s coverage, alpha diversity indices including ACE and Chao1 for community richness and Shannon and Simpson for community diversity for individual samples are shown in Supplementary Table S1.
The results showed similar average diversity and richness for summer and spring-winter samples, with no significant changes between seasons (p > 0.05), although detailed analysis does show that the structures were quite distinct. This could also be related to the high variance introduced by the spatial changes. Samples collected from R3 in summer 2020 (SU20-R3) had the most OTUs (600) among all samples, as well as the highest diversity (Shannon = 7.445, Simpson = 0.987). The highest richness was observed in the samples from R5, summer 2019 (ACE = 663, Chao1 = 679). On the contrary, R10 samples collected in the summer 2020 had the fewest OTU number (394) and the lowest richness (ACE = 474. Chao1 = 487). R4 in winter 2020 showed the lowest level of diversity (Shannon = 4.799, Simpson = 0.851).
The OTUs were classified from phylum to genus levels. In total, 30 different bacterial phyla were identified, with the predominant phyla Proteobacteria, Bacteroidota, Actinobacteria and Cyanobacteria accounting for over 90% of the relative abundance in all samples (Figure 2). No significant differences were observed in the bacterial community profile between the control locations and the inflow rivers at the phylum level. The control locations were not included in further analyses but used as a reference. The composition of phyla varied both seasonally and spatially. Bacteroidota and Cyanobacteria were more abundant in summer seasons than spring and winter, and the opposite pattern was observed for Proteobacteria and Actinobacteria. Proteobacteria was the most abundant phylum observed in winter 2020 (26.6%–75.2% with a mean of 43.0%), followed by spring 2019 (24.6%–76.2% with a mean of 41.5%). Proteobacteria was significantly less abundant in the warm seasons (summers 2019 and 2020) than cold seasons (spring 2019 and winter 2020) (p < 0.05). However, high relative abundance of Proteobacteria (59.4%–76.2%) was also observed in R4 in all four seasons. Bacteroidota was the second most abundant phylum observed. There was a clear pattern that Bacteroidota was significantly higher in summer than in spring and winter (43.0% vs 22.6%; p < 0.001). The highest proportion of Bacteroidota was found in Tiaoxi River (R9) in summer 2020, accounting for 67.7% of the total community. Actinobacteria, similar to Proteobacteria, was also significantly more abundant in spring and winter (4.9%–48.8%) than in summer (1.9%–34.5%) (p < 0.001). On the contrary, Cyanobacteria occupied 2.1%–12.5% of the communities with an average of 6.6% in summer and 0.01%–6.9% with an average of 1.7% in cold seasons, showing a significant increase in warm seasons (p < 0.001).
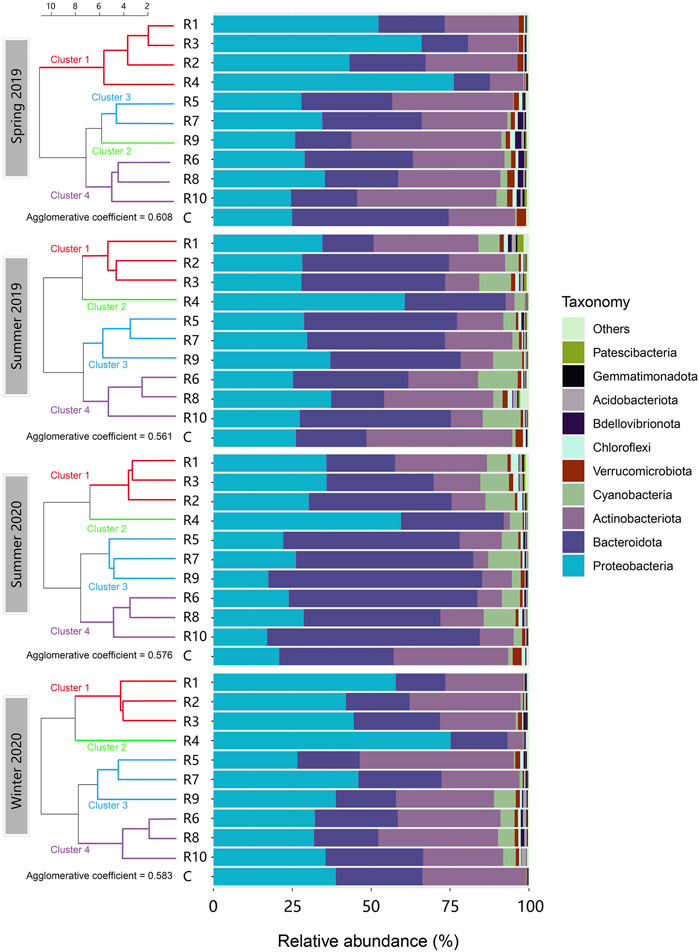
FIGURE 2. Phylum-level composition of the microbial communities in the inflow rivers in the four seasons aligned with clustering. (R1, Taige Canal; R2, Caoqiao River; R3, Yincun River; R4, Shedu River; R5, Chendong River; R6, Yang Jia Pu River; R7, Wuxi River; R8, Changxing River; R9, Tiaoxi River; R10, Daqian River.) The top ten abundant phyla found in the surface water samples are shown in this figure. Proteobacteria, Bacteroidota, Actinobacteria, and Cyanobacteria were the predominant phyla which accounted for more than 90% of the bacterial community. The clusters in different colours are shown on the left.
Of 125 identified order-level OTUs, Burkholderiales, Flavobacteriales, Frankiales and Chitinophagales were the predominant orders and accounted for over 50% of the community in all samples (Supplementary Figure S2). At the genus level, a total of 298 different genera were identified across all the samples. The relative abundances of the top twenty-one genus-level OTUs are shown in Figure 3. These OTUs in sum accounted for at least 50% of the relative abundance in each microbial community. Flavobacterium (Bacteroidota), hgcI_clade (Actinobacteria) and Methylotenera (Proteobacteria) were the predominant genus-level OTUs observed. Flavobacterium was the major genus that contributed to Bacteroidota abundance in this study. It was most abundant in the summer seasons. HgcI_clade was more abundant in spring 2019 and winter 2020, but it also showed high spatial variations. R4 had the lowest relative abundance of HgcI_clade (1.08%–5.07%) in all seasons, while the other rivers had varying abundance across seasons. Methylotenera was clearly more abundant in spring and winter than in summer. They were also found more abundant in the rivers located in the northwest (R1-R4) of Taihu Lake, especially in R4. Spatial and seasonal changes were also observed in other genus-level OTUs.
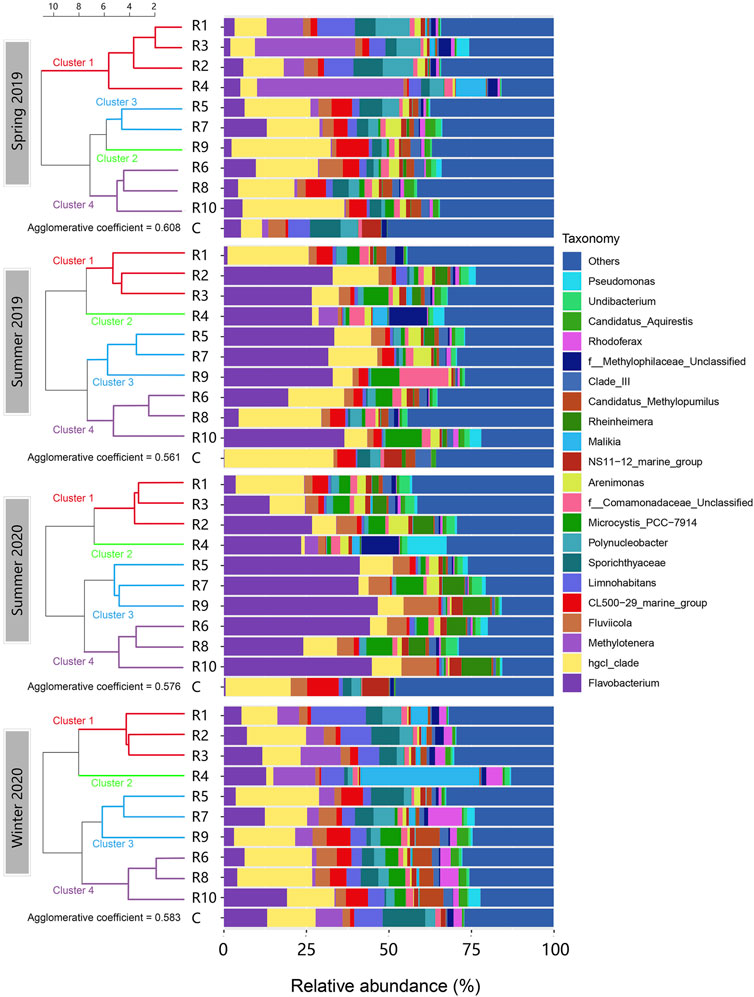
FIGURE 3. Genus-level composition of the microbial communities in the inflow rivers in the four seasons aligned with clustering. (R1, Taige Canal; R2, Caoqiao River; R3, Yincun River; R4, Shedu River; R5, Chendong River; R6, Yang Jia Pu River; R7, Wuxi River; R8, Changxing River; R9, Tiaoxi River; R10, Daqian River.) The top twenty-one abundant genus-level OTUs found in the surface water samples are shown in this figure. Flavobacterium, hgcI_clade, Methylotenera and Fluviicola were the OTUs with the highest average abundance. The clusters in different colours are shown on the left.
3.2 Beta-diversity of bacteria and community composition
The bacterial community data were analysed using multivariate statistics to assess the beta-diversity. The analyses showed the differences in the bacterial community structures between seasons or between rivers. PCoA (principal co-ordinate analysis) results showed that two main co-ordinates contributed to the variation among samples (Figure 4). PCoA 1 and 2 together explained 47.67% of the variations. PCoA 1 explained 32.17% of the variation, while PCoA 2 explained 15.50%. Permutational Multivariate Analysis of Variance (PERMANOVA) allowed comparisons of multiple variables between grouped multiple samples (Figure 4). The bacterial community structure significantly varied across seasons according to the overall PERMANOVA test (p < 0.001) (Figure 4A). Pairwise PERMANOVA showed significant differences between spring 2019 and summer 2019 (p < 0.01), spring 2019 and summer 2020 (p < 0.001), summer 2019 and winter 2020 (p < 0.001), and summer 2020 and winter 2020 (p < 0.001). There were no significant differences in the bacterial community compositions between the two cold seasons (spring and winter) or between the two summers. For location comparisons, the clustering is shown in Figure 4B. A significant difference was observed between rivers located in the northwest side of Taihu Lake (Jiangsu Province) and those located in the southwest (Zhejiang Province) (p < 0.05).
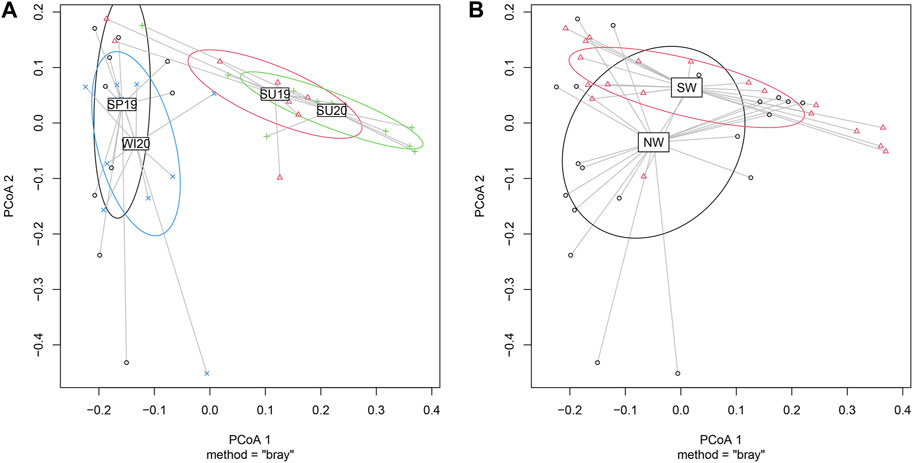
FIGURE 4. Clustered PCoA showing differences in microbial community structures between (A) seasons and (B) geographical locations. (SP19, spring of 2019; SU19, summer of 2019; SU20, summer of 2020; WI20, winter of 2020). The PcoA figures were plotted based on the genus-level microbial community structures. PCoA 1 explained 32.17% of the variation, while PCoA 2 explained 15.50%. (A) Samples collected in cold seasons (spring 2019 and winter 2020) mostly overlapped, while the samples collected in warm seasons (summer 2019 and summer 2020) overlapped. Significant differences were observed between cold seasons and warm seasons (p < 0.001). (B) Samples collected in the NW also differed significantly from samples collected in SW (p < 0.05).
3.3 Water quality analyses
Water physicochemical and microbiological characteristics at the selected sampling locations in the summer and winter of 2020 are shown in Supplementary Figure S3. Results for the spring and summer of 2019 have been reported previously (Fernanda et al., 2022). Two-way ANOVA showed that all parameters except water temperature (WT) showed spatial differences between rivers, while all parameters except chlorophyll a showed significant seasonal variation (Supplementary Table S2). WT, EC, pH, TP, NO2-N, NH4-N, PO4-P and Chl a significantly varied with the combined effects of spatial and seasonal impacts.
The PCA results showed the distribution of water physico-chemical and microbiological parameters (Figure 5). PC1 explained 33.1% of the total variation, which was mainly composed of negative loadings of TN, NH4-N, NO3-N, EC and TOC and positive loadings of Chl a, higher pH, PO4-P and FC. PC2, which explained 23.4% of the total variation, mainly comprised positive loadings of most of the parameters, especially TC, FC, PO4-P, NO2-N. pH had a weak negative loading of PC2. The samples were clearly separated by seasons. Samples collected in spring 2019 and winter 2020 were clustered towards negative PC1, showing that TN, NH4-N, NO3-N, EC and TOC were the major factors that influenced the samples in cold seasons. Samples collected in summer 2019 and summer 2020 were distributed towards positive PC1, indicating that increased Chl a, pH, PO4-P and FC were the main factors that affected the water quality in summer seasons. With respect to location, the rivers located on the northwest side of Taihu Lake, especially R1-R4, were more distributed towards positive PC2 in all seasons (Box 1 and Box 2 in Figure 5). This indicated that these rivers were subject to higher nutrients especially PO4-P and NO2-N, lower pH, and higher TC and FC counts, compared to the other rivers.
FIGURE 5. PCA of inflow river water quality distribution in different seasons. (SP19, spring of 2019; SU19, summer of 2019; SU20, summer of 2020; WI20, winter of 2020. R1, Taige Canal; R2, Caoqiao River; R3, Yincun River; R4, Shedu River; R5, Chendong River; R6, Yang Jia Pu River; R7, Wuxi River; R8, Changxing River; R9, Tiaoxi River; R10, Daqian River. Box 1: Samples most affected by TN, EC, NH4-N, NO3-N, and TOC. Box 2: Samples most affected by FC and PO4-P). The PCA was plotted based on the water physicochemical and microbiological characteristics of the inflow river water samples in four sampling seasons. Samples collected in different seasons are shown in different colours. PC 1 explains 33.1% of the variations. PC2 explains 23.4% of the variations.
3.4 Land-use analyses
Land-use in a radius of 1 km around each sampling location was analysed and categorized into 38 different second-tier and third-tier classifications, according to the national standard (MOHURD, 2011; MOHURD, 2020). The percentages of the land-use types around the sampling location are shown in Supplementary Figure S4, and Supplementary Table S3 explains the land-use categories. The most dominant land-use type was cultivated land, which occupied an average of 35% of the land around the sampling locations. This indicates that agriculture is the main activity occupying most of the inflow rivers’ land. The average percentage of cultivated land was highest near R4 (56.2%), R1 (51.8%), and R3 (48.0%), which are all located northwest of Taihu Lake.
The sum of low and mid-density residential land occupied on average 15.6% of the area near the sampling locations. R5 (23.3%) and R7 (22.6%) had the most residential land coverage. The residential areas were most evenly distributed near R1 (12.8%) and R2 (15.1%). With respect to industrial lands, Class A, B, and C industrial land added up to 10.37% of the area near sampling locations. The highest industrial land percentages were found around the R2 sampling locations (24.7%) and R1 locations (15.6%). Although the most densely distributed industrial lands were located near some of the R7 and R8 sampling locations in the southwest, Class C industrial lands were found only along R1, R2, and R3. Industrial lands were also evenly distributed along these three rivers in the northwest, unlike other rivers where industries appeared in only one or two locations. Semi-natural landscapes, including rivers, lakes, and forests, which are indicators of less anthropogenic footprints, were more abundant near R8 and R10, and least near the rivers in the northwest (R1-R4).
The land-use analyses showed the highest anthropogenic activities northwest of Taihu Lake. R1-R4 are located across industrialised towns. The sampling locations are mostly surrounded by agricultural land (52.3%, 34.7%, 49.1%, and 57.9%, respectively), industries (15.6%, 24.7%, 10.0%, and 10.6%), and some mid- or low-density residences (12.8%, 15.1%, 17.6%, and 11.9%, respectively). Areas near R6 and R8 locations most resemble traditional Chinese rural areas, as they are most affected by the vast cultivated land around them (44.8% and 39.5%). In comparison, the residential land is mainly low-density (9.3% and 10.4%). Locations around R5, R7, and R9 are more like small towns, where the road (6.5%, 10.2% and 11.4%) and mid-density residential land (21.1%, 15.8%, and 18.1%) occupy relatively higher proportions than other places. R10, however, showed the least impact of human activities and the most considerable abundance of semi-natural landscapes (21.2%). Overall, this profile aligns well with the nutrient levels of the inflow rivers, i.e., higher nutrient levels were observed where anthropogenic activities were abundant (Figure 5).
3.5 Clustering of water physicochemical and land-use patterns
The average water physicochemical parameter levels and the average land-use patterns of each river were combined to classify the ten rivers into four clusters (Table 1), and the contribution values are present in Supplementary Table S4. The clustering pattern was identical in summer 2019, summer 2020, and winter 2020. Cluster 1 (R1, R2, R3) featured high percentages of industrial land but lower percentages of semi-natural land. A higher industrial footprint were found around rivers in this cluster. Increased EC, TN, TP, NO3-N, NO2-N, and PO4-P were observed in these rivers. Cluster 2 had only R4, surrounded by semi-artificial lands indicating high agricultural activities. Municipal and services, residential land, green spaces, and semi-natural land were relatively lower around R4. Although this cluster showed soft TP, NO3-N, and PO4-P levels in the water, high EC, NH4-N, TOC, and low pH were found. High TN and Chl a levels were also observed in summer. Cluster 3 (R5, R7, R9) was not abundant in any of the nutrients. Logistic and transportation land, residential land, and others (mostly reserved land) were the predominant land-use types around this cluster. Cluster 4 (R6, R8, R10) featured the most abundant semi-natural lands and the lowest residential land percentages, representing the lowest anthropogenic activities. The rivers in this cluster also showed the most oligotrophic water of all the clusters.
TABLE 1. The Hierarchical clustering results of the ten inflow rivers based on the physicochemical features and land-use patterns. In spring 2019, cluster 1 = R1, R2, R3, R4; cluster 2 = R9; cluster 3 = R5, R7; cluster 4 = R6, R8, R10. In summer 2019, summer 2020, and winter 2020, cluster 1 = R1, R2, R3; cluster 2 = R4; cluster 3 = R5, R7, R9; cluster 4 = R6. R8, R10. (R1, Taige Canal; R2, Caoqiao River; R3, Yincun River; R4, Shedu River; R5, Chendong River; R6, Yang Jia Pu River; R7, Wuxi River; R8, Changxing River; R9, Tiaoxi River; R10, Daqian River).
The clustering results for spring 2019 were slightly different from the other seasons. Instead of a separate cluster, R4 was clustered with R1, R2, and R3 in cluster 1, possibly due to their similar nutrient levels observed in this season. This cluster represented high levels of industrial land, semi-artificial land, and low levels of semi-natural land. Elevated nutrient levels and a lower pH were also found in this cluster compared to the others. In addition, cluster 2 consisted only of R9, close to logistic and transportation lands, green spaces, and others. Water nutrient levels were lower in R9 as compared to the others. Cluster 3 (R5, R7) also showed low levels of most nutrients, but increased PO4-P. Municipal services lands and residential lands were the major land-use types here. Cluster 4 (R6, R8, R10) in spring 2019 still represents the least anthropogenic activities and the most oligotrophic water as in other seasons.
3.6 Relationship between environmental features and bacterial community structure
To investigate the relationships between rivers with more similar patterns of bacterial community structure, the phylum-level communities were clustered (Figure 2). In spring 2019, Cluster 1 (R1-R4) showed overall higher levels of Proteobacteria as compared to the other clusters. Bacteroidota and Actinobacteria occupied fewer percentages of the communities in cluster 1 than in the other clusters. Similarly in winter 2020, cluster 1 (R1, R2, R3) and cluster 2 (R4) were richer in Proteobacteria but less abundant in Bacteroidota and Actinobacteria. Cluster 1 (R1, R2, R3) in the summer seasons did not show a higher abundance of Proteobacteria than clusters 3 and 4, but cluster 2 still showed this pattern. Notably, R4 always showed the highest Proteobacteria and lowest Actinobacteria abundances among all rivers across the four seasons. Moreover, low Cyanobacteria abundance was observed in the spring and winter seasons, but rivers with less anthropogenic activities (R9, R6, R8, R10) clearly showed more cyanobacterial abundance than the others. Nonetheless, Cyanobacteria populations in summer did not show clear spatial change patterns.
Investigating the genus-level community structure and river clustering (Figure 3), Flavobacterium (Flavobacteriales) was the most abundant genus-level OTU in summer samples. It was lowest in the control and R1, and most abundant in R5, R7, R9 and R10. In spring and winter, the levels of Flavobacterium were significantly lower than in summer, and the spatial variation pattern was not aligned with the clustering. HgcI_clade was the most abundant genus-level OTU in spring and winter. R1-R4 in spring 2019 and winter 2020 showed relatively lower HgcI_clade abundance than the other rivers. In summer, R4 showed the lowest abundance of HgcI_clade compared to the other rivers. Moreover, some genus-level OTUs appeared in significantly higher abundance in eutrophic rivers like R1-R4 in spring and winter and R4 in summer than in other rivers. Examples include Methylotenera, Limnohabitans, Malikia and the unclassified Methylophilaceae group. Pseudomonas also had a high abundance in R4 in the summer seasons. In contrast, Fluviicola, CL500-29_marine group and the Candidatus Methylopumilus group were more abundant in clusters 3 and 4 where nutrient levels were lower.
4 Discussion
4.1 Physicochemical and microbiological features indicate water quality
The Ministry of Environmental Protection (MEP, renamed as Ministry of Ecology and Environment) of People’s Republic of China issued a surface water quality guideline in which all surface waters were classified at five levels (GB 3838-2002), class I (source water, national nature reservoir) being the highest quality and class V (agricultural water, common landscape water) being the lowest quality (MEP, 2002). Class III water was defined as “domestic and drinking water source second class reservoir, aquatic life wintering area, migration channels, aquaculture areas, fishery waters and swimming areas”, which is a healthy level for both water-related human activities and water ecosystems. In this study, at least one water sample across four seasons exceeded the acceptable limit for pH, TN, TP, NO2-N, NH4-N, PO4-P and FC for class III water, showing the need for stricter water quality monitoring and management.
For the microbiological features, TC has been used as a faecal contamination indicator in the US (USEPA, 2013). Earlier studies demonstrated that coliform groups could exist naturally in the environment, for example, in fresh and marine waters (Pisciotta et al., 2002; Baudart et al., 2009). Thus, this parameter is no longer used as an indicator for faecal contamination but still an indicator for drinking water quality and health risk assessments (e.g. (Zhang et al., 2018)). Faecal coliform is still used as a traditional indicator for faecal contamination in China, and the MEP guideline value for it is less than 1,000 per 100 mL (MEP, 2002). Exceeding levels of FC undoubtedly showed evidence of faecal pollution in the inflow rivers. Untreated domestic wastewater, runoff from poultry farms, application of human, and animal faeces as fertilizers can be the possible causes of this pollution. Tracking the sources of these faecal pollutions can contribute to management of water quality and public health.
The water physicochemical and microbiological parameters in the inflow rivers changed significantly both seasonally and spatially. The samples were clearly grouped by season and distributed on the positive (summer 2019 and 2020) and negative sides (spring 2019 and winter 2020) of PC1. This was consistent with the significant seasonal differences as presented in the ANOVA results shown in Supplementary Table S1. The PCA also showed that EC, TN, NH4-N, NO3-N, PO4-P, TC and FC are the major factors that contributed to the water quality variations. Similar spatial and seasonal variations were found in Tiaoxi River (R9) during 2014–2015, as one of our previous studies reported (Vadde et al., 2018). TN, NH4-N, NO3-N, PO4-P were observed as major influencing factors in other studies based on Taihu Lake (Paerl et al., 2011; Zheng et al., 2017; Wang et al., 2019a) and other water bodies around the world (Bai et al., 2020; Naranjo et al., 2019). These inputs were easily introduced to surface water by anthropogenic activities, especially through applications of fertilizers. Over the past decades, effective monitoring and control measures have been taken to reduce the pollution in the Taihu Lake (Sunagawa et al., 2015). However, excess nutrients still existed in the inflow rivers of Taihu Lake. This demonstrates that further management and maintenance of inflow river water quality is essential for the improvement of Taihu water quality and ecology. Tracking the sources of the pollution and implementation of appropriate policies could help to reduce these inputs.
As the PCA showed the major contributors to changes in water quality, the hierarchical clustering results showed that the water quality was well aligned with the land-use patterns. For example, cluster 1 in summer 2019, summer 2020, and winter 2020 included the most industrial lands (R1, R2, R3) and was highly consistent with the appearance of high TN, TP, NO3-N, NO2-N, and PO4-P. R4, which was notable among the rivers, showed the highest agricultural activities as well as high NH4-N, TOC, and EC. Cluster 3 (R5, R7, R9) categorised as municipal, transportation, and residential areas, was characterised by moderate water nutrient levels, while the least anthropogenically affected cluster 4 (R6, R8, R10) showed the most oligotrophic, but alkaline, water.
TN exceeding the acceptable limit of MEP (≤10 mg/L) showed the overall eutrophic status of the inflow rivers of Taihu Lake and especially cluster 1. NO3-N and NO2-N were the major TN contributors in this cluster, with NH4-N less so. NO3-N is a significant cause of water eutrophication. Chemical fertilizers, animal manure, industrial discharges, and effluent from wastewater treatment plants are the primary sources of NO3-N (Bakhsh et al., 2005; USEPA, 2009; USEPA, 2012). NO2-N was beyond the MEP limit in R1, R2, R3, and R8 in at least one season. Human and animal faecal contaminations, fertilizers, and natural deposit erosion are regarded as the main sources of NO2-N in surface water (Lucassen et al., 2004). In cluster 1, the combination of industrial and agricultural activities was probably the major explanation for the nutrient-rich status of these rivers. TP and PO4-P showed similar trends, and as Yan et al. (2015) stated, the causes of elevated phosphate content in water could be domestic wastewater, farmland runoff, and the use of animal manure in agriculture. Combining the potential sources and the land-use profile, the agricultural lands were probably the primary source of phosphates in this area. There is no MEP guideline value for PO4-P, but Shock et al. (2003) reported that PO4-P levels higher than 20 μg/L will lead to elevated algal growth. There was no significant correlation between PO4-P and Chl a in this study, which was unexpected. However, Chl a showed a significant difference between samples under combined spatial and seasonal effects. This observation was possibly due to high variation between locations increasing the standard deviation of the Chl a value for each season.
Cluster 2 (R4) results indicated that agricultural manure and fertilizer runoff was probably a major source of NH4-N and TOC. Fu et al. (2012) also reported high NH4-N and TOC from agricultural sources. In addition, lower NO3-N levels compared to R1-R3 were observed in R4. Slow nitrification might be another reason for the high NH4-N in this area (Vaishali and Punita, 2013). On the other hand, EC evaluates conductive ions and dissolved solids in freshwater and is usually related to soil runoff into water (Chapman, 2021). USEPA (USEPA, 2022) suggested an EC within the range of 150–500 μS/cm was necessary for certain fish or macroinvertebrates species to be sustained. In this study, R1, R2, R3, R4, and R8 showed EC values higher than this limit in at least one location. Among them, R4 showed the highest average EC among all inflow rivers in all four seasons, indicating that agricultural land has higher risks of soil runoff.
Cluster 3 (R5, R7, R9) was more residential than the other clusters. Water in these rivers had relatively lower nutrient levels than in clusters 1 and 2. Still, it was more nutrient-rich than cluster 4 (R6, R8, R10), which was the least affected by human activities being surrounded by the most semi-natural lands. The water nutrient levels were the lowest across the seasons. However, relatively higher pH values were observed in these rivers, compared to the others. For sustainable biodiversity of aquatic life, a pH range of 6.5 to 8 is preferred (Pearce et al., 1998). The MEP guideline suggested a pH range of 6 to 9 for all water classes (MEP, 2002), and R10 exceeded this limit. According to Bhuyan et al. (1990), high pH is usually related to high levels of photosynthesis or extensive usage of alkaline chemicals in farmlands. More frequent use of fertilizers in the summer could explain the seasonal variation in the pH observed in this study. Nevertheless, considering that R4 (agricultural) did not show any increased pH, the algal content and photosynthesis level may be the main reason for the spatial variation of pH.
4.2 Bacterial community structures under the effects of water quality and land-use
Aligning the clustering results with the bacterial community structures showed difference in bacterial communities between different types of rivers. The predominating phyla Proteobacteria and Bacteroidota in the inflow river samples were commonly found abundant in past research conducted both in the Taihu watershed (Vadde et al., 2019b; Zhu et al., 2019; Zhang et al., 2022) and in other surface freshwater samples (Kirchman, 2002; Allgaier and Grossart, 2006). These phyla have essential functions in multiple nutrient cycling processes, such as nitrification, carbon, and sulphur cycling (Evans et al., 2008; Han et al., 2018). In this study, most of the Proteobacteria found in our samples were Gammaproteobacteria (Supplementary Figure S3). Higher levels of TOC in clusters 1 and 2 (cluster 1 in spring 2019) could be one reason for increased Proteobacteria in R1-R4, as both Beta- and Gamma-proteobacteria are major degraders of organic carbon in water ecosystems (Lin et al., 2021). High levels of NO2-N and NO3-N could also be related to them, as some genera of Proteobacteria are good nitrite-oxidizers (Han et al., 2018). As for the seasonal differences, the average level of Proteobacteria was higher in spring and winter than in summer, and the changes in each river were also similar. A higher level of Proteobacteria in winter than in summer was also reported previously on the west side of Taihu Lake (Zhu et al., 2019). However, high spatial variations made it difficult to correlate the abundance of this phylum with seasons (Brummer et al., 2003). Most of the Proteobacteria found in our samples were Gammaproteobacteria (Supplementary Figure S3), which correlated well with gut microbiome and municipal wastewater (Mlejnková and Sovová, 2010). This suggested possible pollution from farmland and residential lands in R1-R4.
Bacteroidota was more abundant in warm seasons than cold seasons. Summer in the Taihu watershed is rainier compared to spring and winter. Thus, the seasonal changes could be related to rainfall in this study. Kavamura et al. (2013) reported a strong correlation between rainfall and Bacteroidetes possibly because of high abundance of these bacteria in the rhizosphere, leading to surface water infiltration resulting from storm activity. The spatial changes in Bacteroidota were insignificant, but they could be related to soil runoff or the use of manure fertilisers. Flavobacterium (Bacteroidota) is a genus widely found in freshwater samples and has been isolated from various samples such as diseased fish and domestic sewer lines (Jo et al., 2016). They can form biofilms and utilize various organic compounds, which may help explain their predominance in summer when resource availability is high (Liu and Raven, 2010; Zhao et al., 2014). Flavobacteria are usually in higher abundance at lower inorganic nutrient levels. In this study, the higher abundances in cluster 3 (R5, R7, R9) and R10 were consistent with this pattern.
Significant changes in nutrient levels between seasons and locations were also a possible cause for changes in the relative abundances of bacteria. For example, in this study Actinobacteria was more abundant in clusters 3 and 4, where nutrient levels were relatively lower. Increases in the abundance of Actinobacteria were also reported to correlate with reduced nutrients in freshwater in past studies (Meng et al., 2021; Ruprecht et al., 2021). The hgcI_clade, a group of Actinobacteria showed strong negative correlations with nutrients in cold weather (spring of 2019 and winter of 2020) but did not show good correlations with nutrient parameters in the summer seasons. Due to their ability to assimilate nutrients present at low concentrations, hgcI_clade were previously found to be negatively correlated with nutrient levels, making them good indicators of oligotrophic water (Liu et al., 2020; Ruprecht et al., 2021; Wang et al., 2021).
Cyanobacteria occupied a significantly higher proportion of the bacterial communities in the summer than in winter (p < 0.01). Increased temperature and nutrient levels enriched Cyanobacteria in summer, especially PO4-P, which promotes algal growth (Shock et al., 2003). Notably, in spring and winter, Cyanobacteria were more abundant in clusters 3 and 4 than in 1 and 2. This was opposite to the nutrient levels, including PO4-P. In the summer samples, however, the variation in Cyanobacteria was more random and not directly related to nutrient richness. Cyanobacterial growth in the inflow rivers may have been affected by a number of other factors which was not tested in this study, such as sunlight or trace elements.
4.3 Water ecosystems and anthropogenic activities
Geographical variations, land uses, and different local policies for water protection could all be the reasons for the changes observed in water quality and microbial communities. R1-R4 were located on the northwest side of Taihu Lake in Yixing, which is a heavily industrialised city in Wuxi. More anthropogenic activities could have impacted these rivers. Significantly different bacterial communities, higher nutrient levels, higher TC and FC counts, lower pH and relatively more algal contents were observed in these rivers, compared to the other inflow rivers. The Taihu watershed’s nutrient status has been studied for decades, and the north part of the Taihu watershed has been frequently reported for its more eutrophic status compared to the other parts (Wang et al., 2007b; Zhang et al., 2011; Yu et al., 2020). The eutrophic status of these rivers could have already altered the healthy communities if they were compared with cluster 4, the more semi-natural areas. Notably, R4 and its particular land-use composition could well have caused a significant change in the bacterial community compared to the other rivers, especially R5-R10. The community’s relatively low richness and diversity are probably consistent with reduced activity of nitrifying bacteria, slow nitrification and, therefore, high NH4-N and low NO3-N. Considering the land-use patterns, this river could have been severely affected by agricultural pollution.
Interestingly, older studies in the Taihu watershed tend to conclude that the residential lands and the industrial lands were the major contributors to contamination (Yuan et al., 2011; Zhao et al., 2013). More recent studies, however, started to report more influences from the industrial and agricultural lands (Sunagawa et al., 2015). This might be the result of urbanization and improvement of domestic wastewater treatment systems in this area. The local government could thus pay more attention to hidden illegal discharges of industrial wastewater to minimize point-source pollution. Standardising agricultural activities and animal farming around the river is the best way to reduce non-point source pollution. Providing guidance to the farmers for more environmentally friendly choices of fertilizers and reducing excessive use of fertilizer could be helpful in maintaining healthy water ecosystems.
5 Conclusion
Overall, this study focused on the relationship between bacterial community structure, water physicochemical properties, and land-use patterns around ten major inflow rivers of Taihu Lake. The bacterial communities were profiled by 16S rRNA gene sequencing, and the alpha and beta diversities of the communities were analysed. Significant spatial and seasonal variations were observed in bacterial communities in the studied rivers. For the water quality, statistical analyses were conducted, and evident seasonal and spatial variations were found. EC, TN, NH4-N, NO3-N, PO4-P, TC, and FC were identified as the major contributors to the changes in water quality in the inflow rivers. The land-use pattern and clustering analyses showed the land-use composition and its potential relationships to water quality and bacterial communities. The rivers located in the northwest, especially R1-R4, were more eutrophic than those in the southwest. The high percentages of industrial land and semi-artificial (agricultural) land were identified as the probable causes of high nutrient levels and altered microbial community structures in these rivers. Industrial waste and agricultural land runoff are undoubtedly the major pollution sources in this area. For other lakes around the world with multiple main estuaries, management of the inflow river water quality could also be essential. It would be beneficial for local management departments to understand the impacts of land-use patterns on water quality and microbial ecology. The methods used in this study could be widely and routinely applied as part of water quality evaluation and management strategies. Similar investigations could also target other sample types such as underground water, soil, and sediment.
Data availability statement
The datasets presented in this study can be found in online repositories. The names of the repository/repositories and accession number(s) can be found below: NCBI Short Read Archive (SRA) database under the accession numbers 29255681 to 29255724.
Author contributions
SL: Conceptualization, Data curation, Formal Analysis, Investigation, Methodology, Writing–original draft. JL: Formal Analysis, Methodology, Writing–review and editing. EA: Conceptualization, Methodology, Supervision, Validation, Writing–review and editing. JW: Formal Analysis, Methodology, Resources, Writing–review and editing. AM: Conceptualization, Methodology, Supervision, Validation, Writing–review and editing. RS: Conceptualization, Data curation, Funding acquisition, Investigation, Methodology, Project administration, Supervision, Writing–review and editing.
Funding
The author(s) declare financial support was received for the research, authorship, and/or publication of this article. We acknowledge the Key Program Special Fund in Xi’an Jiaotong-Liverpool University (XJTLU; Grant No. KSF-E-20); Continuous Support Fund (RDF-SP-88); and Research Enhancement Fund (REF-22-02-007) for funding support. SL was supported by the Postgraduate Research Scholarship (PGRS1906018) awarded to RS by the XJTLU. EA is supported by the Biotechnology and Biological Sciences Research Council (BBSRC); under the BBSRC Institute Strategic Program Gut Microbes and Health BB/R012490/1 and its constituent projects BBS/E/F/000PR10353 and BBS/E/F/000PR10356.
Acknowledgments
We would like to thank Prilli Fernanda, Tianma Yuan, and Li Sun for their support for this project and the Department of Biological Sciences, Xi’an Jiaotong-Liverpool University for the laboratory facilities.
Conflict of interest
The authors declare that the research was conducted in the absence of any commercial or financial relationships that could be construed as a potential conflict of interest.
The author(s) declared that they were an editorial board member of Frontiers, at the time of submission. This had no impact on the peer review process and the final decision.
Publisher’s note
All claims expressed in this article are solely those of the authors and do not necessarily represent those of their affiliated organizations, or those of the publisher, the editors and the reviewers. Any product that may be evaluated in this article, or claim that may be made by its manufacturer, is not guaranteed or endorsed by the publisher.
Supplementary material
The Supplementary Material for this article can be found online at: https://www.frontiersin.org/articles/10.3389/fenvs.2024.1340875/full#supplementary-material
References
Allgaier, M., and Grossart, H.-P. (2006). Diversity and seasonal dynamics of Actinobacteria populations in four lakes in northeastern Germany. Appl. Environ. Microbiol. 72, 3489–3497. doi:10.1128/aem.72.5.3489-3497.2006
APHA (2005). Standard methods for the examination of water and wastewater. America: American Public Health Association.
Ashbolt, N. J. (2015). Microbial contamination of drinking water and human health from community water systems. Curr. Environ. health Rep. 2, 95–106. doi:10.1007/s40572-014-0037-5
Bai, G., Zhang, Y., Yan, P., Yan, W., Kong, L., Wang, L., et al. (2020). Spatial and seasonal variation of water parameters, sediment properties, and submerged macrophytes after ecological restoration in a long-term (6 year) study in Hangzhou west lake in China: Submerged macrophyte distribution influenced by environmental variables. Water Research 186, 116379. doi:10.1016/j.watres.2020.116379
Bakhsh, A., Kanwar, R. S., and Karlen, D. (2005). Effects of liquid swine manure applications on NO3–N leaching losses to subsurface drainage water from loamy soils in Iowa. Agric. Ecosyst. Environ. 109, 118–128. doi:10.1016/j.agee.2005.01.018
Baudart, J., Servais, P., de Paoli, H., Henry, A., and Lebaron, P. (2009). Rapid enumeration of Escherichia coli in marine bathing waters: potential interference of nontarget bacteria. J. Appl. Microbiol. 107, 2054–2062. doi:10.1111/j.1365-2672.2009.04392.x
Bhuyan, D., Lake, L. W., and Pope, G. A. (1990). Mathematical modeling of high-pH chemical flooding. SPE Reserv. Eng. 5, 213–220. doi:10.2118/17398-pa
Brummer, I., Felske, A., and Wagner-Dobler, I. (2003). Diversity and seasonal variability of β-proteobacteria in biofilms of polluted rivers: analysis by temperature gradient gel electrophoresis and cloning. Appl. Environ. Microbiol. 69, 4463–4473. doi:10.1128/aem.69.8.4463-4473.2003
Bu, H., Meng, W., and Zhang, Y. (2014). Spatial and seasonal characteristics of river water chemistry in the Taizi River in Northeast China. Environ. Monit. Assess. 186, 3619–3632. doi:10.1007/s10661-014-3644-6
Cai, C., Gu, X., Ye, Y., Yang, C., Dai, X., Chen, D., et al. (2013). Assessment of pollutant loads discharged from aquaculture ponds around Taihu Lake, China. Aquac. Res. 44, 795–806. doi:10.1111/j.1365-2109.2011.03088.x
Camara, M., Jamil, N. R., and Abdullah, A. F. B. (2019). Impact of land uses on water quality in Malaysia: a review. Ecol. Process. 8, 10. doi:10.1186/s13717-019-0164-x
Chapman, D. (2021). Water quality assessments: a guide to the use of biota, sediments and water in environmental monitoring. Germany: CRC Press.
Chen, B., Wang, M., Duan, M., Ma, X., Hong, J., Xie, F., et al. (2019). In search of key: protecting human health and the ecosystem from water pollution in China. J. Clean. Prod. 228, 101–111. doi:10.1016/j.jclepro.2019.04.228
Cheng, J., Deng, C., and Lu, C. (2014). Bird communities in artificial and native reed wetland, Taihu lake bank, Suzhou. Chin. J. Zoology 49, 347–356. doi:10.13859/j.cjz.201403006
Chi, Z., Zhu, Y., Li, H., Wu, H., and Yan, B. (2021). Unraveling bacterial community structure and function and their links with natural salinity gradient in the Yellow River Delta. Sci. Total Environ. 773, 145673. doi:10.1016/j.scitotenv.2021.145673
Du, C., Li, Y., Wang, Q., Liu, G., Zheng, Z., Mu, M., et al. (2017). Tempo-spatial dynamics of water quality and its response to river flow in estuary of Taihu Lake based on GOCI imagery. Environ. Sci. Pollut. Res. 24, 28079–28101. doi:10.1007/s11356-017-0305-7
Ebina, J., Tsutsui, T., and Shirai, T. (1983). Simultaneous determination of total nitrogen and total phosphorus in water using peroxodisulfate oxidation. Water Res. 17, 1721–1726. doi:10.1016/0043-1354(83)90192-6
Evans, F. F., Egan, S., and Kjelleberg, S. (2008). Ecology of type II secretion in marine gammaproteobacteria. Environ. Microbiol. 10, 1101–1107. doi:10.1111/j.1462-2920.2007.01545.x
Fernanda, P., Liu, S., Yuan, T., Ramalingam, B., Lu, J., and Sekar, R. (2022). Diversity and abundance of antibiotic resistance genes and their relationship with nutrients and land use of the inflow rivers of Taihu Lake. Front. Microbiol. 13, 1009297. doi:10.3389/fmicb.2022.1009297
Fu, Q., Zheng, B., Zhao, X., Wang, L., and Liu, C. (2012). Ammonia pollution characteristics of centralized drinking water sources in China. J. Environ. Sci. 24, 1739–1743. doi:10.1016/s1001-0742(11)61011-5
Githinji, M. W., Mwaura, F., and Wamalwa, J. (2019). Land use and water pollution along the altitudinal gradient of the Likii River, Laikipia County, Kenya. J. Environ. Pollut. Hum. Health 7, 39–52. doi:10.12691/jephh-7-1-6
Guo, H. Y., Wang, X. R., and Zhu, J. G. (2004). Quantification and Index of Non-Point Source Pollution in Taihu Lake Region with GIS. Environmental Geochemistry and Health 26 (2), 147–156. doi:10.1023/B:EGAH.0000039577.67508.76
Guo, J., Zheng, Y., Teng, J., Song, J., Wang, X., and Zhao, Q. (2020). The seasonal variation of microbial communities in drinking water sources in Shanghai. Journal of Cleaner Production 265, 121604. doi:10.1016/j.jclepro.2020.121604
Han, S., Li, X., Luo, X., Wen, S., Chen, W., and Huang, Q. (2018). Nitrite-oxidizing bacteria community composition and diversity are influenced by fertilizer regimes, but are independent of the soil aggregate in acidic subtropical red soil. Front. Microbiol. 9, 885. doi:10.3389/fmicb.2018.00885
Hu, X.-L., Bao, Y.-F., Hu, J.-J., Liu, Y.-Y., and Yin, D.-Q. (2017). Occurrence of 25 pharmaceuticals in Taihu Lake and their removal from two urban drinking water treatment plants and a constructed wetland. Environ. Sci. Pollut. Res. 24, 14889–14902. doi:10.1007/s11356-017-8830-y
Huang, T.-Y., Wu, W., and Li, W.-W. (2013). Identifying the major pollution sources and pollution loading status of Qiputang River in Taihu Lake basin of China. Desalination Water Treat. 51, 4736–4743. doi:10.1080/19443994.2012.752764
Islam, F., Lian, Q., Ahmad, Z. U., Zappi, M. E., Yao, L., and Gang, D. D. (2018). Nonpoint source pollution. Water Environment Research 90 (10), 1872–1898. doi:10.2175/106143017X15131012188033
Jo, S. J., Kwon, H., Jeong, S.-Y., Lee, C.-H., and Kim, T. G. (2016). Comparison of microbial communities of activated sludge and membrane biofilm in 10 full-scale membrane bioreactors. Water Res. 101, 214–225. doi:10.1016/j.watres.2016.05.042
Kavamura, V. N., Taketani, R. G., Lançoni, M. D., Andreote, F. D., Mendes, R., and Soares de Melo, I. (2013). Water regime influences bulk soil and rhizosphere of Cereus jamacaru bacterial communities in the Brazilian Caatinga biome. PloS one 8 (9), e73606. doi:10.1371/journal.pone.0073606
Kirchman, D. L. (2002). The ecology of Cytophaga–Flavobacteria in aquatic environments. FEMS Microbiol. Ecol. 39, 91–100. doi:10.1016/s0168-6496(01)00206-9
Koch, A., Kärrman, A., Yeung, L. W., Jonsson, M., Ahrens, L., and Wang, T. (2019). Point source characterization of per-and polyfluoroalkyl substances (PFASs) and extractable organofluorine (EOF) in freshwater and aquatic invertebrates. Environ. Sci. Process. Impacts 21, 1887–1898. doi:10.1039/c9em00281b
Kutvonen, H., Rajala, P., Carpén, L., and Bomberg, M. (2015). Nitrate and ammonia as nitrogen sources for deep subsurface microorganisms. Front. Microbiol. 6, 1079. doi:10.3389/fmicb.2015.01079
Lauber, C. L., Ramirez, K. S., Aanderud, Z., Lennon, J., and Fierer, N. (2013). Temporal variability in soil microbial communities across land-use types. ISME J. 7, 1641–1650. doi:10.1038/ismej.2013.50
Lin, S.-S., Shen, S.-L., Zhou, A., and Lyu, H.-M. (2021). Assessment and management of lake eutrophication: a case study in Lake Erhai, China. Sci. Total Environ. 751, 141618. doi:10.1016/j.scitotenv.2020.141618
Liu, J., Chen, X., Shu, H.-Y., Lin, X.-R., Zhou, Q.-X., Bramryd, T., et al. (2018). Microbial community structure and function in sediments from e-waste contaminated rivers at Guiyu area of China. Environ. Pollut. 235, 171–179. doi:10.1016/j.envpol.2017.12.008
Liu, J., and Raven, P. H. (2010). China's environmental challenges and implications for the world. Crit. Rev. Environ. Sci. Technol. 40, 823–851. doi:10.1080/10643389.2010.502645
Liu, Y., Li, H., Cui, G., and Cao, Y. (2020). Water quality attribution and simulation of non-point source pollution load flux in the Hulan River basin. Sci. Rep. 10, 3012–3015. doi:10.1038/s41598-020-59980-7
Lucassen, E., Smolders, A. J., van der Salm, A. L., and Roelofs, J. (2004). High groundwater nitrate concentrations inhibit eutrophication of sulphate-rich freshwater wetlands. Biogeochemistry 67, 249–267. doi:10.1023/b:biog.0000015342.40992.cb
Mathai, P. P., Staley, C., and Sadowsky, M. J. (2020). Sequence-enabled community-based microbial source tracking in surface waters using machine learning classification: a review. J. Microbiol. Methods 177, 106050. doi:10.1016/j.mimet.2020.106050
Ma, X., Deng, Z., Blair, D., Bi, Y., Hu, W., and Yin, M. (2022). Cyanobacterial bloom associated with a complete turnover of a Daphnia population in a warm-temperate eutrophic lake in Eastern China. Freshw. Biol. 67, 508–517. doi:10.1111/fwb.13858
Mekonnen, M. M., and Hoekstra, A. Y. (2015). Global gray water footprint and water pollution levels related to anthropogenic nitrogen loads to fresh water. Environ. Sci. Technol. 49, 12860–12868. doi:10.1021/acs.est.5b03191
Meng, L.-J., Zhang, Y., Li, X.-X., Liu, J.-H., Wen, B., Gao, J.-Z., et al. (2021). Comparative analysis of bacterial communities of water and intestines of silver carp (Hypophthalmichthys molitrix) and bighead carp (H. nobilis) reared in aquaculture pond systems. Aquaculture 534, 736334. doi:10.1016/j.aquaculture.2020.736334
MEP, (2002). Ministry of environmental protection of the People’s Republic of China). Beijing, China: Environmental Quality Standards for Surface Water. GB 3838-2002).
Mlejnková, H., and Sovová, K. (2010). Impact of pollution and seasonal changes on microbial community structure in surface water. Water Sci. Technol. 61, 2787–2795. doi:10.2166/wst.2010.080
MOHURD (2011). Ministry of housing urban–rural development of the People’s Republic of China, code for classification of urban land use and planning standards of development land (GB 50137–2011). China: China Architecture and Building Press Beijing.
MOHURD (2018). Ministry of Housing Urban–rural Development of the People’s Republic of China, Chinese national standard for urban residential area planning and design (GB 50180-2018). China: China Architecture and Building Press Beijing.
MOHURD (2020). Ministry of housing urban–rural development of the People’s Republic of China, guidance of territorial spatial investigation, plan, land use control classification. China: China Architecture and Building Press Beijing.
Naranjo, R. C., Niswonger, R. G., Smith, D., Rosenberry, D., and Chandra, S. (2019). Linkages between hydrology and seasonal variations of nutrients and periphyton in a large oligotrophic subalpine lake. Journal of Hydrology 568, 877–890. doi:10.1016/j.jhydrol.2018.11.033
Nyingi, D. W., Gichuki, N., and Ogada, M. O. (2013). Kenya: a natural outlook: chapter 16. Freshwater ecology of Kenyan highlands and lowlands. Germany: Elsevier Inc. Chapters.
Okada, E., Pérez, D., de Gerónimo, E., Aparicio, V., Massone, H., and Costa, J. L. (2018). Non-point source pollution of glyphosate and AMPA in a rural basin from the southeast Pampas, Argentina. Environ. Sci. Pollut. Res. 25, 15120–15132. doi:10.1007/s11356-018-1734-7
Paerl, H. W., Xu, H., Mccarthy, M. J., Zhu, G., Qin, B., Li, Y., et al. (2011). Controlling harmful cyanobacterial blooms in a hyper-eutrophic lake (Lake Taihu, China): the need for a dual nutrient (N and P) management strategy. Water Res. 45, 1973–1983. doi:10.1016/j.watres.2010.09.018
Pearce, G., Ramzan Chaudhry, M., and Ghulam, S. (1998). A simple methodology for water quality monitoring.
Pereira, R., Peplies, J., Mushi, D., Brettar, I., and Höfle, M. G. (2018). Pseudomonas-specific NGS assay provides insight into abundance and dynamics of Pseudomonas species including P. aeruginosa in a cooling tower. Front. Microbiol. 9, 1958. doi:10.3389/fmicb.2018.01958
Pisciotta, J. M., Rath, D. F., Stanek, P. A., Flanery, D. M., and Harwood, V. J. (2002). Marine bacteria cause false-positive results in the Colilert-18 rapid identification test for Escherichia coli in Florida waters. Appl. Environ. Microbiol. 68, 539–544. doi:10.1128/aem.68.2.539-544.2002
Qin, B., Xu, P., Wu, Q., Luo, L., and Zhang, Y. (2007). Environmental issues of lake Taihu, China. Eutrophication of shallow lakes with special reference to Lake Taihu. Editors B. Qin, Z. Liu, and K. Havens Dordrecht: Springer 194. doi:10.1007/978-1-4020-6158-5_2
Quast, C., Pruesse, E., Yilmaz, P., Gerken, J., Schweer, T., Yarza, P., et al. (2012). The SILVA ribosomal RNA gene database project: improved data processing and web-based tools. Nucleic acids Res. 41, D590–D596. doi:10.1093/nar/gks1219
Ren, Z., Qu, X., Zhang, M., Yu, Y., and Peng, W. (2019). Distinct bacterial communities in wet and dry seasons during a seasonal water level fluctuation in the largest freshwater lake (Poyang Lake) in China. Front. Microbiol. 1167, 1167. doi:10.3389/fmicb.2019.01167
Rissman, A. R., and Carpenter, S. R. (2015). Progress on nonpoint pollution: barriers and opportunities. Daedalus 144, 35–47. doi:10.1162/daed_a_00340
Ruprecht, J., Birrer, S., Dafforn, K., Mitrovic, S., Crane, S., Johnston, E., et al. (2021). Wastewater effluents cause microbial community shifts and change trophic status. Water Res. 200, 117206. doi:10.1016/j.watres.2021.117206
Shang, Y., Wu, X., Wang, X., Wei, Q., Ma, S., Sun, G., et al. (2022). Factors affecting seasonal variation of microbial community structure in Hulun Lake, China. Sci. Total Environ. 805, 150294. doi:10.1016/j.scitotenv.2021.150294
Shock, C. C., Pratt, K., and Station, M. (2003). Phosphorus effects on surface water quality and phosphorus TMDL development. West. Nutr. Manag. Conf. 5 (21), 1.
Sunagawa, S., Coelho, L. P., Chaffron, S., Kultima, J. R., Labadie, K., Salazar, G., et al. (2015). Ocean plankton. Structure and function of the global ocean microbiome. Science 348, 1261359. doi:10.1126/science.1261359
Tan, B., Ng, C. M., Nshimyimana, J. P., Loh, L.-L., Gin, K. Y.-H., and Thompson, J. R. (2015). Next-generation sequencing (NGS) for assessment of microbial water quality: current progress, challenges, and future opportunities. Front. Microbiol. 6, 1027. doi:10.3389/fmicb.2015.01027
Tang, Y., Li, M., Zou, Y., Lv, M., and Sun, J. (2018). Mechanism of aerobic denitrifiers and calcium nitrate on urban river sediment remediation. Int. Biodeterior. Biodegrad. 126, 119–130. doi:10.1016/j.ibiod.2017.10.002
Tao, T., and Xin, K. (2014). Public health: a sustainable plan for China's drinking water. Nature 511, 527–528. doi:10.1038/511527a
Ti, C., Xia, Y., Pan, J., Gu, G., and Yan, X. (2011). Nitrogen budget and surface water nitrogen load in Changshu: a case study in the Taihu Lake region of China. Nutrient Cycl. Agroecosyst. 91, 55–66. doi:10.1007/s10705-011-9443-3
Unno, T., Staley, C., Brown, C. M., Han, D., Sadowsky, M. J., and Hur, H. G. (2018). Fecal pollution: new trends and challenges in microbial source tracking using next-generation sequencing. Environ. Microbiol. 20, 3132–3140. doi:10.1111/1462-2920.14281
USEPA (2009). Total nitrogen. Available at: https://nepis.epa.gov/Exe/ZyPURL.cgi?Dockey=P10070OQ.txt (Accessed September 24, 2022).
USEPA (2012). 5.7 nitrates. Available at: https://archive.epa.gov/water/archive/web/html/vms57.html (Accessed November 10, 2020).
USEPA (2013). Coliforms, fecal coliforms, and E. Coli. Available at: https://www.waterfilteradvisor.com/glossary/coliform/(Accessed September 24, 2022).
USEPA (2022). Indicators: conductivity. Available at: https://www.epa.gov/national-aquatic-resource-surveys/indicators-conductivity (Accessed September 24, 2022).
Vadde, K. K., Feng, Q., Wang, J., Mccarthy, A. J., and Sekar, R. (2019a). Next-generation sequencing reveals fecal contamination and potentially pathogenic bacteria in a major inflow river of Taihu Lake. Environ. Pollut. 254, 113108. doi:10.1016/j.envpol.2019.113108
Vadde, K. K., Mccarthy, A. J., Rong, R., and Sekar, R. (2019b). Quantification of microbial source tracking and pathogenic bacterial markers in water and sediments of Tiaoxi River (Taihu Watershed). Front. Microbiol. 10, 699. doi:10.3389/fmicb.2019.00699
Vadde, K. K., Wang, J., Cao, L., Yuan, T., Mccarthy, A. J., and Sekar, R. (2018). Assessment of water quality and identification of pollution risk locations in Tiaoxi River (Taihu Watershed), China. Water 10, 183. doi:10.3390/w10020183
Vaishali, P., and Punita, P. (2013). Assessment of seasonal variation in water quality of river mini, at sindhrot, vadodara. Int. J. Environ. Sci. 3, 1424–1436. doi:10.6088/ijes.2013030500013
Vega, M., Pardo, R., Barrado, E., and Debán, L. (1998). Assessment of seasonal and polluting effects on the quality of river water by exploratory data analysis. Water Res. 32, 3581–3592. doi:10.1016/s0043-1354(98)00138-9
Wang, Q., Garrity, G. M., Tiedje, J. M., and Cole, J. R. (2007a). Naive Bayesian classifier for rapid assignment of rRNA sequences into the new bacterial taxonomy. Appl. Environ. Microbiol. 73, 5261–5267. doi:10.1128/aem.00062-07
Wang, X.-L., Lu, Y.-L., Han, J.-Y., He, G.-Z., and Wang, T.-Y. (2007b). Identification of anthropogenic influences on water quality of rivers in Taihu watershed. J. Environ. Sci. 19, 475–481. doi:10.1016/s1001-0742(07)60080-1
Wang, F.-E., Tian, P., Yu, J., Lao, G.-M., and Shi, T.-C. (2011a). Variations in pollutant fluxes of rivers surrounding Taihu Lake in zhejiang Province in 2008. Phys. Chem. Earth, Parts A/b/c 36, 366–371. doi:10.1016/j.pce.2010.04.019
Wang, J., Soininen, J., Zhang, Y., Wang, B., Yang, X., and Shen, J. (2011b). Contrasting patterns in elevational diversity between microorganisms and macroorganisms. J. Biogeogr. 38, 595–603. doi:10.1111/j.1365-2699.2010.02423.x
Wang, E., Li, Q., Hu, H., Peng, F., Zhang, P., and Li, J. (2019a). Spatial characteristics and influencing factors of river pollution in China. Water Environ. Res. 91, 351–363. doi:10.1002/wer.1044
Wang, J., Fu, Z., Qiao, H., and Liu, F. (2019b). Assessment of eutrophication and water quality in the estuarine area of Lake Wuli, Lake Taihu, China. Sci. Total Environ. 650, 1392–1402. doi:10.1016/j.scitotenv.2018.09.137
Wang, M., Zhang, H., du, C., Zhang, W., Shen, J., Yang, S., et al. (2021). Spatiotemporal differences in phosphorus release potential of bloom-forming cyanobacteria in Lake Taihu. Environ. Pollut. 271, 116294. doi:10.1016/j.envpol.2020.116294
Wijesiri, B., Deilami, K., and Goonetilleke, A. (2018). Evaluating the relationship between temporal changes in land use and resulting water quality. Environ. Pollut. 234, 480–486. doi:10.1016/j.envpol.2017.11.096
Wu, Z., Wang, X., Chen, Y., Cai, Y., and Deng, J. (2018). Assessing river water quality using water quality index in Lake Taihu Basin, China. Sci. Total Environ. 612, 914–922. doi:10.1016/j.scitotenv.2017.08.293
Xu, H., Mccarthy, M. J., Paerl, H. W., Brookes, J. D., Zhu, G., Hall, N. S., et al. (2021). Contributions of external nutrient loading and internal cycling to cyanobacterial bloom dynamics in Lake Taihu, China: implications for nutrient management. Limnol. Oceanogr. 66, 1492–1509. doi:10.1002/lno.11700
Xu, J., Jin, G., Tang, H., Mo, Y., Wang, Y.-G., and Li, L. (2019). Response of water quality to land use and sewage outfalls in different seasons. Sci. Total Environ. 696, 134014. doi:10.1016/j.scitotenv.2019.134014
Xu, J., Zhang, Y., Zhou, C., Guo, C., Wang, D., du, P., et al. (2014). Distribution, sources and composition of antibiotics in sediment, overlying water and pore water from Taihu Lake, China. Sci. Total Environ. 497, 267–273. doi:10.1016/j.scitotenv.2014.07.114
Yan, C.-A., Zhang, W., Zhang, Z., Liu, Y., Deng, C., and Nie, N. (2015). Assessment of water quality and identification of polluted risky regions based on field observations and GIS in the honghe river watershed, China. PloS one 10, e0119130. doi:10.1371/journal.pone.0119130
Yang, J., Jiang, H., Wu, G., Liu, W., and Zhang, G. (2016a). Distinct factors shape aquatic and sedimentary microbial community structures in the lakes of western China. Front. Microbiol. 7, 1782. doi:10.3389/fmicb.2016.01782
Yang, J., Ma, L. A., Jiang, H., Wu, G., and Dong, H. (2016b). Salinity shapes microbial diversity and community structure in surface sediments of the Qinghai-Tibetan Lakes. Sci. Rep. 6, 25078–25086. doi:10.1038/srep25078
Yang, K. (2008). Urban land use/cover and spatial pattern analysis. China: Central South University.
Yang, W., Zhao, Y., Wang, D., Wu, H., Lin, A., and He, L. (2020). Using principal components analysis and IDW interpolation to determine spatial and temporal changes of surface water quality of Xin’anjiang river in Huangshan, China. Int. J. Environ. Res. public health 17, 2942. doi:10.3390/ijerph17082942
Yilmaz, P., Parfrey, L. W., Yarza, P., Gerken, J., Pruesse, E., Quast, C., et al. (2014). The SILVA and “all-species living tree project (LTP)” taxonomic frameworks. Nucleic acids Res. 42, D643–D648. doi:10.1093/nar/gkt1209
Yi, X., Lin, C., Ong, E. J. L., Wang, M., and Zhou, Z. (2019). Occurrence and distribution of trace levels of antibiotics in surface waters and soils driven by non-point source pollution and anthropogenic pressure. Chemosphere 216, 213–223. doi:10.1016/j.chemosphere.2018.10.087
Yotova, G., Varbanov, M., Tcherkezova, E., and Tsakovski, S. (2021). Water quality assessment of a river catchment by the composite water quality index and self-organizing maps. Ecol. Indic. 120, 106872. doi:10.1016/j.ecolind.2020.106872
Yu, R.-C., Lu, S.-H., Qi, Y.-Z., and Zhou, M.-J. (2020). Progress and perspectives of harmful algal bloom studies in China. Oceanol. Limnologia Sinica 51, 768–788. doi:10.11693/hyhz20200400127
Yu, Z., Liu, J., Li, Y., Jin, J., Liu, X., and Wang, G. (2018). Impact of land use, fertilization and seasonal variation on the abundance and diversity of nirS-type denitrifying bacterial communities in a Mollisol in Northeast China. Eur. J. Soil Biol. 85, 4–11. doi:10.1016/j.ejsobi.2017.12.001
Yuan, H., Shen, J., Liu, E., Wang, J., and Meng, X.-h. (2011). Assessment of Nutrients and Heavy Metals Enrichment in Surface Sediments from Taihu Lake, a Eutrophic Shallow Lake in China. Environmental geochemistry and health 33, 67–81. doi:10.1007/s10653-010-9323-9
Zhang, G., Chen, Y., Hu, L., Melka, D., Wang, H., Laasri, A., et al. (2018). Survey of foodborne pathogens, aerobic plate counts, total coliform counts, and Escherichia coli counts in leafy greens, sprouts, and melons marketed in the United States. J. Food Prot. 81, 400–411. doi:10.4315/0362-028x.jfp-17-253
Zhang, S., Yu, J., Wang, S., Singh, R. P., and Fu, D. (2019). Nitrogen fertilization altered arbuscular mycorrhizal fungi abundance and soil erosion of paddy fields in the Taihu Lake region of China. Environ. Sci. Pollut. Res. 26, 27987–27998. doi:10.1007/s11356-019-06005-0
Zhang, S. H., Lv, X., Han, B., Gu, X., Wang, P. F., Wang, C., et al. (2015). Prevalence of antibiotic resistance genes in antibiotic-resistant Escherichia coli isolates in surface water of Taihu Lake Basin, China. Environ. Sci. Pollut. Res. 22, 11412–11421. doi:10.1007/s11356-015-4371-4
Zhang, Y., Zhang, Y., Gao, Y., Zhang, H., Cao, J., Cai, J., et al. (2011). Water pollution control technology and strategy for river–lake systems: a case study in Gehu Lake and Taige Canal. Ecotoxicology 20, 1154–1159. doi:10.1007/s10646-011-0676-3
Zhang, Y., Zhang, Y., Wei, L., Li, M., Zhu, W., and Zhu, L. (2022). Spatiotemporal correlations between water quality and microbial community of typical inflow river into Taihu Lake, China. Environ. Sci. Pollut. Res. 29, 63722–63734. doi:10.1007/s11356-022-19023-2
Zhao, H., You, B., Duan, X., Becky, S., and Jiang, X. (2013). Industrial and agricultural effects on water environment and its optimization in heavily polluted area in Taihu Lake Basin, China. Chinese Geographical Science 23 (2), 203–215. doi:10.1007/s11769-013-0593-x
Zhao, D., Huang, R., Zeng, J., Yu, Z., Liu, P., Cheng, S., et al. (2014). Pyrosequencing analysis of bacterial community and assembly in activated sludge samples from different geographic regions in China. Appl. Microbiol. Biotechnol. 98, 9119–9128. doi:10.1007/s00253-014-5920-3
Zhao, Y., Xu, M., Liu, Q., Wang, Z., Zhao, L., and Chen, Y. (2018). Study of heavy metal pollution, ecological risk and source apportionment in the surface water and sediments of the Jiangsu coastal region, China: a case study of the Sheyang Estuary. Mar. Pollut. Bull. 137, 601–609. doi:10.1016/j.marpolbul.2018.10.044
Zheng, J., Gao, R., Wei, Y., Chen, T., Fan, J., Zhou, Z., et al. (2017). High-throughput profiling and analysis of antibiotic resistance genes in East Tiaoxi River, China. Environ. Pollut. 230, 648–654. doi:10.1016/j.envpol.2017.07.025
Keywords: pollution, land-use patterns, molecular microbial ecology, 16S rRNA gene sequencing, freshwater microbiology, bacterial community structure, water quality
Citation: Liu S, Lu J, Adriaenssens EM, Wang J, McCarthy AJ and Sekar R (2024) Industrial and agricultural land uses affected the water quality and shaped the bacterial communities in the inflow rivers of Taihu Lake. Front. Environ. Sci. 12:1340875. doi: 10.3389/fenvs.2024.1340875
Received: 19 November 2023; Accepted: 08 January 2024;
Published: 29 January 2024.
Edited by:
Visva Bharati Barua, University of North Carolina at Charlotte, United StatesReviewed by:
Krishna Yadav, Iowa State University, United StatesPriyanka Uddandarao, National Institute of Technology, India
Copyright © 2024 Liu, Lu, Adriaenssens, Wang, McCarthy and Sekar. This is an open-access article distributed under the terms of the Creative Commons Attribution License (CC BY). The use, distribution or reproduction in other forums is permitted, provided the original author(s) and the copyright owner(s) are credited and that the original publication in this journal is cited, in accordance with accepted academic practice. No use, distribution or reproduction is permitted which does not comply with these terms.
*Correspondence: Raju Sekar, Sekar.Raju@xjtlu.edu.cn