Research on the decoupling relationship between water resources utilization and economic development at the county scale in Qian’nan Prefecture, Guizhou Province
 Yin Su
 Shenghai Liao1
 - 1College of Eco-Environmental Engineering, Guizhou Minzu University, Guiyang, Guizhou, China
- 2Guizhou Province Key Laboratory of Ecological Protection and Restoration of Typical Plateau Wetlands, Guizhou University of Engineering Science, Bijie, Guizhou, China
- 3Institute of Mountain Resource, Guizhou Academy of Sciences, Guiyang, China
There is a close link between water resources and economic development. To understand the relationship between water resources and economic development in Qian’nan, Guizhou, the study utilized the water resources ecological footprint and decoupling model to analyze the relationship between water resource ecological footprint and economic growth in the region. Data from 2009 to 2019 were collected and analyzed to understand the trends and patterns. The results indicate that from 2009 to 2019, the ecological footprint of water resources in Qian’nan remained less than the ecological carrying capacity, indicating a surplus of water resources and low ecological pressure. However, the water resources ecological footprint gradually increased over the study period. Furthermore, the ecological footprint of water resources was found to be higher in the northern areas compared to the southern regions. Additionally, areas with higher economic levels exhibited larger ecological footprints of water resources, while areas with lower economic levels had smaller ecological footprints. Although some counties (cities) showed an increasingly severe relationship between water resource ecological footprint and economic growth, overall, most counties (cities) demonstrated a weak decoupling state, suggesting that economic development is not significantly constrained by water resources. The findings suggest that Qian’nan, Guizhou, has experienced a surplus of water resources with low ecological pressure over the past decade. However, the increasing water resources ecological footprint warrants attention to ensure sustainable management. The spatial disparities in the ecological footprint of water resources highlight the need for targeted interventions in different regions. Additionally, the weak decoupling state between water resources ecological footprint and economic growth indicates the potential for further economic development without significant constraints from water resources. However, proactive measures should be implemented to maintain this balance and promote sustainable development in the region.
1 Introduction
There exists a close relationship between water resources and economic development. As one of the fundamental elements underpinning economic growth, water resources constrain economic development (Liu et al., 2019; Peng et al., 2020). Implementation of economic policies, in turn, impacts the efficiency of water resource utilization (Lu et al., 2022). However, human direct consumption of water accounts for just 0.2% of the total water resources. With global climate change and the advancement of urbanization, many regions face an increasingly acute scarcity of water resources (Yang et al., 2022). Addressing the decoupling of economic growth from water resource utilization has become a focal point of current research (Pan and Xu, 2020; Wang and Wang, 2020; Li et al., 2023; Shu et al., 2023). Consequently, understanding the regional water resource usage structure and efficiency, and accurately analyzing the relationship between different stages of economic development and water resource utilization, is crucial for achieving sustainable water resource utilization. This stands as a pivotal factor in ensuring both economic development and societal wellbeing.
The concept of water resource ecological footprint originates from the ecological footprint concept, which measures the productive land area to gauge the consumption of water resources and wastewater absorption levels by a region’s population or economy (Su et al., 2018; Dai et al., 2019; Wang et al., 2020; Jing et al., 2022). Assessing a region’s water security status involves determining whether the regional water consumption area (water resource ecological footprint) falls within the scope of the water-carrying area (water resource carrying capacity). Simultaneously, by computing the ecological footprints and carrying capacities of various water use accounts, insights into a region’s water endowment and the status of water resource development and utilization can be obtained. The decoupling concept, proposed by the Organization for Economic Co-operation and Development (OECD), explores the relationship between environmental degradation and economic development (OECD, 2002). The Tapio decoupling model (Tapio, 2005) finds extensive application in studying the relationship between resource utilization and economic development. In recent years, there has been increasing scholarly attention towards the relationship between water resource utilization and economic development. Decoupling the relationship between water resources and economic development implies achieving economic growth without an increase in water resource utilization. By accomplishing this decoupling, it becomes feasible to effectively prevent excessive depletion and harm to water resources caused by economic growth, preserving the sustainability of water resources. This separation is crucial for maintaining ecological balance, environmental preservation, and meeting future developmental needs (Zhang and Zhai, 2021), based on the theory of water resource ecological footprint, separately examined the decoupling relationship between water quantity and water quality ecological footprints and economic growth in Shaanxi Province. They also forecasted its decoupling status. Yang et al. (2016) assessed the decoupling status between the water ecological footprint and economic development in Guiyang City using the water ecological footprint and decoupling theory (Yang et al., 2019), leveraging ecological footprint and decoupling theory, analyzed the decoupling situation between sustainable water resource utilization and economic development in Changchun City using models of water resource ecological footprint, water resource ecological carrying capacity, and the decoupling model of economic development and water resource consumption. Yang et al. (2019), by calculating the ecological footprints of water quantity and quality in various receiving water bodies in Shandong Province, evaluated the coordination between water resource consumption and economic growth using macro-coordinated development decoupling evaluation models and micro-coordination degree theories. On the other hand, some scholars have utilized the water footprint model to analyze the decoupling relationship between water resource utilization and economic development (Jiao et al., 2019; Kong et al., 2019; Lu et al., 2022). For example, Sun et al. (2020) constructed a water footprint-LMDI model to analyze water resource consumption in Jiangsu Province from 2007 to 2017 and its decoupling effect on economic development. Lu et al. (2022) adopt the Tapio decoupling model from the perspective of integrating water footprint and physical water to measure the state and the stability of decoupling. Bai et al. (2021) combined water footprint and economic impact to evaluate corn production in China. Reviewing past literature, it explores the relationship between water resources and economic development. In terms of research content, the focus primarily lies on examining the decoupling relationship between the ecological footprints of water quantity and water quality and their respective ties to economic development. Regarding research methodologies, the primary approaches include coupling coordination relationships (Xing et al., 2020), matching evolution relationships (Han et al., 2020), Tapio decoupling relationships (Wang and Yan, 2022), and others. In terms of research scale, the focus has been primarily on regional studies (Zhang et al., 2020; Ding et al., 2022; Wu et al., 2022; Bian et al., 2023; Montoya et al., 2023), sometimes involving provinces or cities (Wang et al., 2018; Shi et al., 2020; Chang and Zhu, 2021; Gong et al., 2021; Li et al., 2023; Cao et al., 2023) as the primary subjects, with limited exploration at the county level. In summary, the research on water resources and economic development has yielded significant results, but there are still some shortcomings: 1) Studies concerning the relationship between water resource utilization and economic development in karst county regions are relatively scarce. 2) Research reflecting the decoupling relationship and spatiotemporal evolution characteristics between different water use accounts’ utilization of water resources and economic development based on the water resource ecological footprint model is scarcely reported. In terms of the contributions of this paper, two key aspects stand out. Firstly, it investigates the variations in the water resources ecological footprint across different sectors at the county level. Previous studies mainly focused on national, river basin, or provincial levels. Variations across different regional scales were not explored. It is worth noting that in China’s development plan, the city and county levels are more conducive to the concrete implementation of policies. Thus, the decoupling relationship between water resources utilization and economic development in smaller spatial units needs to be further explored as well. This can help to provide specific and pivotal zoning management strategies. Secondly, building upon the evaluation of water resource ecological footprints, this study introduces the method of decoupling analyses to investigate the status of decoupling between water usage and economic development. While prior literature concentrated solely on the decoupling situation between the agricultural sector and economic development, this paper holistically considers the water consumption scenarios from multiple sectors including agricultural, industrial, domestic, ecological, and public water use about the decoupling dynamics with economic development. In essence, this analytical approach can be adopted by other researchers to explore the degree of decoupling between economic development and water resource ecological footprints in similar regional sectors.
The karst landforms are extensively developed in Qian’nan Prefecture, Guizhou Province. Severe fissure leakage occurs, particularly during clear spring and summer seasons, where surface water continually evaporates upward and infiltrates downward, leading to rapid arid conditions. However, when heavy rain or storms arrive, subterranean rivers swell, overflowing onto the surface, stagnating in low-lying basins, forming transient mountainous ponds. Water resources exhibit uneven spatiotemporal distribution, with more in the central and southern regions and less in the north. In recent years, accelerated urbanization and industrialization in Qian’nan Prefecture, driven by economic growth and ecological civilization initiatives, have intensified challenges in water resource development. The region faces difficulties in water resource allocation, inadequate capacity for distribution, and exacerbated water ecological damage, significantly impacting sustainable economic development. Given the complexity of water resources in Qian’nan Prefecture and considerable disparities in local water usage structures and efficiency, tailored adjustments in water resource utilization according to varying developmental stages are crucial. Each locality must harmonize the relationship between water resource utilization and economic development according to its unique context.
This paper takes 12 counties (cities) in Qian’nan Prefecture as an example. It utilizes the water resources ecological footprint and decoupling models to explore the spatiotemporal characteristics of water resources ecological footprint in Qian’nan region. Furthermore, it investigates the coupling relationship between water resources ecological footprint and economic growth. This exploration aims to provide a reference basis for the sustainable utilization of water resources and the adjustment of industrial structures in Qian’nan Prefecture. The purpose of this study is as follows: 1) to elucidate the temporal evolution pattern of the water resources ecological footprint in Qian’nan Prefecture from 2009 to 2019; 2) to clarify the spatial distribution pattern of the water resources ecological footprint in Qian’nan Prefecture; and 3) to explore the decoupling relationship between the water resources ecological footprint and economic development in Qian’nan Prefecture. The research findings may provide a scientific basis and policy enlightenment for addressing the conflict between water resources utilization and economic development, optimizing the allocation of water resources, and promoting a sustainable economy and society.
2 Materials and methods
2.1 Overview of the study area and data sources
The total area of Qian’nan Prefecture is 2.62 × 10⁴ km2, situated in the central-southern part of Guizhou Province with a terrain that slopes from north to south (see Figure 1). Within its administrative jurisdiction are 12 counties (or cities), namely Duyun City, Fuquan City, Weng’an County, Longli County, Guiding County, Sandu County, Changshun County, Huishui County, Pingtang County, Dushan County, Libo County, and Luodian County. Qian’nan Prefecture falls within the subtropical monsoon humid climate (Yang et al., 2019), experiencing concurrent rainfall and warmth during the monsoon season, with summer precipitation accounting for over 75% of the total annual precipitation, averaging around 1300 mm annually. The river systems in Qian’nan Prefecture are divided by the Miaoling Mountains: the northern part belongs to the Wujiang River system and Yuanjiang River system within the Yangtze River Basin, while the southern part is part of the Hongshui River system and Liujiang River system within the Pearl River Basin (Tan and Qin, 2019).
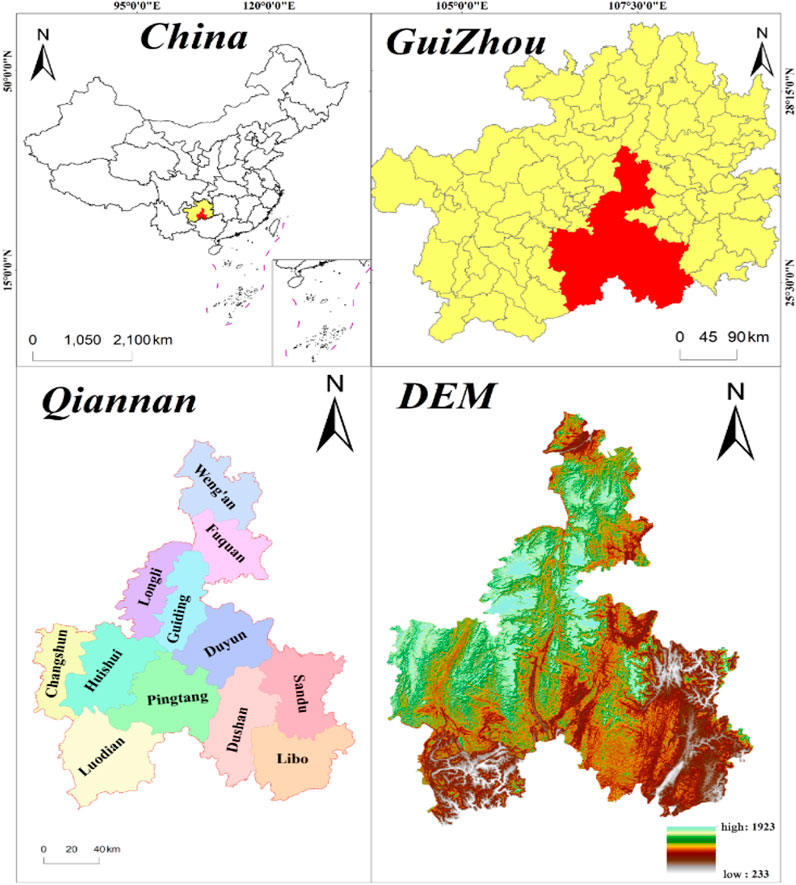
FIGURE 1. Overview of the study area.
The area, GDP, population, and other relevant data for various regions within Qian’nan Prefecture are sourced from the Statistical Yearbook of Qian’nan Prefecture, Guizhou Province (UNSD, 2023). Data on annual precipitation, water resource utilization, and total volume are obtained from the Qian’nan Prefecture Water Resources Bulletin spanning from 2009 to 2019 (Water Resources Bureau of Qian’nan, 2019). Taking 2019 as an example, the basic data are detailed in Table 1, and other relevant data are shown in attachments.
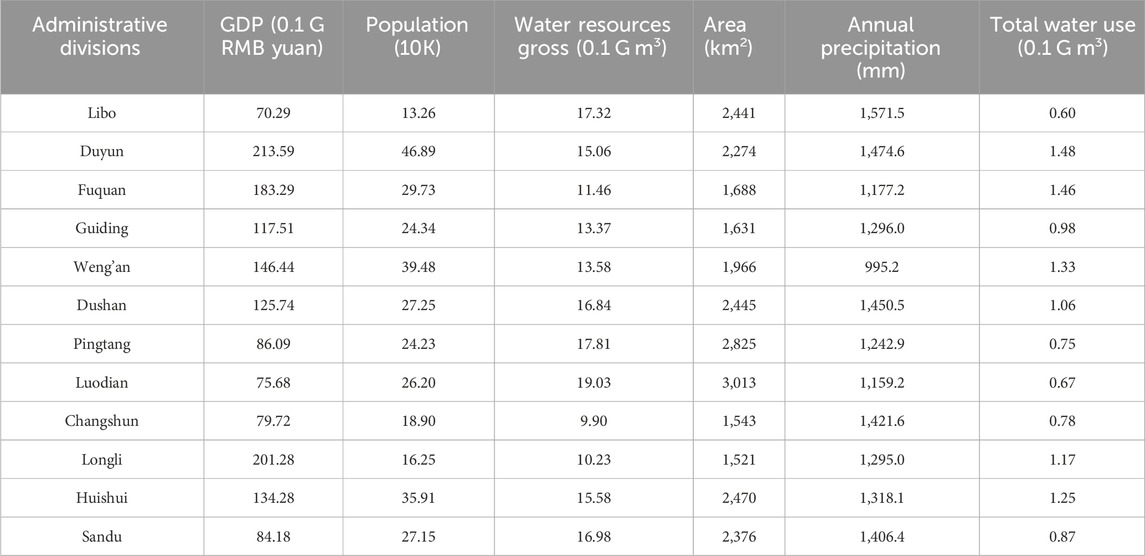
TABLE 1. Basic overview of different administrative divisions of Qian’nan in 2019.
2.2 Ecological footprint of water resource model
2.2.1 Ecological footprint of water resources
The water resource ecological footprint represents the land area required to accommodate the water consumption associated with human activities in production, daily life, and sustaining natural ecosystem development. In this paper, the total water resource ecological footprint (TEFw) is divided into five categories: ecological footprint of agricultural water resources (AEFw), ecological footprint of industrial water resources (IEFw), ecological footprint of urban public water resources (UEFw), ecological footprint of domestic water resources (DEFw), and ecological footprint of water resources for ecological purposes (EEFw). The calculation model is as follows:
Where, EFw represents the water resource ecological footprint (hm2); γ is the global balancing factor, valued at 5.19; W stands for water usage; Pw represents the global average water production capacity, valued at 3140 m3/hm2 (Chen et al., 2014).
2.2.2 Carrying capacity of water resources
Where, ECw (hm2) is the carrying capacity of water resources; Φ is the regional water resource yield factor; Q (m3) is the regional total amount of water resource, and it is a normal practice to allocate 60% of the available supply land to protect the local biodiversity (Wackernagel et al., 1999; Swiader et al., 2020); S (hm2) is the regional total area.
2.2.3 The efficiency of water resource ecological footprint
To measure the water resource utilization efficiency, we constructed the water resource ecological footprint per 10,000 Yuan GDP index. The index is simply the ratio of water resource ecological footprint to GDP. It can be calculated as:
2.2.4 Water resources ecological surplus or deficit
Where, EDw is the difference between water resources ecological footprint and the carrying capacity of water resources. When EDw > 0, it indicates an ecological surplus of water resources, signifying ample water resources in the region. When EDw < 0, it indicates an ecological deficit of water resources, representing a scarcity of water resources in the region. EDw = 0 denotes a balanced state in water resource utilization (Wen et al., 2013).
2.2.5 Water resource ecological pressure
Water resource ecological pressure (EPI) is calculated as the ratio between the water resource ecological footprint (EFw) and the carrying capacity of water resources (ECw):
When EPI > 1, it indicates that the regional water supply is lower than consumption, posing a threat to sustainable water resource utilization. Additionally, a higher value signifies increased pressure on water resources. When EPI = 1, it signifies a balance between water supply and consumption in the region. When 0 < EPI < 1, it indicates that the regional water supply exceeds consumption, signifying a safe status in water resource utilization (Tan and Zheng, 2009).
2.3 Decoupling model
The decoupling model is commonly employed to delineate the changing relationship between the economy and environmental resources. This study computes the decoupling index of water resource ecological footprint from economic development based on the Tapio model. The evaluation criteria for the decoupling status were established utilizing existing research findings (Vaillancourt, 1999) (see Table 2). The model calculation formula is as follows:
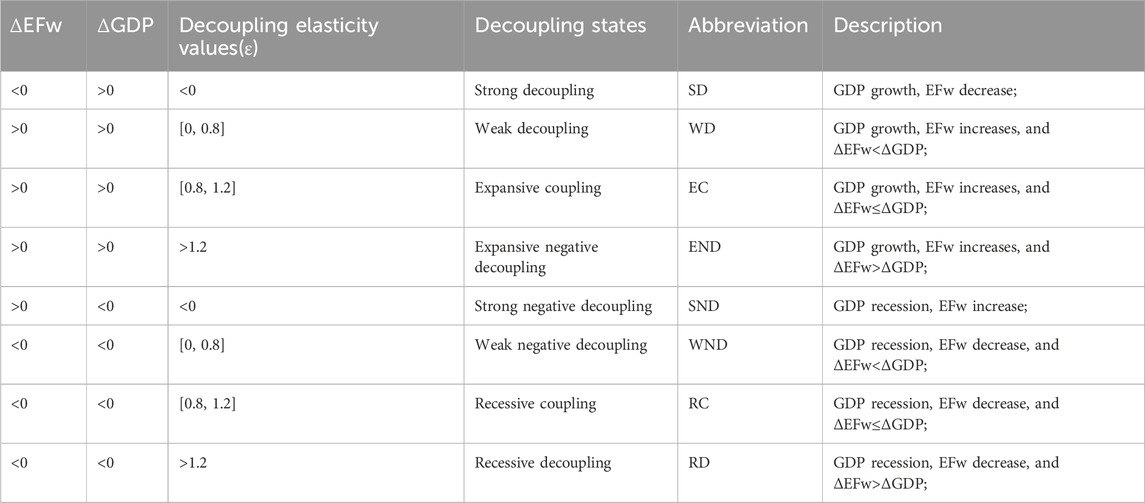
TABLE 2. Tapio decoupling model and discrimination criteria.
Where, ε represents the decoupling elasticity index; EFw and ΔEFw denote the water resource ecological footprint and its growth rate; GDP and ΔGDP stand for GDP and its growth rate; EFw(n) and EFw(n-1) respectively indicate the water resource ecological footprint of the study area in year n and year n-1; GDPn and GDPn-1 respectively represent the GDP of the study area in year n and year n-1.
3 Results
3.1 Temporal and spatial analysis of water resource ecological footprint in Qian’nan prefecture
3.1.1 The dynamic changes of water resource ecological footprint in Qian’nan prefecture
The different types of water resource ecological footprints in Qian’nan Prefecture from 2009 to 2019 are depicted in Figure 2, calculated by Eq. 1. The overall trend of the total water resource ecological footprint in Qian’nan Prefecture during 2009–2019 shows an upward trajectory, averaging at 1.87 million hectares. This fluctuated within the range of 1.60–2.06 million hectares.
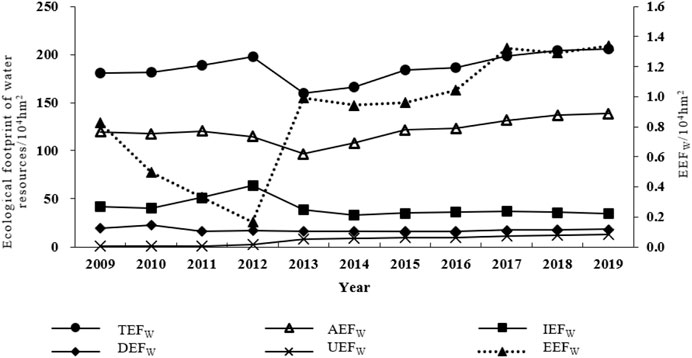
FIGURE 2. The changing trend of the water resources ecological footprint in Qian’nan Prefecture from 2009 to 2019.
The proportional distribution of different types of water resource ecological footprints in Qian’nan Prefecture from 2009 to 2019 is as follows: The AEFw accounted for an average of 64.67%, the highest proportion. This is consistent with the actual situation shown in the Qian’nan Prefecture Water Resources Bulletin where agricultural irrigation water consumption accounts for approximately 60% of the total water consumption in the prefecture. Before 2013, there was a gradual decline in the ecological footprint of agricultural water resources, with 2013 marking a turning point, as thereafter it increased continually. This shift is attributed to the unprecedented emphasis on ecological civilization construction post the “Eighteenth National Congress,” signifying Qian’nan Prefecture’s transition toward a “green and sustainable” model. The IEFw averaged 21.82%, with 2012 as the inflection point. Before 2012, the ecological footprint of industrial water resources steadily rose, but post-2012, it began a rapid decline, ranking second. This trend contrasts with the changes observed in agricultural water resource ecological footprints, reflecting the transformative shift in Qian’nan Prefecture’s economic development. The DEFw maintained a relatively stable average proportion of 9.33%, ranking third. The UEFw averaged 3.71%. Meanwhile, the EEFw averaged 0.47%. From 2012, its proportion increased from 0.1% to 0.67% in 2019, marking a 6.7-fold growth, the fastest increase among the categories. However, its share remains noticeably lower compared to other accounts.
The carrying capacity of water resources in Qian’nan Prefecture, as derived from Eqs 2, 3, is illustrated in Figure 3. According to the Water Resources Bulletin of Qian’nan Prefecture, an unprecedented severe drought occurred in Qian’nan Prefecture from May to August 2011, marking the driest period recorded in meteorological history. During this time, river water inflow was significantly lower by 50%–90% compared to the usual levels, with a 73% decrease in effective reservoir storage compared to the same period in typical years and a 61% reduction from the previous year. The carrying capacity of water resources hit its lowest point in 2011, measuring 11.86 million hectares.
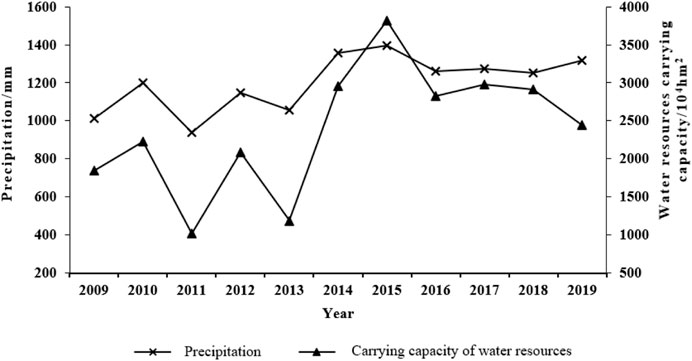
FIGURE 3. Trends in water resource carrying capacity and precipitation changes in Qian’nan Prefecture from 2009 to 2019.
In 2015, Qian’nan Prefecture experienced abundant precipitation, with an average annual precipitation of 1,395.80 mm, equivalent to approximately 36.60 billion m3 of water, marking a 2.9% increase from the preceding year and a 13.0% surplus compared to the long-term average precipitation. Correspondingly, in 2015, the carrying capacity of water resources in Qian’nan Prefecture peaked at 38.20 million hectares. The findings align with those of Deng et al. (2023), indicating a close relationship between the strength of regional water resource ecological carrying capacity and precipitation levels. The ecological carrying capacity of water resources fluctuates in response to variations in precipitation. There exists a parallel trajectory between the changes in water resource ecological carrying capacity and precipitation levels, demonstrating a high positive correlation between the two factors.
The ecological footprint of water resources per ten thousand Yuan GDP, as derived from Eq. 4, is depicted in Figure 4. The indicator exhibits a gradual decline, indicating a progressive improvement in water resource utilization efficiency. In 2009, Qian’nan Prefecture’s ecological footprint of water resources per ten thousand Yuan GDP stood at 0.60 ha/ten thousand Yuan, decreasing to 0.14 ha/ten thousand Yuan by 2019.
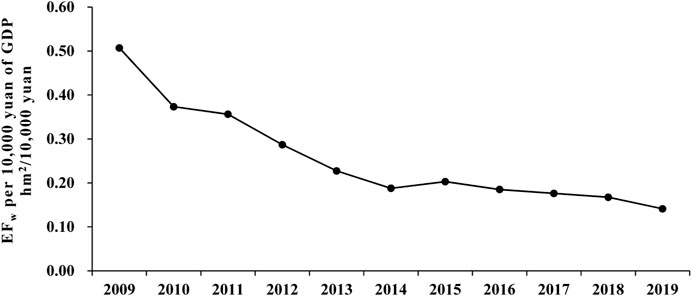
FIGURE 4. The trend of water resources ecological footprint per 10,000 yuan of GDP in Qian’nan Prefecture from 2009 to 2019.
In 2019, Qian’nan Prefecture’s ecological footprint of water resources per ten thousand Yuan GDP equaled that of Yunnan Province in 2018 (Han et al., 2021). However, compared to Chengdu City, Sichuan Province in 2016 (0.07 ha/ten thousand Yuan) (Liu and Yan, 2020) and Jilin Province in 2020 (0.06 ha/ten thousand Yuan) (Zhu et al., 2020), Qian’nan Prefecture still has room for further reduction in its ecological footprint of water resources per ten thousand Yuan GDP.
Based on Eqs 5, 6, the ecological surplus of water resources and the ecological pressure index for Qian’nan Prefecture from 2009 to 2019 were obtained, as depicted in Figure 5. The figure illustrates that the ecological surplus of water resources fluctuated in an upward trend, while the ecological pressure index fluctuated in a downward trend. The ecological surplus of water resources and the ecological pressure index demonstrate contrasting trends: as the ecological surplus of water resources increases, the water ecological pressure index decreases, and vice versa. From 2009–2019, Qian’nan Prefecture maintained an ecological surplus of water resources exceeding 5 million hectares and a water ecological pressure index below 1. This signifies that the state of water resource utilization in Qian’nan Prefecture is secure.
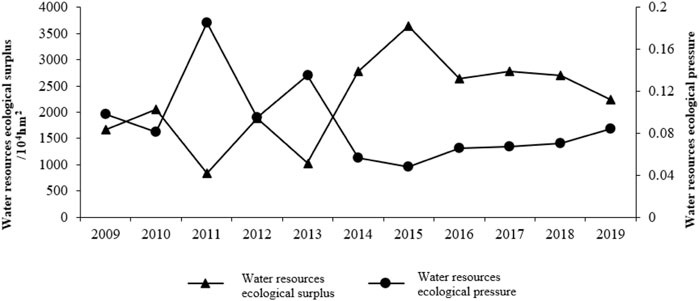
FIGURE 5. The trend of water resource ecological surplus and ecological pressure index in Qian’nan Prefecture from 2009 to 2019.
3.1.2 The spatial distribution characteristics of water resource ecological footprint in Qian’nan prefecture
The total water resource ecological footprints for various counties (cities) in Qian’nan Prefecture, along with different water use accounts, are illustrated in Figure 6. Counties (cities) in Qian’nan Prefecture from 2010 to 2019 were classified into two categories based on the magnitude of their total water resource ecological footprints: one group had ecological footprints of water resources exceeding 140,000 ha, including Weng’an, Duyun, Fuquan, Longli, Huishui, and Dushan; the other group had footprints below 140,000 ha, encompassing Guiding, Changshun, Luodian, Pingtang, Sandu, and Libo. According to the Statistical Bulletin of National Economic and Social Development in Qian’nan Prefecture from 2010 to 2019, the counties (cities) with total water resource ecological footprints exceeding 140,000 ha also held higher GDP rankings. Therefore, it can be inferred that counties (cities) with comparatively higher GDP rankings in Qian’nan Prefecture have higher water resource ecological footprints compared to those with lower GDP rankings.
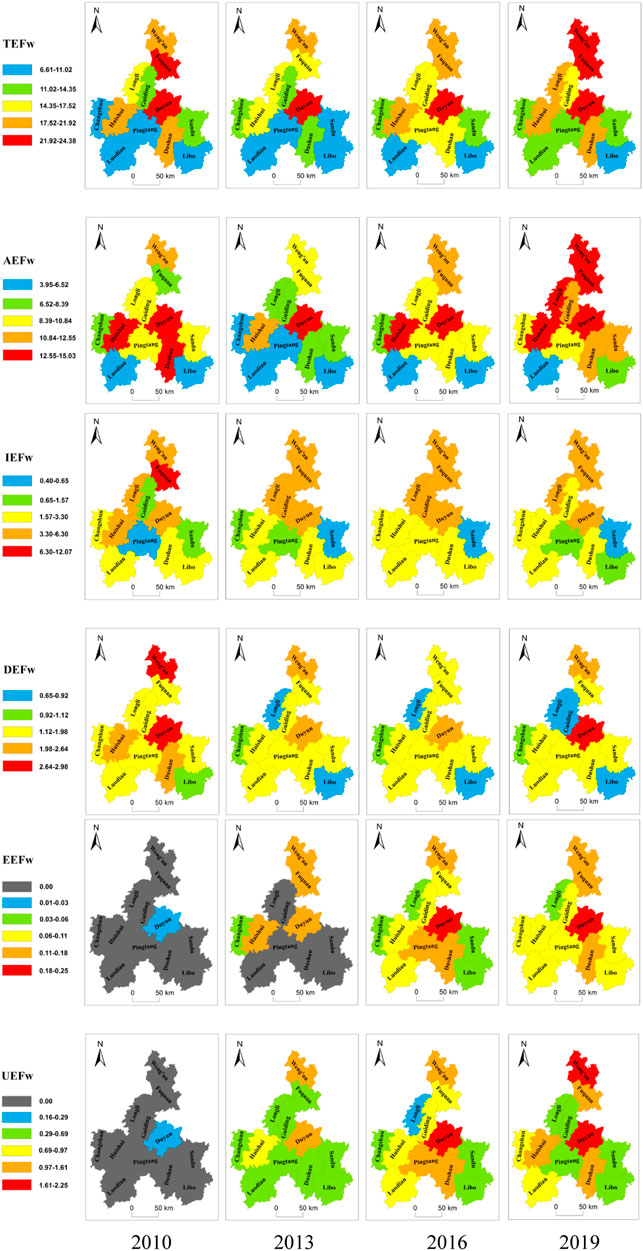
FIGURE 6. Spatial distribution characteristics of different types of water resource ecological footprints (10,000 hm2) in Qian’nan Prefecture.
Throughout 2010–2019, the AEFw in each county (city) of Qian’nan Prefecture consistently constituted the largest proportion among all accounts, surpassing 50% in all instances. There was a consistent pattern observed in the change of AEFw across these areas: before 2013, they exhibited a gradual decline, followed by a slow increase post-2013. This change primarily resulted from the strengthened emphasis on ecological civilization construction. As Guizhou Province is designated as a national ecological civilization construction zone, counties and cities cannot continue development along traditional industrial lines but must embark on a path of ecological civilization development.
From 2010 to 2019, the IEFw in each county (city) of Qian’nan Prefecture ranked second among all accounts (except for Sandu and Pingtang). Contrary to the pattern observed in AEFw, the IEFw showcased an opposite trend: before 2013, they exhibited a gradual increase, followed by a gradual decrease post-2013. This once again confirms the changes induced by economic development transitions. During 2010–2019, the DEFw in each county (city) of Qian’nan Prefecture ranked third among all accounts (except for Sandu and Pingtang). Before 2013, except for Duyun due to data absence or lack of statistical data, the UEFw and EEFw were both zero. Post-2013, the UEFw and EEFw gradually increased across counties (cities). However, their overall contribution remained relatively low among all accounts, collectively not exceeding 10%.
The EFw per ten thousand Yuan GDP across various regions in Qian’nan Prefecture is depicted in Figure 7. From 2010 to 2019, the EFw per ten thousand Yuan GDP in each county (city) exhibited a decreasing trend, indicating a gradual enhancement in water resource utilization across Qian’nan Prefecture. In 2010, Dushan County had the highest EFw per ten thousand Yuan GDP at 0.79 ha/ten thousand Yuan, which declined to 0.14 ha/ten thousand Yuan by 2019, marking an 82.5% decrease. In contrast, Duyun County had the lowest EFw per ten thousand Yuan GDP in 2010 at 0.3 ha/ten thousand Yuan, which decreased to 0.11 ha/ten thousand Yuan by 2019, indicating a 61.6% reduction. Although Duyun County did not experience as significant a decrease in the EFw per ten thousand Yuan GDP compared to Dushan County, its resistance to further improving water resource utilization, given its minimal EFw per ten thousand Yuan GDP, is far greater than that faced by Dushan County.
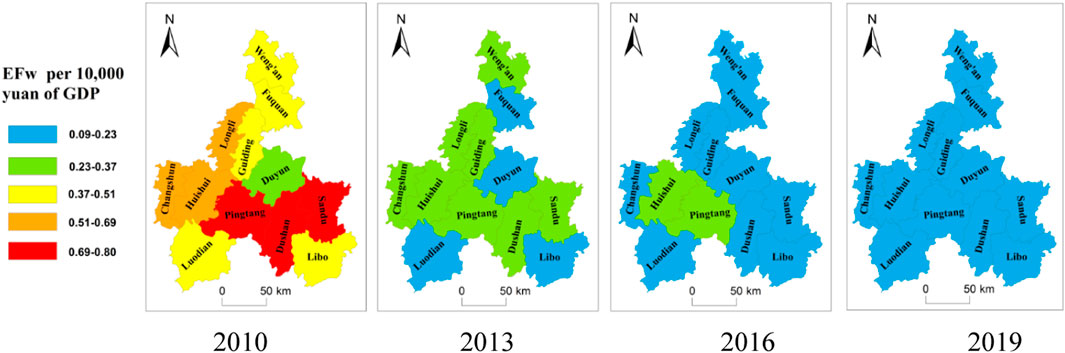
FIGURE 7. The spatiotemporal variations in the ecological footprint of water resources per ten thousand Yuan GDP (hm2/ten thousand Yuan) across counties (cities)in Qian’nan Prefecture.
The spatiotemporal changes in water resource ecological pressure across counties (cities) in Qian’nan Prefecture, as observed in Figure 8, indicate that historically, economically developed areas in Qian’nan Prefecture have exhibited relatively higher water resource ecological pressure. However, in tandem with economic development, there’s a corresponding decline in the water resource ecological pressure index. Regions with comparatively less developed economies showcase lower water resource ecological pressure than those with better economic conditions. Overall, across all regions in Qian’nan Prefecture, the water resource ecological pressure remains below 1, signifying that the utilization of water resources in each county (city) is within a secure range.
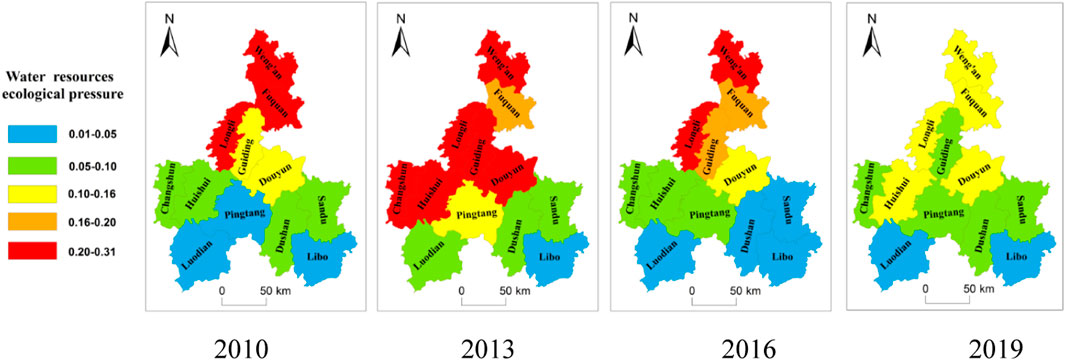
FIGURE 8. The spatiotemporal variations in water resource ecological pressure across counties (cities) in Qian’nan Prefecture.
This water resources ecological footprint model provides a clearer and more comprehensive way to understand the characteristics and evolutionary patterns of water resources in karst regions. Other regions can develop similar models according to their own circumstances to better manage water resources. This may involve establishing region-specific water resources management frameworks and utilizing local conditions to guide policy and practice.
3.2 The decoupling analysis between water resource ecological footprint and economic development in Qian’nan prefecture
3.2.1 Dynamic analysis of the decoupling relationship between the ecological footprint of water resources and economic growth in Qian’nan prefecture
Table 3 illustrates the ecological footprint of water resources in various accounts and the decoupling elasticity indices of economic growth in Qian’nan Prefecture from 2010 to 2019 based on Eq. 7. The GDP of Qian’nan Prefecture increased from 30.263 billion RMB to 151.804 billion RMB during this period, marking a more than fourfold growth. Simultaneously, the total ecological footprint of water resources expanded from 1.6 million hectares to 2.06 million hectares, representing a growth of approximately 0.3 times its initial value. The average annual growth rate of GDP was 4.68%, whereas the average annual growth rate of the total ecological footprint of water resources stood at 1.60%. The GDP’s average annual growth rate exceeded that of the total ecological footprint of water resources. It can be deduced that, except for 2013 and 2015, Qian’nan Prefecture experienced a weak decoupling between the total ecological footprint of water resources and economic growth throughout the study period.
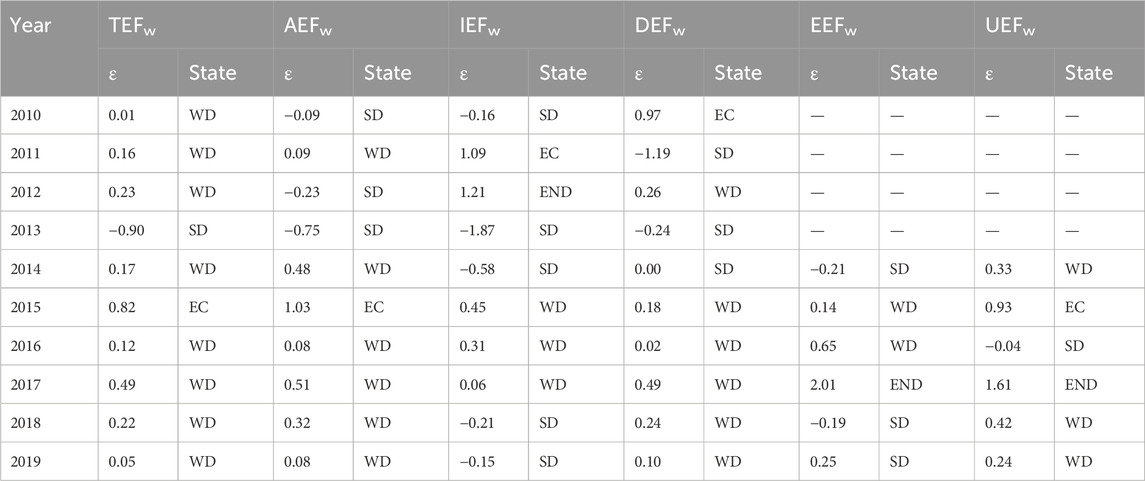
TABLE 3. Decoupling the relationship between ecological footprints of water resources and economic growth in different accounts in Qian’nan Prefecture.
Analyzing different water usage accounts, it is observed that during the study period, the decoupling status between the AEFw and the economy mainly manifested as weak decoupling. There were three instances of strong decoupling, six instances of weak decoupling, and one instance of expansive coupling. The AEFw exhibited a growth lag behind economic development. Regarding the decoupling status between the IEFw and the economy, it predominantly showed strong decoupling, with five instances of strong decoupling, three instances of weak decoupling, one instance of expansive coupling, and one instance of expansive negative decoupling. This trend indicates a positive overall development in the decoupling form, achieving a decline in the ecological footprint of water resources while maintaining economic growth. The decoupling status between the DEFw and the economy also primarily demonstrated weak decoupling, with six instances of weak decoupling, three instances of strong decoupling, and one instance of expansive coupling. Due to the absence of data for most counties (cities) concerning the UEFw and EEFw before 2013, they were not included in the calculations. However, post-2013, the decoupling status of UEFw and EEFw with the economy primarily reflected weak decoupling. This suggests an initiation of increased urban public water use and ecological water use, albeit at a growth rate lower than that of the economy.
3.2.2 Spatial analysis of the decoupling relationship between the ecological footprint of water resources and economic growth in Qian’nan prefecture
As depicted in Figure 9, the decoupling status between the TEFw and the economy in most counties (cities) of Qian’nan Prefecture exhibits an alternating pattern between strong and weak decoupling. Specifically, the decoupling status in Guiding County gradually shifted from a state of strong negative decoupling to an alternating pattern of strong and weak decoupling. However, Duyun City, Weng’an County, Fuquan City, and Luodian County experienced a deteriorating decoupling status, showing an increasing dependency on economic growth on water resources.
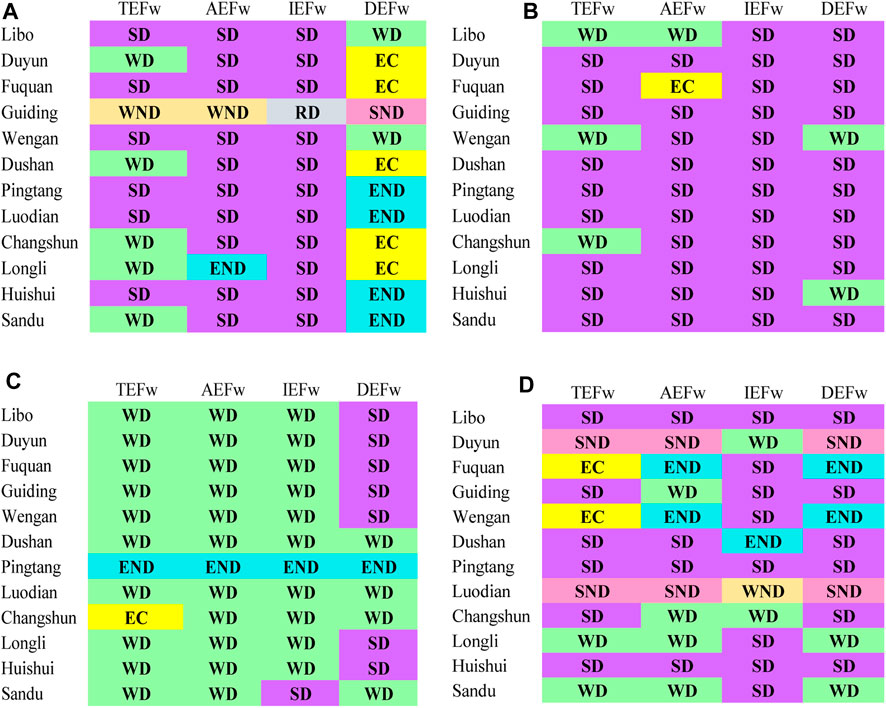
FIGURE 9. The decoupling relationship between the ecological footprint of water resources and economic development across counties (cities) in Qian’nan Prefecture: (A) description of the decoupling relationship in the year 2010; (B) description of the decoupling relationship in the year 2013; (C) description of the decoupling relationship in the year 2016; (D) description of the decoupling relationship in the year 2019.
Regarding decoupling in AEFw, Guiding and Longli counties exhibited weak and expansive negative decoupling in 2010 (Figure 9A), but with the reduction in the ecological footprint of water resources, they shifted back to a state of strong decoupling. Post-2013, they stabilized in a state of weak decoupling, indicating a relatively coordinated relationship between the AEFw and economic growth. Conversely, the GDP growth rates of Duyun City, Weng’an County, Fuquan City, and Luodian County gradually fell below the growth rates of the AEFw, indicating an uncoordinated relationship between the two factors. Other counties (cities) generally maintained an ideal decoupling status.
In terms of decoupling in the IEFw, apart from Guiding County in 2010, other counties (cities) exhibited a strong decoupling status. By 2013 (Figure 9B), all counties (cities) achieved an ideal state of strong decoupling between the IEFw and economic growth, indicating a coordinated relationship where industrial water consumption decreased alongside economic growth. In 2016 (Figure 9C), Pingtang County experienced expansive negative decoupling, while other areas remained in a state of strong or weak decoupling. By 2019 (Figure 9D), except for Luodian and Dushan counties, the relationship between industrial water consumption and economic growth in other counties (cities) remained uncoordinated, with most maintaining an ideal state of strong decoupling. Concerning decoupling in the DEFw, in 2010, except for Weng’an County and Libo County, the relationship between DEFw and economic growth in the other 10 counties (cities) was uncoordinated. However, from 2013 to 2016, the overall decoupling status improved to a relatively ideal state.
The study reveals the coupling dynamics between water resources and economic development, which also has instructive significance for other regions. Other areas can draw on this approach to explore the mutual relationship between water resources and economic development, thereby promoting a more effective synergy between the two.
4 Discussion
To investigate the decoupling relationship between water resource utilization and economic development at the county scale, this study initially employed the water resources ecological footprint model to analyze the dynamic changes and spatial distribution characteristics of different water usage accounts within Qian’nan Prefecture. Subsequently, a decoupling model was utilized to explore the relationship between the water resources’ ecological footprint of various usage accounts and the economic growth in this region, culminating in proposed strategic recommendations. Currently, scholars have examined the relationship between water resource utilization and economic development. However, existing studies predominantly focus on the correlation between economic development in the agricultural sector and water resource utilization in water-scarce regions. This overlooks the relationship between economic development and water resource utilization in water-abundant regions, as well as neglecting research on the relationship between water utilization and other economic sectors, thus resulting in a one-sided understanding of the relationship between economic development and water resource utilization. Zhang’s research (Zhang et al., 2023) concludes that there is a significant decoupling relationship between the water ecological footprint and economic growth in water-scarce plain areas, with noticeable variations in the degree of decoupling among different counties during the study period. However, this study reveals that in water-abundant karst mountainous areas, the degree of decoupling between water ecological footprint and economic development across different counties is not markedly distinct. In water-scarce regions, achieving decoupling between economic development and water resources requires a greater emphasis on improving water-saving technologies and the application of water-saving equipment, especially in areas predominantly focused on agriculture in plains. Consequently, differences in water-saving technologies and facilities among counties in water-scarce regions lead to significant variations in the degree of decoupling between water resources and economic development. In water-abundant karst mountainous areas, however, the enhancement of water-saving technologies and the application of water-saving equipment are no longer the key factors for decoupling economic development from water resources. Counties rely primarily on their water resource endowment to achieve a basic decoupling between water resources and economic development, thus resulting in less pronounced differences in decoupling relationships.
During the economic development process in various counties of Qian’nan, periods of lower economic development often occur without constraints from water resources. However, as economic growth reaches a certain level, the decoupling relationship between economic development and water resources deteriorates. To achieve decoupling between economic development and water resources at this stage, it is imperative to rely on water-saving strategies and the efficiency of large-scale production to ensure that economic development is not hindered by water resource limitations. (1) The findings reveal that agricultural activities constitute the primary water consumer in Qian’nan Prefecture, followed by industrial use, with the least attributed to domestic, ecological, and public water consumption. Economic development emerges as the primary driver behind the escalating water consumption, aligning with the conclusions drawn by Shi et al. (2020), who observed a shift in Gansu Province’s agricultural water usage’s predominant driving factor from technological effects to economic effects. Furthermore, this research identifies that changes in economic structure significantly influence alterations in water consumption structure—where agricultural water usage increases while industrial water usage decreases, and conversely, industrial water usage increases while agricultural water usage decreases. This aligns with Wu et al. (2022) assertion that when water efficiency reaches its limit, controlling water consumption necessitates adjustments in economic structure. The ecological carrying capacity of water resources in Qian’nan Prefecture showed a positive correlation with rainfall. Abundant rainfall led to higher water ecological carrying capacity, while inadequate rainfall resulted in lower carrying capacity, fluctuating but consistently above 10 million hectares. Throughout 2009–2019, Qian’nan Prefecture maintained an ecological surplus state in water resources, with a water stress index below 1, signifying a safe level of water resource utilization. From the perspective of the water resources’ ecological footprint per 10,000 RMB of GDP, Qian’nan Prefecture demonstrates relatively low water use efficiency, indicating substantial room for improvement. (2) The decoupling coefficient exhibits significant fluctuations and considerable disparities among different counties (cities). It can be seen from Table 2 that the agricultural water resources ecological footprint in Qian’nan Prefecture exhibited strong decoupling with the economic growth for 3 years (2010, 2012, and 2013) and weak decoupling for 6 years (2011, 2014, 2016, 2017, 2018, and 2019). Overall, they have undergone a process from “strong” to “weak.” This indicates that despite the surplus status and lower ecological pressure on water resources in Qian’nan Prefecture, the economic output’s dependence on water resources has increased instead of decreasing, mainly due to lower water utilization efficiency. This aligns with similar findings in the studies by (Li et al., 2023; Wu et al., 2021), where cities with higher water ecological carrying capacity experienced an increased dependence of economic output on water resources, while cities with lower water ecological carrying capacity showcased a gradual decrease in this dependence. This underscores that the impact of water resources on economic development is temporary, as water-deficient regions can elevate their technological capabilities to achieve decoupling from water resources, while regions abundant in water resources might face economic constraints due to inefficient water utilization.
The research results provide reference significance for the sustainable development of county-level economies and water resources management in similar karst regions. Other regions can draw insights from this and formulate sustainable development strategies tailored to their own circumstances, as well as improve water resources management practices to address similar challenges. The paper proposes a series of recommended measures such as improving water resource efficiency, adjusting economic structures, and deploying advanced water-saving technologies and equipment. These measures can serve as references for other regions to help improve water resources management and achieve more sustainable development. Therefore, researchers and decision-makers in other regions can draw on these results and insights to conduct similar research and practices, and make adjustments and improvements according to their local conditions and needs, in order to promote sustainable development and water resources management in their respective areas.
5 Conclusion
This study employs the water resources’ ecological footprint model to analyze water usage trends in Qian’nan Prefecture. It also uses a decoupling model to study the correlation between the ecological footprint of water resources and regional economic growth, yielding the following main conclusions:
1. Between 2009 and 2019, the total ecological footprint of water resources in Qian’nan Prefecture experienced a gradual increase within the range of 1.6–2.06 million hectares. Agricultural water resource ecological footprint constituted the largest proportion, followed by industrial and domestic water resource ecological footprints. Urban public water resource ecological footprint and ecological water resource ecological footprint were the smallest in comparison.
2. The water resource ecological footprint in each county (city) of Qian’nan Prefecture correlates with economic levels, showcasing larger ecological footprints in economically developed regions and smaller footprints in economically underdeveloped areas. Spatially, there’s a distribution pattern where the northern areas, being more economically developed, exhibit higher water resource ecological footprints, while the southern areas, comparatively less economically developed, display lower ecological footprints in water resources. This spatial distribution pattern is consistent across all sectors (agricultural, industrial, domestic), showing similar trends in their water resource ecological footprints.
3. In most counties (cities) of Qian’nan Prefecture, there exists an alternating pattern of strong and weak decoupling between water resource ecological footprint and economic development. Specifically, in Duyun, Weng’an, Fuquan, and Luodian, the decoupling status of agricultural and domestic water resource ecological footprints with economic development has deteriorated over time.
Based on the conclusions, there are several policy recommendations.
(1) In Qian’nan Prefecture, it is imperative to enhance the efficiency of water resource utilization within the production sectors and to further monitor and control the overall ecological footprint of water resources. Particularly crucial is the reduction of the water resources ecological footprint in agriculture. Strengthen the implementation of water-saving policies and agricultural mechanization to achieve large-scale agricultural operations. The application and promotion of water-saving irrigation technology can increase agricultural output while reducing irrigation water consumption (Wang and Lin, 2021). To uphold a pristine ecological environment, there is a need to augment the proportion of eco-water within the ecological footprint of water resources.
(2) When considering the influence of water resources on economic development in counties with varying levels of economic advancement within Qian’nan Prefecture, attention should be directed not only towards the efficiency of water resource utilization but also towards the adjustment of economic structure.
(3) The decoupling relationship between the ecological footprint of water resources and economic development can serve as a criterion for formulating corresponding water resource management measures. Specifically, in the four counties (cities) of Duyun, Weng’an, Fuquan, and Luodian, emphasis should be placed on adjusting and transforming the economic structure to ameliorate the constraints imposed by water resources on economic development.
This article aims to offer valuable theoretical insights into the correlation between water resource utilization and economic development in karst counties. Firstly, the water resources ecological footprint model developed herein furnishes a more lucid and comprehensive comprehension of the characteristics and evolutionary patterns of water resources in karst regions. This facilitates the establishment of a water resources management framework tailored to the specific local conditions. Secondly, elucidating the coupling dynamics between water resources and economic development aids in crafting an efficacious synergy between the two domains. Lastly, the research findings of this study bear reference significance for fostering sustainable development in county-level economies and managing water resources in analogous karst areas. Recommendations are also proffered to enhance water resource efficiency, adjust industrial structures, and deploy advanced water-saving technologies and equipment. It is anticipated that such measures will be undertaken to elevate the water resources management proficiency of stakeholders. Nonetheless, this article did not delve deeply into the driving mechanisms behind the spatiotemporal evolution of the ecological footprint of water resources, nor did it undertake an exhaustive investigation into the rationales underlying shifts in the decoupling relationship between water resources and economic development. Hence, in future research on the nexus between water resource utilization and economic development at the scale of karst counties, elucidating driving mechanisms should be the focal point.
Data availability statement
The original contributions presented in the study are included in the article/supplementary material, further inquiries can be directed to the corresponding authors.
Author contributions
YS: Conceptualization, Data curation, Funding acquisition, Supervision, Writing–original draft. SL: Data curation, Investigation, Validation, Writing–original draft. JR: Funding acquisition, Supervision, Writing–review and editing. ZZ: Conceptualization, Data curation, Visualization, Writing–original draft.
Funding
The author(s) declare that financial support was received for the research, authorship, and/or publication of this article. This research is funded by the Young Scientific and Technological Talents Growth Project of Guizhou Provincial Department of Education [QJHKMYZi (2022) No. 181], Guizhou Provincial Science and Technology Projects [QKMHZKM (2022) No. 205; QKMHZKM (2022) No. 277; QKMHZKM (2023) No. 199], Karst Plateau Resources and Environmental Remote Sensing Talent Team [BWRLT (2023) No. 14], Intelligent Geographic Spatial Information Application Engineering Center [BKLH (2023) No. 08]. Natural Science Foundation of Guizhou Minzu University (GZMUZK[2023]QN07).
Conflict of interest
The authors declare that the research was conducted in the absence of any commercial or financial relationships that could be construed as a potential conflict of interest.
Publisher’s note
All claims expressed in this article are solely those of the authors and do not necessarily represent those of their affiliated organizations, or those of the publisher, the editors and the reviewers. Any product that may be evaluated in this article, or claim that may be made by its manufacturer, is not guaranteed or endorsed by the publisher.
References
Bai, Y., Zhang, T., Zhai, Y., Shen, X., Ma, X., Zhang, R., et al. (2021). Water footprint coupled economic impact assessment for maize production in China. Sci. Total Environ. 752, 141963. doi:10.1016/j.scitotenv.2020.141963
Bian, D., Yang, X., Lu, Y., Chen, H., Sun, B., Wu, F., et al. (2023). Analysis of the spatiotemporal patterns and decoupling effects of China's water resource spatial equilibrium. Environ. Res. 216, 114719. doi:10.1016/j.envres.2022.114719
Cao, S., He, Z., Wang, S., and Niu, J. (2023). Decoupling analysis of water consumption and economic growth in tourism in arid areas: case of xinjiang, China. Sustainability 15 (13), 10379. doi:10.3390/su151310379
Chang, Y. J., and Zhu, D. (2021). Water utilization and treatment efficiency of China's provinces and decoupling analysis based on policy implementation. Resour. Conservation Recycl. 168, 105270. doi:10.1016/j.resconrec.2020.105270
Chen, D., Liu, W., and Qian, J. (2014). Spatiotemporal analysis of China's water resource ecological footprint and ecological carrying capacity. J. Chengdu Univ. Inf. Technol. 29 (02), 202–207. doi:10.16836/j.cnki.jcuit.2014.02.016
Dai, D., Sun, M., Xu, X., and Lei, K. (2019). Assessment of the water resource carrying capacity based on the ecological footprint: a case study in Zhangjiakou City, North China. Environ. Sci. Pollut. Res. 26, 11000–11011. doi:10.1007/s11356-019-04414-9
Deng, J., Ye, S., and Xu, Z. (2023). Spatial and temporal analysis of water resource ecological footprint and ecological carrying capacity in southeastern sichuan. China Rural Water Conservancy Hydropower (04), 125–133+144. (in Chinese). doi:10.12396/znsd.221087
Ding, J., Bai, Y., Yang, X., and Gao, Z. (2022). Spatiotemporal evolution of water resource utilization and economic development in the arid region of China: a “matching-constraint” perspective. Sustainability 14 (14), 8724. doi:10.3390/su14148724
Gong, Q., Guo, G., Li, S., and Liang, X. (2021). Decoupling of urban economic growth and water consumption in Chongqing and Chengdu from the “production-living-ecological” perspective. Sustain. Cities Soc. 75, 103395. doi:10.1016/j.scs.2021.103395
Han, L., Pan, Y., and Ma, J. (2021). Analysis of the spatio-temporal evolution characteristics of water resource ecological footprint in yunnan province. People's Pearl River 42 (04), 28–34. (in Chinese). doi:10.3969/j.issn.1001-9235.2021.04.004
Han, Y., Jia, S., Lu, C., and Ai-feng, L. (2020). Spatiotemporal matching between water resources and social economy: a case study in Zhangjiakou. J. Nat. Resour. 35 (6), 1392–1401. doi:10.31497/zrzyxb.20200612
Jiao, S., Zhang, X., and Wang, A. (2019). Study on decoupling relationship between water resources utilization and economic growth in Anyang city from the perspective of water footprint. Chin. J. Agric. Resour. Regional Plan. 40 (12), 10–15. (in Chinese). doi:10.7621/cjarrp.1005-9121.20191202
Jing, P., Sheng, J., Hu, T., Mahmoud, A., Guo, L., Liu, Y., et al. (2022). Spatiotemporal evolution of sustainable utilization of water resources in the Yangtze River Economic Belt based on an integrated water ecological footprint model. J. Clean. Prod. 358, 132035. doi:10.1016/j.jclepro.2022.132035
Kong, Y., He, W., Liang, Y. K., Shen, J., An, M., Degefu, D. M., et al. (2019). Decoupling analysis of water footprint and economic growth: a case study of Beijing-Tianjin-Hebei Region from 2004 to 2017. Int. J. Environ. Res. Public Health 16, 4873. doi:10.3390/ijerph16234873
Li, D., Zuo, Q., Jiang, L., and Wu, Q. (2023b). An integrated analysis framework for water resources sustainability considering fairness and decoupling based on the water resources ecological footprint model: a case study of Xinjiang, China. J. Clean. Prod. 383, 135466. doi:10.1016/j.jclepro.2022.135466
Li, R., Yi, B., and Zhou, Y. (2023a). Decoupling of water resource utilization and economic growth in the yellow River Basin and decomposition of influencing factors. Sci. Geogr. Sin. 43 (1), 110–118. (in Chinese). doi:10.13249/j.cnki.sgs.2023.01.012
Liu, Y., Xiao, X., and Cui, S. (2019). Dynamic transformation mechanism and spatial heterogeneity analysis of water and soil resource constraints in the Yangtze River economic belt. China Popul. Resour. Environ. 9 (3), 89–98. (in Chinese). doi:10.12062/cpre.20181018
Liu, Y., and Yan, Y. (2020). Temporal distribution characteristics and influencing factors of water ecological footprint in Chengdu city. South-to-North Water Divers. Water Sci. Technol. 18 (02), 93–98. (in Chinese). doi:10.13476/j.cnki.nsbdqk.2020.0031
Lu, N., Alifujiang, Y., and Feng, P. (2022a). Analysis of decoupling between water resource utilization and economic development in provincial capitals of northwest China. J. Arid Land Resour. Environ. 36 (12), 107–112. (in Chinese). doi:10.13448/j.cnki.jalre.2022.308
Lu, N., Zhu, J., Tang, Z., Zhang, J., and Chi, H. (2022c). Decreasing water dependency for economic growth in water-scarce regions by focusing on water footprint and physical water: a case study of Xi'an, China. Sustain. Cities Soc. 85, 104092. doi:10.1016/j.scs.2022.104092
Lu, Q., Liu, F., Li, Y., and Wang, D. (2022b). Study on the relationship between water resources utilization and economic growth in tarim river basin from the perspective of water footprint. Water 14 (10), 1655. doi:10.3390/w14101655
Montoya, M. A., Allegretti, G., Bertussi, L. A. S., and Talamini, E. (2023). Domestic and foreign decoupling of economic growth and water consumption and its driving factors in the Brazilian economy. Ecol. Econ. 206, 107737. doi:10.1016/j.ecolecon.2022.107737
OECD (2002). Indicators to measure decoupling of environmental pressure from economic growth. Paris: OECD, 13–14.
Pan, Z., and Xu, C. (2020). The measurement of green water resources efficiency in China and its decoupling from economic growth. J. Huazhong Agric. Univ. Soc. Sci. Ed. 4, 1–9+173. (in Chinese). doi:10.13300/j.cnki.hnwkxb.2020.04.001
Peng, L., Deng, W., and Tan, J. (2020). Restriction of economic development in the Hengduan Mountains Area by land and water resources. Acta Geogr. Sin. 75 (9), 1996–2008. (in Chinese). doi:10.11821/dlxb202009013
Shi, C., Yuan, H., Pang, Q., and Zhang, Y. (2020). Research on the decoupling of water resources utilization and agricultural economic development in Gansu province from the perspective of water footprint. Int. J. Environ. Res. Public Health 17 (16), 5758. doi:10.3390/ijerph17165758
Shu, C., Wang, Z., and Yan, K. (2023). Spatiotemporal evolution of decoupling between water resource pressure and economic development in hubei province. Water Resour. Prot. 39 (03), 134–141. doi:10.3880/j.issn.10046933.2023.03.016
Su, Y., Gao, W., Guan, D., and Su, W. (2018). Dynamic assessment and forecast of urban water ecological footprint based on exponential smoothing analysis. J. Clean. Prod. 195, 354–364. doi:10.1016/j.jclepro.2018.05.184
Sun, F., Yang, Y., and Shen, J. (2020). Research on decoupling relationship between water resource utilization and economic development in Jiangsu province based on water footprint-LMDI model. Jiangsu Soc. Sci. 6, 233–240. doi:10.13858/j.cnki.cn32-1312/c.2020.06.026
Swiader, M., Lin, D., Szewranski, S., Kazak, J. K., Iha, K., van Hoof, J., et al. (2020). The application of ecological footprint and biocapacity for environmental carrying capacity assessment: a new approach for European cities. Environ. Sci. Policy 105, 56–74. doi:10.1016/j.envsci.2019.12.010
Tan, F., and Qin, Q. (2019). Building fourth-level river chiefs to aid ecological development in southern Guizhou. Contemp. Guizhou 31, 62.
Tan, X., and Zheng, Q. (2009). Analysis and prediction of China's water resource ecological footprint. Acta Ecol. Sin. 29 (07), 3559–3568.
Tapio, P. (2005). Towards a theory of decoupling: degrees of decoupling in the EU and the case of road traffic in Finland between 1970 and 2001. Transp. Policy 12 (2), 137–151. doi:10.1016/j.tranpol.2005.01.001
UNSD (2023). Statistical yearbook of Qian'nan editorial board, 2009-2019 Qian'nan Statistical Yearbook (2009-2019). Qian'nan: Qian'nan Statistics Press.
Vaillancourt, J. G. (1999). Our ecological footprint: reducing human impact on the earth. Capital. Nat. Social. 10, 171–172. doi:10.1080/10455759909358893
Wackernagel, M., Onisto, L., Bello, P., Callejas Linares, A., Susana López Falfán, I., Mendez Garcia, J., et al. (1999). National natural capital accounting with the ecological footprint concept. Ecol. Econ. 29, 375–390. doi:10.1016/s0921-8009(98)90063-5
Wang, B., and Yan, L. (2022). Decoupling effects of water footprint and high-quality economic development in the Yangtze River economic belt. Water Resour. Hydropower Econ. 40 (01), 6–12+28+85. doi:10.3880/j.issn.10039511.2022.01.002
Wang, H., Huang, J., Zhou, H., Deng, C., and Fang, C. (2020). Analysis of sustainable utilization of water resources based on the improved water resources ecological footprint model: a case study of Hubei Province, China. J. Environ. Manag. 262, 110331. doi:10.1016/j.jenvman.2020.110331
Wang, Q., Jiang, R., and Li, R. (2018). Decoupling analysis of economic growth from water use in City: a case study of Beijing, Shanghai, and Guangzhou of China. Sustain. Cities Soc. 41, 86–94. doi:10.1016/j.scs.2018.05.010
Wang, Q., and Wang, X. (2020). Moving to economic growth without water demand growth —a decomposition analysis of decoupling from economic growth and water use in 31 provinces of China. Sci. Total Environ. 726, 138362. doi:10.1016/j.scitotenv.2020.138362
Wang, S., and Lin, Y. (2021). Spatial evolution and its drivers of regional agro-ecological efficiency in China’s from the perspective of water footprint and gray water footprint. Sci. Geogr. Sin. 41 (2), 290–301. doi:10.13249/j.cnki.sgs.2021.02.012
Water Resources Bureau of Qian'nan (2019). Qian'nan water resources Bulletin 2009-2019. Qian'nan: Qian'nan Water Authority.
Wen, D., Zhang, M., and Qin, Q. (2013). Research on ecological security assessment of water resources based on the ecological footprint model. Environ. Sci. Technol. 36 (12), 228–233. doi:10.3969/j.issn.1003-6504.2013.12.044
Wu, H., Li, X., and An, H. (2022). Decoupling of water resources utilization and coordinated economic development in China’s Hexi Corridor based on ecological water resource footprint. Environ. Sci. Pollut. Res. 29 (60), 90936–90947. doi:10.1007/s11356-022-21732-7
Wu, Q., Zuo, Q., Ma, J., Zhang, Z., and Jiang, L. (2021). Evolution analysis of water consumption and economic growth based on Decomposition-Decoupling Two-stage Method: a case study of Xinjiang Uygur Autonomous Region, China. Sustain. Cities Soc. 75, 103337. doi:10.1016/j.scs.2021.103337
Xing, X., Xiu, C., and Liu, Y. (2020). Study on the coupling coordination relationship between water resources utilization efficiency and economic development in the yellow River Basin. Soft Sci. 34 (8), 44–50. doi:10.13956/j.ss.1001-8409.2020.08.08
Yang, T., Zhao, W., and Zhou, Y. (2019a). Analysis of sustainable water resource utilization and decoupling from economic development: a case study of Changchun city. People's Yangtze River 50 (04), 135–141. doi:10.16232/j.cnki.1001-4179.2019.04.024
Yang, Y., Cao, S., and Liu, Y. (2019b). Analysis of water resource utilization and economic development in Shandong province based on water ecological footprint. J. Drainage Irrigation Mach. Eng. 37 (03), 256–262. doi:10.3969/j.issn.1674-8530.17.0083
Yang, Y., Wang, H., Wang, C., and Zhang, Y. (2022). Coupling variable fuzzy sets and Gini coefficient to evaluate the spatial equilibrium of water resources. Water Resour. 49 (2), 292–300. doi:10.1134/s0097807822020154
Yang, Z., Su, W., and Li, W. (2016). Analysis of decoupling between water resources and economic development in typical cities in karst areas. Guizhou Sci. 34 (05), 32–38.
Zhang, W., Liu, D., Chen, X., Zhou, X., Ding, Y., and Zhang, J. (2023). Driving factors for decoupling water resources ecological footprint and economic growth in water-deficient cities dominated by agriculture. Water Sci. Technol. 88 (5), 1246–1268. doi:10.2166/wst.2023.284
Zhang, X., and Zhai, Q. (2021). Decoupling analysis of water resource utilization and economic growth in Shaanxi province based on water resource ecological footprint. China Rural Water Conservancy Hydropower 10, 21–26.
Zhang, Y., Liu, W., and Zhao, M. (2020). The drag effect of water resources on China’s regional economic growth: analysis based on the temporal and spatial dimensions. Water 12 (1), 266. doi:10.3390/w12010266
Keywords: water resources ecological footprint, decoupling model, temporal and spatial pattern, Qian’nan, water resources management
Citation: Su Y, Liao S, Ren J and Zhao Z (2024) Research on the decoupling relationship between water resources utilization and economic development at the county scale in Qian’nan Prefecture, Guizhou Province. Front. Environ. Sci. 12:1347652. doi: 10.3389/fenvs.2024.1347652
Received: 08 December 2023; Accepted: 06 March 2024;
Published: 14 March 2024.
Edited by:
Spyros Foteinis, Heriot-Watt University, United KingdomReviewed by:
Weijun He, China Three Gorges University, ChinaChangqing Xu, Beijing Institute of Technology, China
Copyright © 2024 Su, Liao, Ren and Zhao. This is an open-access article distributed under the terms of the Creative Commons Attribution License (CC BY). The use, distribution or reproduction in other forums is permitted, provided the original author(s) and the copyright owner(s) are credited and that the original publication in this journal is cited, in accordance with accepted academic practice. No use, distribution or reproduction is permitted which does not comply with these terms.
*Correspondence: Yin Su, sy736291845@163.com; Jintong Ren, jintongabc@163.com