Spatial and temporal characteristics of drought in the Mu Us Sandy Land based on the Standardized Precipitation Index
 Yonghua Zhu1,2,3
  Jiamin Li
- 1School of Water and Environment, Chang’an University, Xi’an, China
- 2College of Civil Engineering and Architecture, Yan’an University, Yan’an, China
- 3Key Laboratory of Subsurface Hydrology and Ecological Effects in Arid Region, Ministry of Education, Chang’an University, Xi’an, China
- 4Shaanxi Provincial Hydrology and Water Resources Survey Center, Xi’an, Shaanxi, China
- 5Tongliao Hydrotechnics Service Center, Tongliao, Inner Mongolia, China
The environment of the Mu Us Sandy Land, northern Shaanxi, is fragile, so the temporal and spatial evolution of drought can provide a reference for ecological construction and agricultural production. Based on the daily precipitation data of five meteorological stations from 1967 to 2020, the spatial and temporal evolution characteristics of drought in the Mu Us Sandy Land of northern Shaanxi were analyzed using the methods Standardized Precipitation Index (SPI) and run-length theory. The results show that 1) the smaller the time scale, the higher the sensitivity of the SPI to primary precipitation. 2) The annual, summer, autumn, and winter SPI showed an upward and a wetting trend, and the fastest wetting speed is observed in summer, while spring showed an increasing trend of drought. 3) In the past 54 years, the duration, degree, and intensity of drought events at SPI-3 and SPI-12 scales in the Mu Us Sandy Land of northern Shaanxi showed an insignificant decreasing trend, but the decreasing rate at the SPI-12 scale was faster than that at the SPI-3 scale. The serious periods of drought are November 2018 to May 2019 and April 1999 to July 2021. 4) The duration of drought events at two timescales in each region showed a decreasing trend. The longest durations of drought were in Yulin and Jingbian; Shenmu and Dingbian are the regions with the fastest reduction rate of drought degree at the two scales. Hengshan shows rapid reduction of drought intensity at the two scales and also the region with large average drought intensity. These results are helpful in understanding and describing drought events for drought risk management under the condition of global warming.
1 Introduction
Drought is a natural disaster caused by insufficient precipitation for a long period of time, with the characteristics of wide influence range, high occurrence frequency, and long duration, making it one of the main climate disasters (Zhang et al., 2021; Cao et al., 2022). In typical arid areas in Northwest China, drought leads to dry land, which directly affects the growth and development of xerophytes (Kang et al., 2020), and it easily causes continuous desertification of land and becomes the source of sandstorms (Yang et al., 2021). Therefore, research on drought in Northwest China has attracted much attention (Luo et al., 2021a; Li et al., 2022; Wang et al., 2022).
Droughts represent an extended imbalance between water supply and demand with devastating and extended impacts often requiring long periods to reverse the recorded damages (Soulsby et al., 2021; Zhu et al., 2022). Therefore, continuous drought monitoring must be carried out to provide decisive policy support for medium- and long-term planning of mitigation measures. Initially, hydrological and meteorological elements (e.g., soil moisture, stream flow, temperature, and precipitation) were adopted as the main input for the generation of indices for quantitative modeling of drought severity in the early last century (Munger, 1916; Kincer, 1992). Subsequently, more than hundreds of indices used for drought studies were identified under space and time at different scales (Niemeyer, 2008). At present, there are two kinds of indicators in the analysis and research of drought. One indicator reflects the physical process of drought through drought mechanisms, represented by the Palmer Drought Severity Index (PDSI) considering multiple factors (Zhu et al., 2021). The other is to study the statistical distribution of precipitation using meteorological methods to reflect the characteristics of drought, represented by the Standardized Precipitation Evapotranspiration Index (Camarero et al., 2021) (SPEI) and the Standardized Precipitation Index (Xu et al., 2021) (SPI). The potential evapotranspiration is often used in the calculation of the SPEI, while it is often greater than the actual evapotranspiration, resulting in deviations in the calculation results (Ortiz-Gómez. et al., 2022), whereas the SPI index has the advantages of simple calculation, strong adaptability, and sensitive response to drought changes (Hayes et al., 1999), and hence is the drought index recommended by the World Meteorological Organization. Many studies (Yang et al., 2017; Tja et al., 2020) showed that SPI, as a drought reconstruction index, is suitable for Northwest China, and its multi-timescale application characteristics can serve in water resource assessment and drought monitoring at different timescales.
As a key area for the construction of an ecological security barrier in China, the Mu Us Sandy Land belongs to semi-arid climate, located in a climate sensitive area characterized by fragile ecological environment and frequent drought disasters. It is an agricultural–pastoral ecotone. At present, many research studies on the Mu Us Sandy Land mostly focus on the multi-timescale climate change characteristics, such as the multi-timescale change characteristics and change trend of main climate factors (Ding et al., 2021; Wei et al., 2021), and the change characteristics of precipitation and extreme temperature (Zhou et al., 2020).
Our overarching purpose is to assess regional drought across the Mu Us Sandy Land, northwest China, using the SPI. The specific objectives of this study are to (1) analyze the temporal distinctions of the SPI with 1-, 3-, and 12-month timescales of the Mu Us Sandy Land and (2) reveal the characteristics of drought intensity, drought duration, and drought frequency of the SPI at different timescales. The findings from this study are helpful in understanding and describing drought events for drought risk management under the condition of global warming.
2 Materials and methods
2.1 Study area
As a transitional area from the Ordos Plateau to the Loess Plateau in northern Shaanxi, the Mu Us Sandy Land is a staggered area of agriculture, forestry, and animal husbandry, belonging to a typical ecologically fragile area located north of the first line of the Great Wall in Yulin City, Shaanxi, with an area of 16,300 km2, including Dingbian (DB), Jingbian (JB), Hengshan (HS), Yulin (YL), and Shenmu (SM) and other counties of Yulin City (Figure 1). The land regulation and development of this region has made an important contribution to the dynamic balance of the total cultivated land in Shaanxi Province. The sandy land is inclined from northwest to southeast, with an altitude of 1,000–1,500 m, mainly composed of sand dunes and meadows. This study area belongs to the semi-arid climate zone of the middle temperate zone, with a gradual decrease in annual average precipitation from 400 to 450 mm in the southeast to approximately 250 mm in the northwest region, the annual average temperature is 6°C–9°C, and the annual average evaporation is 2,100–2,600 mm. Sandy land has less precipitation but its occurrence is more, resulting in abundant surface water and groundwater resources. There are several main rivers, such as Kuye River, Tuwei River, and Wuding River.
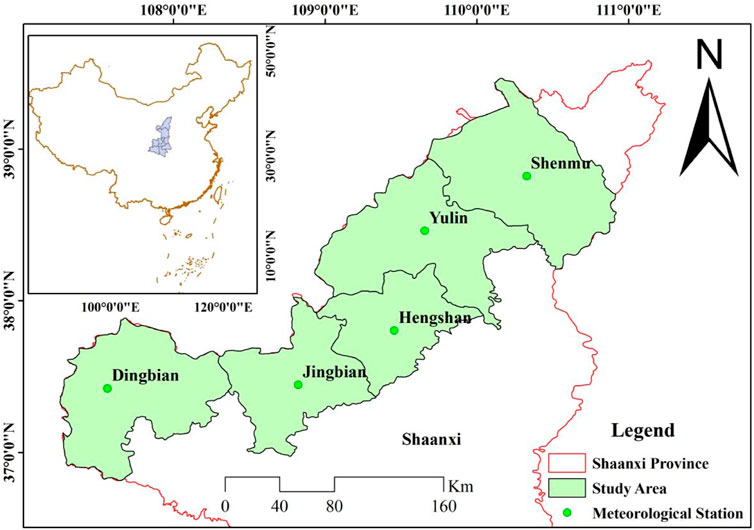
Figure 1. Administrative scope and distribution of study areas in the Mu Us Sandy Land.
2.2 Data
The daily precipitation data of DB, JB, HS, YL, and SM meteorological stations, from 1967 to 2020, in the Mu Us Sandy Land in Northern Shaanxi was used in this paper, which comes from the China surface climate data daily dataset (V3.0) in the China meteorological data sharing service network (the missing rate is less than or equal to 10%), with good consistency, reliability, and representativeness (http://data.CMA.CN).
2.3 Method
Taking the Mu Us Sandy Land in northern Shaanxi as the study area, the drought characteristic indexes of each station are obtained using the SPI and run-length theory in 1 month (SPI-1), 3 months (SPI-3), and 12 months (SPI-12). The regional annual and seasonal SPI values were obtained by arithmetic average (spring: March, April and May; summer: June, July and August; autumn: September, October and November; and winter: December, January and February). Based on linear regression, Daniel’s test, ArcGIS, and other methods, the time-varying trend and spatial distribution characteristics of the standardized precipitation index, drought duration, drought degree, and drought intensity of each scale were identified. The SPI-3 and SPI-12 scale indexes that can significantly identify hydrological drought are selected to study the variation characteristics of duration, drought degree, and intensity of hydrological drought in the Mu Us Sandy Land in northern Shaanxi in the past 54 years.
2.3.1 Standardized Precipitation Index
Because the precipitation distribution is a partial distribution, not a normal distribution, and the precipitation changes greatly in different space–timescales, it is difficult to compare the precipitation on different space–time scales. Therefore, in the precipitation analysis, the gamma distribution probability is used to describe the change of precipitation, which is normalized first, and finally, the SPI value is obtained from the standardized precipitation cumulative frequency distribution. The specific calculation formula is found in relevant literature, and the classification of meteorological drought grade in our manuscript (Table 1) is formulated by the National Climate Center.

Table 1. Standardized Precipitation Index drought grading.
2.3.2 Run-length theory
In this paper, the three characteristic indexes of drought duration, drought degree, and drought intensity are used to represent the drought characteristics of a drought event, which can be obtained by run-length theory (Xiao et al., 2012). According to the run-length theory, the series of the same symbols that meet certain conditions is called a “run,” and the number of occurrences of the same symbol in a run is called the length of the run. Long-lasting SPI <0 events will lead to drought-related problems, so 0 is taken as the cut-off level of the run. When SPI ≤ 0, it is defined as a drought event, and drought duration D is the run length. During drought event, the absolute value of the cumulative SPI value is drought degree, and the ratio of drought degree to drought duration is drought intensity (I), which can be obtained from drought classification, where 0 ≤ I < 1 is mild drought, 1 ≤ I < 1.5 is moderate drought, 1.5 ≤ I < 2 is heavy drought, and I ≥ 2 is extreme drought.
2.3.3 Linear regression
The change trend and its significance level are judged by the slope of the regression equation between the Standardized Precipitation Index, drought duration, drought degree, drought intensity, and time series. When the slope is > 0, the research object has an upward trend, and when the slope is < 0, it has a downward trend. In addition, Daniel’s test is used to judge whether the change trend of the research object is significant, and the significance level is judged according to the statistics. When p ≤ 0.05, the research object has a significant upward or downward trend in the time series, and when p > 0.05, the research object has no significant change trend.
3 Results
3.1 SPI sensitivity analysis
It can be seen from the analysis in Figure 2 that there is a fluctuation in the SPI value, but there are significant differences in the sensitivity of different timescales. The smaller the timescale is, the more obvious the fluctuation is and the higher the sensitivity is. It even shows the phenomenon of a dry–wet sharp turn. Furthermore, The larger the time scale is, the more gentle the fluctuation tends to be and the lower the sensitivity is. SPI-1 is closely related to monthly precipitation, and its value fluctuates greatly, reflecting the influence of monthly precipitation on drought. SPI-3 has hysteresis and has no significant response to monthly precipitation. Only precipitation in a long period of time will lead to its fluctuation, reflecting the drought caused by seasonal precipitation shortage. The SPI-12 value is relatively concentrated with a relatively slow change trend, which can reflect the change trend of annual timescale drought in the study area, especially around 1971–1973, 1975–1976, 1980–1981, 1999–2001, and 2005–2006. Following the integrated analysis, the SPI values of different timescales show an increasing trend. From 1967 to 2020, the frequency of drought, extreme drought, heavy drought, moderate drought, and mild drought in SPI-1 was 37.8 times/10a, 2.7 times/10a, 4.9 times/10a, 11.1 times/10a, and 11.9 times/10a, respectively; that of SPI-3 was 37.4 times/10a, 3.1 times/10a, 3.1 times/10a, 12.9 times/10a, and 18.2 times/10a; SPI-12 was 34.7 times/10a, 2.2 times/10a, 8.5 times/10a, 11.6 times/10a, and 12.4 times/10a, respectively. These results demonstrated the extension of the timescale. The frequency of drought, extreme drought, and severe drought is not significantly different, while the frequency of moderate drought and mild drought is significantly different. The occurrence time of different drought grades identified by SPI-1, SPI-3, and SPI-12 is obviously different, and it shows the contrast between drought and flood in some specific years. For example, in 2017–2020, SPI-1 and SPI-3 identified moderate and above drought grades, while SPI-12 has almost no drought in this time period, which indicates that there is an obvious scale effect and time heterogeneity in regional annual precipitation distribution and drought grades.
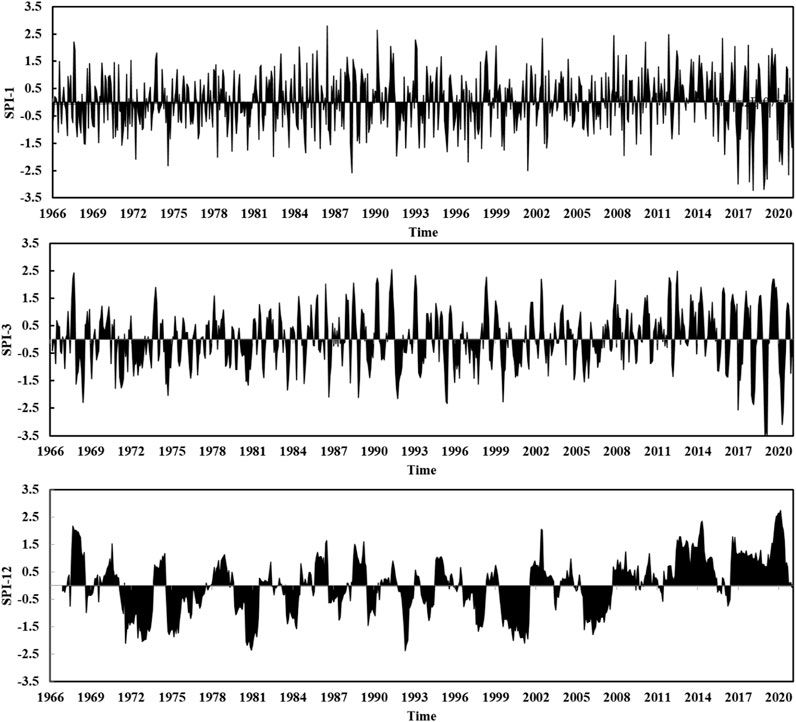
Figure 2. Variation of the SPI at different time scales in the Mu Us Sandy Land in northern Shaanxi over 54 years.
3.2 Drought variation characteristics
Based on the SPI-12 value, the annual drought characteristics in the study area were analyzed (Figure 3A). The annual SPI showed an extremely significant upward trend (Daniel’s test p < 0.01), with the variation rate being 0.206/10a, the drought year being 16a, and the drought occurrence frequency being 29%. The SPI value was −1.64 in 2000, indicating severe drought, and there was moderate to mild drought in other years. From the interdecadal variation characteristics of drought shown in Figure 3B, the SPIs of 1970s, 1980s, 1990s, and 2000s were negative, and there were five times, four times, three times, and four times of drought years, respectively, which was the arid period. The 1970s was the most arid period, 2010s was the most humid period, while there was no drought event during the period.
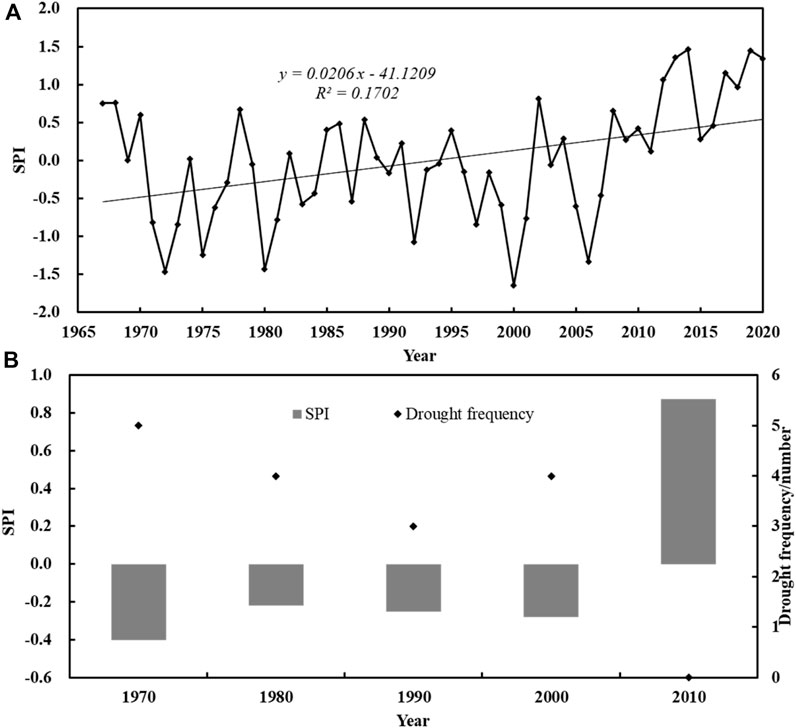
Figure 3. Annual SPI variation and interdecadal drought frequency in the Mu Us Sandy Land in northern Shaanxi.
As shown in Figure 4, spring SPI in the study area showed a downward trend from 1967 to 2020, with the rate of 0.076/10a. Summer, autumn, and winter SPI showed an upward trend, with the rate of 0.171/10a, 0.145/10a, and 0.006/10a, respectively. Daniel’s test showed that the SPI in summer showed a significant upward trend (p < 0.05) and that the values in other seasons did not pass the significance test, indicating that there was a wetting trend during summer, autumn, and winter, and the wetting rate was the fastest in summer, while there was an increasing trend of drought in spring. The seasonal droughts in the Mu Us Sandy Land, northern Shaanxi, from 1967 to 2020 are shown in Table 2. Drought occurred in spring for 14 years, and the frequency of drought was 26%. The SPI values in spring of 2020 and 1971 were −2.39 and −1.58, respectively, which indicate extreme drought and severe drought. During the summer, the drought season lasted for 17 years, with the frequency of drought occurrence of 31%, which was moderate to mild drought; the autumn drought spanned 19 years, with a drought frequency of 36%, including the autumn of 1991, with an SPI value −1.84, indicating severe drought; winter drought lasted for 9 years, with a drought frequency of 17%, including the winter of 2018, with an SPI value −2.86, indicating extreme drought. In addition, seasonal drought occurred frequently during the study period, with varying degrees of seasonal drought occurring in 36 of 54 years. The above analysis showed that seasonal drought occurs frequently in the study area, and the highest frequency of drought occurs in summer and autumn, characterized by mainly mild drought; this is followed by spring, when moderate drought occurs mostly; and the lowest frequency of drought occurs in winter, with mostly moderate and mild drought.
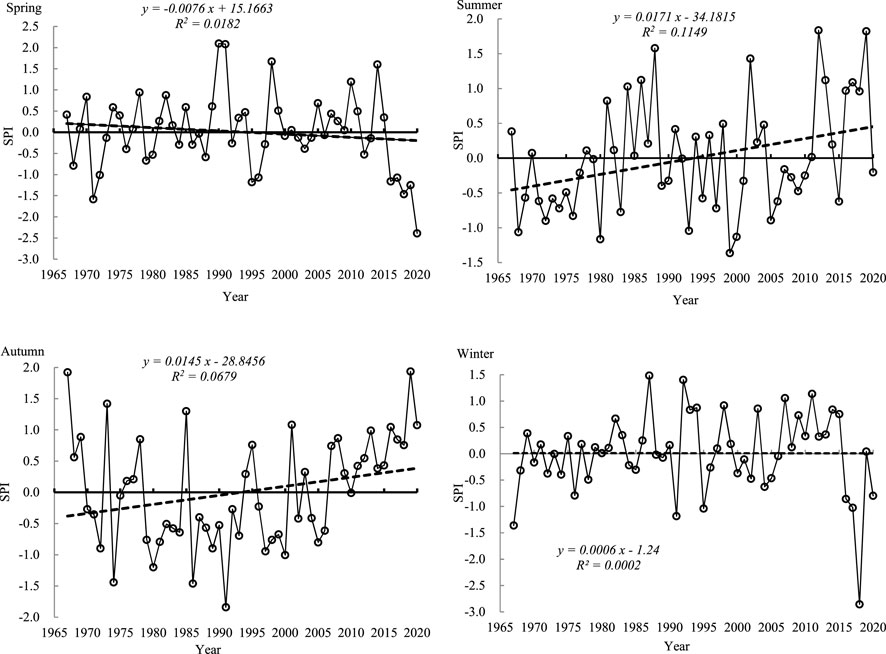
Figure 4. SPI changes in four seasons in the Mu Us Sandy Land in northern Shaanxi.
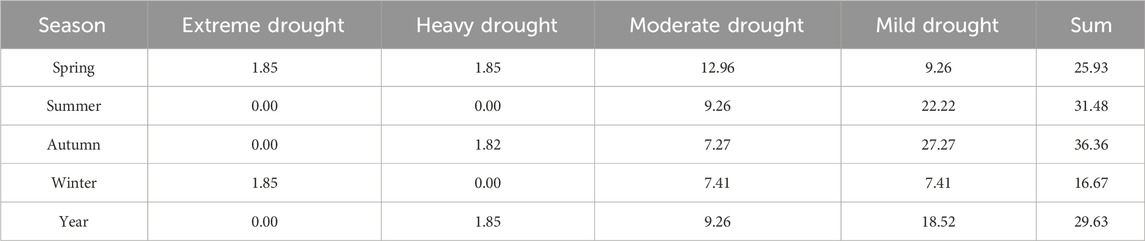
Table 2. Statistics on the frequency of seasonal drought in the Mu Us Sandy Land in northern Shaanxi from 1967 to 2020 (%).
3.3 Temporal variation characteristics of drought events
3.3.1 Variation characteristics of drought event duration
In SPI-3 and 12-month scale, the beginning time of a drought event was determined with the name of the event. SPI-3 and SPI-12 were selected for analyzing the variation characteristics of drought event duration (Figures 5A, B). From the time series, the duration of drought events at the SPI-3 scale showed an insignificant decreasing trend (Daniel’s test p > 0.05), with a change tendency rate of −0.074/10a. The result of the 5-year moving average showed that the duration of drought events at the SPI-3 scale was relatively stable before the 1970s and 2007–2015 and showed an upward trend since 2015. The other periods showed a sharp fluctuation of increase and decrease. During 1965–2020, a total of 96 drought events occurred in the Mu Us Sandy Land, northern Shaanxi, with an average of 3.40 months. The longest drought events occurred in February 1980 and April 2000, lasting 12 months, followed by drought events in February 1972 and January 1997, lasting 11 months. From the perspective of interdecadal changes, the dispersion degree of drought event duration is also gradually flat. The duration of drought events in 1970s, 1980s, 1990s, and 2000s is 3.76 months, 3.20 months, 3.82 months, and 3.25 months, respectively. The shortest duration of drought in 2010s is 3.00 months, and the minimum number of drought events is 17.
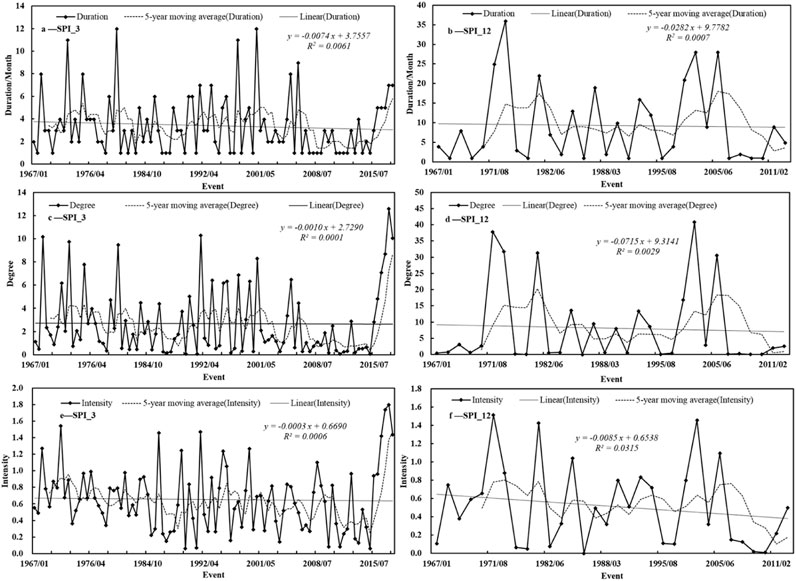
Figure 5. Variation of the duration, degree, and intensity of the SPI-3/12 drought event.
The duration of drought events in the SPI-12 scale had a decreasing trend similar to that in SPI-3 (Daniel’s test p > 0.05), but the decrease was faster, and the change tendency rate was −0.282/10a. The 5-year moving average showed that the duration of drought events at the SPI-12 scale increased first and then decreased from 1970s to the early 1980s and was relatively stable from 1980s to 2000s and then showed a downward trend. Compared with SPI-3, SPI-12 drought events occurred 32 times, but the duration increased significantly, with an average of 9.34 months between 1 and 36 months. The drought event in August 1974 lasted the longest, for 36 months, followed by the drought events in April 1999 and June 2005, which lasted for 28 months.
3.3.2 Variation characteristics of the drought degree during drought events
According to Figures 5C, D, the drought degree of drought events at the SPI-3 and SPI-12 scales in the study area did not show an insignificant downward trend (Daniel’s test p > 0.05). The drought degree of the SPI-3 scale drought events was 0.06–12.60, with the average value of 2.68. The most serious drought event occurred in October 2018, with a drought degree of 12.60, followed by drought events in August 1991 and December 1967, with drought degrees of 10.29 and 10.17, respectively. The drought degree of the SPI-12 scale drought events fluctuated between 0 and 40.79, with an average drought degree of 8.13. The most serious drought event occurred in April 1999, with a drought degree of 40.79, followed by drought events in August 1971 and August 1974, with drought degrees of 37.84 and 31.71, respectively. The result of the 5-year moving average showed that the drought degree and drought duration of drought events at different scales had a similar change trend as a whole, basically showing the characteristics that the longer the drought duration was, the more serious the drought degree was. According to SPI-3 and SPI-12, the drought events lasting from November 2018 to May 2019 and April 1999 to July 2021 were the most severe periods of drought in the Maowusu sandy land of northern Shaanxi in the past 54 years at different scales.
3.3.3 Variation characteristics of drought intensity in drought events
According to Figures 5E, F, the drought intensity of drought events at SPI-3 and SPI-12 scales showed an insignificant decreasing trend (Daniel’s test p > 0.05), with the change tendency rates of −0.003/10a and −0.085/10a, respectively. At the SPI-3 scale, there were three severe drought events (2018/11, 2018/01, and 1971/03), 10 moderate drought events, and 83 mild drought events. The strongest drought event occurred in April 2018, with a value of 1.8, which was a severe drought event. At the SPI-12 scale, there were one severe drought event, four moderate drought events, and 27 mild drought events. The strongest drought event occurred in August 1971, with a value of 1.5, which was a severe drought event. From the 5-year moving average, drought intensity has a similar trend with drought duration and drought degree, but it is different from the two in specific time. Both of the scales of drought events were dominated by mild drought, but the intensity variation trends were slightly different. The intensity of drought events at the SPI-3 scale decreases slower than that at the SPI-12 scale, and the average and fluctuation range of drought intensity are larger, indicating that the intensity of agricultural drought in the study area is larger than the hydrological drought intensity.
3.4 Spatial variation characteristics of drought events
3.4.1 Spatial characteristics of drought event duration
There are differences in the variation characteristics of drought event duration in different regions of the Mu Us Sandy Land, northern Shaanxi, at the same timescale (Figures 6A, D). At the SPI-3 scale, the duration of drought events in the whole region shows a decreasing trend, with the change tendency rates of DB, JB, HS, YL, and SM from west to east being −0.213/10a, −0.133/10a, −0.043/10a, −0.076/10a, and −0.270/10a, respectively. According to Daniel’s test, the duration of drought events in SM and DB shows a significant decreasing trend (p < 0.05). SM decreases the fastest, followed by DB, JB, and HS. The duration of drought events in the YL area showed an insignificant decreasing trend (p > 0.05), and the decrease was slow; in the past 54 years, the largest number of 109 drought events occurred in the DB area, but the average duration was only 2.95 months. The lowest number of drought events occurred in JB, which is 91 times, but the average duration was the longest, 3.81 months.
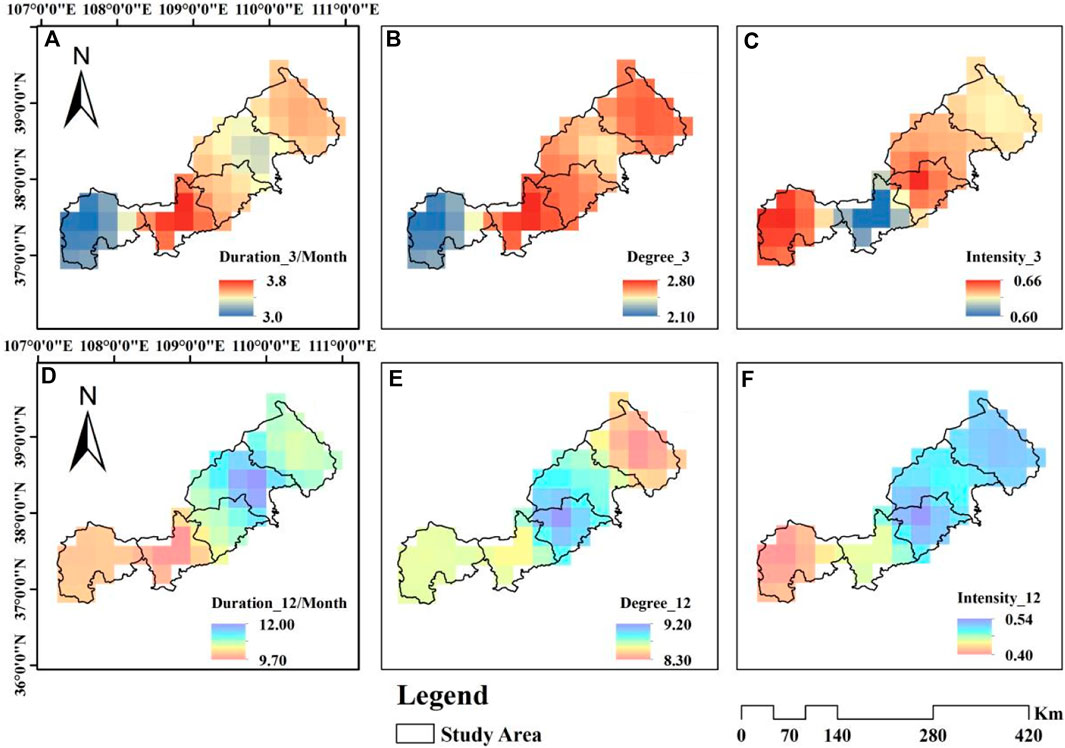
Figure 6. Drought characteristics of SPI-3 and SPI-12 drought events of the Mu Us Sandy Land.
The duration of drought events in the whole region showed an insignificant decreasing trend (p > 0.05) at the SPI-12 scale. DB and YL had the fastest decreasing speed, with trend rates of −3.350/10a and −3.542/10a, respectively. In terms of the average duration of drought events in each region, the duration of drought events in JB was the shortest, 9.58 months, and that in YL was the longest, 12.21 months. These results show that the duration of drought events at two timescales in the Mu Us Sandy Land, northern Shaanxi, shows a decreasing trend. The duration of hydrological drought in the Shenmu region decreases the fastest, while the duration of hydrological drought in DB and YL undergoes the fastest decrease. JB is the region with the longest duration of hydrological drought, and YL is the region with a longer duration of hydrological drought.
3.4.2 Spatial characteristics of the drought degree of drought events
As shown in Figures 6B, E, the drought degree of drought events in all regions has shown a decreasing trend at the SPI-3 scale, while that in SM and DB has shown a significant decreasing trend (p < 0.05), with the change tendency rates being −0.297/10a and −0.148/10a, respectively. The maximum average drought degree is 2.78 in JB, and the minimum is 2.12 in DB. The drought degree in all regions, except Jingbian, showed an insignificant decreasing trend (p > 0.05) at the SPI-12 scale. the drought degree in Dingbian had the fastest decrease, followed by Yulin, with the change tendency rates of −4.175/10a and −2.668/10a, respectively. The maximum average drought degree was 9.16 in HS, and the minimum was 8.31 in SM. In summary, drought degree in SM and DB decreases fastest at SPI-3 and SPI-12 scales, respectively, indicating that the water deficit in this region has been alleviated, while the spatial distribution of the average drought degree of drought events shows different spatial distribution patterns. At the same time, the agricultural water deficit and hydrological water deficit are large in JB and HS, respectively.
3.4.3 Spatial characteristics of the drought intensity of drought events
As shown in Figures 6C, F, the drought intensity of SPI-3 and SPI-12 drought events has similar distribution characteristics with the drought degree. The drought intensity of each region shows a decreasing trend at the SPI-3 scale, of which JB, HS, and YL show a significant decreasing trend (p < 0.05). From the average drought intensity of drought events in the past 54 years at the two scales, the maximum values at the SPI-3 and SPI-12 scales are in HS, and the minimum values at SPI-3 and SPI-12 scales are in JB and DB, respectively. In summary, in HS, the drought intensity of drought events at two scales decreases rapidly, with large average drought intensity, indicating that serious hydrological drought events and hydrological drought events occur frequently.
4 Discussion
As a parameter, the SPI describes the status of water in an ecosystem more immediately than meteorological indexes (Luo et al., 2021b; Duan et al., 2021) (e.g., precipitation and evaporation). Estimating the climatic warming and humidification and drought at regional or global scales using an algorithm based on the SPI has become critical to cope with possible climate change. In this study, based on the sensitivity analysis shown in Figure 2, SPI reveals that the drought change trend affected by the accumulated precipitation in the early stage of different timescales (short term, medium term, and long term), with obvious function for short-term drought, seasonal drought, and annual scale drought, and can reflect the hydrological drought. The purpose is to determine whether the SPI can be used as a climate change evaluation index for sandy land, northern Shaanxi, Yellow River Basin. The precipitation data in our manuscript for 1965–2020 are considered most desirable as long records provide more reliable statistics for the SPI, given that it is a statistical approach. Many studies found that the SPI, which has more advantages in reflecting the drought trend and climate change because it does not consider potential evaporation, underlying surface, crops, and other relevant factors, has gained importance in recent years as a potential drought indicator permitting comparisons across different precipitation zones (Kalisa et al., 2020; Mga et al., 2021).
Based on the SPI, this study provides a strong indication that changes in climate altered the hydrothermal condition in the Mu Us Sandy Land, northern Shaanxi, Yellow River Basin. The findings show that the inter-annual, summer, autumn, and winter droughts in the study area showed a wetting trend, while the spring drought showed an increasing trend. Moreover, the directions of changes in the hydrothermal condition by climate change (i.e., precipitation) in this study are in line with hydrological studies in tropical regions, as proposed by Tian et al. (2015) and Xu et al. (2017). It is well known that the climatic warm–wet situation may cause not only an increase in the precipitation which significantly increases recharge for both soil water and groundwater but also promotes vegetation growth in the semi-arid area. The reliable water supply from soil and underground affects crop production in the growing season (Wu et al., 2021). However, in the present study, we find that regional drought characteristics are unevenly distributed, especially in spring, which shows an increasing trend. The spatial–temporal heterogeneity of precipitation, which is controlled by multiple scales and complex physical mechanisms, may probably be the main reason for the significant impacts on increasing of spring drought. In Northwestern China, air temperature in spring increases with the surface temperature affected by solar radiation. It is difficult to form precipitation conditions because of dry surface and air conditions. Moreover, precipitation in China mainly comes from the water vapor transported by the southeast monsoon of the Pacific Ocean and the southwest monsoon of the Indian Ocean. Under the action of the Hawaiian low-pressure system and the Asian high-pressure system, the southeast wind is mainly blowing, while the south is closer to the landing point of the summer wind. As the summer wind moves northward, the moisture content becomes less and less, and the rainfall in the north also decreases.
Several studies (Zhang et al., 2019; Jiang et al., 2020; Mu et al., 2020; Huang et al., 2021) have investigated the correlation between climate and drought in semiarid regions, and the results are similar to ours.
There are some potential socio-economic impacts of an appropriate drought (Asish et al., 2022; Espinosa-Tasón et al., 2022), such as agricultural losses and economic losses. As an agricultural–pastoral ecotone, the Mu Us Sandy Land has a semi-arid climate, located in a climate sensitive area characterized by a fragile ecological environment and frequent drought disasters. Spring precipitation and soil moisture play an important limiting role in crop growth in the region. The results of this article show an increase in spring drought, which could lead to reduced water availability for irrigation, resulting in crop failures and livestock losses. This can have a direct impact on farmers’ livelihoods and food security and also affect food prices and availability in the markets. It is important to note that the impacts of drought can vary depending on factors such as the severity and duration of the drought, the socioeconomic conditions of the affected regions, and the availability of coping mechanisms and adaptive strategies. Effective drought management and preparedness measures, such as water conservation practices, early warning systems, and drought-resistant crop varieties, can help mitigate these impacts.
5 Conclusion
(1) The smaller the timescale of the SPI, the higher its sensitivity to a single precipitation, and vice versa. SPI-1, SPI-3, and SPI-12 have identification functions for short-term drought, seasonal drought, and annual scale drought, respectively, and can reflect the hydrological drought situation in the Mu Us Sandy Land in northern Shaanxi.
(2) There are differences in the frequency and level of drought identified by the SPI at different scales in different spaces and times.
(3) In the past 54 years, the SPI values of the Mu Us Sandy Land in northern Shaanxi have shown a decreasing trend only in spring, while drought has an increasing trend. The duration, degree, and intensity of drought events at the SPI-3 and SPI-12 scales have not significantly decreased, but the duration, degree, and intensity of drought events at the SPI-12 scale have decreased faster than those at the SPI-3 scale.
Data availability statement
The original contributions presented in the study are included in the article/Supplementary Material; further inquiries can be directed to the corresponding authors.
Author contributions
YZ: writing–original draft. JL: writing–review and editing. XX: writing–review and editing. JZ: writing–review and editing. PM: writing–review and editing. LL: writing–review and editing. PL: writing–review and editing.
Funding
The author(s) declare that financial support was received for the research, authorship, and/or publication of this article. This research was funded by Shaanxi Provincial Department of Science and Technology Project (2023JCYB449); Yan’an Science and Technology Bureau Announcement System Project (2023LJBZ002); Yan’an University College Student Innovation and Entrepreneurship Training Program Project (D2022106 and D2023142).
Acknowledgments
The authors would like to thank the editors and the reviewers for their crucial comments, which improved the quality of this paper.
Conflict of interest
The authors declare that the research was conducted in the absence of any commercial or financial relationships that could be construed as a potential conflict of interest.
Publisher’s note
All claims expressed in this article are solely those of the authors and do not necessarily represent those of their affiliated organizations, or those of the publisher, the editors, and the reviewers. Any product that may be evaluated in this article, or claim that may be made by its manufacturer, is not guaranteed or endorsed by the publisher.
References
Asish, S., Subodh, C. P., Chowdhuri, I., Roy, P., Chakrabortty, R., and Shit, M. (2022). Vulnerability assessment of drought in India: insights from meteorological, hydrological, agricultural and socio-economic perspectives. Gondwana Res. 123, 68–88. doi:10.1016/J.GR.2022.11.006
Camarero, J. J., Gazol, A., Linares, J. C., Fajardo, A., Colangelo, M., Valeriano, C., et al. (2021). Differences in temperature sensitivity and drought recovery between natural stands and plantations of conifers are species-specific. Sci. Total Environ. 796, 148930. doi:10.1016/j.scitotenv.2021.148930
Cao, Z., Wang, S., Luo, P., Xie, D., and Zhu, W. (2022). Watershed ecohydrological processes in a changing environment: opportunities and challenges. Water 14, 1502. doi:10.3390/w14091502
Ding, Z., Lu, R., Wang, L., Yu, L., Liu, X., Liu, Y., et al. (2021). Early-mid holocene climatic changes inferred from colors of eolian deposits in the mu us desert. Geoderma 401, 115172. doi:10.1016/j.geoderma.2021.115172
Duan, W., Maskey, S., Chaffe, P., Luo, P., He, B., Wu, Y., et al. (2021). Recent advancement in remote sensing technology for hydrology analysis and water resources management. Remote Sens. 13 (6), 1097. doi:10.3390/rs13061097
Espinosa-Tasón, J., Berbel, J., Gutiérrez-Martín, C., and Musolino, D. A. (2022). Socioeconomic impact of 2005–2008 drought in Andalusian agriculture. Sci. Total Environ. 826, 154148. doi:10.1016/j.scitotenv.2022.154148
Hayes, M. J., Svoboda, M. D., Wilhite, D. A., and Vanyarkho, O. V. (1999). Monitoring the 1996 drought using the standardized precipitation index. Bull. Am. Meteorological Soc. 80 (3), 429–438. doi:10.1175/1520-0477(1999)080<0429:mtduts>2.0.co;2
Huang, W. J., Duan, W. L., and Chen, Y. (2021). Rapidly declining surface and terrestrial water resources in Central Asia driven by socio-economic and climatic changes. Sci. Total Environ. 784, 147193. doi:10.1016/j.scitotenv.2021.147193
Jiang, D. B., Hu, Z., Tian, X., and Lang, X. (2020). Differences between cmip6 and cmip5 models in simulating climate over China and the east Asian monsoon. Adv. Atmos. Sci. 37 (10), 1102–1118. doi:10.1007/s00376-020-2034-y
Kalisa, W., Zhang, J., Igbawua, T., Ujoh, F., Ebohon, O. J., Namugize, J. N., et al. (2020). Spatio-temporal analysis of drought and return periods over the east African region using standardized precipitation index from 1920 to 2016. Agric. Water Manag. 237, 106195. doi:10.1016/j.agwat.2020.106195
Kang, J. J., Zhao, W. Z., Zhou, H., and Wang, Z. (2020). The features of main osmolytes, silicon and their coupling effects in improving drought resistance of the typical xerophytes in the desert areas of northwest China. Land Degrad. Dev. 31 (17), 2720–2733. doi:10.1002/ldr.3631
Kincer, J. B. (1992). The seasonal distribution of precipitation and its frequency and intensity in the United States. Res. Prog. Rep. - West. Soc. Weed Sci. (USA) 3 (3), 109–127.
Li, Q., Chen, L., and Xu, Y. (2022). Drought risk and water resources assessment in the beijing-tianjin-hebei region, China. Sci. Total Environ. 832, 154915. doi:10.1016/j.scitotenv.2022.154915
Luo, P. P., Mu, Y., Wang, S. T., Zhu, W., Mishra, B. K., Huo, A. D., et al. (2021b). Exploring sustainable solutions for the water environment in Chinese and Southeast Asian cities. AMBIO 3, 13280. doi:10.1007/s13280-021-01654-3
Luo, P. P., Mu, Y., Wang, S. T., Zhu, W., Mishra, B. K., Huo, A., et al. (2021a). Exploring sustainable solutions for the water environment in Chinese and Southeast Asian cities. AMBIO 51, 1199–1218. doi:10.1007/s13280-021-01654-3
Mga, B., Wya, B., Twc, D., Zheng, N., and Wu, L. (2021). Assessing the use of standardized groundwater index for quantifying groundwater drought over the conterminous us. J. Hydrology 598, 126227. doi:10.1016/j.jhydrol.2021.126227
Mu, D., Luo, P. P., Lyu, J., Zhou, M., Huo, A., Duan, W., et al. (2020). Impact of temporal rainfall patterns on flash floods in Hue City, Vietnam. J. Flood Risk Manag. 14 (3), e12668. doi:10.1111/jfr3.12668
Munger, T. T. (1916). Graphic method of representing and comparing drought intensities. Mon. Weather Rev. 44, 642–643. doi:10.1175/1520-0493(1916)44<642:gmorac>2.0.co;2
Niemeyer, S. (2008). New drought indices. Options Mditerranennes Sri A Sminaires Mditerranens 80, 267–274.
Ortiz-Gómez., R., Flowers-Cano, R. S., and Medina-García., G. (2022). Sensitivity of the RDI and SPEI drought indices to different models for estimating evapotranspiration potential in semiarid regions. Water Resour. Manag. 36 (7), 2471–2492. doi:10.1007/s11269-022-03154-9
Soulsby, C., Scheliga, B., Neill, A., Comte, J., and Tetzlaff, D. (2021). A longer-term perspective on soil moisture, groundwater and stream flow response to the 2018 drought in an experimental catchment in the scottish highlands. Hydrol. Process. 35 (6), 14206. doi:10.1002/hyp.14206
Tian, H., Lan, Y. C., Wen, J., Jin, H. J., Wang, C. H., Wang, X., et al. (2015). Evidence for a recent warming and wetting in the source area of the Yellow River (SAYR) and its hydrological impacts. J. Geogr. Sci. 06, 643–668. doi:10.1007/s11442-015-1194-7
Tja, B., Yi, L., Sr, C., Li, F., Hu, Q., Feng, H., et al. (2020). Performance and relationship of four different agricultural drought indices for drought monitoring in China's mainland using remote sensing data. Sci. Total Environ. 759 (10), 143530. doi:10.1016/j.scitotenv.2020.143530
Wang, S., Cao, Z., Luo, P., and Zhu, W. (2022). Spatio-temporal variations and climatological trends in precipitation indices in shaanxi province, China. Atmosphere 13 (5), 744. doi:10.3390/atmos13050744
Wei, X., Wang, N., Luo, P., Yang, J., Zhang, J., and Lin, K. (2021). Spatiotemporal assessment of land marketization and its driving forces for sustainable urban–rural development in shaanxi province in China. Sustainability 13 (14), 7755–7820. doi:10.3390/su13147755
Wu, R., Liu, Y., and Xing, X. (2021). Evaluation of evapotranspiration deficit index for agricultural drought monitoring in north China. J. Hydrology 596 (2), 126057. doi:10.1016/j.jhydrol.2021.126057
Xiao, M., Zhang, Q., and Chen, X. (2012). Study on drought characteristics of the Pearl River basin based on multivariate probability analysis. Acta Geogr. Sin. 67 (1), 83–92. (In Chinese).
Xu, K., Wu, C., Zhang, C., and Hu, B. X. (2021). Uncertainty assessment of drought characteristics projections in humid subtropical basins in China based on multiple cmip5 models and different index definitions. J. Hydrology 600 (10), 126502. doi:10.1016/j.jhydrol.2021.126502
Xu, M., Kang, S., Wu, H., and Yuan, X. (2017). Detection of spatio-temporal variability of air temperature and precipitation based on long-term meteorological station observations over Tianshan mountains, central Asia. Atmos. Res. 203 (5), 141–163. doi:10.1016/j.atmosres.2017.12.007
Yang, P., Xia, J., Zhang, Y., and Wang, L. (2017). Drought assessment in northwest China during 1960-2013 using the standardized precipitation index. Clim. Res. 72 (1), 73–82. doi:10.3354/cr01451
Yang, P., Xia, J., Zhang, Y., Zhan, C., Cai, W., Zhang, S., et al. (2021). Quantitative study on characteristics of hydrological drought in arid area of northwest China under changing environment. J. Hydrology 597 (25), 126343. doi:10.1016/j.jhydrol.2021.126343
Zhang, Q., Shi, R., Singh, V. P., Xu, C. Y., Yu, H., Fan, K., et al. (2021). Droughts across China: drought factors, prediction and impacts. Sci. Total Environ. 803 (4), 150018. doi:10.1016/j.scitotenv.2021.150018
Zhang, Y., Huang, C. C., Tan, Z., Chen, Y., Qiu, H., Huang, C., et al. (2019). Prehistoric and historic overbank floods in the luoyang basin along the luohe river, middle yellow river basin, China. Quat. Int. 521, 118–128. doi:10.1016/j.quaint.2019.06.023
Zhou, C., Chen, D., Wang, K., Dai, A., and Qi, D. (2020). Conditional attribution of the 2018 summer extreme heat over northeast China: roles of urbanization, global warming, and warming-induced circulation changes. Bull. Am. Meteorological Soc. 101 (1), S71–S76. doi:10.1175/bams-d-19-0197.1
Zhu, L., Cooper, D. J., Han, S., Yang, J., Zhang, Y., Li, Z., et al. (2021). Influence of the atlantic multidecadal oscillation on drought in northern daxing'an mountains, northeast China. Catena 198, 105017. doi:10.1016/j.catena.2020.105017
Keywords: sandy, drought events, Standardized Precipitation Index, spatio-temporal characteristic, global warming
Citation: Zhu Y, Li J, Xi X, Zhang J, Ma P, Liang L and Luo P (2024) Spatial and temporal characteristics of drought in the Mu Us Sandy Land based on the Standardized Precipitation Index. Front. Environ. Sci. 12:1349228. doi: 10.3389/fenvs.2024.1349228
Received: 04 December 2023; Accepted: 15 January 2024;
Published: 02 April 2024.
Edited by:
Zhiming Han, Northwest A&F University, ChinaReviewed by:
Yong Wang, China Institute of Water Resources and Hydropower Research, ChinaPanxing He, Henan Normal University, China
Jing Zhao, Xi’an University of Technology, China
Copyright © 2024 Zhu, Li, Xi, Zhang, Ma, Liang and Luo. This is an open-access article distributed under the terms of the Creative Commons Attribution License (CC BY). The use, distribution or reproduction in other forums is permitted, provided the original author(s) and the copyright owner(s) are credited and that the original publication in this journal is cited, in accordance with accepted academic practice. No use, distribution or reproduction is permitted which does not comply with these terms.
*Correspondence: Jiamin Li, l17513250032@icloud.com; Pingping Luo, lpp@chd.edu.cn