How well can people observe the flow state of temporary streams?
 Mirjam Scheller
 Ilja van Meerveld
 Jan Seibert
- Department of Geography, University of Zurich, Zurich, Switzerland
Even though more than half of the global river network does not have continuous flow, temporary (i.e., non-perennial) streams are poorly represented in traditional monitoring networks. Therefore, new approaches are needed to monitor these streams. Citizen science provides an interesting opportunity as people, equipped with smartphones, can observe the flow state of temporary streams. Such observations can go beyond a simple classification of flow vs. no flow and include ecologically important states, such as standing water, isolated pools, or wet streambeds. However, the quality of citizen science data for temporary streams has so far not been thoroughly assessed. Therefore, we asked more than 1,200 people during 23 field days to visually determine the flow state of eight temporary streams based on six classes ranging from a dry streambed to flowing water. Participants could most clearly distinguish a flowing stream from a non-flowing stream. The overall agreement between participants was 66%; 83% of the selected flow states were within one class of the most frequently selected flow state. The agreement with the expert was lower (56% chose the same class, and 79% chose a state within one class). Inconsistencies between the selected flow state and answers to specific yes-no statements about the temporary stream were largest for the dry streambed and damp/wet streambed states. These discrepancies were partly caused by participants looking at different parts of the stream (i.e., participants considered the flow state for a location further upstream or downstream). To ensure that all participants determine the flow state comparably, we recommend clear definitions of the flow state classes, detailed information on the exact location for which the flow state needs to be determined, as well as more training.
1 Introduction
Temporary streams (i.e., non-perennial streams) are highly dynamic systems (Wohl, 2017) that do not always contain flowing water. The different flow states of temporary streams provide unique habitats for terrestrial and aquatic species (Boersma et al., 2014; Bogan et al., 2015; Sánchez-Montoya et al., 2016). A dry streambed can, for example, serve as a bank for eggs of aquatic invertebrates and seeds of aquatic plants, while isolated pools are refugia for aquatic species (Brock et al., 2003; Steward et al., 2012). Thus, it is essential to accurately monitor the different flow states of temporary streams for hydro-ecological research and management (Skoulikidis et al., 2017; Kaletova et al., 2021). However, temporary streams have mostly been neglected in hydrological studies and monitoring networks (Benstead and Leigh, 2012; Snelder et al., 2013; Godsey and Kirchner, 2014; van Meerveld et al., 2020), even though more than half of the global stream network is non-perennial (Larned et al., 2010; Datry et al., 2014; Messager et al., 2021). The lack of hydrological data for temporary streams is, among others, related to the difficulty in measuring zero or very low flows (Zimmer et al., 2020) and the lack of appreciation of dry rivers (Armstrong et al., 2012; Cottet et al., 2023).
Low-cost sensors have been developed to investigate the high spatial variability in the flow states of temporary streams (Goulsbra et al., 2009; Bhamjee and Lindsay, 2011; Jaeger and Olden, 2012; Assendelft and van Meerveld, 2019; Kaplan et al., 2019) but their use is still restricted to experimental studies. The flow state of temporary streams can also be determined from aerial photographs (Spence and Mengistu, 2016; Borg Galea et al., 2019; Davidson et al., 2023). However, this method cannot be applied in forested areas, and its temporal resolution does not allow studying state changes during storm events (Jensen et al., 2019; Kaplan et al., 2019). Other studies have used visual approaches as they are relatively simple. Flow states can be observed at specific stream locations (Beaufort et al., 2018; Sefton et al., 2019) or along the entire stream network (Jaeger and Olden, 2012; Godsey and Kirchner, 2014; Jensen et al., 2019). However, the observer has to visit each location, which might require significant travel times. Thus, obtaining high spatial and temporal resolution data of temporary stream states is difficult.
Citizen science projects can obtain high spatial resolution data, even in remote areas (Weeser et al., 2018), and thus provide an excellent opportunity to collect hydrological data (Lowry and Fienen, 2013; Njue et al., 2019). Citizen scientists have observed water levels (Lowry and Fienen, 2013; Weeser et al., 2018), flood heights and extents (See, 2019; Sekajugo et al., 2022), groundwater levels (Little et al., 2016; Nath and Kirschke, 2023), water quality (Capdevila et al., 2020; Blanco-Ramírez et al., 2023), plastic pollution (Cook et al., 2021; Syberg et al., 2020), and also the state of temporary streams (Turner and Richter, 2011; Kampf et al., 2018; Allen et al., 2019; Truchy et al., 2023). Citizen science projects for temporary streams record the flow state with a visual approach (i.e., they do not use any measurement devices, except for a global positioning system (GPS) or a smartphone). The number of flow states varies from project to project but ranges between two (e.g., Turner and Richter, 2011; Allen et al., 2019) and six (CrowdWater; www.CrowdWater.ch). While some projects focus on the presence or absence of water (e.g., Turner and Richter, 2011; Jensen et al., 2017; Allen et al., 2019), others focus on the presence or absence of flow (e.g., Bhamjee and Lindsay, 2011; Jaeger and Olden, 2012; Snelder et al., 2013; Williamson et al., 2015; Kaplan et al., 2019). In one of the longest-running projects, citizen scientists have mapped the flow state along the 279 km long San Pedro river in Arizona (USA) annually since 1999 (Turner and Richter, 2011; Allen et al., 2019). Other projects started more recently, e.g., Stream Tracker (www.streamtracker.org) and CrowdWater, which have been active since 2017, and DRYvER (www.dryver.eu) since 2020.
Fovet et al. (2021) included citizen science observations of temporary streams into their network design and assumed that these observations, in combination with others (e.g., gauging stations and satellite imagery) improve the mapping of temporary streams. However, there are often also concerns regarding the accuracy and consistency of data collected by citizen scientists (Haklay et al., 2010; Aceves-Bueno et al., 2017; Mitchell et al., 2017). The determination of a flow state is subjective, which could influence the data quality. However, in the study of Seibert et al. (2019), where twelve students determined the flow state of 30 sites along very small headwater streams (width <0.5 m) in the Swiss pre-Alps, most students chose the same flow state (on average 72% chose the same flow state for a particular location, and 93% chose a flow state within one class of the most frequently selected flow state for that location). To obtain consistent observations, Datry et al. (2016) assigned the same citizen scientists to the same stream segments for their biweekly observations. In other studies, citizen scientists received training at local events to increase the consistency of the observations (Turner and Richter, 2011; Allen et al., 2019). They also addressed the accuracy of the GPS, and, thus, the location of the observations. The experiences gained during the Swiss field study with students highlighted the need to provide clear guidance on the stream length that needs to be considered as well (Seibert et al., 2019). Although the quality of flow state observations by citizen scientists can theoretically be determined by an expert when a picture is uploaded together with the selected flow state (as it is, for example, done in the Stream Tracker, RIU.NET (https://www.ub.edu/fem/index.php/en/inici-riunet-en), DRYvER and CrowdWater projects) (Wiggins et al., 2011), so far, there has not been a detailed study to determine the quality of visual stream state observations for a range of streams by a large group of different citizen scientists.
In this study, we asked 1,268 people at eight different temporary streams in Switzerland and Southern Germany to visually assess the flow state of a stream and to fill out a questionnaire. We used these survey results to address the following research questions:
1. How well do flow state observations by different citizen scientists agree?
2. For which flow states are the visual flow state observations most reliable?
3. How well do the answers to different yes-no statements regarding a stream by single citizen scientists agree with their selected flow state?
4. What factors affect the accuracy and reliability of visual flow state observations by citizen scientists?
2 Methods
2.1 Overall approach
Previous studies have shown that surveys are a suitable way to determine the reliability of citizen science data (Rinderer et al., 2012; Artell et al., 2013; Strobl et al., 2020). Therefore, in this study, we used a structured pen-and-paper questionnaire (see section 2.3) and asked 1,268 participants questions about the flow state of the stream that they could see in front of them. Like Strobl et al. (2020), we approached passers-by and asked them to participate in the 5-min questionnaire, i.e., we used a convenience sampling approach. We did this for eight temporary streams in Switzerland and southern Germany on 23 days between April and September 2022.
2.2 Study sites and field days
We selected eight temporary streams for the surveys. The streams were located along hiking paths or near attractions, so that we could reach a sufficient number of participants. Five of the study sites were located in Switzerland (Pizol (P), Sihlwald (S), Thurfälle (Th), Töss (T), Züriberg (Z)) and three in Germany (Donauversickerung (D), Dreisam (Dr), Hinterzarten (H)) (Figure 1). The selected streams varied from small alpine streams (P), to headwater streams (H, S, Z), to larger rivers (D, Dr, T, Th) (Figure 1; Table 1). The stream width and visible stream length were determined in the field and used to group the streams into three classes (small, medium, large; Table 1). Some streams (Z, S, and H) had vegetation in the stream or on the streambank, which made it (more) difficult to see the streambed, while others were open. The climate at the study sites varies from temperate, with no dry season and a warm summer (Köppen-Geiger classification: Cfb (Kottek et al., 2006)), to cold, with no dry season and a warm summer (DfB).
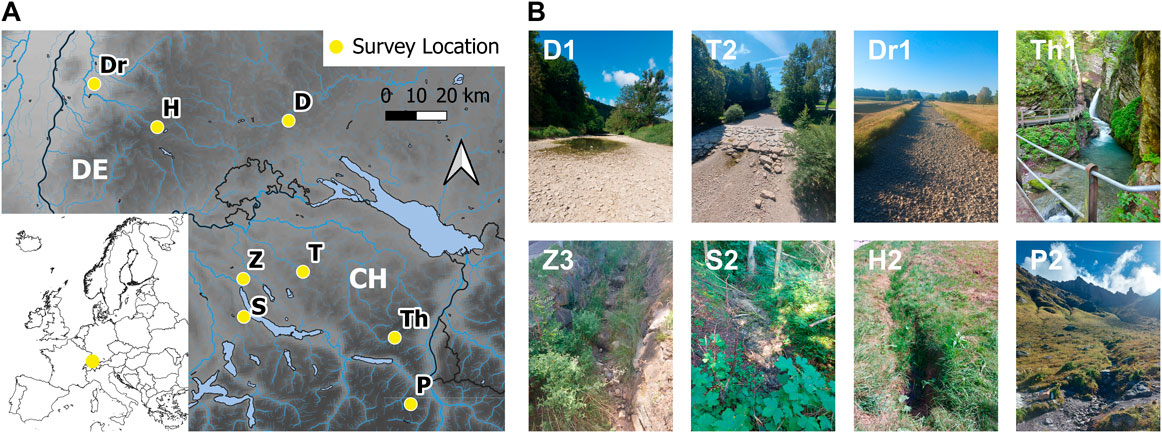
FIGURE 1. (A) Locations and (B) pictures of the eight study sites in Switzerland (CH) and Germany (DE). For the abbreviation of the field days (printed in the top left corner of the pictures), see Table 1. Source for the DEM and river network in (A): https://www.eea.europa.eu/ (last accessed 07.04.2023).
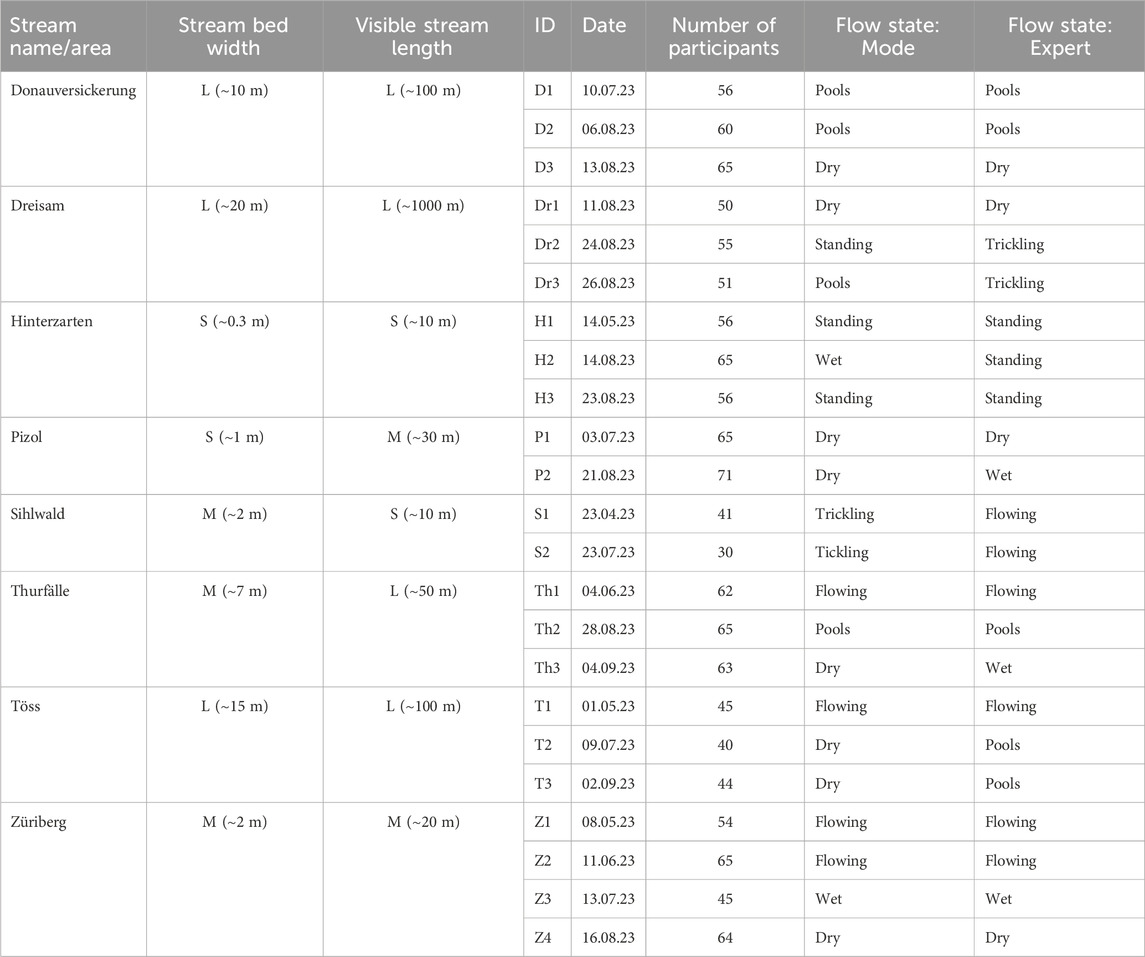
TABLE 1. Overview of the study sites and the individual field survey days. The most frequently selected flow state by the participants (i.e., the mode) and expert’s opinion of the flow state are given for each field day as well.
The field days were selected based on the expected flow state to cover a variety of flow states. Not all flow states were observed for each stream and not all flow states were surveyed a similar number of times (Table 1). We did most of the surveys on weekends and during pleasant weather conditions so that people would be more willing to participate. We stayed for 2.5–5 h (average 3.6 h) at each site and aimed to survey at least 40 people per day (cf. Field, 2015; Strobl et al., 2020). The average number of participants was 55 (median: 56). However, on field day S2, only 30 people filled in the questionnaire. We did not count the number of people we asked to participate but estimated that about 80% of the people that we approached were willing to join (excluding bikers).
2.3 Questionnaire
The questionnaire was developed iteratively over three test runs before deciding on the final version. Between the test runs, we changed the questions and structure of the questionnaire based on participants’ feedback and discussions with colleagues. After these initial tests, we finalized the questionnaire (Supplementary Material S1). We used this final version for all surveys presented in this paper.
The pen and paper questionnaires were available in English and German and contained four parts (see Supplementary Material S1). In the first part, the participants were asked about their knowledge of the survey location and whether they had previously heard of the CrowdWater project. Then, they were asked to determine the flow state of the stream in front of them based on six different icons with either a one- or two-word description (Table 2). The six classes are the same as those used in the CrowdWater app: dry streambed, damp/wet streambed, isolated pools, standing water, trickling water, and flowing (Table 2). These six flow state classes represent unique habitats for aquatic and terrestrial species. At the end of this second part, we asked the participants for an estimate of the length of the stream reach that they considered when they determined the flow state, whether they found it challenging to decide on one flow state, and whether they considered other information than what they could see in front of them.
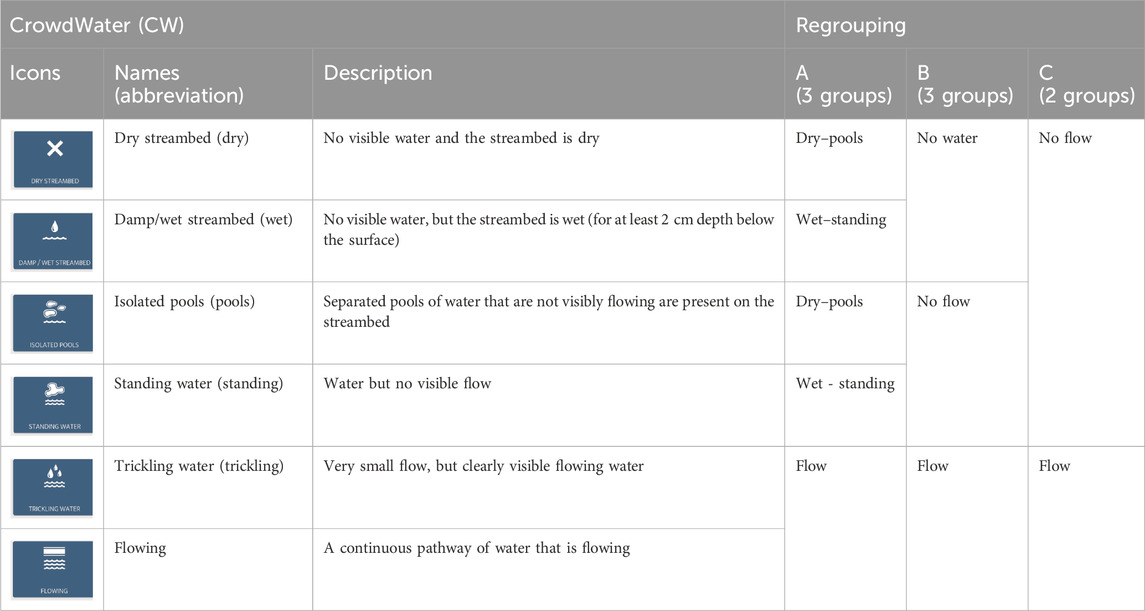
TABLE 2. Description of the six flow state classes, including the icons from the CrowdWater app and the corresponding flow states when fewer classes would be used. The abbreviation of the name of the flow state class is used throughout the manuscript for conciseness. Note that the description of the flow state was obtained from the CrowdWater website (www.CrowdWater.ch) and is included here for clarification. The participants did not receive this information (see Supplementary Material S1).
In the third part of the questionnaire, the participants were given 14 statements that could be answered with either yes or no, such as “There is water along the entire stream length.” and “The stream is completely dry”. These yes-no statements were designed to assess if the participants understood the icons and the one- or two-word descriptions of the flow states, i.e., we used the answers to these statements to determine the consistency with the flow state that they had selected in part 2. In the final part, we asked some demographic questions (see Supplementary Material S2 for results) and provided space for comments. We did not give the participants additional information or help while filling in the questionnaire because we wanted to assess how people intuitively interpret the six flow state classes. This was motivated by the general observation that people rarely study manuals or explanation videos and rather start using an app immediately. However, we were available for questions and discussions afterwards.
2.4 Data analyses
2.4.1 Agreement among participants during a field day
For each field day, we determined the percentage of participants who selected a particular flow state and the flow state that was selected by most of the participants (i.e., the mode). We considered the most frequently selected flow state the truth (i.e., the correct flow state). We then determined the percentage of participants who selected the correct flow state for each field day (i.e., the percentage of participants who selected the same flow state as the mode) and refer to this as the agreement Amode. We, furthermore, determined the percentage of participants who selected the same flow state as the mode or one of the neighboring flow states (Amode±1). Thus, if most participants selected the trickling flow class, we determined the percentage of participants who selected the standing water, trickling, or flowing flow state classes to calculate Amode±1. However, for the wettest or driest flow states, we only included one neighboring class. Thus, if most participants selected the dry streambed, we counted only the percentage of participants who selected the dry streambed or the damp/wet streambed class for Amode±1. Similarly, if most participants said the stream was flowing, we counted the percentage of participants who selected the trickling or flowing classes.
To further quantify the variation in the choices of the participants, we also determined for each participant how many classes the selected flow state was away from the mode (δmode). Finally, we determined the mean value of δmode for different groups of flow states, streams, and groups of participants and refer to this mean value of δmode as the Δmode. For comparison, we also calculated the mean value of the absolute values of δmode (Δmode, abs). It is important to emphasize that these calculations with ordinal data require careful interpretation.
We also used the expert’s opinion as the true flow state. The expert’s opinion is the flow state class chosen by the first author, who has considerable experience in temporary stream observations (including discussions with other hydrologists at different streams) and was present during all field days. Thus, we also calculated for each field day the percentage of participants who selected the same flow state class as the expert (Aexpert) and the same class as the expert or one of the neighboring flow states class (Aexpert±1). We also determined for each participant the number of classes that the selected flow state was away from the expert’s opinion (δexpert) and the mean value of δexpert for different groups of flow states, streams, and groups of participants (Δexpert and Δexpert, abs).
We used the Kruskal-Wallis test (Hollander et al. (2014); stats package in R) with a Dunn-Bonferroni post hoc test (Dunn (1964); FSA package in R) to determine if the values of δmode or δexpert were significantly different for the different flow states, streams or groups of participants (Table 3). We used the Mann-Whitney test (Hollander et al. (2014); stats package in R) to determine the difference in δmode or δexpert for participants who felt confident in their choice, and for those who considered additional information or not.
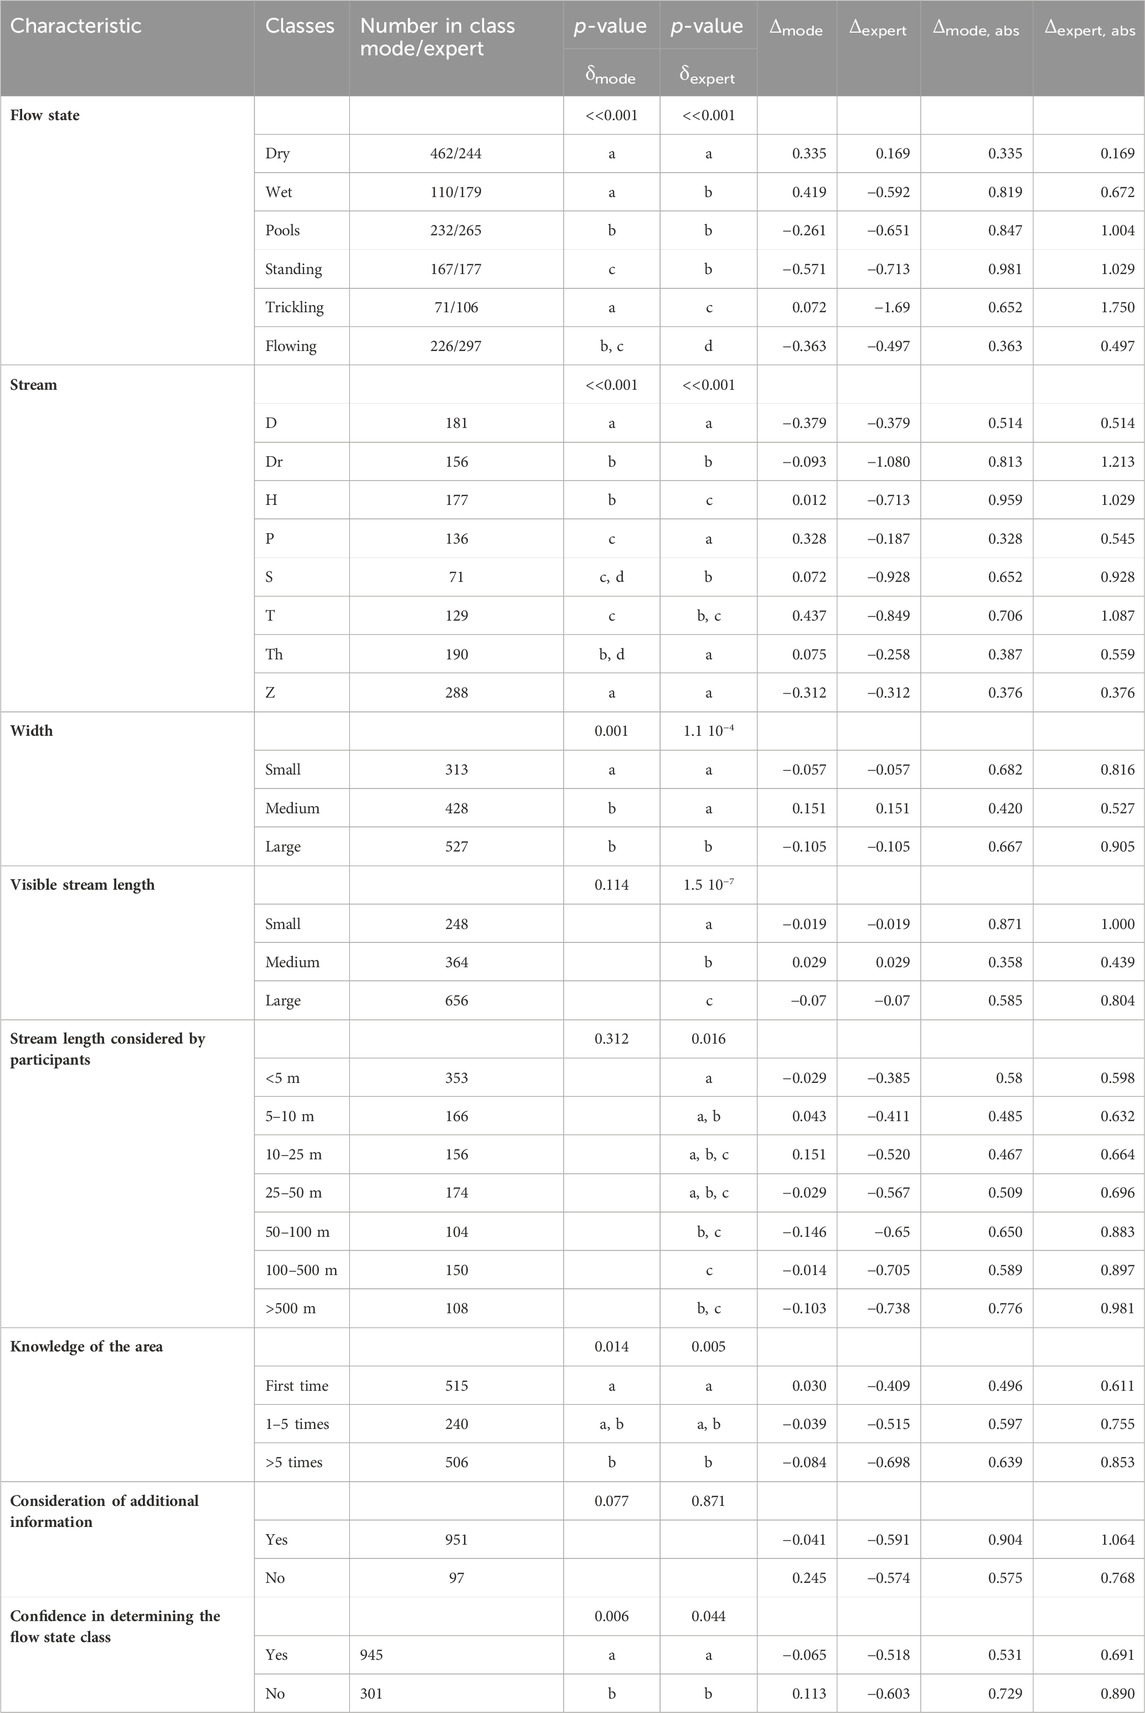
TABLE 3. Results for the Mann-Whitney and Kruskal-Wallis tests of the deviation between the flow state selected by a participant and the mode (δmode) or the expert’s opinion (δexpert), as well as the mean deviation (Δmode and Δexpert) and mean absolute deviation (Δmode, abs and Δexpert, abs) for the different flow states classes, streams, and participant groups. Negative values of Δmode (Δexpert) indicate that the mean flow state was drier than the state selected by the mode (expert), while positive values indicate a wetter state. Groups that do not share a similar letter below the p-values of the Mann-Whitney or Kruskal-Wallis test are significantly different.
2.4.2 Sensitivity and precision per flow state class, and overall agreement
We created a confusion matrix for all the survey results and determined the number of true positives (nTP), false positives (nFP), and false negatives (nFN) based on the mode of participants’ opinions and again also on the expert’s opinion (Tharwat, 2021). A positive condition indicates that the opinion of the participants agrees with the majority of participants (i.e., the mode) (or the expert). A negative condition describes a disagreement with the majority of participants (or the expert). Thus, the total number of true positives (nTP) for a particular flow state is the total number of people who selected the same state as the mode (or expert). The number of false positives (nFP) is the number of times that a participant selected that particular flow state, but that flow state was not selected by the mode (or the expert). The number of false negatives (nFN) for a particular flow state is the number of times that the participant did not select a flow state, but the mode (or expert) did (i.e., the participants wrongly selected it to be absent). For example, for the dry streambed class, nTP is the number of participants who selected a dry streambed when the mode (or expert) also selected the dry streambed class, the nFP is the number of times that a participant selected the dry streambed class, but the mode (or expert) selected a different class, and the nFN is the number of times that the mode (or expert) selected the dry streambed class, but the participant selected a different class.
Based on these counts, we determined for each flow state the sensitivity (S) and the precision (P) (cf. Sekajugo et al., 2022):
The sensitivity describes the proportion of time that given a (true) flow state, a participant selects that state. In contrast, the precision describes the proportion of time that if a participant selected a state, it is also the true flow state (i.e., the state selected by the mode or the expert).
The overall agreement (Aoverall) for all surveys is the percentage of all correctly predicted flow states during all surveys. To account for the different number of surveys for the different flow states, we also calculated a weighted overall agreement (Aoverall, weighted), for which we weighted the precision of the individual flow states by the number of times they were observed (according to the mode or expert).
2.4.3 Other flow state classes
In some projects on temporary streams, only two or three flow state classes are used. To assess the quality of the data for these types of classifications, we merged the six flow state classes in three different ways: A, B, and C (see Table 2). For regrouping A (three classes), the dry streambed and isolated pools classes were merged into a dry streambed with or without isolated pools class (dry - pools), the damp/wet streambed and standing water classes were combined into a wet streambed with possibly standing water class (wet - standing), and the trickling water and flowing classes were merged into a flowing water class (flow). For regrouping B (three classes), the dry streambed and damp/wet streambed classes were combined into a no water class (no water), the isolated pools and standing water classes were merged into a water, but no flow class (no flow), and the trickling water and flowing classes were again combined into the flowing water class (flow). For regrouping C (two classes), we combined the dry streambed, damp/wet streambed, isolated pools, and standing water classes into a no flow class (no flow) and the trickling water and flowing classes into a flowing water class (flow). We calculated the Aoverall for these different groupings and the sensitivity (S) and precision (P) for each new class.
3 Results
3.1 Agreement of the flow state observations
Combining all surveys, two-thirds of the participants selected the same class as the mode (Aoverall). The Aoverall, weighted was 0.67, and thus almost identical to Aoverall. Only 17% and 4% of all participants selected a flow state that was more than one or two classes away from the mode, respectively (Figure 2). For field days for which most participants selected either the dry streambed class or flowing class, the agreement was highest (Amode±1: >89%; Figure 3). Thus, for these “extreme” classes, most participants selected the same flow state as the majority of other participants (Amode) or were just one class off (Amode±1). When the mode was not the dry streambed or flowing water class, 28% of participants selected a flow state that was more than one class off from the mode. The agreement was lowest when most participants selected the isolated pools or standing water classes (median Amode±1: 67% and 62%, respectively; Figure 3). Amode±1 was particularly low (<57%) for surveys H3 and T3 for which the flow state selected by most participants was standing water and dry streambed, respectively (Supplementary Figure S1). Δmode was also furthest from zero for the standing water class (Table 3).
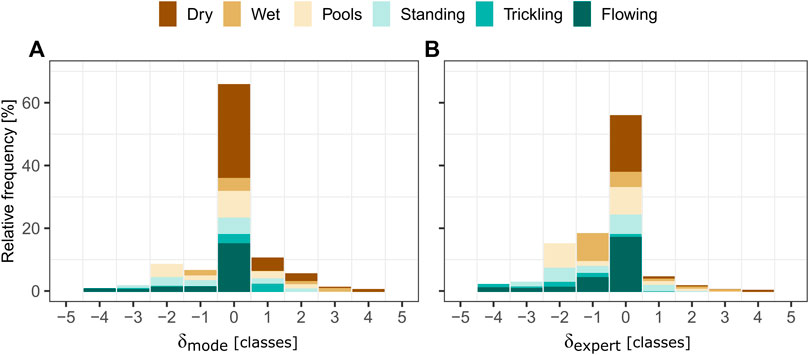
FIGURE 2. Stacked bar plots showing the frequency of the deviations between the flow state class selected by a participant and the flow state class selected by most participants (δmode; (A)) or the expert (δexpert; (B)) for that day. The stacked bar plots show the results for all surveys combined but are color coded by the flow state chosen by the mode or the expert. Negative values of δmode and δexpert indicate that the selected flow state was drier than the state selected by the mode or expert, while positive values indicate a wetter flow state.
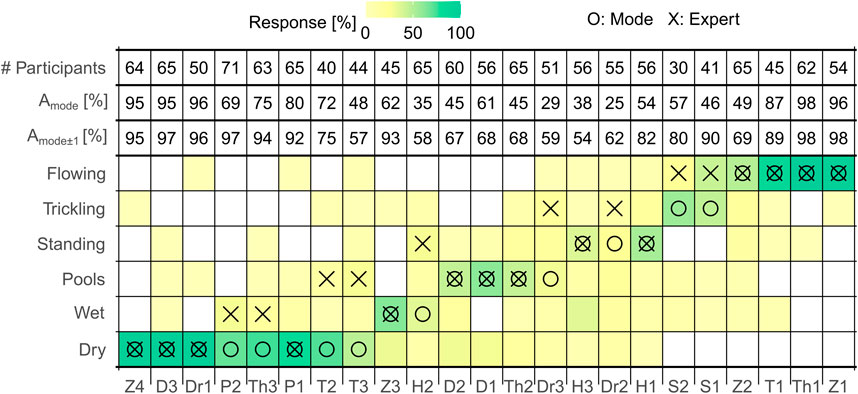
FIGURE 3. Heatmap showing the percentage of participants who selected a certain flow state class for each field day. The O represents the mode (i.e., the flow state class selected by most participants), and the X represents the expert opinion for that day. The number of participants per field day (# Participants), the percentage of participants who selected the same flow state as the mode (Amode) or one of the neighboring classes (Amode±1) are given above the heatmap. The field days are sorted by the flow state according to the mode and mean flow state.
The mode and expert opinion agreed for 14 of the 23 field days. For five field days, the opinions differed by one class, and for four field days, they differed by two classes. Participants tended to select a drier flow state than the expert. The one class too dry mainly occurred when the expert’s opinion was damp/wet streambed and most participants selected the dry streambed (P2, Th3), or when the expert selected the flowing class and the participants selected the trickling water class (S1, S2) (Figures 2, 3). The difference of two flow state classes mainly occurred when the expert had selected the isolated pools or standing water class and the participants (mode) selected the dry or wet/damp streambed class (e.g., H2, T2). As a result, the overall agreement between the participants and the expert was lower than for the mode (Aoverall: 56% for the expert vs. 66% for the mode).
3.2 Sensitivity and precision for the six flow states
When assessed by the mode, the sensitivity and precision were highest for the dry streambed and flowing classes (>80%, Figure 4, top row). The sensitivity was much lower for the other classes (Smode: ∼50%), and lowest for the standing water class (Smode: 40%). The precision was intermediate for the standing water and isolated pools classes, and lowest for the damp/wet streambed and trickling water classes.
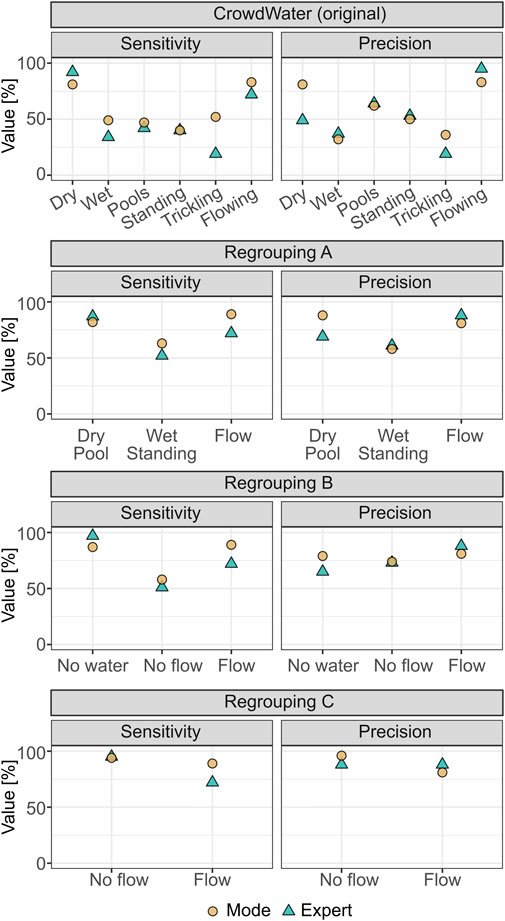
FIGURE 4. Sensitivity and precision of the flow state classes for the original data and when the data were regrouped into three or two different classes with the mode (circle) or expert’s opinion (triangle) used as the truth. See Table 2 for information on how the six classes were regrouped.
The most striking point of the confusion matrix for the expert’s opinion, is the high number of false negatives for the dry streambed class (nFN: 230; Supplementary Figure S2). Many participants selected the dry streambed class when the expert chose the wet/damp streambed or isolated pools class (Figure 3). This resulted in a low precision (Pexpert: 59%) for the dry streambed class, even though the sensitivity was high (Sexpert: 92%) (Figure 4, top row). The precision and sensitivity were lowest for the trickling water class, but this flow state was selected by the expert on only two field days.
3.3 Consistency of the questionnaire responses for individual participants
The answers to the different yes-no statements of the questionnaire were consistent with the (previously) selected flow state class for 78%–98% of the participants, depending on the statement (Figure 5). Theoretically, participants who selected the dry or damp/wet streambed flow state should not have seen any water in the stream. However, 27% of the participants who selected the dry streambed class answered yes when asked if they could see disconnected pools of water. Similarly, 16% said that they could see water in the stream, 7% could see water along the entire visible stream length, and 49% answered yes when asked if the stream was completely damp/wet (Figure 5). A large proportion of the participants who selected the damp/wet streambed class also said that they could see disconnected pools of water (46%), water in the stream (57%), or water along the entire stream (25%). For the other four flow states, the percentage of inconsistent answers was small (1%–6%).
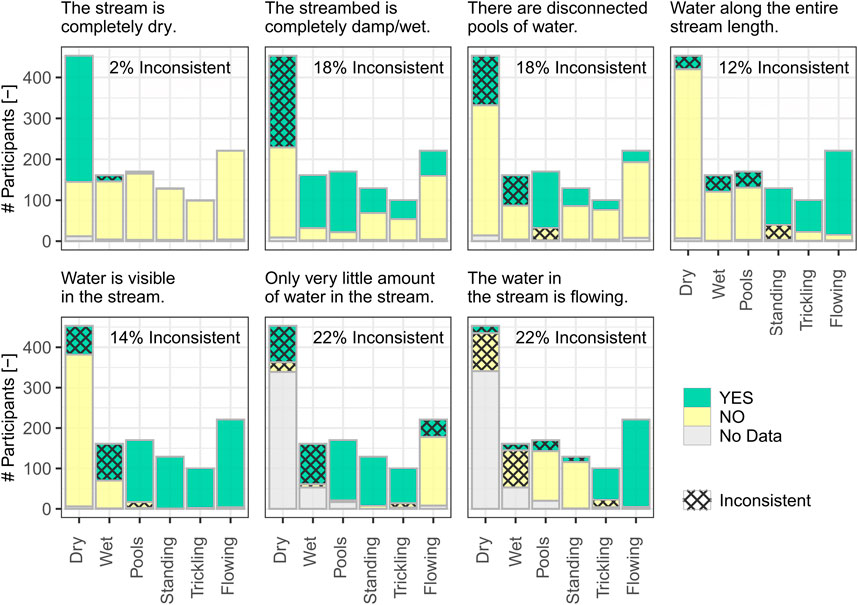
FIGURE 5. Bar plots showing the answers of participants to seven of the yes-no statements after they had selected the flow state for the stream that they could see in front of them. The answers that are inconsistent with the previously selected flow state class are marked with a hashed pattern; the overall percentage of “inconsistent” answers per statement is given in the top right corner of each plot. The participants were asked not to answer certain statements if they said that no water was visible in the stream, but some still did.
3.4 Factors affecting the deviation from the mode or expert opinion
The deviation of the selected flow state class from the expert was related to the visible stream length and the considered stream length. Δexpert was closer to zero and Δexpert, abs was smaller when the considered stream length was shorter than 5 m than when it was longer than 50 m (Table 3; Supplementary Figure S3); 28% of the participants considered a distance shorter than 5 m and 61% shorter than 50 m. The participants at the Dreisam (Dr) considered by far the longest stream length when determining the flow state class (median: 500 m). It was more than twice the visible length for 14% of all the responses.
Participants who did not use any additional information tended to select a wetter stream state than the mode (Δmode = 0.25), though the difference was not statistically significant (Table 3). The most frequently used additional information by the participants were the flow state on the previous days or familiarity with the stream for several years, the weather in the last days/weeks, newspaper articles about the stream, or information on water management actions (e.g., abstraction, re-naturalization programs). For those who used additional knowledge, Δmode was close to zero (−0.04) but the deviation from the mode was bigger than if no additional information was used (Δmode, abs of 0.90 vs. 0.58) (Table 3). Only 4% of the participants who were at a site for the first time used additional knowledge to decide on the flow state vs. 12% of those who had been there more than five times. The deviation from the mode or expert’s opinion was significantly smaller for participants who visited the site for the first time than those who had been there more than five times. The deviation was also smaller for the 75% of participants who felt confident in their selection of the flow state class than for those who were insecure about their decision (Δmode of −0.07 vs. 0.11 and Δmode, abs of 0.53 vs. 0.73; Table 3).
3.5 Alternative flow state classes
3.5.1 Merged flow state observations
Merging the six different flow state classes into two classes improved the overall agreement (Figure 6, regrouping C). Aoverall changed from 66% to 92% for the mode and from 56% to 88% for the expert’s opinion. Note that by having fewer classes the overall agreement automatically increases because the probability of a class being correct becomes higher when there are fewer classes. The overall agreement for the two regroupings with three classes (regrouping A and B) did not differ (Figure 6). The sensitivities and precision of the merged flow state classes were higher than for the original six flow state classes (Figure 4). For regrouping A and B, the sensitivity and precision were lowest for the wet-standing and no-flow class, respectively. For regrouping C, the sensitivity was lower for the flow class than the no-flow class (Figure 4).
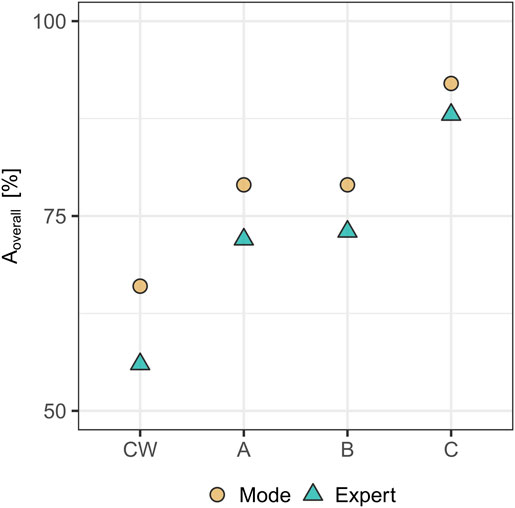
FIGURE 6. Overall agreement (Aoverall; i.e., the percentage of all correctly predicted flow states) for the original six flow state classes (CW), the reclassification into three classes (A, B), and two classes (C) when the mode (circle) or expert’s opinion (triangle) was used as the truth. See Table 2 for information on how the six classes were regrouped. Note that the y-axis starts at 50% to show the differences in Aoverall for the different classifications better.
3.5.2 Flow state observations from yes-no statements
Although the yes-no statements were not formulated so that a flow state class could be derived from them directly, such statements could be used to derive a flow state or to create a flow chart to determine the flow state. In general, the consistency between the chosen flow state and the answers to a single yes-no statement or two yes-no statements was high (Table 4). For example, if the stream was dry, we expected the participants to say yes to the statement “The stream is completely dry.” and no to the statements “The streambed is completely damp/wet.“, “There are disconnected pools of water.“, “There is water along the entire stream length.“, and “There is water visible in the stream.“. Only 38% of the participants answered all five statements as expected when the stream was dry (based on the mode) vs. 64% for only the statement on the streambed being completely dry (Table 4). Similarly, for standing water, we would expect the participants to not only answer yes to the statement “There is water along the entire stream length.” and no to the statement “The water in the stream is flowing.” but to also say yes to the statements “The streambed is completely damp/wet.” and “Water is visible in the stream.” and no to the statements “The stream is completely dry.” and “There are disconnected pools of water.”. Only 7% of the participants answered all six of these yes-no statements according to our expectation when there was standing water (mode) (vs. 47% for only the first two statements (Table 4)).
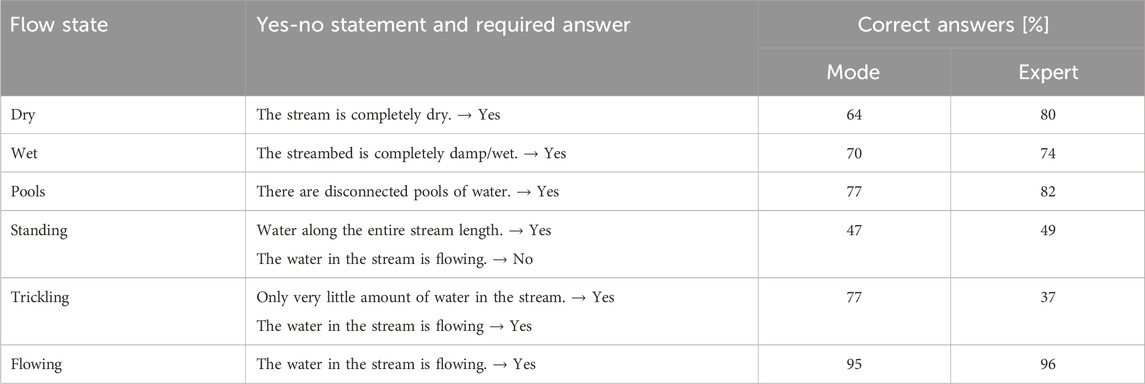
TABLE 4. Percentage of participants who answered one or two yes-no statements related to a flow state correctly, when the true flow state was based on the mode or expert opinion.
4 Discussion
4.1 How well can citizen scientists observe the flow state?
The level of agreement among the participants (Amode: 66%) compares well to the agreement reported in other studies that used surveys to determine the quality of citizen science data. These previous studies based on visual assessments (e.g., water level classes (Strobl et al., 2020), soil moisture (Rinderer et al., 2012; Rinderer et al., 2015), and water quality (Artell et al., 2013)) reported overall agreements of 46%–70%. In these studies, the classes selected by the participants were either compared to the experts’ opinions (Strobl et al., 2020), the opinion of the majority of the participants (Rinderer et al., 2012; Rinderer et al., 2015), or measured values (Artell et al., 2013). The number of classes ranged from five (Artell et al., 2013), to seven (Rinderer et al., 2012; Rinderer et al., 2015), to ten (Strobl et al., 2020). Thus, the overall agreement values obtained in our study seem to be good and comparable to these studies. Aceves-Bueno et al. (2017) report that for 80% of citizen science studies in natural sciences, the agreement was higher than 55%; for 60% of the studies, it was higher than 81%.
Interestingly, the agreement among the participants was also on par with studies that used sensors to detect the presence of water or flow. For example, the mean agreement between data from four different low-cost sensors and time-lapse camera images for several streams in a small Swiss headwater catchment varied between 75% and 99.9% (Assendelft and van Meerveld, 2019). Another study suggested that temperature sensors always determined the dry and not-dry flow state correctly (based on visual flow state observations) (Constantz et al., 2001). Comparisons of dry and not-dry flow states between water level logger data and pre-processed time-lapse camera images led to concordant observations if the water level logger indicated a dry stream (true positive rate: 100%), but if the water level logger measurements indicated a not-dry condition, observations diverged by 48%–85% (Herzog et al., 2022). A national hydrography dataset of stream permanence classifications disagreed one-quarter of the time with flow state assessments from topographic maps or aerial imagery and interviews with residents, with the disagreement being higher for smaller streams (Hafen et al., 2020).
4.2 Why did participants’ opinions on the flow state differ?
The flowing flow state class could be determined best. The agreement and sensitivity were also high for the dry streambed class, but participants tended to select the dry streambed class even when they saw some water in the streambed (Figure 5). This led to a low precision when assessed by the expert’s opinion and caused the mode and the expert’s opinion to differ for half of the field days for which the mode was a dry streambed. This result also makes the observations regarding water and no water in the streambed less reliable than for flow and no flow (Figure 4). The spread in the chosen flow states and the inconsistency between the answers to the different yes-no statements may suggest that the participants did not understand the six flow state classes well without any explanation. However, the differences are in part also related to the variability in flow states along the stream, as several flow state classes can be present along one stream segment. The variation in the opinions (Table 3) and the deviation from the expert’s opinion were smaller when the considered stream lengths were smaller. Thus, the differences between the opinions of the expert and the participants could be caused by the fact that participants considered a different/longer stream length than the expert. For example, on field days Dr2 and Dr3, the stream flow state at the survey location was trickling (according to the expert), but the stream was dry 2 km further downstream. This may explain why 13% and 12% of the respondents selected the dry state for Dr2 and Dr3, respectively, even though the streambed was not dry at the survey location. The selected flow state can also be affected by the news, as several news outlets reported on the dry Dreisam (Dr) earlier in the summer.
The size of the pools, in comparison to the stream width and visibility of the pools, likely also influenced the choice of the flow state. During field day D1, there were big pools (approximately 40 m long) and very few participants said that the streambed was dry (Figure 3). During field days D2, T2, and T3, there were very small pools (approximately 0.5–5 m), or the pools were slightly hidden, and more participants selected the dry streambed class. However, in the yes-no statements, most participants said that they saw isolated pools of water. Thus, the participants selected the dry streambed class despite acknowledging the presence of pools. During field day T2, when small, isolated pools (approximately 0.5 m long) were present, one participant wrote that they could see isolated pools on the streambed but that they knew that these would not be there on the next day and that they, therefore, selected the dry streambed class. For some field days for which it had rained the night before (D2, P2, Th3, D2), some participants similarly questioned if they should consider the water in the stream or the dampness of the streambed. They argued that it was “just” rainwater, and the water was not from the stream itself. Other participants questioned if the stream could be considered to be dry or not flowing only because there was no (flowing) water in the streambed. Based on comments like “The stream is flowing below ground” at the Töss (T), it seems that some participants knew that water was still flowing below the ground in the alluvial aquifer.
Participants also commented on the visibility of the stream, especially when the stream was not well visible due to vegetation (H1-3, Z2). The flow condition on field day Z2 was the same as on Z1, but the survey was carried out further downstream, where lots of vegetation covered the stream. This poor visibility may have resulted in a larger spread in the selected flow state classes between participants for Z2 (Amode: 49% vs. 96%; Figure 3).
4.3 How many flow state classes should citizen science projects use?
In this study, we used six flow state classes because each class has a unique hydro-ecological function. For the classes in the middle of the dry to flowing spectrum the agreement, precision, and sensitivity were low, which raises the question if it is better to use fewer classes. Indeed, the agreement is higher when there are fewer classes, but one advantage of having more classes is that the effect of being a class off is smaller. Furthermore, only a few participants selected a flow state that was more than one class away from the mode (17% for all surveys, and 28% when the mode was not the dry streambed or flowing water class). Therefore, we still recommend using six classes and later regrouping the data into three or two classes (if needed). However, one should first consider what kind of data are needed for the project’s objectives.
4.4 Recommendations to increase the agreement, sensitivity, and precision of flow state observations
We did not give participants any guidance on how to choose the flow state as we wanted to study how people intuitively interpret the six flow state classes. The results show that the icons and one or two-word descriptions are not immediately clear and/or that flow state observations for temporary streams are not as simple or obvious as one might expect. Thus, additional descriptions and some guidance or training would be useful, especially on which flow state class to select if several flow states are visible. Jaeger et al. (2021) already highlighted the importance of clear definitions and logical workflows for temporary stream observations to be helpful for end users. The effects of such training on data quality and participation, however, remains to be explored.
Similarly, the fact that for some sites, participants considered a very long stream length (longer than what was visible) suggests that clear instructions to determine the flow state locally or, for instance, over twice the river width would be useful. In the CrowdWater app, citizen scientists are asked to take a picture of the stream and to indicate the spot for which they determine the flow state by an arrow or circle. This provides a spatial frame that should help focus citizen science observations to one point in the stream. This spatial frame was not used in the surveys. Thus, it remains to be explored whether it improves the agreement, precision, and sensitivity of actual citizen science data.
The results of the surveys do not allow us to determine how well an individual person is able to observe changes in flow states over time and whether repeated observations of flow states are more reliable if they are made by the same person. One could expect observations from one person to be more reliable because that person probably always looks at the same spot. The results of Etter et al. (2020) for water level class observations also suggest that observations by the same person better reflect actual changes in the stream level than when observations are made by many different people (which potentially each have a different bias).
5 Conclusion
The questionnaire results from more than 1,200 surveyed participants suggest that citizen scientists can observe the flow state of temporary streams reasonably well. The differentiation between the six different flow states was good: only 17% of the participants selected a class that was more than one class away from the mode. However, the results also suggest that icons for the six flow state classes with only a one or two-word description are not completely intuitive and require additional explanations, especially for the classes in the middle of the dry streambed to flowing water spectrum. Participants tended to select the dry streambed class more often than the expert, and when they chose the dry streambed their answers to yes-no statements in the questionnaire often did not agree with the selected flow state class. To improve the comparability of the temporary stream observations and the quality of the observations, it is useful to provide guidance on how to determine the flow state class. In particular, additional information should be given on the location and length of the stream reach to be considered, and how the flow states are defined. With the implementation of such small changes, citizen scientists will be able to collect even more reliable observational data on the state of temporary streams. The effects of such changes, results for different types of temporary streams, and the influence of social-cultural values and languages should be considered in future studies.
Data availability statement
The raw data supporting the conclusion of this article will be made available by the authors, without undue reservation.
Ethics statement
Ethical review and approval was not required for the study on human participants in accordance with the local legislation and institutional requirements. Written informed consent from the (patients/ participants or patients/participants legal guardian/next of kin) was not required to participate in this study in accordance with the national legislation and the institutional requirements.
Author contributions
MS: Writing–original draft, Conceptualization, Data curation, Formal Analysis, Investigation, Methodology, Visualization, Project administration. IM: Writing–review and editing, Conceptualization, Methodology, Supervision, Project administration, Validation, Funding acquisition. JS: Writing–review and editing, Conceptualization, Funding acquisition, Project administration, Supervision.
Funding
The author(s) declare financial support was received for the research, authorship, and/or publication of this article. This study was funded by the Swiss National Science Foundation: 200020_192125 Crowd-based data collection for hydrology and water resources research (CrowdWater II).
Acknowledgments
We thank all the participants for participating in the surveys. We also thank the student assistants and colleagues (Rieke Goebel, Lawrence Bassfeld, Victor Gauthier, Csilla Remann, Jan Pfiffner, Franziska Clerc-Schwarzenbach) who helped us with the surveys. We thank Sara Blanco-Ramírez for insightful discussions that helped shaping this work.
Conflict of interest
The authors declare that the research was conducted in the absence of any commercial or financial relationships that could be construed as a potential conflict of interest.
Publisher’s note
All claims expressed in this article are solely those of the authors and do not necessarily represent those of their affiliated organizations, or those of the publisher, the editors and the reviewers. Any product that may be evaluated in this article, or claim that may be made by its manufacturer, is not guaranteed or endorsed by the publisher.
Supplementary material
The Supplementary Material for this article can be found online at: https://www.frontiersin.org/articles/10.3389/fenvs.2024.1352697/full#supplementary-material
References
Aceves-Bueno, E., Adeleye, A. S., Feraud, M., Huang, Y., Tao, M., Yang, Y., et al. (2017). The accuracy of citizen science data: a quantitative review. Bull. Ecol. Soc. Am. 98 (4), 278–290. doi:10.1002/bes2.1336
Allen, D. C., Kopp, D. A., Costigan, K. H., Datry, T., Hugueny, B., Turner, D. S., et al. (2019). Citizen scientists document long-term streamflow declines in intermittent rivers of the desert southwest, USA. Freshw. Sci. 38 (2), 244–256. doi:10.1086/701483
Armstrong, A., Stedman, R. C., Bishop, J. A., and Sullivan, P. J. (2012). What’s a stream without water? Disproportionality in headwater regions impacting water quality. Environ. Manag. 50 (5), 849–860. doi:10.1007/s00267-012-9928-0
Artell, J., Ahtiainen, H., and Pouta, E. (2013). Subjective vs. objective measures in the valuation of water quality. J. Environ. Manag. 130, 288–296. doi:10.1016/j.jenvman.2013.09.007
Assendelft, R. S., and van Meerveld, H. J. I. (2019). A low-cost, multi-sensor system to monitor temporary stream dynamics in mountainous headwater catchments. Sensors (Basel, Switz. 19 (21), 4645. doi:10.3390/s19214645
Beaufort, A., Lamouroux, N., Pella, H., Datry, T., and Sauquet, E. (2018). Extrapolating regional probability of drying of headwater streams using discrete observations and gauging networks. Hydrology Earth Syst. Sci. 22 (5), 3033–3051. doi:10.5194/hess-22-3033-2018
Benstead, J. P., and Leigh, D. S. (2012). An expanded role for river networks. Nat. Geosci. 5 (10), 678–679. doi:10.1038/ngeo1593
Bhamjee, R., and Lindsay, J. B. (2011). Ephemeral stream sensor design using state loggers. Hydrology Earth Syst. Sci. 15 (3), 1009–1021. doi:10.5194/hess-15-1009-2011
Blanco-Ramírez, S., van Meerveld, I., and Seibert, J. (2023). Citizen science approaches for water quality measurements. Sci. Total Environ. 897, 165436. doi:10.1016/j.scitotenv.2023.165436
Boersma, K. S., Bogan, M. T., Henrichs, B. A., and Lytle, D. A. (2014). Invertebrate assemblages of pools in arid-land streams have high functional redundancy and are resistant to severe drying. Freshw. Biol. 59 (3), 491–501. doi:10.1111/fwb.12280
Bogan, M. T., Boersma, K. S., and Lytle, D. A. (2015). Resistance and resilience of invertebrate communities to seasonal and supraseasonal drought in arid-land headwater streams. Freshw. Biol. 60 (12), 2547–2558. doi:10.1111/fwb.12522
Borg Galea, A., Sadler, J. P., Hannah, D. M., Datry, T., and Dugdale, S. J. (2019). Mediterranean intermittent rivers and ephemeral streams: challenges in monitoring complexity. Ecohydrology 12 (8). doi:10.1002/eco.2149
Brock, M. A., Nielsen, D. L., Shiel, R. J., Green, J. D., and Langley, J. D. (2003). Drought and aquatic community resilience: the role of eggs and seeds in sediments of temporary wetlands. Freshw. Biol. 48 (7), 1207–1218. doi:10.1046/j.1365-2427.2003.01083.x
Capdevila, A. S. L., Kokimova, A., Ray, S. S., Avellán, T., Kim, J., and Kirschke, S. (2020). Success factors for citizen science projects in water quality monitoring. Sci. Total Environ. 728, 137843. doi:10.1016/j.scitotenv.2020.137843
Constantz, J., Stonestorm, D., Stewart, A. E., Niswonger, R., and Smith, T. R. (2001). Analysis of streambed temperatures in ephemeral channels to determine streamflow frequency and duration. Water Resour. Res. 37 (2), 317–328. doi:10.1029/2000WR900271
Cook, S., Abolfathi, S., and Gilbert, N. I. (2021). Goals and approaches in the use of citizen science for exploring plastic pollution in freshwater ecosystems: a review. Freshwater Science 40 (4), 567–579. doi:10.1086/717227
Cottet, M., Robert, A., Tronchère-Cottet, H., and Datry, T. (2023). “It’s dry, it has fewer charms!”: do perceptions and values of intermittent rivers interact with their management? Environ. Sci. Policy 139, 139–148. doi:10.1016/j.envsci.2022.10.003
Datry, T., Larned, S. T., and Tockner, K. (2014). Intermittent rivers: a challenge for freshwater ecology. BioScience 64 (3), 229–235. doi:10.1093/biosci/bit027
Datry, T., Pella, H., Leigh, C., Bonada, N., and Hugueny, B. (2016). A landscape approach to advance intermittent river ecology. Freshw. Biol. 61 (8), 1200–1213. doi:10.1111/fwb.12645
Davidson, L. J., Milewski, A. M., and Holland, S. M. (2023). Quantifying intermittent flow regimes in ungauged basins: optimization of remote sensing techniques for ephemeral channels using a flexible statistical classification. Remote Sens. 15 (24), 5672. doi:10.3390/rs15245672
Dunn, O. J. (1964). Multiple comparisons using rank sums. Technometrics 6 (3), 241–252. doi:10.1080/00401706.1964.10490181
Etter, S., Strobl, B., van Meerveld, I., and Seibert, J. (2020). Quality and timing of crowd-based water level class observations. Hydrol. Process. 34 (22), 4365–4378. doi:10.1002/hyp.13864
Field, A. P. (2015). Discovering statistics using IBM SPSS statistics: and sex and drugs and rock “n” roll. 4th edition. London: Sage.
Fovet, O., Belemtougri, A., Boithias, L., Braud, I., Charlier, J.-B., Cottet, M., et al. (2021). Intermittent rivers and ephemeral streams: perspectives for critical zone science and research on socio-ecosystems. WIREs Water 8 (4). doi:10.1002/wat2.1523
Godsey, S. E., and Kirchner, J. W. (2014). Dynamic, discontinuous stream networks: hydrologically driven variations in active drainage density, flowing channels and stream order. Hydrol. Process. 28 (23), 5791–5803. doi:10.1002/hyp.10310
Goulsbra, C. S., Lindsay, J. B., and Evans, M. G. (2009). A new approach to the application of electrical resistance sensors to measuring the onset of ephemeral streamflow in wetland environments. Water Resour. Res. 45 (9). doi:10.1029/2009WR007789
Hafen, K. C., Blasch, K. W., Rea, A., Sando, R., and Gessler, P. E. (2020). The influence of climate variability on the accuracy of NHD perennial and nonperennial stream classifications. JAWRA J. Am. Water Resour. Assoc. 56 (5), 903–916. doi:10.1111/1752-1688.12871
Haklay, M., Basiouka, S., Antoniou, V., and Ather, A. (2010). How many volunteers does it take to map an area well? The validity of linus’ law to volunteered geographic information. Cartogr. J. 47 (4), 315–322. doi:10.1179/000870410X12911304958827
Herzog, A., Stahl, K., Blauhut, V., and Weiler, M. (2022). Measuring zero water level in stream reaches: a comparison of an image-based versus a conventional method. Hydrol. Process. 36 (8). doi:10.1002/hyp.14658
Hollander, M., Wolfe, D. A., and Chicken, E. (2014). Nonparametric statistical methods. Hoboken, New Jersey: John Wiley and Sons.
Jaeger, K. L., Hafen, K. C., Dunham, J. B., Fritz, K. M., Kampf, S. K., Barnhart, T. B., et al. (2021). Beyond streamflow: call for a national data repository of streamflow presence for streams and rivers in the United States. Water 13 (12), 1627–1720. doi:10.3390/w13121627
Jaeger, K. L., and Olden, J. D. (2012). Electrical resistance sensor arrays as a means to quantify longitudinal coennectivity of rivers. River Res. Appl. 28 (10), 1843–1852. doi:10.1002/rra.1554
Jensen, C. K., McGuire, K. J., McLaughlin, D. L., and Scott, D. T. (2019). Quantifying spatiotemporal variation in headwater stream length using flow intermittency sensors. Environ. Monit. Assess. 191 (4), 226. doi:10.1007/s10661-019-7373-8
Jensen, C. K., McGuire, K. J., and Prince, P. S. (2017). Headwater stream length dynamics across four physiographic provinces of the A ppalachian H ighlands. Hydrol. Process. 31 (19), 3350–3363. doi:10.1002/hyp.11259
Kaletova, T., Rodriguez-Lozano, P., Berger, E., Filipe, A. F., Logar, I., Alves, M. H., et al. (2021). Considering temporal flow variability of non-perennial rivers in assessing ecosystem service provision. Ecosyst. Serv. 52, 101368. doi:10.1016/j.ecoser.2021.101368
Kampf, S., Strobl, B., Hammond, J., Anenberg, A., Etter, S., Martin, C., et al. (2018). Testing the waters: mobile apps for crowdsourced streamflow data. Eos 99. doi:10.1029/2018EO096355
Kaplan, N. H., Sohrt, E., Blume, T., and Weiler, M. (2019). Monitoring ephemeral, intermittent and perennial streamflow: a dataset from 182 sites in the Attert catchment, Luxembourg. Earth Syst. Sci. Data 11 (3), 1363–1374. doi:10.5194/essd-11-1363-2019
Kottek, M., Grieser, J., Beck, C., Rudolf, B., and Rubel, F. (2006). World Map of the Köppen-Geiger climate classification updated. Meteorol. Z. 15 (3), 259–263. doi:10.1127/0941-2948/2006/0130
Larned, S. T., Datry, T., Arscott, D. B., and Tockner, K. (2010). Emerging concepts in temporary-river ecology. Freshw. Biol. 55 (4), 717–738. doi:10.1111/j.1365-2427.2009.02322.x
Little, K. E., Hayashi, M., and Liang, S. (2016). Community-based groundwater monitoring network using a citizen-science approach. Ground Water 54 (3), 317–324. doi:10.1111/gwat.12336
Lowry, C. S., and Fienen, M. N. (2013). CrowdHydrology: crowdsourcing hydrologic data and engaging citizen scientists. Ground Water 51 (1), 151–156. doi:10.1111/j.1745-6584.2012.00956.x
Messager, M. L., Lehner, B., Cockburn, C., Lamouroux, N., Pella, H., Snelder, T., et al. (2021). Global prevalence of non-perennial rivers and streams. Nature 594 (7863), 391–397. doi:10.1038/s41586-021-03565-5
Mitchell, N., Triska, M., Liberatore, A., Ashcroft, L., Weatherill, R., and Longnecker, N. (2017). Benefits and challenges of incorporating citizen science into university education. PloS One 12 (11), e0186285. doi:10.1371/journal.pone.0186285
Nath, S., and Kirschke, S. (2023). Groundwater monitoring through citizen science: a review of project designs and results. Ground Water 61 (4), 481–493. doi:10.1111/gwat.13298
Njue, N., Stenfert Kroese, J., Gräf, J., Jacobs, S. R., Weeser, B., Breuer, L., et al. (2019). Citizen science in hydrological monitoring and ecosystem services management: state of the art and future prospects. Sci. Total Environ. 693, 133531. doi:10.1016/j.scitotenv.2019.07.337
Rinderer, M., Kollegger, A., Fischer, B. M. C., Stähli, M., and Seibert, J. (2012). Sensing with boots and trousers - qualitative field observations of shallow soil moisture patterns. Hydrol. Process. 26 (26), 4112–4120. doi:10.1002/hyp.9531
Rinderer, M., Komakech, H. C., Müller, D., Wiesenberg, G. L. B., and Seibert, J. (2015). Qualitative soil moisture assessment in semi-arid Africa – the role of experience and training on inter-rater reliability. Hydrology Earth Syst. Sci. 19 (8), 3505–3516. doi:10.5194/hess-19-3505-2015
Sánchez-Montoya, M. M., Schiller, D., Miñano, J., von Ruhí, A., Pechar, G. S., Proia, L., et al. (2016). Responses of ground-dwelling arthropods to surface flow drying in channels and adjacent habitats along Mediterranean streams. Ecohydrology 9 (7), 1376–1387. doi:10.1002/eco.1733
See, L. (2019). A review of citizen science and crowdsourcing in applications of pluvial flooding. Front. Earth Sci. 7. doi:10.3389/feart.2019.00044
Sefton, C. E. M., Parry, S., England, J., and Angell, G. (2019). Visualising and quantifying the variability of hydrological state in intermittent rivers. Fundam. Appl. Limnol. 193 (1), 21–38. doi:10.1127/fal/2019/1149
Seibert, J., van Meerveld, I, Etter, S., Strobl, B., Assendelft, R., and Hummer, P. (2019) Wasserdaten sammeln mit dem Smartphone – wie können Menschen messen, was hydrologische Modelle brauchen? doi:10.5675/HYWA_2019.2_1
Sekajugo, J., Kagoro-Rugunda, G., Mutyebere, R., Kabaseke, C., Namara, E., Dewitte, O., et al. (2022). Can citizen scientists provide a reliable geo-hydrological hazard inventory? An analysis of biases, sensitivity and precision for the Rwenzori Mountains, Uganda. Environ. Res. Lett. 17 (4), 045011. doi:10.1088/1748-9326/ac5bb5
Skoulikidis, N. T., Sabater, S., Datry, T., Morais, M. M., Buffagni, A., Dörflinger, G., et al. (2017). Non-perennial Mediterranean rivers in Europe: status, pressures, and challenges for research and management. Sci. Total Environ. 577, 1–18. doi:10.1016/j.scitotenv.2016.10.147
Snelder, T. H., Datry, T., Lamouroux, N., Larned, S. T., Sauquet, E., Pella, H., et al. (2013). Regionalization of patterns of flow intermittence from gauging station records. Hydrology Earth Syst. Sci. 17 (7), 2685–2699. doi:10.5194/hess-17-2685-2013
Spence, C., and Mengistu, S. (2016). Deployment of an unmanned aerial system to assist in mapping an intermittent stream. Hydrol. Process. 30 (3), 493–500. doi:10.1002/hyp.10597
Steward, A. L., Schiller, D. von, Tockner, K., Marshall, J. C., and Bunn, S. E. (2012). When the river runs dry: human and ecological values of dry riverbeds. Front. Ecol. Environ. 10 (4), 202–209. doi:10.1890/110136
Strobl, B., Etter, S., van Meerveld, I., and Seibert, J. (2020). Accuracy of crowdsourced streamflow and stream level class estimates. Hydrological Sci. J. 65 (5), 823–841. doi:10.1080/02626667.2019.1578966
Syberg, K., Palmqvist, A., Khan, F. R., Strand, J., Vollertsen, J., Clausen, L. P. W., et al. (2020). A nationwide assessment of plastic pollution in the Danish realm using citizen science. Scientific Reports 10 (1), 17773. doi:10.1038/s41598-020-74768-5
Tharwat, A. (2021). Classification assessment methods. Appl. Comput. Inf. 17 (1), 168–192. doi:10.1016/j.aci.2018.08.003
Truchy, A., Csabai, Z., Mimeau, L., Künne, A., Pernecker, B., Bertin, W., et al. (2023). Citizen scientists can help advance the science and management of intermittent rivers and ephemeral streams. BioScience 73 (7), 513–521. doi:10.1093/biosci/biad045
Turner, D. S., and Richter, H. E. (2011). Wet/dry mapping: using citizen scientists to monitor the extent of perennial surface flow in dryland regions. Environ. Manag. 47 (3), 497–505. doi:10.1007/s00267-010-9607-y
van Meerveld, H. J. I., Sauquet, E., Gallart, F., Sefton, C., Seibert, J., and Bishop, K. (2020). Aqua temporaria incognita. Hydrol. Process. 34 (26), 5704–5711. doi:10.1002/hyp.13979
Weeser, B., Stenfert Kroese, J., Jacobs, S. R., Njue, N., Kemboi, Z., Ran, A., et al. (2018). Citizen science pioneers in Kenya – a crowdsourced approach for hydrological monitoring. Sci. Total Environ. 631-632, 1590–1599. doi:10.1016/j.scitotenv.2018.03.130
Wiggins, A., Newman, G., Stevenson, R. D., and Crowston, K. (2011). “Mechanisms for data quality and validation in citizen science,” in The Seventh IEEE International Conference on e-Science: Proceedings : Stockholm, Sweden, 5-8 December 2011, 2011 IEEE Seventh International Conference on e-Science Workshops (eScienceW), Stockholm, Sweden, 12/5/2011 - 12/8/2011 (CPS, IEEE: Los Alamitos, Calif.), 14–19.
Williamson, T. N., Agouridis, C. T., Barton, C. D., Villines, J. A., and Lant, J. G. (2015). Classification of ephemeral, intermittent, and perennial stream reaches using a TOPMODEL -based approach. JAWRA J. Am. Water Resour. Assoc. 51 (6), 1739–1759. doi:10.1111/1752-1688.12352
Wohl, E. (2017). The significance of small streams. Front. Earth Sci. 11 (3), 447–456. doi:10.1007/s11707-017-0647-y
Keywords: intermittent streams, citizen science, participatory science, crowdsourcing, non-traditional data, data quality, accuracy, smartphone application
Citation: Scheller M, van Meerveld I and Seibert J (2024) How well can people observe the flow state of temporary streams?. Front. Environ. Sci. 12:1352697. doi: 10.3389/fenvs.2024.1352697
Received: 11 December 2023; Accepted: 22 January 2024;
Published: 21 February 2024.
Edited by:
James Kevin Summers, Office of Research and Development, United StatesReviewed by:
Lise Vaudor, Centre National de la Recherche Scientifique (CNRS), FranceRyan Hill, United States Environmental Protection Agency (EPA), United States
Copyright © 2024 Scheller, van Meerveld and Seibert. This is an open-access article distributed under the terms of the Creative Commons Attribution License (CC BY). The use, distribution or reproduction in other forums is permitted, provided the original author(s) and the copyright owner(s) are credited and that the original publication in this journal is cited, in accordance with accepted academic practice. No use, distribution or reproduction is permitted which does not comply with these terms.
*Correspondence: Mirjam Scheller, mirjam.scheller@uzh.ch