Soil carbon dynamics in drained prairie pothole wetlands
 Chantel J. Chizen1*
  Bobbi L. Helgason1
  Blake Weiseth1 Gurbir Singh Dhillon2
  Helen M. Baulch3,4 Jeff J. Schoenau1 Angela K. Bedard-Haughn1,4
- 1Department of Soil Science, University of Saskatchewan, Saskatoon, SK, Canada
- 2Farming Smarter Association, Lethbridge County, AB, Canada
- 3School of Environment and Sustainability, University of Saskatchewan, Saskatoon, SK, Canada
- 4Global Institute for Water Security, University of Saskatchewan, Saskatoon, SK, Canada
Drainage leads to trade-offs between crop production efficiency and wetland conservation, with complex impacts on ecosystem services. In North America’s Prairie Pothole Region, wetland drainage is widespread, often to increase the available land for cultivation, prevent crop loss due to flooding, and manage soil salinity. Wetlands are known for providing key ecosystem services such as improved water quality, flood mitigation, and carbon storage. There is limited research on how changes to soil hydrology and soil redistribution through wetland drainage can impact soil carbon storage and persistence in this region. This research evaluates factors that contribute to soil carbon storage in drained prairie pothole wetland based on 33 drained wetlands in Saskatchewan, Canada. These analyses showed regional differences in the response of soil carbon storage to drainage that are driven by environmental factors such as annual precipitation, temperature, and wetland permanence. We observed increasing soil carbon storage from the Dark Brown to Black soil zones, as well as with longer wetland pond permanence. The sampling depth used for calculating soil carbon storage was especially important when comparing geographically across the soil zones as the Black soil zone had greater soil carbon stored at depth. Soil carbon was also intensively monitored over 2 years following installation of surface drainage across a wetland complex (8 drained wetlands) where water was partially directed to a consolidation wetland. We further assessed changes in soil carbon dynamics and protection from microbial decomposition based on three soil organic matter fractions, ATR-FTIR for organic matter functional groups, and phospholipid fatty acid analysis to understand the microbial community abundance and structure. After 2 years following drainage, ephemeral wetlands with short pond permanence were found to be most sensitive to drainage and the only wetland class with decreases in soil carbon. The temporary and seasonal wetland classes showed no significant differences in soil carbon content but there were changes in the organic matter with depth due to soil redistribution during drainage implementation. Jointly, this research provides region-specific estimates of soil carbon storage in drained prairie pothole wetlands that can be used to inform wetland soil carbon management in cultivated fields.
1 Introduction
Wetland drainage is a prevalent management practice for agricultural land-users, especially annual crop producers, to increase the area of arable land and production efficiency (Bedard-Haughn, 2009; Cortus et al., 2011). This practice is especially common in the Prairie Pothole Region which extends through the Canadian Prairies and the upper mid-west United States (Figure 1). The Prairie Pothole Region is characterized by a hummocky landscape with depressional, mineral wetlands that are commonly known as prairie potholes or sloughs. The saturated soil conditions and nutrient-rich soil in wetlands can act as a buffer during times of drought as they can help sustain water resources across a landscape and provide productive conditions for crops. However, these wetlands reduce acres available for cropping and impact the area available for seeding in the spring due to flooding or saturated soil conditions (Bedard-Haughn, 2009). Additionally, these wetlands are important habitats for migratory birds, but can harbor weeds, pests, and diseases that may negatively impact adjacent crops (Bedard-Haughn, 2009). Wetlands are often drained to improve crop establishment and accessibility for farm machinery by reducing the amount of time the soil is saturated after snowmelt in the spring. Drainage is also utilized to manage groundwater depth and thereby manage soil salinity risk due to shallow water tables.
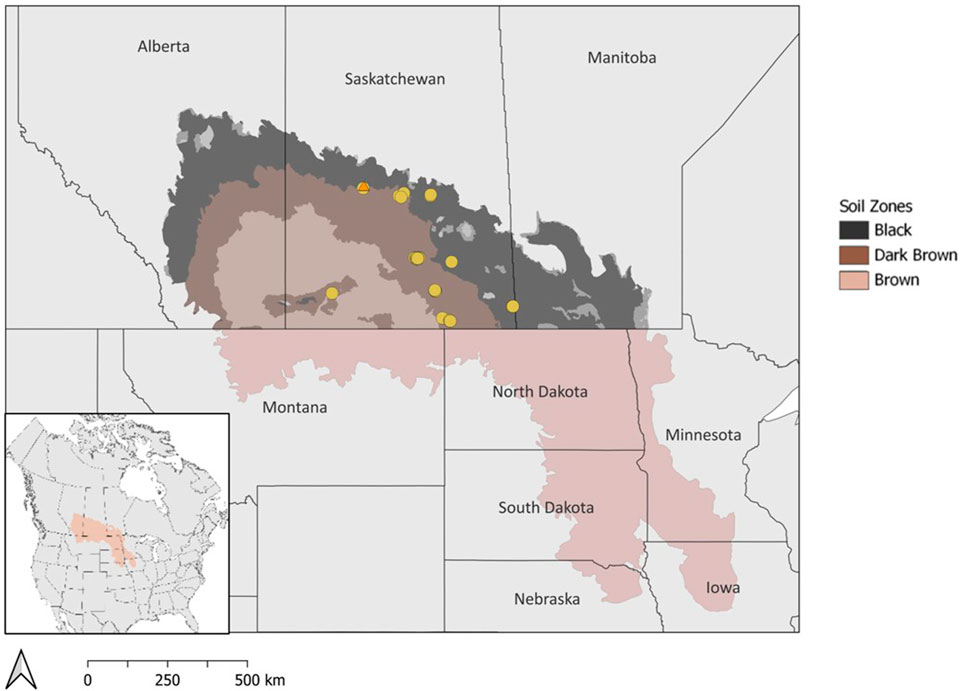
FIGURE 1. Map of the Prairie Pothole Region in North America with soil zones in Canada. Drained wetlands that were surveyed for soil carbon estimates are indicated by circles. The wetland drainage complex at Discovery Farm in Langham, SK is marked by an orange triangle.
The drained prairie pothole wetland area in the Canadian Prairies is challenging to estimate due to limited historical records and varying adoption of drainage across geographical locations (Baulch et al., 2021). Through aerial imagery and datasets, previous studies have reported that 40%–70% of wetlands in Canada have been lost due to drainage (Mitsch and Gosselink, 2000; Watmough and Schmoll, 2007). Estimates for the US suggest that up to 90% of prairie pothole wetland area was historically drained (Dahl, 1990; Dahl, 2010). There are distinct temperate and moisture gradients across the Prairie Pothole Region with warm, semi-arid conditions in the southwest to cool, sub-humid conditions in the northeast. The soil zones in the Canadian prairies reflect a climate gradient of semi-arid to sub-humid conditions with average precipitation ranging from 275–325 mm, 325–375 mm, and 400–475 mm in the Brown, Dark Brown, and Black soil zones, respectively (Willms et al., 2011). The differences in precipitation among the soil zones are known to influence plant productivity and soil carbon storage, yet the majority of studies have focused on upland areas rather than wetland depressions (Landi and Memut, 2007; Nelson et al., 2008). Areas with greater precipitation, such as the Dark Brown and Black soil zones in Canada, or poor soil drainage generally have higher occurrences of wetland drainage.
There are two main wetland classification systems that are relevant to the Prairie Pothole Region. The Stewart and Kantrud (1971) system and Millar (1976) system both categorize wetlands into classes based on vegetation patterns and pond permanence, which is also referred to as the duration of saturated soil conditions or hydroperiod. While the Millar (1976) system incorporates greater detail of the biotic and abiotic wetland features, the broader classes in the Stewart and Kantrud (1971) system can be advantageous when a more generalized series of wetland classes is required, and was therefore used in this study. The Stewart and Kantrud (1971) system is comprised of 5 wetland classes that are named in accordance with pond permanence (Class 1—ephemeral, Class 2—temporary, Class 3—seasonal, Class 4—semi-permanent, and Class 5—permanent). Each of these wetland classes contain within-wetland zones that reflect differences in vegetation and the pond permanence. In cultivated landscapes, the wetland vegetation may not always be present, and classification may require more reliance on the hydroperiod. For instance, ephemeral wetlands feature a low prairie zone with a hydroperiod of less than 1 month after spring snowmelt (Montgomery et al., 2018). In contrast, temporary wetlands feature low prairie and wet meadow zones, and can have a hydroperiod of 1–2 months (Montgomery et al., 2018). The majority of wetlands that are drained belong to the ephemeral, temporary, and seasonal wetland permanence classes because they have a shorter hydroperiod or duration of saturated soil conditions which makes them more efficient to convert to crop production compared to semi-permanent and permanent wetlands (Stewart and Kantrud, 1971; Miller et al., 2009).
The implementation of wetland drainage does not necessarily prevent water ponding in depressions but aims to reduce the annual hydroperiod (Huang et al., 2023). There are various wetland drainage methods including surface drainage, consolidation drainage, and tile drainage. Surface drainage is most common in the Canadian Prairies as ditches, channels, and infill are used to prevent water accumulation in the depression. Consolidation can be implemented with surface drainage through the redirection of water from smaller wetlands to a larger one, referred to as a consolidation wetland. In the context of consolidation wetlands, the water inputs from the drained wetlands leads to increases in pond depth, basin area, and pond permanence as well as greater risk for sediment transport into the consolidation wetland (McCauley et al., 2015). Drainage ultimately alters the wetland hydrology and soil redox conditions which in turn affects soil organic matter decomposition rates. Drained wetland soils are less likely to undergo extended periods of saturation so greater amounts of oxygen in the soil facilitate aerobic decomposition by microorganisms as measured by soil respiration rates (Tangen et al., 2015; Zhu et al., 2023). Longer hydroperiods in consolidation wetlands can continue to support lower decomposition rates due to anaerobic conditions (Badiou et al., 2011; Bansal et al., 2016). We would also expect to see microbial community structure and abundance shifts in the consolidation wetland as dry periods become less frequent and the wetland edge becomes saturated more consistently (Zhang et al., 2022; Zhu et al., 2023). The long-term accumulation of soil organic matter will theoretically be lower following drainage, compared to when the wetland was undrained. Consequently, drainage also influences the net greenhouse gas (GHG) emissions as the aerobic conditions support carbon mineralization and carbon dioxide production while anaerobic conditions can favor methanogenesis. However, it is important to acknowledge that drained wetlands still have functions that follow from their history as wetlands, so they will inherently have higher soil carbon storage potential than upland soils that have never undergone regular, prolonged saturated conditions.
Assessing the effect of management on soil carbon storage can be further supported by determining the persistence of carbon within the soil environment (Dynarski et al., 2020). Soil organic carbon persistence can be evaluated through soil organic matter fractionation into water-extractable, particulate, and mineral-associated pools that reflect the accessibility of the organic matter for microbial decomposition as well as mineral surface interactions (Lavalee et al., 2020). The carbon associated with these pools can be inferred as having a fast or slow turnover time as the carbon flows through the soil carbon cycle. The microbially-mediated flow of carbon within the soil is dynamic, and the rate of turnover is one factor that contributes to the stabilization of organic matter over time (Dynarski et al., 2020). Water-extractable organic matter (WEOM) and particulate organic matter (POM) are considered to have fast turnover times and be relatively unstable as they are more readily consumed and transformed by soil microorganisms. Mineral-associated organic matter (MAOM) is described as having a slow turnover rate and as a stable carbon pool since it has been microbially processed and is less readily available for further microbial decomposition. Soil organic matter can also be characterized through attenuated total reflectance Fourier transform infrared (ATR-FTIR) spectroscopy methods that can identify key spectral bands associated with organic matter functional groups. These functional groups can provide generally indications whether the organic matter is plant-derived from fresh residues or microbially-derived through decomposition processes (Dhillon et al., 2017). The majority of soil organic matter persistence research has focused on upland soils under agriculture or forest land-uses with a limited number of wetland specific studies, especially in the Prairie Pothole Region Poeplau et al., 2018; Cotrufo et al., 2019; Haddix et al., 2020).
There is a growing demand for region-specific data for soil carbon storage and greenhouse gas emissions to inform environmental carbon management and policy. The IPCC (2014) established carbon stock estimates for intact and drained wetland soils under cultivated and restored management; however, reference values were based on 16 studies worldwide, only 4 of which were conducted in the Prairie Pothole Region (IPCC, 2014). Furthermore, the majority of studies have focused on measuring soil carbon in only the upper 30 cm of the soil profile, which can considerably underestimate soil carbon storage especially in wetlands because of deep plant roots, the downward translocation of dissolved organic matter, bioturbation, and buried soil horizons (Harrison et al., 2011; Rumpel and Kögel-Knabner, 2011; Konschuh, 2013). To more adequately understand processes of soil carbon storage and the effects of land use change, research suggests considering soil carbon sampling to a depth of 1 m, when possible (Olson and Al-Kaisi, 2015; FAO, 2020). Specific to the Prairie Pothole Region, Euliss et al. (2006) estimated that wetland drainage and subsequent cultivation results in an average loss of 10.1 Mg C ha−1. Other studies have investigated the effect of time since drainage on carbon storage as well as subsequent land management effects on soil carbon in drained wetlands (Brown et al., 2017; Bansal et al., 2021; Huang et al., 2023). This research has provided a foundational understanding of the potential influence drainage has on organic carbon storage for the Prairie Pothole Region. Yet there is still considerable soil carbon variability observed across wetland drainage studies and the drivers of these differences are not adequately understood. Key drivers of variation in organic carbon storage in response to drainage may include the climate regime, wetland class, sampling depth, and soil carbon stability. The response of soil carbon to land use change can also be assessed by investigating soil organic matter fractions or functional groups that have inherently different turnover rates and susceptibility for loss (Lehmann and Kleber, 2015; Poeplau et al., 2018).
The objective of this research is to 1) investigate environmental factors that may influence soil carbon storage of drained wetlands in the Dark Brown and Black soil zones of Saskatchewan’s Prairie Pothole Region, and 2) evaluate the short-term response of soil carbon to surface drainage across a wetland complex, including a consolidation wetland, over 2 years following the drainage implementation.
2 Materials and methods
2.1 Drained wetland survey sites and sampling design
The estimation of soil carbon storage in drained wetlands was conducted based on measurements from 33 drained wetlands that were surveyed across Saskatchewan, Canada (Figure 1; Table 1). At each wetland, soil samples were collected along a 3-point partial transect from the wetland centre to the edge. The sampling positions within the wetland were determined through satellite imagery and field observations. One of the 33 wetlands was sampled more intensively with three, 3-point transects for a total of 9 sampling points in the wetland. Two soil cores were collected to a 1 m depth, at each transect sampling point. The first core was divided into four depth increments (0–15, 15–30, 30–60, and 60–100 cm) and stored at 4°C for laboratory analysis of soil carbon, nitrogen, pH, and electrical conductivity. The second core was used for soil classification. The parent material, soil drainage class, and soil texture at each wetland were determined using the Saskatchewan Soil Information System (University of Saskatchewan, 2020). Crop history was obtained from the Canadian Annual Crop Inventory (AAFC, 2013).
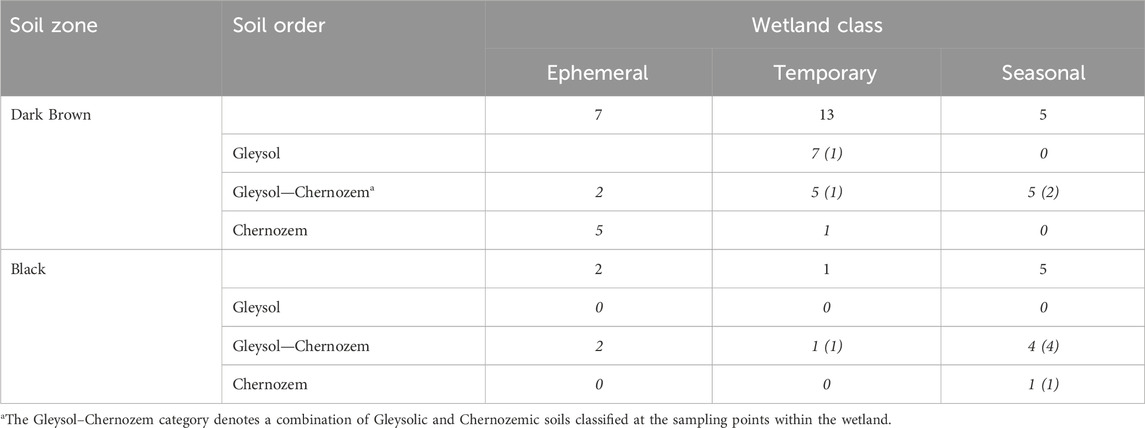
TABLE 1. The distribution of drained wetlands sampled for each wetland class and soil zone in Saskatchewan. Numbers in italics show the number of sites for a given soil order within a soil zone based on the Canadian System of Soil Classification. Numbers in brackets are the number of wetlands with buried A horizons.
Wetland class was determined based on existing records, when available. Some sites did not have wetland permanence data, so the wetland class was assigned based on average hydroperiod duration calculated using Sentinel-2 satellite imagery from 2016–2022 that was accessed with the “rgee” package (version 1.1.7) and Google Earth Engine (Gorelick et al., 2017).
2.2 Wetland drainage complex site and sampling design
To further understand drainage-related effects on soil carbon, we monitored a wetland complex over a multiyear period following drainage at Discovery Farm Langham, approximately 40 km northwest of Saskatoon, Saskatchewan (Figure 1). At this site, eight wetlands were drained in October 2020 across a wetland drainage complex (Figure 2). The water from three of the drained wetlands was partially re-directed to a consolidation wetland through a series of drainage ditches. The study site is situated in the Dark Brown soil zone, and the Major River Valley watershed class because its proximity to the North Saskatchewan River (Wolfe et al., 2019). The climate is semi-arid with a mean annual precipitation of 393 mm and the sampling years coincided with a period of drought commonly experienced in the Prairie Pothole Region’s multiyear cycles of drought-deluge (Government of Canada, 2020). The area has Elstow-Bradwell soils that correspond to Orthic Dark Brown Chernozems and Eluviated Dark Brown Chernozems with fluviolacustrine and lacustrine parent materials (University of Saskatchewan, 2020).
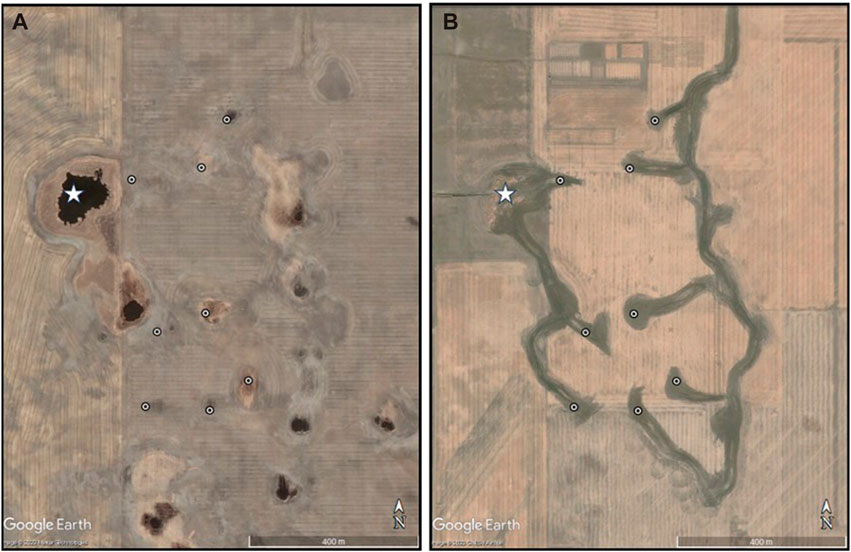
FIGURE 2. The wetland drainage complex at Discovery Farm in Langham, SK in (A) May 2014, and (B) October 2020. Wetland drainage ditches are observed in panel B as drainage was implemented in early October 2020. Drained wetlands are indicated by circles and the consolidation wetland is shown with a star. Imagery retrieved from Google Earth Pro, Google Earth Engine, Maxar Technologies, and CNES/Airbus.
Samples were taken from the wetland drainage complex for 3 consecutive years following harvest in the fall of 2020 (immediately following drainage installation), fall of 2021, and fall of 2022. We focus on the first and final year because the intermediate year (2021) showed few differences. The drained wetlands were sampled using a 6-point transect through each wetland from edge to edge, and the consolidation wetland was sampled with a 12-point transect. This sampling design allowed for measurements along the gradient of landscape positions through the wetland depressions. Soil samples were collected at each sampling point, using the same methods described for the wetland survey. Water extractable organic matter samples were collected at all sampling points in the wetland drainage complex and stored at −20°C for analysis. A third soil core was taken at each sampling point from 0–15 cm and 15–30 cm depths within the wetland complex for phospholipid fatty acid (PLFA) analysis. The PLFA sampling cores were sterilized with 70% ethanol between sampling points and soils were packaged in sterile Nasco Whirl-Pak™ bags. These soil samples were stored at −20°C, freeze-dried, and finely ground using an ethanol-flame-sterilized mortar and pestle.
2.3 Sample processing and laboratory methods
2.3.1 Soil bulk density, pH, and electrical conductivity.
Bulk density and gravimetric moisture content was determined on field-moist soil samples. Gravels larger than 2 mm were removed from the sample, weighed, and subtracted for the bulk density calculation. Soil samples were air-dried and ground to 2 mm, then analyzed for pH and electrical conductivity using a 1:2 soil: water ratio (Hendershot et al., 2007; Miller and Curtin, 2007).
2.3.2 Soil carbon and nitrogen
A sub-sample of the soil was finely ground using a ball mill grinder for carbon and nitrogen analysis. Total soil carbon was determined through dry combustion at 1,350°C using a LECO C632 (LECO Corporation, St. Joseph, MI, United States) (Skjemstad and Baldock, 2007). Soil organic carbon was measured using the same analyzer, but carbonates were removed through HCl treatment prior to analysis (Harris et al., 2001). Total nitrogen was analyzed with a LECO TruMac CNS analyzer (LECO Corporation, St. Joseph, MI, United States) (Skjemstad and Baldock, 2007) at 1,250°C. For quality assurance and quality control purposes, 5% of carbon and nitrogen samples were analyzed as duplicates. Additionally, 200 carbon samples were re-analyzed for total, inorganic, and organic carbon, using an Elementar soli TOC® cube (Elementar Analysensysteme GmbH, Hanau, Germany) to verify results. Soil organic carbon was calculated on an equivalent mass basis to 0–30, 0–60, and 0–100 cm at each sampling point to account for differences in bulk density between wetlands and landscape positions (Ellert and Bettany, 1995; Wendt and Hauser, 2013).
2.3.3 Wetland carbon storage and sequestration
Soil organic carbon values from sampling points within a wetland were converted to wetland carbon storage values using Eq. 1:
where wetland OC is the soil organic carbon (Mg ha−1) for an individual wetland, sp is the wetland zone (deep marsh, shallow marsh, wet meadow, low prairie), OCsp is the soil organic carbon (Mg ha−1) at a given wetland zone, propsp is the proportion of the wetland zone for a particular wetland class (Table 2), and A is the wetland area (ha).
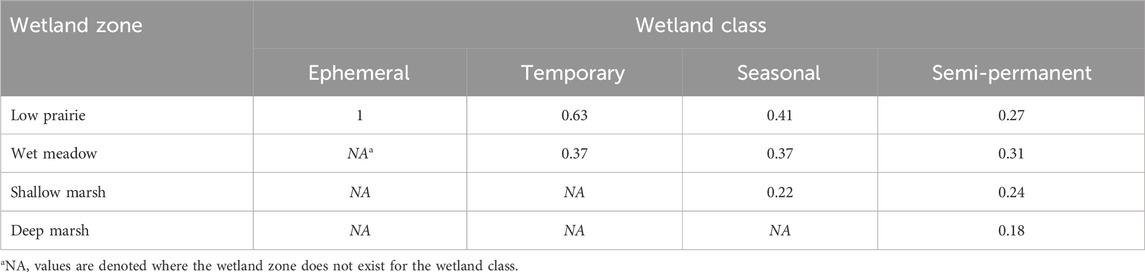
TABLE 2. Estimated proportion of the area covered by a wetland zone for a particular Stewart and Kantrud (1971) wetland class based on data from Tangen and Bansal (2019).
This method, and the assumption of wetland zone proportions, were used rather than averaging all sampling points within the wetland to avoid misrepresenting the soil organic carbon content across the wetland positions. Data available from Tangen and Bansal (2019) was used to estimate the proportion of area covered by each wetland zone within a particular wetland class. The wet meadow, shallow marsh, and deep marsh wetland zones were determined using QGIS Desktop 3.22.16 (QGIS Development Team, 2021) and wetland polygon shapefiles supplied by Water Security Agency or retrieved from the Canadian Wetland Inventory. The low prairie wetland class and some sampled wetlands were not found in either database so ground observations and Sentinel-2 satellite imagery from 2016–2022 accessed through Google Earth Engine were used to delineate the wetland boundaries. Annual soil carbon sequestration rates were calculated for wetland classes and across the entire wetland drainage complex.
2.3.4 Soil organic matter characterization through fractionation and ATR-FTIR
Physical fractionation based on particle size was used to obtain POM and MAOM. Soil was dispersed with sodium hexametaphosphate for 16 h before being passed through a 53 μm sieve (Gregorich et al., 1998). The organic matter and sand that remains on the sieve is the POM, while the MAOM is the sample that passes through the sieve (Cotrufo et al., 2019). The POM and MAOM were dried at 60°C and weighed, then analyzed for organic carbon by dry combustion. Water extractable organic matter was chemically fractionated using a 1:2 soil:solution ratio with 5 mM CaCl2 (Chantigny et al., 2007). The slurry was passed through vacuum filtration system with a 0.45 μm polycarbonate filter and the extract was stored at −20°C until analysis. The WEOM extracts were analyzed for dissolved carbon and dissolved nitrogen by automatic combustion using a TOC-VCPN analyzer (Shimadzu Scientific Instruments, Kyoto, Japan) (Chantigny et al., 2007; Qualls, 2013).
Attenuated total reflectance Fourier transform infrared spectroscopy was used to characterize the organic matter chemical functional groups for all the soil samples collected at the wetland drainage complex (Dhillon et al., 2017). Spectral data for ball mill ground soils were collected using a Bruker Optics Equinox 55 FTIR spectrometer (Bruker Optik GmbH, Ettlingen, Germany) with an N2(l)-cooled MCT detector over the spectral range of 4,000 to 400 cm−1. Data was baseline corrected with ambient air as the background and normalized through area normalization using OPUS spectral processing software (Bruker Optik GmbH, Ettlingen, Germany). Spectral deconvolution was completed by fitting Gaussian curves using the Fityk software package version 1.2.1 (Wojdyr, 2010). Soil samples with interference due to high carbonate content were removed from the analysis for the 1,418 and 1,504 bands (Tatzber et al., 2007a).
The wavelengths of interest for the organic matter characterization were between 1,800 and 900 cm−1 and peaks were grouped based on existing research (Table 3). The ATR-FTIR bands between 1,000–900 cm−1 are associated with mineral components of the soil (Haberhauer et al., 2000). Additionally, bands near 1,050 cm−1 may overlap with the clay mineral components in the soil (Haberhauer et al., 2000). The relative absorbance intensity was calculated for each soil sample and ATR-FTIR band by dividing the area of a given band by the sum of the area of all the bands in the 1800–900 cm−1 region for that sample (Dhillon et al., 2017).
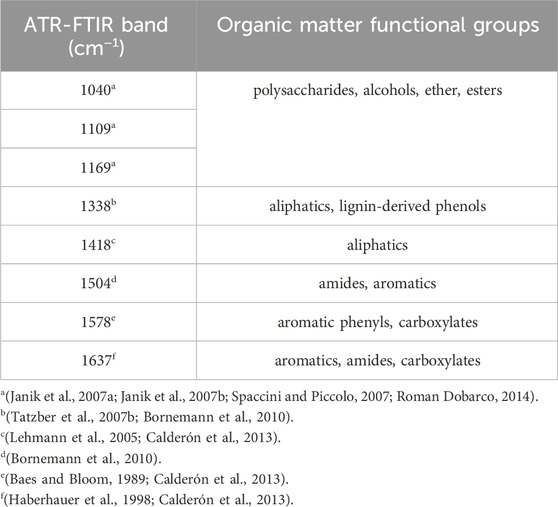
TABLE 3. Summary of ATR-FTIR bands that represent organic matter functional groups.
2.3.5 Microbial community structure
Phospholipid fatty acid analysis was used to evaluate changes in the soil microbial biomass and community structure in the consolidation wetland from the wetland drainage complex. Soil samples were extracted based on an adapted version of the high-throughput method by Ellis and Ritz (2018). Bligh-Dyer extractant solution (K2HPO4:methanol:chloroform) was used to complete a double extraction of the soil samples followed by lipid separation using methanol:chloroform:H2O reagent (5:5:1 v/v/v) and HyperSepTM solid phase extraction (SPE) columns (Thermo Scientific, United States), then methylation. One duplicate sample was added for every 10 samples. The samples were analyzed using a Bruker Scion 436 GC-FID fitted with an Agilent Ultra-2 column and Labconco Centrivap with a 105°C cold trap. Peaks were identified using a Kovats Retention Index of 130 FAMEs relative to retention times of external reference standard (C10:0-C20:0 peaks of MIDI 1300-C standard). The PLFA was assigned to biomarker associations based on existing literature (Table 4).
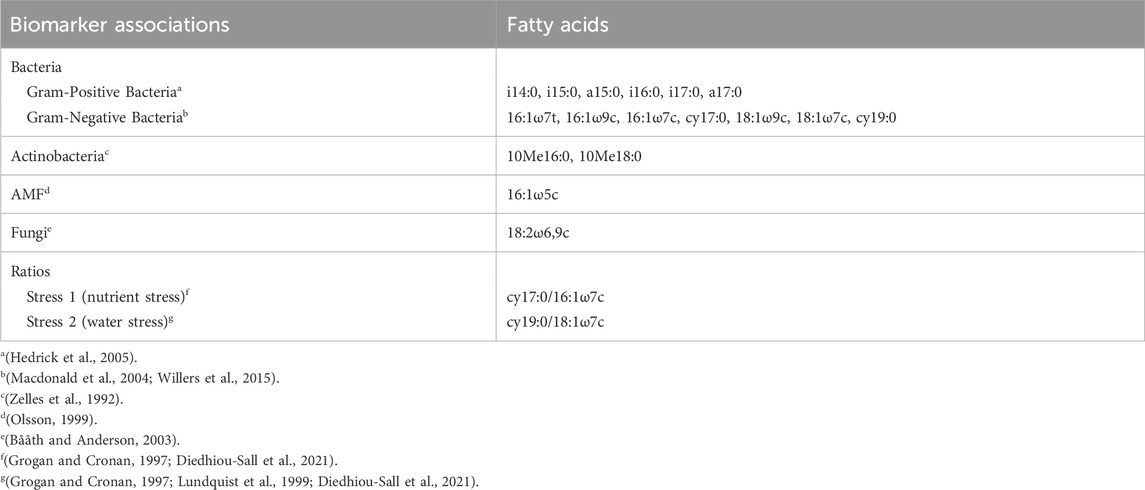
TABLE 4. Summary of phospholipid fatty acids (PLFAs) and the biomarker associations used for microbial community analysis.
Total PLFA was calculated in units of nmol g−1 soil and nmol g−1 organic carbon. Group totals for the biomarker associations were calculated in units of nmol g−1 soil and mol% of total PLFA.
2.4 Statistical analysis
The soil carbon storage in drained wetlands sampled across Saskatchewan was analyzed to determine if there were differences between soil zones and wetland classes. A linear mixed-effects model was conducted through the “lme4” package (version 1.1–35.1), with soil zone and wetland class as fixed effects, and the individual wetland as a random effect. Data was checked and transformed as needed to meet the assumptions of the model. Significant interactions between the fixed effects were assessed using an ANOVA and interpreted with “lmerTest” (version 3.1–3) and when applicable, post hoc comparisons were conducted using “emmeans” (version 1.8.9).
Across the wetland drainage complex, differences in soil properties from 2020 to 2022 were evaluated with a linear mixed-effects model with sampling year and wetland zone as fixed effects, and sampling points as a random effect to account for the repeated measures data structure. Data analysis and interpretation included the use of ANOVA and post hoc comparisons. The statistical analyses for the soil depth increments and the consolidation and drained wetlands were conducted separately. Soil carbon sequestration across wetland classes was evaluated with a linear mixed-effects model, with wetland class as a fixed effect, and the individual wetland as a random effect to account for the repeated measures data structure. The soil carbon and PLFA mol% data with the environmental variables were additionally analyzed through non-metric multidimensional scaling (NMDS) with Bray-Curtis dissimilarities using the “vegan” package (version 2.6–4). The mol% PLFA groups and ATR-FTIR relative absorbance values were transformed using sqrt (x + 1) to account for the compositional nature of the data. All statistical analyses and visualizations were completed in R (version 4.3.1) (R Core Team, 2023).
3 Results
3.1 Survey of soil carbon storage in drained prairie pothole wetlands
Soil carbon storage in drained wetlands varied significantly with soil zone and wetland class. The drained wetlands in the Black soil zone had higher soil carbon storage values than the Dark Brown soil zone (Table 5). For the 0–30 cm depth increment, soil carbon was at least 1.2-times greater in the Black soil zone drained wetlands compared to those in the Dark Brown soil zone. The extent of soil carbon storage difference between the soil zones was further explained by the wetland class. The drained ephemeral wetlands had significantly lower soil carbon storage values than the other wetland classes, in both soil zones. The soil carbon storage in the temporary and seasonal wetlands were not statistically different from each other. Across the soil depths of 0–30 cm, 0–60 cm and 0–100 cm, soil carbon storage increased as the sampling depth increased, yet the degree of this increase differed with the soil zone and wetland class. Within the Dark Brown soil zone, the seasonal wetlands had 2.9-times and 2.4-times more soil carbon than the ephemeral wetlands, based on the 0–30 cm and 0–100 cm sampling depths, respectively. In contrast, the seasonal wetlands in the Black soil zone 2.9-times and 3.6-times more soil carbon than the ephemeral wetlands for the 0–30 cm and 0–100 cm sampling depths, respectively.
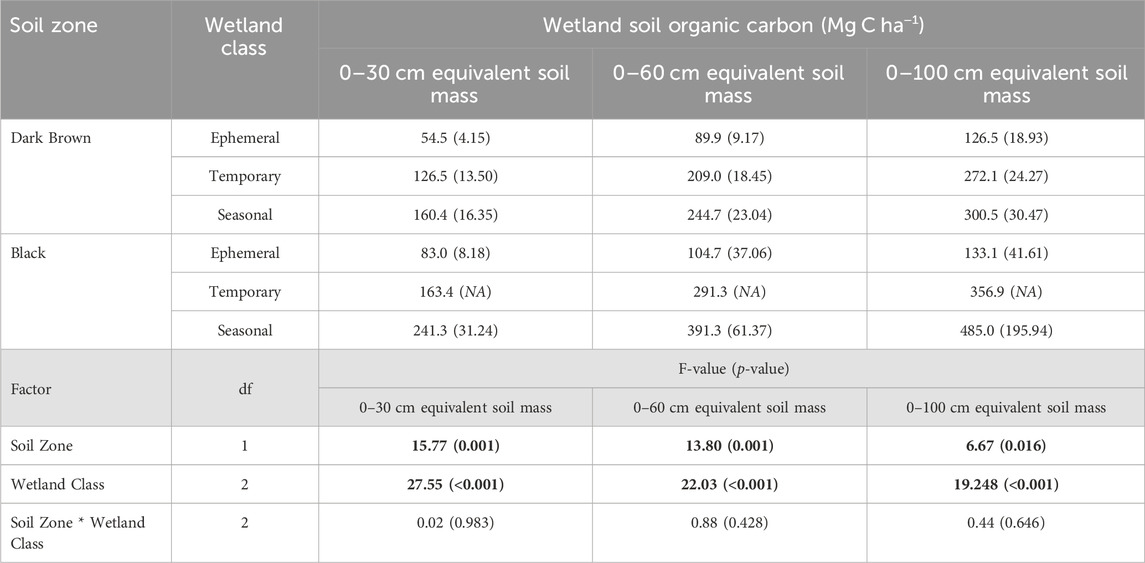
TABLE 5. Mean soil organic carbon storage from the survey of drained wetlands compared between the Dark Brown and Black soil zones, and among wetland classes (α = 0.05). Standard error is included in brackets. Bold values indicate a significant effect of the factor on wetland soil carbon.
3.2 Short-term soil carbon storage dynamics following experimental drainage of a wetland complex
There were no significant differences in soil carbon content at specific within-wetland zones (i.e., deep marsh and wet meadow) or depth increments in the drained wetlands at Discovery Farm after 2 years following drainage implementation (Supplementary Figure S1). There was a significant increase in soil carbon storage for the consolidation wetland in the deep marsh zone for the 0–15 cm depth increment.
The annual soil organic carbon sequestration rates calculated over the 2 years following drainage implementation were negative for ephemeral wetlands across all soil sampling depths, corresponding to a loss of organic carbon after the draining of these wetlands (Table 6). The temporary, seasonal, and consolidation (semi-permanent) wetlands had positive sequestration rates, indicating increases in soil organic carbon storage from 2020 to 2022. With the 0–60 cm and 0–100 cm depths, variability in the soil carbon sequestration rates was highest in the ephemeral wetlands and decreased with longer hydroperiods of the temporary and seasonal wetlands. Across the entire wetland complex, soil organic carbon sequestration was positive for all depths, but was less than 1 Mg C ha−1 yr−1 for the 0–100 cm depth. Rates of soil organic carbon sequestration were influenced by the soil sampling depth as the 0–100 cm depth increment often had the lowest rate, except for the temporary wetland class.
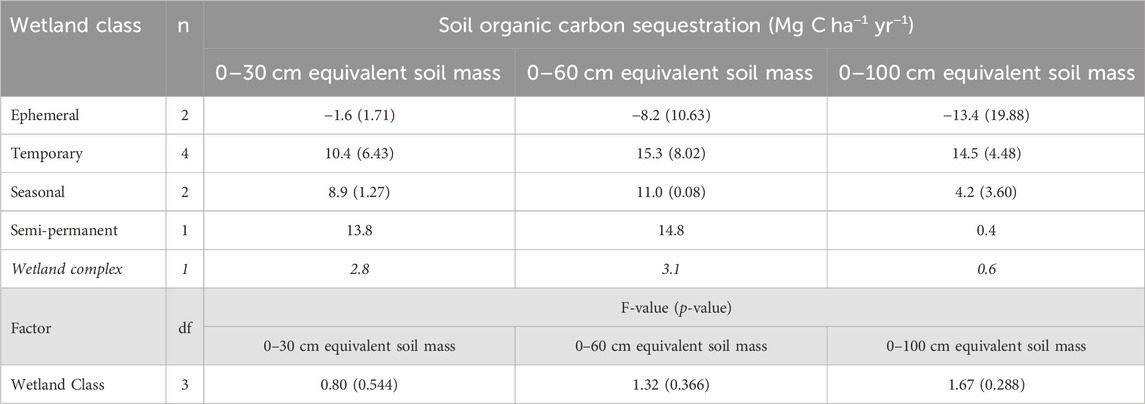
TABLE 6. Annual soil organic carbon sequestration rates for the drained and consolidation wetlands, as well as across the experimental wetland drainage complex at Discovery Farm (α = 0.05). Standard error is included in brackets. Italicized values indicate the value across the wetland complex.
3.3 Soil organic matter fractionation and functional groups in the wetland drainage complex
The water extractable carbon and nitrogen associated with WEOM were significantly influenced by sampling year, but not wetland zone (Figure 3). In the consolidation wetland, water extractable carbon decreased from 2020 to 2022 across all depth increments (Figure 3A). The drained wetlands followed a similar trend but there was no difference between sampling years at 60–100 cm. The water extractable nitrogen also significantly decreased with sampling year for the consolidation wetland for all the depths increments (Figure 3B). In contrast, the water extractable nitrogen significantly increased for the drained wetland, except at 60–100 cm.
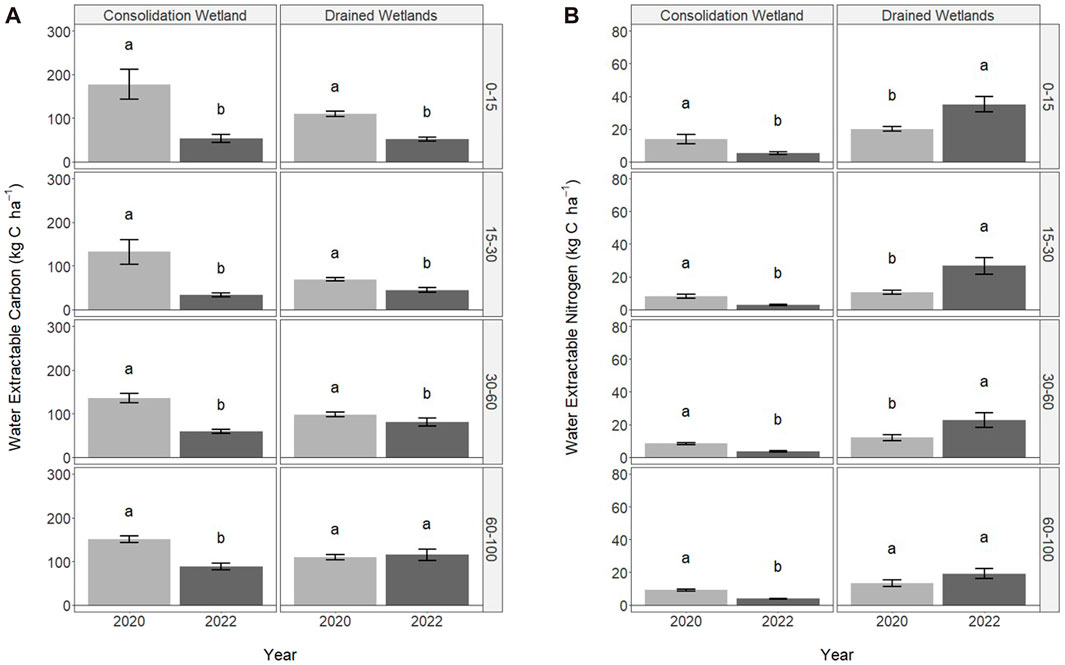
FIGURE 3. Water extractable carbon (A) and nitrogen (B) in 2020 (immediately following drainage installation) and 2022 for the consolidation and drained wetlands at Discovery Farm across four depth increments (cm). Letters signify statistically significant differences between sampling years (a = 0.05). The letters cannot be compared between consolidation and drained wetlands, or the depth increments.
The organic carbon within the soil organic matter fractions was only measured in the consolidation wetland and did not significantly differ with sampling year or wetland zone (Figure 4). Overall, POM was highest near the soil surface and decreased with depth. In the deep marsh and wet meadow zones there were increases in POM from 2020 to 2022 at the 0–15 cm depth, while it decreased during this time in the low prairie zone. Mineral-associated organic matter was similar across all depth increments. There were some lower MAOM values in the 15–30 cm depth increment, especially for the wet meadow position.
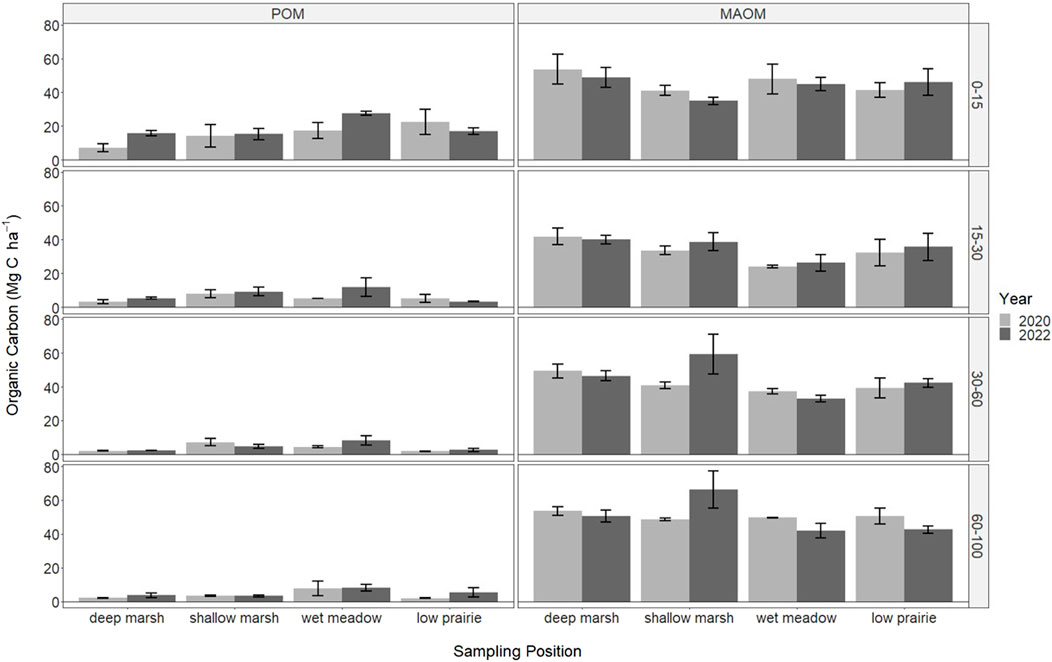
FIGURE 4. The soil organic carbon stored in particulate organic matter (POM) and mineral-associated organic matter (MAOM) in 2020 (immediately following drainage installation) and 2022 for the consolidation wetland at Discovery Farm across four depth increments (cm). There were no significant differences with sampling year or wetland zones (a = 0.05).
The soil organic matter functional group composition significantly changed from 2020 to 2022 for some of the organic matter chemical functional groups associated with the relative intensity of ATR-FTIR spectral bands (Figure 5). The ANOVA output is provided in the Supplementary Material. There were no significant differences in chemical functional groups associated with less microbially decomposed organic matter for the consolidation wetland (Figure 5A). In the drained wetland, band 1,041 cm−1 significantly increased for all depth increments while band 1,100 cm−1 significantly increased as well at 60–100 cm. The chemical functional groups showed a significant decrease in the 1,339 cm−1 band (for the consolidation wetland at 15–30 cm (Figure 5B). The consolidation wetland also had a significant increase in band 1,637 cm−1 at 30–60 and 60–100 cm. In the drained wetlands there was a decrease in band 1,504 cm−1 at 30–60 cm, while bands 1,418, 1,579, and 1,637 cm−1 increased in the upper soil depth increments. There were no significant changes in the 60–100 cm increment for the drained wetlands.
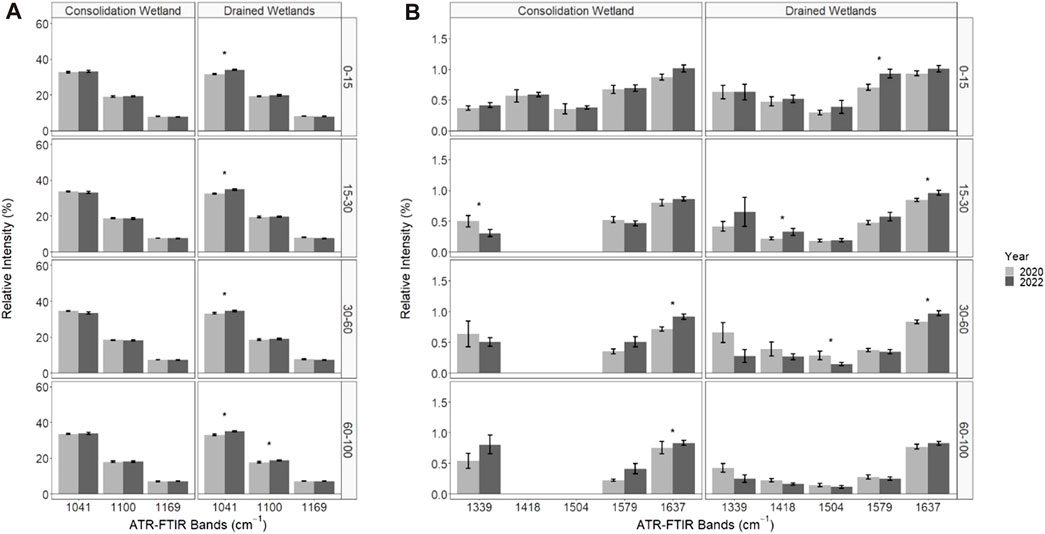
FIGURE 5. The relative intensity of attenuated total reflectance Fourier transform infrared (ATR-FTIR) spectral bands associated with organic matter functional group characterizations in the consolidation and drained wetlands at Discovery Farm. The difference in spectral bands that represent less microbially processed forms of organic matter (A) and more microbially processed forms of organic matter (B) across four depth increments (cm). An asterisk (*) indicates significant differences between the sampling years (a = 0.05). Some data was removed from the 1,418 and 1,504 cm−1 bands for analysis due to spectral interference (see methods).
Through NMDS we observed that the soil organic carbon was most closely related with MAOM and the 1,040 cm−1 ATR-FTIR spectral band (Figure 6). Each of the organic matter fractions (MAOM, POM, and WEOM) had opposing directionalities in the NMDS plot (Figure 6). The POM and the 1,578 cm−1 ATR-FTIR spectral band corresponded with one another. The carbon and nitrogen from the WEOM were concordant with the electrical conductivity and pH as well as the ATR-FTIR spectral bands of 917 and 988 cm−1. There were no strong groupings of the observations with wetland zone or depth, while there was a weak group illustrated between sampling years (Figure 6).
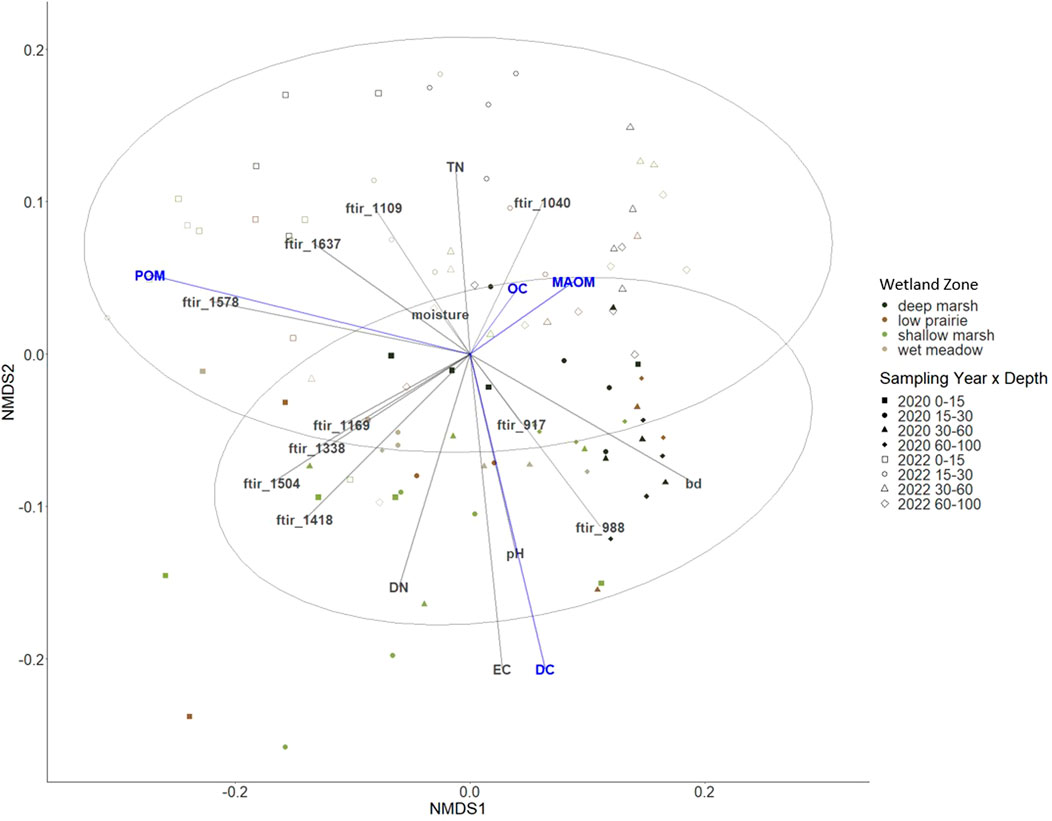
FIGURE 6. Non-metric multidimensional scaling (NMDS) ordination to investigate patterns in soil organic carbon and measured components shown in blue; particulate organic matter (POM), mineral-associated organic matter (MAOM), and water extractable carbon (DC). Environmental variables in grey include bulk density (BD), pH, electrical conductivity (EC), total nitrogen (TN), water extractable nitrogen (DN), and ATR-FTIR bands (stress 0.048).
3.4 Microbial community structure
The total PLFA (nmol g−1 soil) for the consolidation wetland ranged from 34.11 to 46.02 nmol g−1 soil for the 0–15 cm depth increment and 12.82–29.89 nmol g−1 soil for the 15–30 cm depth increment. There were no significant differences in total PLFA, bacteria PLFA abundance, actinomycetes, or arbuscular mycorrhizal fungi biomarkers with sampling year or wetland zone (Supplementary Material). Total PLFA, normalized on a per g organic carbon basis did not have any significant differences but there were some trends observed in 2020 with average total PLFA (nmol g-1 OC) at 0–15 cm being highest in the deep marsh position at centre of the consolidation wetland then decreasing towards the low prairie zone near the wetland edge (Figure 7A). In 2022, the total PLFA (nmol g−1 OC) was relatively more consistent across wetland zones at 0–15 cm as it decreased among the deep marsh, shallow marsh, and wet meadow, and increased in the low prairie. There were no clear trends in the total PLFA (nmol g−1 OC) at 15–30 cm.
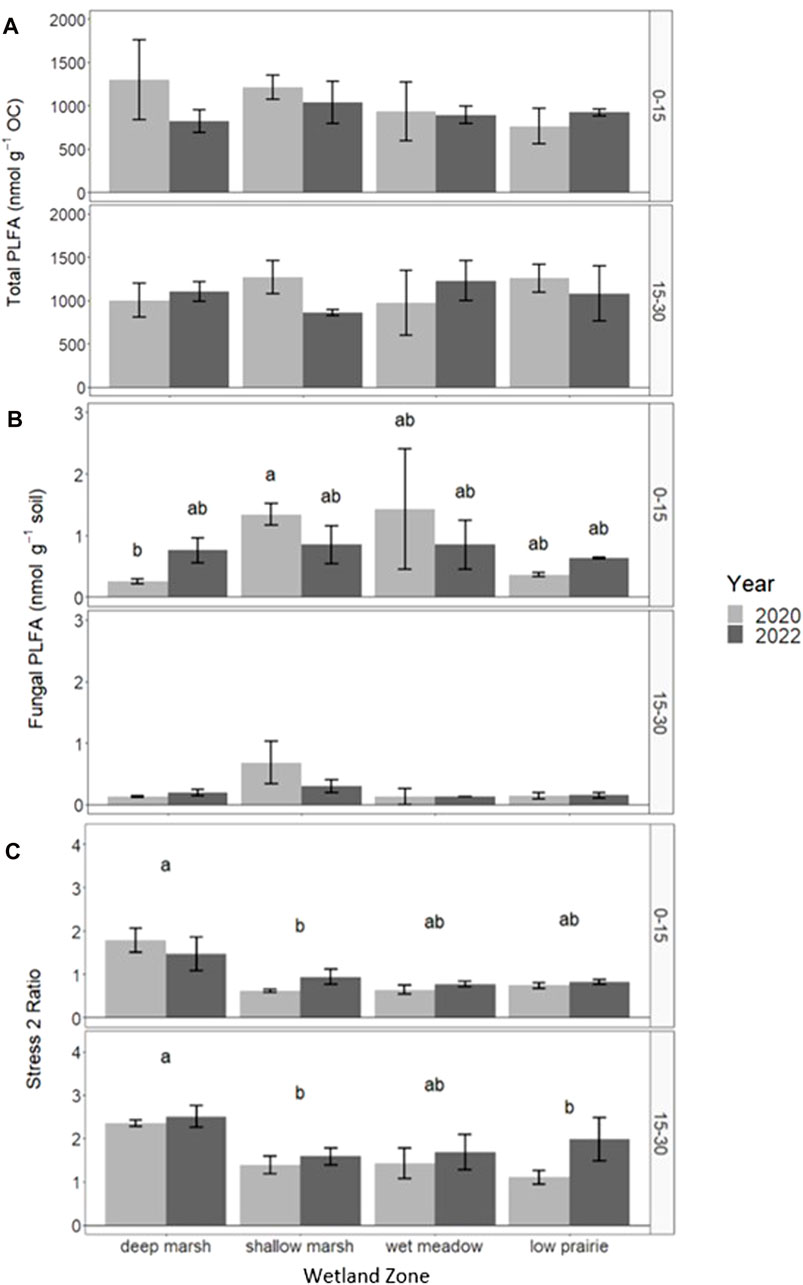
FIGURE 7. Response of total PLFA (nmol g-1 C) (A), fungal PLFA (nmol g−1 soil) (B), and stress 2 ratio (C) in the consolidation wetland at two depth increments (cm) following drainage Unplementafion in 2020 as well as comparisons across wetland zone. Letters signify statistically significant differences between sampling years or landscape position (a = 0.05). The letters cannot be compared between depth increments.
There were significant differences in fungal PLFA abundance (nmol g−1 soil) in the 0–15 cm depth increment for the consolidation wetland with year and zone having an interactive effect on the fungal community (Figure 7B). In 2020, the fungal PLFA abundance was low in the deep marsh zone, increased in the shallow marsh and wet meadow, before decreasing again in the low prairie position. In 2022, the fungal PLFA abundance no longer showed differences with wetland zone, as it become consistent across the consolidation wetland. There were no significant differences in fungal PLFA abundance at the 15–30 cm depth increment.
The tress 2 ratio was significantly highest in the deep marsh zone for both 0–15 and 15–30 cm in the consolidation wetland (Figure 7C). The other wetland zones did not significantly differ from one another. Sampling year did not have a significant effect on stress ratio 2 at 0–15 cm but at 15–30 cm 2022 was significantly higher than 2020. The ratio of stress 1 to stress 2 significantly differed with wetland zone at 0–15 cm with the ratio lowest in the deep marsh and similar across the other positions. Year and wetland zone had a significant interaction for the ratio of stress 1 to stress 2 at 15–30 cm. The ratio was highest towards the wetland edge in the wet meadow and low prairie positions and these areas decreased from 2020 to 2022.
4 Discussion
4.1 Climate and wetland characteristics control soil carbon storage in drained wetlands
The soil carbon stored in drained wetlands was influenced by both the climate variables associated with the soil zones and by wetland permanence class. The Dark Brown and Black soil zones reflect differing temperature and moisture conditions that control the rate of organic matter decomposition. These factors are key in the formation of these soils, allowing for more organic matter to accumulate in the Black soil zone relative to the Dark Brown soil zone. The further contribution of wetland class to soil organic carbon storage was apparent. The Stewart and Kantrud (1971) wetland classification system is driven by vegetation and hydroperiods which are known as key factors that can affect soil carbon storage. As wetlands are drained, the hydroperiod is shortened or becomes less consistent, and the saturated soil conditions that allowed for the accumulation of carbon through slower decomposition rates are affected. Here, we observed carbon sequestration in the soils of drained wetlands that had formed under longer hydroperiods, and consequently longer periods of soil saturation (Table 5). In contrast, ephemeral wetlands with shorter hydroperiods were more sensitive to drainage and showed losses of soil carbon over the 2 years since drainage. This finding is consistent with research by Bansal et al. (2021) that found wetland class was key for explaining variability in wetland soil carbon storage. The gradient of wetland hydroperiod from ephemeral to seasonal classes is also related to plant productivity and organic matter inputs to soils, as the type of vegetation in the wetland (such as annual crops, grassland, or natural wetland vegetation) can further contribute to variability in carbon storage (Gleason et al., 2008; Badiou et al., 2011; Bansal et al., 2021).
4.2 Short-term temporal changes soil carbon storage following drainage
In the 2 years following drainage implementation we did not observe any significant changes in the carbon storage in the drained or consolidation wetlands at Discovery Farm. The effect of time since wetland drainage on soil properties in the Prairie Pothole Region has been investigated by Brown et al. (2017). They found that soil organic carbon at 0–15 cm was similar among undrained wetlands and wetlands that had been drained recently (7–15 years ago) or in the medium-term (20–34 years ago) (Brown et al., 2017). The wetlands that have been drained for the longest period of time (36–50 years) had similar soil organic carbon concentrations to the mid-slope landscape position which is likely attributed to the effect of soil redistribution (Brown et al., 2017). Other studies found similar results with drained, cultivated, and restored wetlands having similar soil carbon storage (Bansal et al., 2021). An explanation for some of the similarity between these managed wetlands, could be related to the effectiveness of wetland drainage implementation and the type of drainage used (Huang et al., 2023).
The changes in soil carbon storage that we observed in the consolidation wetland were likely due to the plant biomass management in the wetland. In the summer of 2022, the wetland vegetation for the consolidation wetland was mowed and plant residues were left on the soil surface. The land management practices following drainage are likely the most important factors influencing how soil carbon storage changes, rather than just drainage itself. The implementation of drainage often improves water infiltration, allowing for increased movement of carbon through the soil profile. Additionally, drainage and cultivation practices result in the spatial displacement of soil across the wetland depression, allowing for carbon transportation, burial, and storage at greater depths (Bedard-Haughn et al., 2006; Brown et al., 2017). Drainage-associated changes can also be important across a wetland complex. For example, the work of (Zhang et al., 2017) illustrates that surface drainage ditches are important to carbon and nutrient dynamics for a drained wetland complex, with increased carbon content in the ditch-slope.
4.3 Short term response of soil carbon stability and microbial community structure to drainage
The soil organic carbon was closely related to MAOM because in these mineral wetland soils most of the carbon is stored in this more persistent carbon pool, especially at greater depths. These mineral wetland soils contrast findings from coastal wetlands that have a greater proportion of soil carbon stored as POM due to much greater plant biomass inputs and coarser soil textures (Mirabito and Chambers, 2023). Soil organic carbon associated with the MAOM fraction is more protected from losses relative to POM because of contrasting degrees of microbial accessibility (Cotrufo et al., 2019). The nature of MAOM’s protection from further microbial decomposition is likely why we did not see any major, short-term changes in soil carbon storage in the consolidation wetland. The changes in organic matter in regard to microbial accessibility can be an indicator of drainage and land management, beyond organic matter turnover rates (Lehmann and Kleber, 2015). The changes in WEOM are very sensitive to environmental conditions at the time of sampling, but this organic matter fraction is an important component of microbial decomposition processes and a strong indicator of soil respiration (Chantigny, 2003; Haney et al., 2012). Our observed decreases in water extractable carbon across the wetland complex are either associated with lower levels of microbial activity or higher microbial consumption, especially in the consolidation wetland where there was less disturbance due to drainage implementation. The WEOM has a fast turnover rate and if consumed by microorganisms, some of the water extractable organic carbon is oxidized and lost through microbial respiration while the remainder is incorporated into microbial biomass (Dynarski et al., 2020). The increase in water extractable nitrogen in the drained basins is probably associated with direct additions of nitrogen fertilizer to crops grown in the basins following drainage. The trends observed in POM across wetland zones of the consolidation wetland are likely driven by plant biomass input and quality for microbial decomposition. The differences in MAOM could reflect textural differences across the consolidation wetland or within the soil profile at a particular sampling point These findings associated the POM and MAOM in the consolidation wetland align with key organic matter protection concepts presented by Haddix et al. (2020) and Lavallee et al. (2020). Monitoring changes soil carbon storage and stability based on organic matter fractions for the drained wetland complex is limited because of the short time period and the various environmental factors that could have also influenced the changes, especially in WEOM.
The utilization of ATR-FTIR spectroscopy provided further insight into the organic matter characterization and stability for the drained and consolidation wetlands. There were more changes to organic matter chemical functional groups in the drained wetlands, compared to the consolidation wetland (Figure 5). The surface drainage involved the redistribution of soil across the wetland drained basins, which would have exposed organic matter to aerobic conditions and disrupted soil structure, promoting the decomposition of certain forms of organic matter. Organic matter that is less stable because it is more accessible for microbial consumption would have been most readily affected. The MAOM is a more stable pool of carbon and the association with the 1,040 cm−1 ATR-FTIR spectral band could be explained by microbial transformations that result in the synthesis of organic compounds containing functional groups represented within this spectral band (i.e., alcohols, ethers, and esters) (Janik et al., 2007a; Janik et al., 2007b; Spaccini and Piccolo, 2007; Roman Dobarco, 2014). The 1,578 cm−1 spectral band is likely reflecting organic matter functional groups associated with lignin that corresponds to the POM pool of carbon (Calderón et al., 2011). The association between WEOM, pH, electrical conductivity, and the 917 and 988 cm−1 spectral bands which represent quartz and clay minerals, is logical as these soil properties all influence the adsorption or release of WEOM with soil colloids (Haberhauer et al., 2000; Singh et al., 2016; Dynarski et al., 2020). Our observations of the organic matter pools and functional groups demonstrate the key role of soil microorganisms in carbon stability.
The microbial abundance (total PLFA) of the consolidation wetland was overall lower than observed in other wetland research and we hypothesize this is associated with low soil moisture conditions as the study took place during a period of drought (Balasooriya et al., 2008; Konschuh, 2013). Fungal PLFA abundance was correlated with community structure in surface soils which is typical for this region (Figure 7) (Helgason et al., 2009). We observed that the fungal PLFA abundance associated with chemical functional groups that represented four protected forms of organic matter, specifically 1,637, 1,418, 1,504, as well as 1,040 (Figure 8). Soil pH, electrical conductivity, and water extractable carbon were factors that could have influenced the differences observed in fungal PLFA abundance based on the NMDS plot (Figure 8) In other wetland drainage research, soil organic matter, electrical conductivity, pH, and clay content were factors that helped explain differences in soil fungal community structure (Zhao et al., 2022). The stress of decreased soil moisture or fluctuating soil moisture conditions on the microbial community (Stress 2) was observed in the deep marsh zone of the consolidation wetland which aligns with similar spatial variability found in other studies (Figure 7) (Lundquist et al., 1999; Diedhiou-Sall et al., 2021). The shallow marsh, wet meadow, and low prairie zones experience more frequent fluctuations in soil moisture and the soil microbial communities in these zones are likely more adapted to these variable conditions (Lundquist et al., 1999). The Stress 2 differences with wetland zone could explain the decreased water extractable carbon in the consolidation wetland as the soil microbial community is less active under stress resulting in a decrease in organic matter decomposition rates. Importantly, collecting the PLFA samples for this research in the fall (when the consolidation wetland was dry) may limit our insights into soil microbial community structure and abundance, which could be enhanced via further work to understand changes through seasons and under saturated soil conditions. Similarly, resampling the wetland complex during a period of deluge or through a multiyear drought-deluge cycle would further our understanding of soil carbon dynamics in drained wetlands.
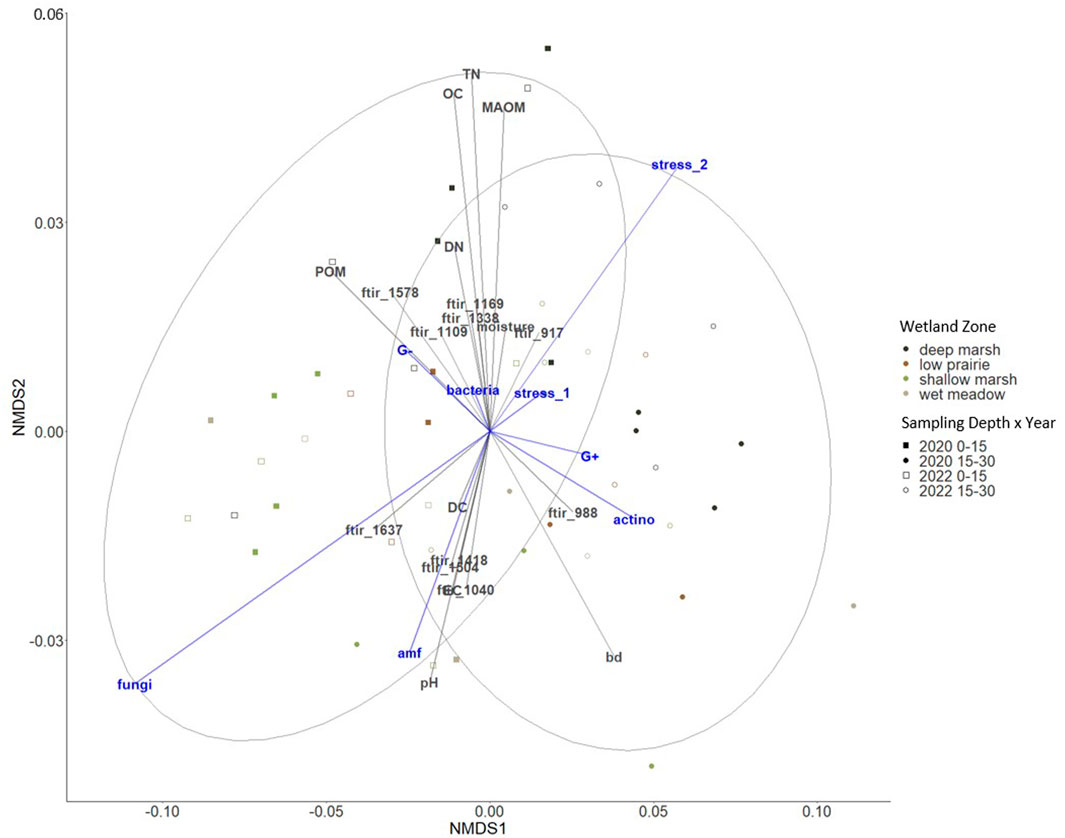
FIGURE 8. Non-metric multidimensional scaling (NMDS) ordination to investigate patterns in microbial communities and the stress ratios shown in blue. Environmental variables in grey include bulk density (BD), pH, electrical conductivity (EC), organic carbon (OC), particulate organic matter (POM), mineral-associated organic matter (MAOM), total nitrogen (TN), and water extractable carbon (DC), water extractable nitrogen (DN), and ATR-FTIR bands (stress 0.059).
4.4 Sampling depth is critical for evaluating soil carbon storage changes following drainage
At both the regional- and field-scale, the interpretation of how drainage affects soil carbon storage depends on the soil sampling depth (Table 5; Table 6). The majority of studies report soil carbon storage values based on the upper 30 cm of the soil (Bedard-Haughn et al., 2006; Euliss et al., 2006; Badiou et al., 2011; Tangen and Bansal, 2019; Bansal et al., 2021). However, regional comparisons of soil carbon storage with surface carbon storage assume that the soils all have a similar distribution of carbon storage through the soil profile. While this is generally true for most upland soils, depressional wetlands can feature buried horizons below 0–30 cm that can have greater proportions of soil carbon than the soil horizon above it (Table 1) (Konschuh, 2013). The soils across an area with a climate gradient, such as occurs in the Prairie Pothole Region, will have soils with proportionately deeper A horizons in the wet, cooler locations relative to the dry, warm areas because of slower decomposition rates and higher rates of organic matter inputs. We observed that in areas where we have greater rates of carbon storage, such as the Black soil zone, the deeper sampling depths of 0–60 cm and 0–100 cm accounted for soil carbon stored in these deep A horizons and the sub-surface buried A horizons (Table 5). There is a growing awareness of sampling deeper than 30 cm for the purpose of soil carbon storage accounting across landscapes to more accurately report the carbon sequestered throughout the soil profile (VandenBygaart et al., 2011; FAO, 2020; von Haden et al., 2020).
5 Conclusion
Wetland management in cropping systems is a fundamental component of agricultural production in the Prairie Pothole Region with important benefits and tradeoffs. The diverse wetlands of the region show differing levels of soil carbon storage, and their rates of carbon sequestration can vary in response to drainage. The soil sampling depth is crucial for effectively evaluating soil carbon storage in prairie pothole wetlands and to observe differences across the region or in wetland complexes. Ephemeral wetlands have the lowest soil carbon storage relative to other wetland classes, yet they were the most sensitive wetland class to short-term drainage since they were the only class that had a net loss of carbon storage in the wetland complex. The spatially extensive wetland survey emphasized that the differences in soil carbon for drained wetlands is primarily explained by environmental factors such as climate and wetland hydroperiod. The land management following drainage is key to further understanding how wetland carbon storage may change with time. As demonstrated in the short-term study, the assessment of organic matter protection through fractions, functional groups, and microbial community structure and abundance can provide insights into how soil carbon cycling may be altered in drained wetlands. The soil carbon data from this study will help establish regional stock change factors for wetland soil carbon storage estimates across the Prairie Pothole Region.
Data availability statement
The raw data supporting the conclusion of this article will be made available by the authors, without undue reservation.
Author contributions
CC: Conceptualization, Formal Analysis, Investigation, Methodology, Project administration, Visualization, Writing–original draft, Writing–review and editing. BH: Formal Analysis, Methodology, Resources, Writing–review and editing. BW: Methodology, Resources, Writing–review and editing. GD: Formal Analysis, Methodology, Resources, Writing–review and editing. HB: Conceptualization, Writing–review and editing. JS: Conceptualization, Writing–review and editing. AB-H: Conceptualization, Funding acquisition, Supervision, Writing–review and editing.
Funding
The author(s) declare financial support was received for the research, authorship, and/or publication of this article. This work was supported by funding from NSERC Alliance in partnership with Saskatchewan Water Security Agency (ALLRP 566551-2021) as well as the Saskatchewan Agriculture Development Fund with co-funding from the Saskatchewan Wheat Development Commission (project: 20210795).
Acknowledgments
We acknowledge that this research was conducted on the territories of Treaties 2, 4, and 6. This land is the traditional territory of Nêhiyawak, Nahkawininiwak, Niitsitapi, and Očhéthi Šakówiŋ peoples, and the Homeland of the Métis. We appreciate the support from Etienne Shupena-Soulodre and Dave MacDonald from Water Security Agency for their help finding wetland locations for sampling and accessing spatial wetland data. Thank you to the landowners who allowed us to sample wetlands on their property. This work would not have been possible without the field and laboratory assistance from Paul Krug, Matthew Robertson, Isaac Haughn, Breanna Barrett, Jourdyn Sammons, and many others.
Conflict of interest
The authors declare that the research was conducted in the absence of any commercial or financial relationships that could be construed as a potential conflict of interest.
Publisher’s note
All claims expressed in this article are solely those of the authors and do not necessarily represent those of their affiliated organizations, or those of the publisher, the editors and the reviewers. Any product that may be evaluated in this article, or claim that may be made by its manufacturer, is not guaranteed or endorsed by the publisher.
Supplementary material
The Supplementary Material for this article can be found online at: https://www.frontiersin.org/articles/10.3389/fenvs.2024.1353802/full#supplementary-material
References
AAFC (2013). Annual crop inventory. Available at: open.canada.ca/data/en/dataset/ba2645d5-4458-414d-b196-6303ac06c1c9.
Bååth, E., and Anderson, T. H. (2003). Comparison of soil fungal/bacterial ratios in a pH gradient using physiological and PLFA-based techniques. Soil Biol. Biochem. 35, 955–963. doi:10.1016/S0038-0717(03)00154-8
Badiou, P., McDougal, R., Pennock, D., and Clark, B. (2011). Greenhouse gas emissions and carbon sequestration potential in restored wetlands of the Canadian prairie pothole region. Wetl. Ecol. Manage 19, 237–256. doi:10.1007/s11273-011-9214-6
Baes, A. U., and Bloom, P. R. (1989). Diffuse reflectance and transmission Fourier transform infrared (DRIFT) spectroscopy of humic and fulvic acids. Soil Sci. Soc. Am. J. 53, 695–700. doi:10.2136/sssaj1989.03615995005300030008x
Balasooriya, W. K., Denef, K., Peters, J., Verhoest, N. E. C., and Boeckx, P. (2008). Vegetation composition and soil microbial community structural changes along a wetland hydrological gradient. Hydrology Earth Syst. Sci. 12, 277–291. doi:10.5194/hess-12-277-2008
Bansal, S., Tangen, B., and Finocchiaro, R. (2016). Temperature and hydrology affect methane emissions from prairie pothole wetlands. Wetlands 36, 371–381. doi:10.1007/s13157-016-0826-8
Bansal, S., Tangen, B. A., Gleason, R. A., Badiou, P., and Creed, I. F. (2021). “Land management strategies influence soil organic carbon stocks of prairie potholes of North America,” in Geophysical monograph series. Editors K. W. Krauss, Z. Zhu, and C. L. Stagg (Wiley), 273–285. doi:10.1002/9781119639305.ch14
Baulch, H., Whitfield, C., Wolfe, J., Basu, N., Bedard-Haughn, A., Belcher, K., et al. (2021). Synthesis of science: findings on Canadian Prairie wetland drainage. Can. Water Resour. J./Revue Can. des ressources hydriques 46, 229–241. doi:10.1080/07011784.2021.1973911
Bedard-Haughn, A. K. (2009). Managing excess water in Canadian prairie soils: a review. Can. J. Soil. Sci. 89, 157–168. doi:10.4141/CJSS07071
Bedard-Haughn, A. K., Jongbloed, F., Akkerman, J., Uijl, A., de Jong, E., Yates, T., et al. (2006). The effects of erosional and management history on soil organic carbon stores in ephemeral wetlands of hummocky agricultural landscapes. Geoderma 135, 296–306. doi:10.1016/j.geoderma.2006.01.004
Bornemann, L., Welp, G., and Amelung, W. (2010). Particulate organic matter at the field scale: rapid acquisition using mid-infrared spectroscopy. Soil Sci. Soc. Am. J. 74, 1147–1156. doi:10.2136/sssaj2009.0195
Brown, R., Zhang, Z., Comeau, L.-P., and Bedard-Haughn, A. (2017). Effects of drainage duration on mineral wetland soils in a Prairie Pothole agroecosystem. Soil Tillage Res. 168, 187–197. doi:10.1016/j.still.2016.12.015
Calderón, F., Haddix, M., Conant, R., Magrini-Bair, K., and Paul, E. (2013). Diffuse-reflectance fourier-transform mid-infrared spectroscopy as a method of characterizing changes in soil organic matter. Soil Sci. Soc. Am. J. 77, 1591–1600. doi:10.2136/sssaj2013.04.0131
Calderón, F. J., Reeves, J. B., Collins, H. P., and Paul, E. A. (2011). Chemical differences in soil organic matter fractions determined by diffuse-reflectance mid-infrared spectroscopy. Soil Sci. Soc. Am. J. 75 (2), 568–579. doi:10.2136/sssaj2009.0375
Chantigny, M. H. (2003). Dissolved and water-extractable organic matter in soils: a review on the influence of land use and management practices. Geoderma 113, 357–380. doi:10.1016/S0016-7061(02)00370-1
Chantigny, M. H., Angers, D. A., Kaiser, K., and Kalbitz, K. (2007). “Extraction and characterization of dissolved organic matter,” in Soil sampling and methods of analysis. Editors M. R. Carter, and E. G. Gregorich (Boca Raton, FL: CRC Press).
Cortus, B. G., Jeffrey, S. R., Unterschultz, J. R., and Boxall, P. C. (2011). The economics of wetland drainage and retention in saskatchewan. Can. J. Agric. Economics/Revue Can. d’agroeconomie 59, 109–126. doi:10.1111/j.1744-7976.2010.01193.x
Cotrufo, M. F., Ranalli, M. G., Haddix, M. L., Six, J., and Lugato, E. (2019). Soil carbon storage informed by particulate and mineral-associated organic matter. Nat. Geosci. 12, 989–994. doi:10.1038/s41561-019-0484-6
Dahl, T. E. (1990). Wetland loss in the United States 1780’s to 1980’s. Washington, DC: US Department of the Interior, Fish and Wildlife Service.
Dahl, T. E. (2010). Status and trends of wetlands in the conterminous United States 2004 to 2009. Washington, DC: US Department of the Interior, Fish and Wildlife Service.
Dhillon, G. S., Gillespie, A., Peak, D., and Van Rees, K. C. J. (2017). Spectroscopic investigation of soil organic matter composition for shelterbelt agroforestry systems. Geoderma 298, 1–13. doi:10.1016/j.geoderma.2017.03.016
Diedhiou-Sall, S., Assigbetsee, K. B., Badiane, A. N., Diedhiou, I., Khouma, M., and Dick, R. P. (2021). Spatial and temporal distribution of soil microbial properties in two shrub intercrop systems of the sahel. Front. Sustain. Food Syst. 5, 621689. doi:10.3389/fsufs.2021.621689
Dynarski, K. A., Bossio, D. A., and Scow, K. M. (2020). Dynamic stability of soil carbon: reassessing the “permanence” of soil carbon sequestration. Front. Environ. Sci. 8. doi:10.3389/fenvs.2020.514701
Ellert, B. H., and Bettany, J. R. (1995). Calculation of organic matter and nutrients stored in soils under contrasting management regimes. Can. J. Soil Sci. 75 (4), 529–538. doi:10.4141/cjss95-075
Ellis, S., and Ritz, K. (2018). A modified high-throughput analysis of PLFAs in soil. MethodsX 5, 1491–1497. doi:10.1016/j.mex.2018.10.022
Euliss, N. H., Gleason, R. A., Olness, A., McDougal, R. L., Murkin, H. R., Robarts, R. D., et al. (2006). North American prairie wetlands are important nonforested land-based carbon storage sites. Sci. Total Environ. 361, 179–188. doi:10.1016/j.scitotenv.2005.06.007
FAO (2020). A protocol for measurement, monitoring, reporting and verification of soil organic carbon in agricultural landscapes. Rome: FAO. doi:10.4060/cb0509en
Gleason, R. A., Laubhan, M., and Euliss, N. H. (2008). Ecosystem services derived from wetland conservation practices in the United States prairie pothole region with an emphasis on the U.S. Department of agriculture conservation reserve and wetlands reserve programs. U.S. Geological Survey.
Gorelick, N., Hancher, M., Dixon, M., Ilyushchenko, S., Thau, D., and Moore, R. (2017). Google Earth engine: planetary-scale geospatial analysis for everyone. Remote Sens. Environ. 202, 18–27. doi:10.1016/j.rse.2017.06.031
Government of Canada, (2020). Canadian climate normals 1981-2010 station data. Available at: https://climate.weather.gc.ca/climate_normals.
Gregorich, E. G., Greer, K. J., Anderson, D. W., and Liang, B. C. (1998). Carbon distribution and losses: erosion and deposition effects. Soil Tillage Res. 47, 291–302. doi:10.1016/S0167-1987(98)00117-2
Grogan, D. W., and Cronan, J. E. (1997). Cyclopropane ring formation in membrane lipids of bacteria. Microbiol. Mol. Biol. Rev. 61, 429–441. doi:10.1128/mmbr.61.4.429-441.1997
Haberhauer, G., Feigl, B., Gerzabek, M., and Cerri, C. (2000). FT-IR spectroscopy of organic matter in tropical soils: changes induced through deforestation. Appl. Spectrosc. 54 (2), 221–224. doi:10.1366/0003702001949131
Haberhauer, G., Rafferty, B., Strebl, F., and Gerzabek, M. H. (1998). Comparison of the composition of forest soil litter derived from three different sites at various decompositional stages using FTIR spectroscopy. Geoderma 83, 331–342. doi:10.1016/S0016-7061(98)00008-1
Haddix, M. L., Gregorich, E. G., Helgason, B. L., Janzen, H., Ellert, B. H., and Francesca Cotrufo, M. (2020). Climate, carbon content, and soil texture control the independent formation and persistence of particulate and mineral-associated organic matter in soil. Geoderma 363, 114160. doi:10.1016/j.geoderma.2019.114160
Haney, R. L., Franzluebbers, A. J., Jin, V. L., Johnson, M.-V., Haney, E. B., White, M. J., et al. (2012). Soil organic C:N vs. Water-extractable organic C:N. Open J. Soil Sci. 2, 269–274. doi:10.4236/ojss.2012.23032
Harris, D., Horwáth, W. R., and Van Kessel, C. (2001). Acid fumigation of soils to remove carbonates prior to total organic carbon or carbon-13 isotopic analysis. Soil Sci. Soc. Am. J. 65 (6), 1853–1856. doi:10.2136/sssaj2001.1853
Harrison, R. B., Footen, P. W., and Strahm, B. D. (2011). Deep soil horizons: contribution and importance to soil carbon pools and in assessing whole-ecosystem response to management and global change. For. Sci. 57, 67–76. doi:10.1093/forestscience/57.1.67
Hedrick, D. B., Peacock, A., and White, D. C. (2005). “Interpretation of fatty acid profiles of soil microorganisms,” in Monitoring and assessing soil bioremediation soil biology (Berlin, Heidelberg: Springer Berlin Heidelberg), 251–259. doi:10.1007/3-540-28904-6_12
Helgason, B. L., Walley, F. L., and Germida, J. J. (2009). Fungal and bacterial abundance in long-term No-till and intensive-till soils of the northern great plains. Soil Sci. Soc. Am. J. 73, 120–127. doi:10.2136/sssaj2007.0392
Hendershot, W. H., Lalande, H., and Duquette, M. (2007). “Soil reaction and exchangeable acidity,” in Soil Sampling and Methods of Analysis. Editors M. R. Carter, and E. G. Gregorich (Boca Raton, FL: CRC Press).
Huang, W., Mirabito, A. J., Tenesaca, C. G., Mejia-Garcia, W. F., Lawrence, N. C., Kaleita, A. L., et al. (2023). Controls on organic and inorganic soil carbon in poorly drained agricultural soils with subsurface drainage. Biogeochemistry 163, 121–137. doi:10.1007/s10533-023-01026-x
IPCC (2014). “2013 supplement to the 2006 IPCC guidelines for national greenhouse gas inventories,” in Wetlands. T. Hiraishi, T. Krug, K. Tanabe, N. Srivastava, B. Jamsranjav, and M. Fukuda (Switzerland: IPCC). Available at: https://www.ipcc.ch/site/assets/uploads/2018/03/Wetlands_Supplement_Entire_Report.pdf.
Janik, L. J., Merry, R. H., Forrester, S. T., Lanyon, D. M., and Rawson, A. (2007a). Rapid prediction of soil water retention using mid infrared spectroscopy. Soil Sci. Soc. Am. J. 71, 507–514. doi:10.2136/sssaj2005.0391
Janik, L. J., Skjemstad, J. O., Shepherd, K. D., and Spouncer, L. R. (2007b). The prediction of soil carbon fractions using mid-infrared-partial least square analysis. Soil Res. 45, 73–81. doi:10.1071/SR06083
Konschuh, H. J. (2013). Assessing microbial community dynamics and carbon mineralization with depth across an eroded agricultural landscape at St. Denis national wildlife area. Saskatoon (SK): University of Saskatchewan. [master’s thesis].
Landi, A., and Memut, A. R. (2007). “Carbon dynamics in Saskatchewan soils: implications for the global carbon cycle,” in Climate Change and Terrestrial Carbon Sequestration in Central Asia. Editors R. Lal, M. Suleimenov, B. A. Stewart, and D. O. Hansen (Boca Raton, FL: CRC Press), 189–197.
Lavallee, J. M., Soong, J. L., and Cotrufo, M. F. (2020). Conceptualizing soil organic matter into particulate and mineral-associated forms to address global change in the 21st century. Glob. Change Biol. 26, 261–273. doi:10.1111/gcb.14859
Lehmann, J., and Kleber, M. (2015). The contentious nature of soil organic matter. Nature 528, 60–68. doi:10.1038/nature16069
Lehmann, J., Liang, B., Solomon, D., Lerotic, M., Luizão, F., Kinyangi, J., et al. (2005). Near-edge X-ray absorption fine structure (NEXAFS) spectroscopy for mapping nano-scale distribution of organic carbon forms in soil: application to black carbon particles. Glob. Biogeochem. Cycles 19. doi:10.1029/2004GB002435
Lundquist, E. J., Scow, K. M., Jackson, L. E., Uesugi, S. L., and Johnson, C. R. (1999). Rapid response of soil microbial communities from conventional, low input, and organic farming systems to a wet/dry cycle. Soil Biol. Biochem. 31, 1661–1675. doi:10.1016/S0038-0717(99)00080-2
Macdonald, L. M., Paterson, E., Dawson, L. A., and McDonald, A. J. S. (2004). Short-term effects of defoliation on the soil microbial community associated with two contrasting Lolium perenne cultivars. Soil Biol. Biochem. 36, 489–498. doi:10.1016/j.soilbio.2003.11.001
McCauley, L. A., Anteau, M. J., van der Burg, M. P., and Wiltermuth, M. T. (2015). Land use and wetland drainage affect water levels and dynamics of remaining wetlands. Ecosphere 6, 1–22. art92. doi:10.1890/ES14-00494.1
Millar, J. B. (1976). Wetland classification in western Canada. Ottawa, ON: Canadian Wildlife Service.
Miller, B. A., Crumpton, W. G., and Valk, A. G. (2009). Spatial distribution of historical wetland classes on the Des Moines Lobe, Iowa. Wetlands 29, 1146–1152. doi:10.1672/08-158.1
Miller, J. J., and Curtin, D. (2007). “Electrical conductivity and soluble ions,” in Soil Sampling and Methods of Analysis. Editors M. R. Carter, and E. G. Gregorich (Boca Raton, FL: CRC Press).
Mirabito, A. J., and Chambers, L. G. (2023). Quantifying mineral-associated organic matter in wetlands as an indicator of the degree of soil carbon protection. Geoderma 430, 116327. doi:10.1016/j.geoderma.2023.116327
Mitsch, W. J., and Gosselink, J. G. (2000). The value of wetlands: importance of scale and landscape setting. Ecol. Econ. 35, 25–33. doi:10.1016/S0921-8009(00)00165-8
Montgomery, J. S., Hopkinson, C., Brisco, B., Patterson, S., and Rood, S. B. (2018). Wetland hydroperiod classification in the western prairies using multitemporal synthetic aperture radar. Hydrol. Process. 32, 1476–1490. doi:10.1002/hyp.11506
Nelson, J. D. J., Schoenau, J. J., and Malhi, S. S. (2008). Soil organic carbon changes and distribution in cultivated and restored grassland soils in Saskatchewan. Nutr. Cycl. Agroecosyst 82, 137–148. doi:10.1007/s10705-008-9175-1
Olson, K. R., and Al-Kaisi, M. M. (2015). The importance of soil sampling depth for accurate account of soil organic carbon sequestration, storage, retention and loss. CATENA 125, 33–37. doi:10.1016/j.catena.2014.10.004
Olsson, P. A. (1999). Signature fatty acids provide tools for determination of the distribution and interactions of mycorrhizal fungi in soil. FEMS Microbiol. Ecol. 29, 303–310. doi:10.1111/j.1574-6941.1999.tb00621.x
Poeplau, C., Don, A., Six, J., Kaiser, M., Benbi, D., Chenu, C., et al. (2018). Isolating organic carbon fractions with varying turnover rates in temperate agricultural soils – a comprehensive method comparison. Soil Biol. Biochem. 125, 10–26. doi:10.1016/j.soilbio.2018.06.025
Qualls, R. G. (2013). “Dissolved organic matter,” in Methods in Biogeochemistry of wetlands SSSA book series. Editors R. D. DeLaune, K. R. Reddy, C. J. Richardson, and J. P. Megonigal (Madison, WI, USA: American Society of Agronomy and Soil Science Society of America). doi:10.2136/sssabookser10.c16
Roman Dobarco, M. (2014). Influence of stand composition on soil organic carbon stabilization and biochemistry in aspen and conifer forests of Utah. Logan (UT): Utah State University. [dissertation].
Rumpel, C., and Kögel-Knabner, I. (2011). Deep soil organic matter—a key but poorly understood component of terrestrial C cycle. Plant Soil 338, 143–158. doi:10.1007/s11104-010-0391-5
Singh, M., Sarkar, B., Biswas, B., Churchman, J., and Bolan, N. S. (2016). Adsorption-desorption behavior of dissolved organic carbon by soil clay fractions of varying mineralogy. Geoderma 280, 47–56. doi:10.1016/j.geoderma.2016.06.005
Skjemstad, J. O., and Baldock, J. A. (2007). “Total and organic carbon,” in Soil Sampling and Methods of Analysis. Editors M. R. Carter, and E. G. Gregorich (Boca Raton, FL: CRC Press).
Spaccini, R., and Piccolo, A. (2007). Molecular characterization of compost at increasing stages of maturity. 1. Chemical fractionation and infrared spectroscopy. J. Agric. Food Chem. 55, 2293–2302. doi:10.1021/jf0625398
Stewart, R. E., and Kantrud, H. A. (1971). Classification of natural ponds and lakes in the glaciated prairie region. Washington, DC: US Bureau of Sport Fisheries and Wildlife.
Tangen, B. A., and Bansal, S. (2019). Soil properties and greenhouse gas fluxes of Prairie Pothole Region wetlands: a comprehensive data release. doi:10.5066/F7KS6QG2
Tangen, B. A., Finocchiaro, R. G., and Gleason, R. A. (2015). Effects of land use on greenhouse gas fluxes and soil properties of wetland catchments in the Prairie Pothole Region of North America. Sci. Total Environ. 533, 391–409. doi:10.1016/j.scitotenv.2015.06.148
Tatzber, M., Stemmer, M., Spiegel, H., Katzlberger, C., Haberhauer, G., and Gerzabek, M. H. (2007b). An alternative method to measure carbonate in soils by FT-IR spectroscopy. Environ. Chem. Lett. 5, 9–12. doi:10.1007/s10311-006-0079-5
Tatzber, M., Stemmer, M., Spiegel, H., Katzlberger, C., Haberhauer, G., Mentler, A., et al. (2007a). FTIR-spectroscopic characterization of humic acids and humin fractions obtained by advanced NaOH, Na4P2O7, and Na2CO3 extraction procedures. J. Plant Nutr. Soil Sci. 170, 522–529. doi:10.1002/jpln.200622082
University of Saskatchewan (2020). Saskatchewan soil information system. Available at: sksis.usask.ca [Accessed November 20, 2020].
VandenBygaart, A. J., Bremer, E., McConkey, B. G., Ellert, B. H., Janzen, H. H., Angers, D. A., et al. (2011). Impact of sampling depth on differences in soil carbon stocks in long-term agroecosystem experiments. Soil Sci. Soc. Am. J. 75, 226–234. doi:10.2136/sssaj2010.0099
von Haden, A. C., Yang, W. H., and DeLucia, E. H. (2020). Soils’ dirty little secret: depth-based comparisons can be inadequate for quantifying changes in soil organic carbon and other mineral soil properties. Glob. Change Biol. 26, 3759–3770. doi:10.1111/gcb.15124
Watmough, M. D., and Schmoll, M. J. (2007). Environment Canada’s prairie and northern region habitat monitoring program phase II: recent habitat trends in the prairie habitat joint venture. Edmonton, AB, Canada: Environment Canada, Canadian Wildlife Service.
Wendt, J. W., and Hauser, S. (2013). An equivalent soil mass procedure for monitoring soil organic carbon in multiple soil layers. Eur. J. Soil Sci. 64 (1), 58–65. doi:10.1111/ejss.12002
Willers, C., Jansen van Rensburg, P. j., and Claassens, S. (2015). Phospholipid fatty acid profiling of microbial communities–a review of interpretations and recent applications. J. Appl. Microbiol. 119, 1207–1218. doi:10.1111/jam.12902
Willms, W., Adams, B., and McKenzie, R. (2011). “Overview: anthropogenic changes of Canadian grasslands,” in Arthropods of Canadian grasslands. Editor K. D. Floate (Biological Survey of Canada), 1–22.
Wojdyr, M. (2010). Fityk: a general-purpose peak fitting program. J. Appl. Crystallogr. 43, 1126–1128. doi:10.1107/S0021889810030499
Wolfe, J. D., Shook, K. R., Spence, C., and Whitfield, C. J. (2019). A watershed classification approach that looks beyond hydrology: application to a semi-arid, agricultural region in Canada. Hydrol. Earth Syst. Sci. 23, 3945–3967. doi:10.5194/hess-23-3945-2019
Zelles, L., Bai, Q. Y., Beck, T., and Beese, F. (1992). Signature fatty acids in phospholipids and lipopolysaccharides as indicators of microbial biomass and community structure in agricultural soils. Soil Biol. Biochem. 24, 317–323. doi:10.1016/0038-0717(92)90191-Y
Zhang, Y., Naafs, B. D. A., Huang, X., Song, Q., Xue, J., Wang, R., et al. (2022). Variations in wetland hydrology drive rapid changes in the microbial community, carbon metabolic activity, and greenhouse gas fluxes. Geochimica Cosmochimica Acta 317, 269–285. doi:10.1016/j.gca.2021.11.014
Zhang, Z., Brown, R., Bauer, J., and Bedard-Haughn, A. (2017). Nutrient dynamics within drainage ditches under recent, medium, and long-term drainage in the Black soil zone of southeastern Saskatchewan. Geoderma 289, 66–71. doi:10.1016/j.geoderma.2016.11.027
Zhao, Q., Bai, J., Jia, J., Zhang, G., Wang, J., and Gao, Y. (2022). The effects of drainage on the soil fungal community in freshwater wetlands. Front. Ecol. Evol. 10. doi:10.3389/fevo.2022.837747
Keywords: prairie pothole region, wetland drainage, soil carbon stability, microbial biomass, organic matter fractionation
Citation: Chizen CJ, Helgason BL, Weiseth B, Dhillon GS, Baulch HM, Schoenau JJ and Bedard-Haughn AK (2024) Soil carbon dynamics in drained prairie pothole wetlands. Front. Environ. Sci. 12:1353802. doi: 10.3389/fenvs.2024.1353802
Received: 11 December 2023; Accepted: 21 February 2024;
Published: 15 March 2024.
Edited by:
Jinxin Cong, Chinese Academy of Sciences (CAS), ChinaReviewed by:
Chuanyu Gao, Chinese Academy of Sciences (CAS), ChinaXiaoyan Zhu, Jilin Jianzhu University, China
Copyright © 2024 Chizen, Helgason, Weiseth, Dhillon, Baulch, Schoenau and Bedard-Haughn. This is an open-access article distributed under the terms of the Creative Commons Attribution License (CC BY). The use, distribution or reproduction in other forums is permitted, provided the original author(s) and the copyright owner(s) are credited and that the original publication in this journal is cited, in accordance with accepted academic practice. No use, distribution or reproduction is permitted which does not comply with these terms.
*Correspondence: Chantel J. Chizen, chantel.chizen@usask.ca