Land use and Europe’s renewable energy transition: identifying low-conflict areas for wind and solar development
 Joseph M. Kiesecker1*
  Jeffrey S. Evans1
  James R. Oakleaf1 Kasandra Zorica Dropuljić2
  Igor Vejnović2 Chris Rosslowe3 Elisabeth Cremona3 Aishwarya L. Bhattacharjee1
  Shivaprakash K. Nagaraju4 Anthony Ortiz5 Caleb Robinson5 Juan Lavista Ferres5
  Mate Zec2
  Kei Sochi1
- 1The Nature Conservancy (TNC), Global Protect Oceans, Lands and Waters, Fort Collins, CO, United States
- 2The Nature Conservancy (TNC), Europe Program, Brussels, Belgium
- 3Ember, The Fisheries, 1 Mentmore Terrace, London, United Kingdom
- 4The Nature Conservancy (TNC), New Delhi, India
- 5Microsoft AI for Good Research Lab, Redmond, WA, United States
Continued dependence on imported fossil fuels is rapidly becoming unsustainable in the face of the twin challenges of global climate change and energy security demands in Europe. Here we present scenarios in line with REPowerEU package to identify Renewables Acceleration Areas that support rapid renewable expansion, while ensuring minimal harm to places important for biodiversity and rural communities. We calculated the area needed to meet renewable energy objectives under Business-as-Usual (BAU) and Low-conflict (LCON) development scenarios within each country, providing a broad overview of the potential for renewable energy generation to reduce impacts when development is steered toward lower conflict lands. Our analysis shows that meeting renewable energy objectives would require a network of land-based wind turbines and solar arrays encompassing upwards of 164,789 km2 by 2030 and 445,654 km2 by 2050, the latter roughly equivalent to the land area of Sweden. Our results highlight that BAU development patterns disproportionately target high-conflict land cover types. By 2030, depending on the development pathway, solar and wind development are projected to impact approximately 4,386–20,996 km2 and 65,735–138,454 km2 of natural and agricultural lands, respectively. As renewable energy objectives increase from 2030 to 2050 impacts to natural and agricultural lands also increase, with upwards of 33,911 km2 from future solar development and 399,879 km2 from wind development. Despite this large footprint, low-conflict lands can generate substantial renewable energy: 6.6 million GWh of solar and 3.5 million GWh of wind, 8–31 times 2030 solar objectives and 3–5 times 2030 wind objectives. Given these patterns, we emphasize the need for careful planning in areas with greater impact potential, either due to a larger demand for land area or limited land availability. Top-emitting countries with large renewable energy objectives (Germany, Italy, Poland, France, Spain) and those with limited flexibility in meeting objectives on low-conflict land (Albania, Slovenia, Montenegro, Hungary, Croatia, Serbia, Bosnia Herzegovina, Finland, Greece, Portugal, and Norway) should be priorities for country-level customizations to guide low-conflict siting and avoid disproportionate impacts on high-value areas.
Introduction
Climate change is no longer a thing of the future, it is happening now (Abel et al., 2019; Arneth et al., 2019). Temperatures are rising, the occurrence of drought and wildfire events are increasing, rainfall patterns are shifting, glaciers are retreating, and global mean sea level is rising (Lenton et al., 2019; Ripple et al., 2019). Nowhere was the inescapable arrival of climate risks made more obvious than the summer of 2022 in Europe (Hoffmann et al., 2022). In Spain, a prolonged dry spell made July the hottest month since at least 1961, while Italy’s Po River and France’s Loire are at its lowest recorded levels (Büntgen et al., 2021). Also in France, dozens of wildfires were ablaze across the country, impacting more than 57,200 ha, nearly six times the annual average (Richter, 2021). Following record temperatures above 40°C (104 Fahrenheit), Britain issued a new amber “Extreme Heat” warning. These climatic events have negative societal impacts in the form of the degradation of ecosystems, harvest failures, and increased mortality (Rousi et al., 2022). Extended periods of heat, and depleted water resources have impacted crops, with a 30% reduction of rice yield in Italy’s Po River basin (Schumacher et al., 2022). Of particular concern are reports that estimate a death toll of over 20,000 across Western Europe alone during the 2022 heat waves (Portala, 2022).
At the same time, Europe is facing an energy crisis, made more acute in no small part by Russia’s invasion of Ukraine (Żuk and Żuk, 2022). High energy costs further exacerbate the problem of energy poverty (Rosenow, 2022) drawing attention to the risk of low incomes, lower residential efficiency, and high energy costs (Belaïd, 2022). Continued reliance on imported fossil fuels is rapidly becoming unsustainable amidst the twin challenges of global climate change and energy security demands. And although Europe is already a global frontrunner in scaling up renewable energy production to replace fossil fuels, the annual buildout rates are still insufficient to overcome its dependence on fossil fuels at the pace this moment requires. A paradigm shift is necessary to speed up the deployment of renewable energy.
In the wake of Russia’s invasion of Ukraine, European leaders are pushing for a faster transition to renewables as a strategy to end its dependence on fossil fuel imports from Russia. The ‘REPowerEU’ plan put forth by the Commission in 2022 which led to the revision of the EU Renewable Energy Directive (EU RED) comes at an appropriate time and offers a promising course forward, particularly the increase in the renewable energy target for 2030 to at least 42.5%, aiming for 45%. To meet this goal, member states will need to install an additional 4 to 15 times the current installed capacity of solar by 2030 and more than double wind production, ultimately tripling clean energy capacity, by 2030 (Rosslowe et al., 2022). To ensure success, the EU Commission’s REPowerEU package calls for member states to “swiftly map, assess and ensure suitable land areas are available for renewable energy projects. Maps will need to be commensurate with countries national energy and climate plans, defining areas as particularly suitable, while avoiding as much as possible environmentally valuable areas.” This legislation will also have a substantial impact on the energy policies of the European Union’s neighboring countries. This influence will be exerted through the Energy Community Treaty and the integration of the revised EU Renewable Energy Directive (RED) into the national laws of the Contracting Parties.
However, to facilitate this more rapid transition, the Commission’s proposals could weaken certain environmental rules and risk projects moving ahead without adequate assessments of potentially damaging impacts (Durá-Alemañ et al., 2023). In turn, this could slow renewable energy deployment down rather than speed it up by creating legal uncertainty and avoidable public opposition. Recent actions suggest that such concerns are warranted. For example, the recent Royal Spanish Decree Law 20/2022 (which aims to fast-track renewables without Environmental Impact Assessments (EIA), raising the risk of badly miscalculating negative impacts on biodiversity) has created tensions and conflicts in Spain around renewables siting at the start of 2023 (González and Sobrini, 2023). In Norway, escalating conflicts over wind energy development on Saami reindeer herding lands illustrates the importance of ensuring local communities and their concerns are adequately and proactively incorporated (Fjellheim, 2023). If accelerated projects are poorly sited, renewable energy footprints can adversely impact people and biodiversity, creating land conflicts that jeopardize investments and slow renewable energy expansion. Smart, forward-planning, and lower-impact siting is essential to the renewable energy sector’s success. Critical to achieving that balance will be a rigorous process for identifying “Renewables Acceleration Areas” that are derived from robust spatial planning that includes among other things, ecosystem and wildlife sensitivity mapping, other locally-relevant ecological priorities and concerns, and social value assessments. Countries will need to create science-based solutions that advance renewable energy development while conserving the environment in credible ways if they are to succeed.
Here we present a series of scenarios intended to support the rapid expansion of renewable energy in Europe while reducing harm to places important for biodiversity and rural communities. Our three pathways (Stated Policy (SP), Technology Driven (TD), System Change (SC)) are based on a cost-optimization that seeks to identify the technology mix needed to decarbonize the power system without exceeding Europe’s carbon budget (Rosslowe et al., 2022). These forecasts outline a country specific spatial and temporal roadmap for meeting renewable energy goals with specific GW projections for each of the countries for 2030, 2035, 2040, 2045, and 2050. We calculated the area needed to meet these renewable energy pathways under Business-as-Usual (BAU) and Low-conflict (LCON) development scenarios within each country, providing a broad overview of the potential for renewable energy generation to reduce impacts when development is steered toward lower conflict lands. To do so, we spatially allocated land-based, utility-scale wind and solar energy needed to achieve targets under the three pathways and for BAU and LCON scenarios using our 1-km resolution global Development Potential Indices (DPIs) (Oakleaf et al., 2019). Once sited, we evaluated the potential overlap of development with land cover types that may be in high conflict.
Study area
The study area comprises 33 countries (Supplementary Tables S2A, S2B) who are key actors in an integrated pan-European energy market through their membership in either the European Union (EU), Schengen Area, or the Western Balkans and for which we had available production target information. We included 25 EU member countries but excluded Cyprus and Malta because we lacked data (consistent landcover data or Ember production goals) to include them in the analysis. We also included the UK as an important former member of the EU. We added the non-EU countries Norway and Switzerland who are part of the Schengen Area and thus are closely aligned with the EU. We expanded the project area to append the Western Balkans (Albania, Bosnia and Herzegovina, Montenegro, North Macedonia, Serbia) countries that are part of the EU enlargement policy and work to adopt EU energy principles and policies through their participation in The Energy Community. We excluded the following countries because we lacked Ember production goals for them: Liechtenstein and Iceland (Schengen Area), Kosovo and Ukraine (Western Balkans/The Energy Community), and Turkey and Moldova (EU enlargement policy).
Methods
We built the analysis using development constraint maps at 1-km resolution and associated resource production potential (in GWh) for photovoltaic solar (PV) and onshore wind (Oakleaf et al., 2019). We calculated a conflict index, also at 1-km resolution, based on the fractional cover within each cell by different land cover classes and protected areas to identify areas of low-conflict solar and wind development. We compared two development scenarios for each development pathway (i.e., SP, TD, SC)—a Business-as-Usual (BAU) and Low-Conflict (LCON)—to meet country-level 2030, 2035, 2040, 2050 PV solar and wind production goals by sorting on resource potential (for BAU) or by conflict index scores (for LCON) and summing GWh until the solar or wind target was achieved (see Figure 1). We also compared the amount of land needed to meet the combined solar and wind production goals under the BAU and LCON scenarios.

Figure 1. Steps used in the analysis.
Mapping solar and wind resource
To identify suitable land and power potential for PV and wind, we relied directly or partially on the constraint and yield mapping used in producing a global development potential indices (DPIs) for each sector (Oakleaf et al., 2019). The 14 DPI maps capture a location’s suitability for development by renewable energy, oil and gas, mining, agriculture, and expansion of urban sectors (Oakleaf et al., 2019) and can be used to develop business as usual scenarios that facilitate broad-scale spatial assessments of potential individual sector and cumulative development patterns to identify high-risk areas where near-future expansion may conflict with biodiversity, climate, or environmental assets (Johnson et al., 2021). By using the PV and wind DPI, we restricted our analysis by important resource thresholds (i.e., solar irradiance, wind speeds), land use characteristics (e.g., urban areas for wind, areas with already operating plants), and biophysical parameters (e.g., slope, elevation). Regarding PV solar constraints, we deviated from Oakleaf et al. (2019) and allowed for development within urban areas. Urban areas surrounded by unsuitable lands (e.g., low solar irradiance) were, however, maintained as constraints.
For each sector and for each 1 km cell, Oakleaf et al. (2019) calculated potential resource yield estimates, eqs Eq. 1−4, based on mapped resources (i.e., solar irradiance, wind speed). Specifically, for wind, Oakleaf et al. (2019) calculated resource potential Eq. 1 for every ith cell in MWh/km2 as:
where PD = wind capacity density of 5 MW/km2 (Wu et al., 2017), CFi = spatially explicit hourly capacity factor based on fitting a local polynomial regression (loess) to average annual wind speed data (Lopez et al., 2012), ADi = air density factor, and 8,760 = number of hours in a year. The air density factor (ADi) Eq. 2 was calculated by:
Where pi Eq. 3 is air density and 1.225 kg/m3 is sea-level density, where for each elevation (Zi):
Values of ADi ranged from 1.00 at sea level to 0.475 at 3,000 m elevation.
For PV resource potential Eq. 4, we followed Oakleaf et al. (2019) but added more recent values and data by calculating resource potential for every ith cell in MWh/km2 as:
where PDpv = capacity density of 69 MW/km2 (Bolinger and Bolinger, 2022), CFi = spatially explicit daily capacity factor dataset (PVOUT) provided by SolarAtlas (https://globalsolaratlas.info), and 365.25 = number of days in a year. For both Wind and PV, we divided the resource potential by 1,000 to maintain pixel values using GWh/km2.
Identifying low-conflict lands
For each 10,000 m cell, we calculated a continuous conflict index (ranging from 0–1) as the fraction of land cover and protected areas within a cell. To do so, we used the 2018 100 m CORINE Land Cover dataset (European Union, Copernicus Land Monitoring Service, European Environment Agency (EEA) 2018) and classified the 44 land cover classes into conflict (=1) or non-conflict (=0) as associated with potential PV solar and wind development (Supplementary Table S1). Conflicts were assigned on a “per-class” basis and are characterized by land uses that have historically not facilitated multiple-use development patterns.
Assignment of high- and low-conflict classes were based on stakeholder engagement associated with past renewable energy siting projects. See, for example, (Kiesecker et al., 2011; Obermeyer et al., 2011; Fargione et al., 2012; Jones et al., 2015; Baruch-Mordo et al., 2019; Kiesecker et al., 2017). Apart from pastures, all agricultural lands were seen as high-conflict for solar and low-conflict for wind. Because we focused on the promotion of large-scale or industrial-scale wind and solar development, solar was seen as high conflict as the development of solar on these lands would displace existing agricultural production. In contrast, given turbine spacing needs, a wind farm’s direct footprint typically utilizes only a small portion of a project area - approximately 2%–4% of the land base where development occurs - and was seen as compatible with agricultural production. For the majority of artificial surfaces, solar was considered as low-conflict, while wind was high-conflict due to the fact that turbines with spinning blades are not compatible in close proximity with with people and other infrastructure. In all cases natural areas such as forests, wetlands, and grasslands were categorized as high-conflict as solar or wind development would result in habitat loss and/or habitat fragmentation (Supplementary Table S1).
To represent natural protected areas, we used the World Database on Protected Areas (WDPA) (UNEP-WCMC and IUCN, 2020), the Natura 2000 network, Important Bird Areas (IBAs), Key Biodiversity Areas (KBAs), and Emerald Network sites for countries not included in the Natura 2000 network (i.e., Norway, Albania, Kosovo, Macedonia, Montenegro). From the WDPA, we selected all Natural Reserves (Ia), Wilderness Areas (Ib), National Parks (II), Natural Monuments (III), and Habitat/Species Management Areas (IV). We classed all these areas as conflict (=1). Total conflict represents the sum of LULC conflict and protected areas proportions within a 100 m cell. We took an additional step of removing cells where the percent overlap of strictly protected areas (from the WDPA) was >0.4, which matches the critical habitat threshold of ∼0.40 based on percolation theory (Gustafson and Parker, 1992) and has been shown to empirically relate to species threshold responses to habitat loss (Swift and Hannon, 2010).
Wind and solar deployment rates
To set renewable energy objectives for both ground-mounted solar and wind for our three pathways (Stated Policy (SP), Technology Driven (TD), System Change (SC)) we relied on capacity expansion models that followed least-cost principles from Ember (Rosslowe et al., 2022).
The pace of deployment for renewable technologies (wind and solar) in each country was constrained by minimum and maximum limits. A minimum deployment rate for all solar (rooftop and ground-mounted combined) and wind was defined to grow the fleet sufficiently to reach official solar targets (represented by the Stated Policy scenario). This lower deployment limit was typically not binding, i.e., cost-driven wind and solar deployment was higher in most countries and timeframes. A maximum deployment rate was set such that neither the wind nor solar installations in each country would exceed the technical potential at any point over the modelling horizon. In addition to the limits on overall solar deployment, a minimum rate was also defined for rooftop solar in particular. This was introduced to ensure a minimum fraction of solar deployment would go to the rooftop segment. This was required in order to address a modeling bias towards ground-mounted solar on the basis of lower cost (LCOE). In reality, a number of non-cost factors act in favor of rooftop deployment, for example, speed of installation and incentives for self-consumption. This minimum rooftop deployment was defined such that the current fraction of rooftop to ground-mounted capacity would be maintained in the case of minimum solar deployment (Stated Policy). In the case of higher solar deployment, the ratio would reduce.
Meeting renewable energy pathway targets by BAU and LCON scenarios
To derive scenarios, we first subtracted current installed capacity from each EMBER pathway (i.e., SP, TD, SC) target (in GWh) to calculate solar (PV) and wind development targets (Supplementary Tables S2A, S2B; Figure 2). Each pathway is broken into two additional scenarios, one representing “business as usual” (BAU) and one where we attempt to meet goals in areas with low-conflict (LCON). Under the BAU scenario, we sort and select cells from highest GWh assuming development patterns optimize around areas of highest resource first, to derive a cumulative sum until the pathway target is met. For the LCON scenario, we sort cells by the conflict index (ascending) and then by GWh (descending) thus, optimizing around the lowest conflict areas with the highest energy production potential. We then calculated the cumulative sum to select cells until the pathway target is met.
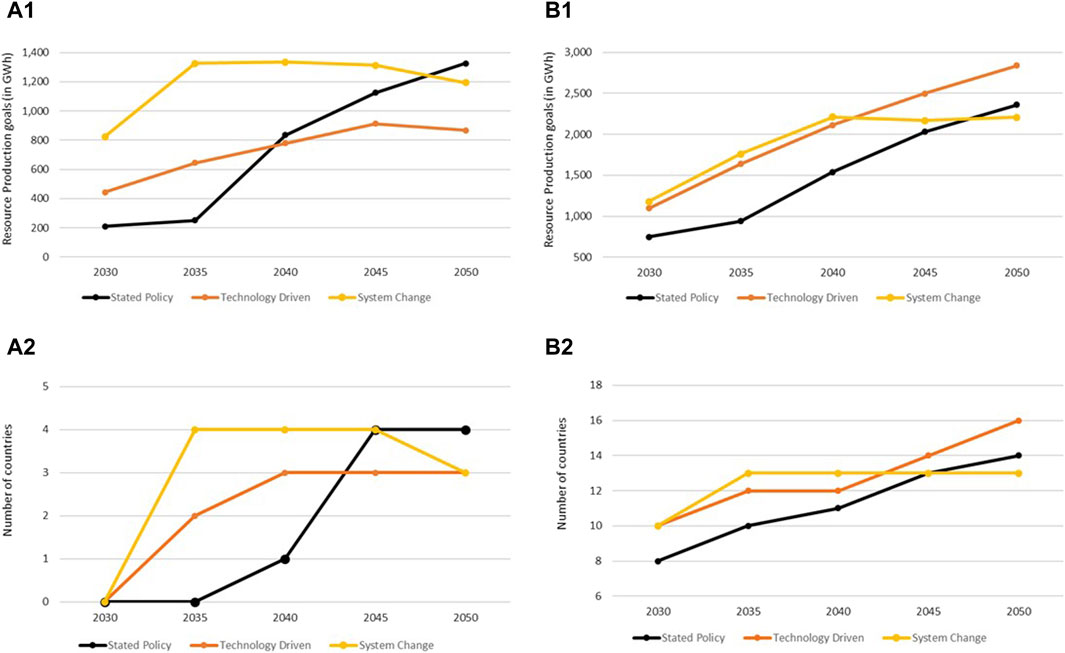
Figure 2. Total resource production goals (in GWh) by pathway and year for solar (A1) and wind (B1) and number of countries unable to meet targets on low-conflict lands alone by pathway and year for solar (A2) and wind (B2).
Understanding past development patterns
We used current solar and wind installations as identified by Global Renewables Watch (Microsoft et al., 2023) and intersected the points with the 100 m CORINE Land Cover dataset reclassified to conflict or non-conflict as above. Rather than assuming a uniform cell size, we used the cellSize function in R terra package (Hijmans, 2023; R Core Team, 2023) to derived a raster representing the “actual area” of each cell, which were then used in deriving the area of each intersecting class. Proportion and area of each class were then aggregated to each EU country.
Results
Our analysis shows that meeting renewable energy targets would require a network of land-based wind turbines and solar arrays covering upwards of 164,789 km2 in 2030 to 445,654 km2 in 2050, the latter an area roughly the size of the country of Sweden (SI Supplementary Tables S3A, S3B). Our results also highlight that BAU development patterns - based solely on maximizing development potential—disproportionately targets high-conflict land cover types (Figures 3, 4). This pattern is supported by an examination of past development patterns, where approximately half of the installed capacity for both wind (in 13 countries) and solar (in 20 countries) was built primarily on high-conflict land cover types (Figure 5) Not surprisingly, as objectives increase over time from 2030 to 2050 (Figure 2), meeting those objectives on low-conflict lands alone grew more difficult (Figure 6). Given the distribution of wind and solar resources, the LCON scenario would require an increased land base to generate the same amount of GW if development is focused solely on low-conflict lands. For solar, the low-conflict scenario footprint is 7%–11% (338–2,177 km2) larger than BAU and for Wind, the low-conflict scenario footprint is 11%–16% (10,001–25,759) bigger than BAU footprint. Notwithstanding these tradeoffs, the LCON development strategy would avert the conversion of high-conflict land cover types lands relative to the BAU scenario in which development is based solely on maximizing resource potential. For example, depending on the development pathway, approximately 2,998–18,745 km2 of high-conflict land cover types for solar development and approximately 30,715–69,262 km2 for wind development could be impacted in 2030 (Supplementary Tables S7A, S7B) under a BAU scenario. As objectives increase from 2030 to 2050, impacts to high-conflict cover types also increase, with upwards of 31,782 km2 from future solar development and 184,842 km2 from wind development. Approximately 24%–40% of those impacts would occur in the top 5 GHG emitting countries (Supplementary Tables S4A, S4B).
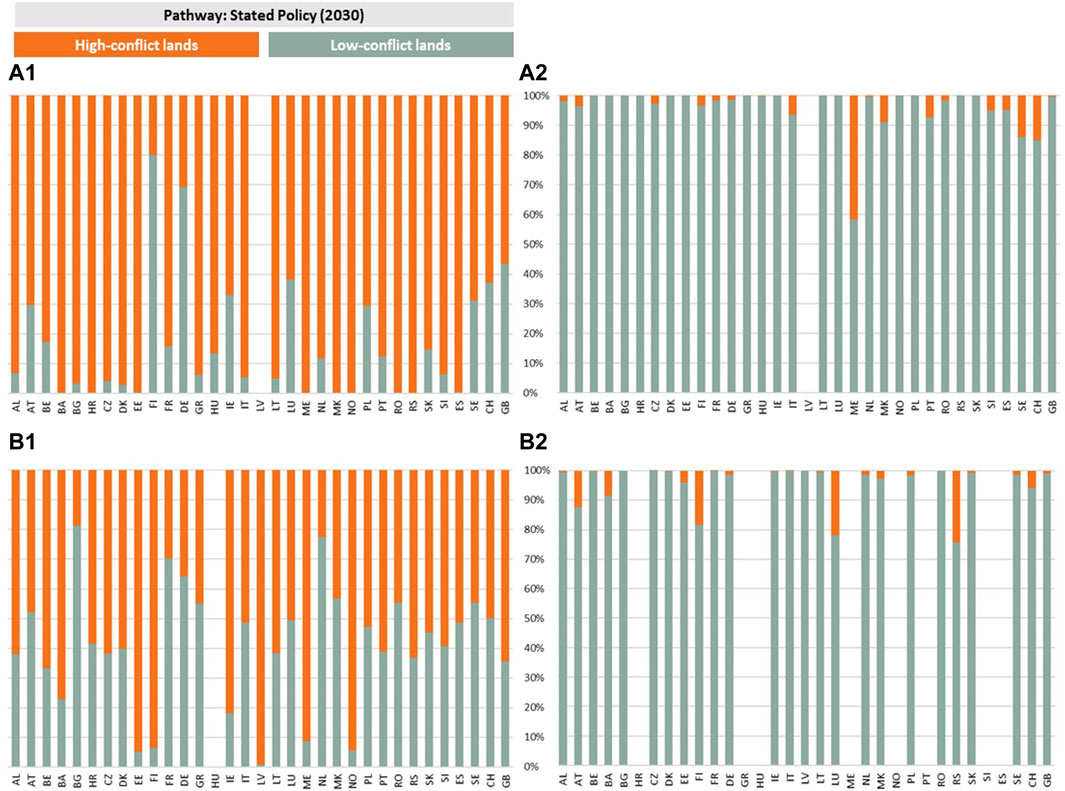
Figure 3. Distribution (%) of low-conflict lands selected to meet 2030 Stated Policy pathway objectives under the BAU and Low-Conflict scenarios. Missing countries indicate where there were no targets set for target year [Latvia–(A1,A2); Hungary–(B1, B2)] or where targets cannot be met on low-conflict lands alone (B2).
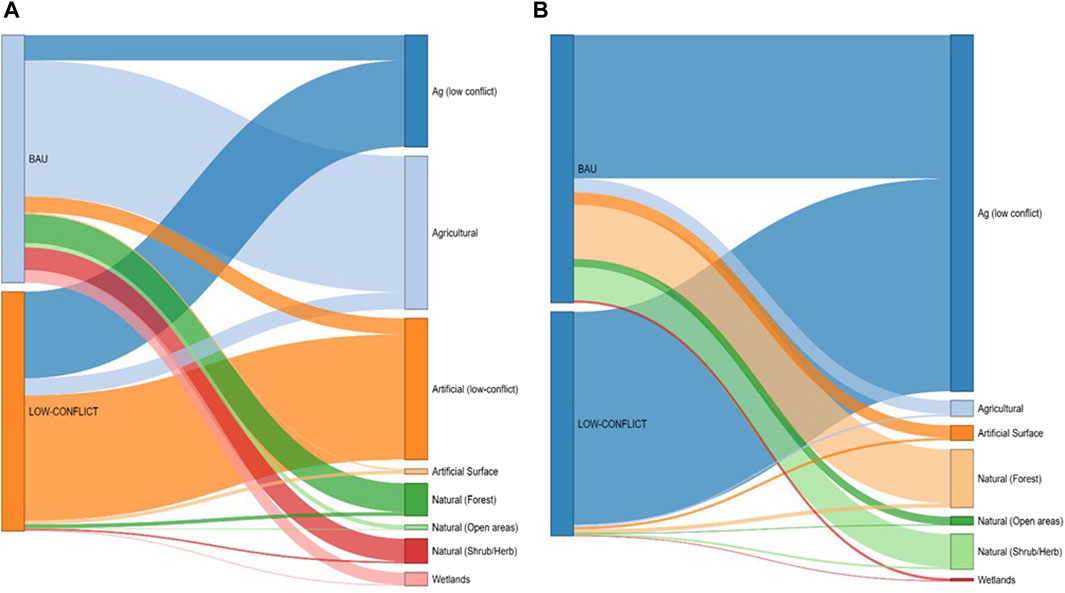
Figure 4. Overlap across land cover classes by BAU and Low-conflict scenarios in the Systems Change pathway for solar (A) and wind (B).
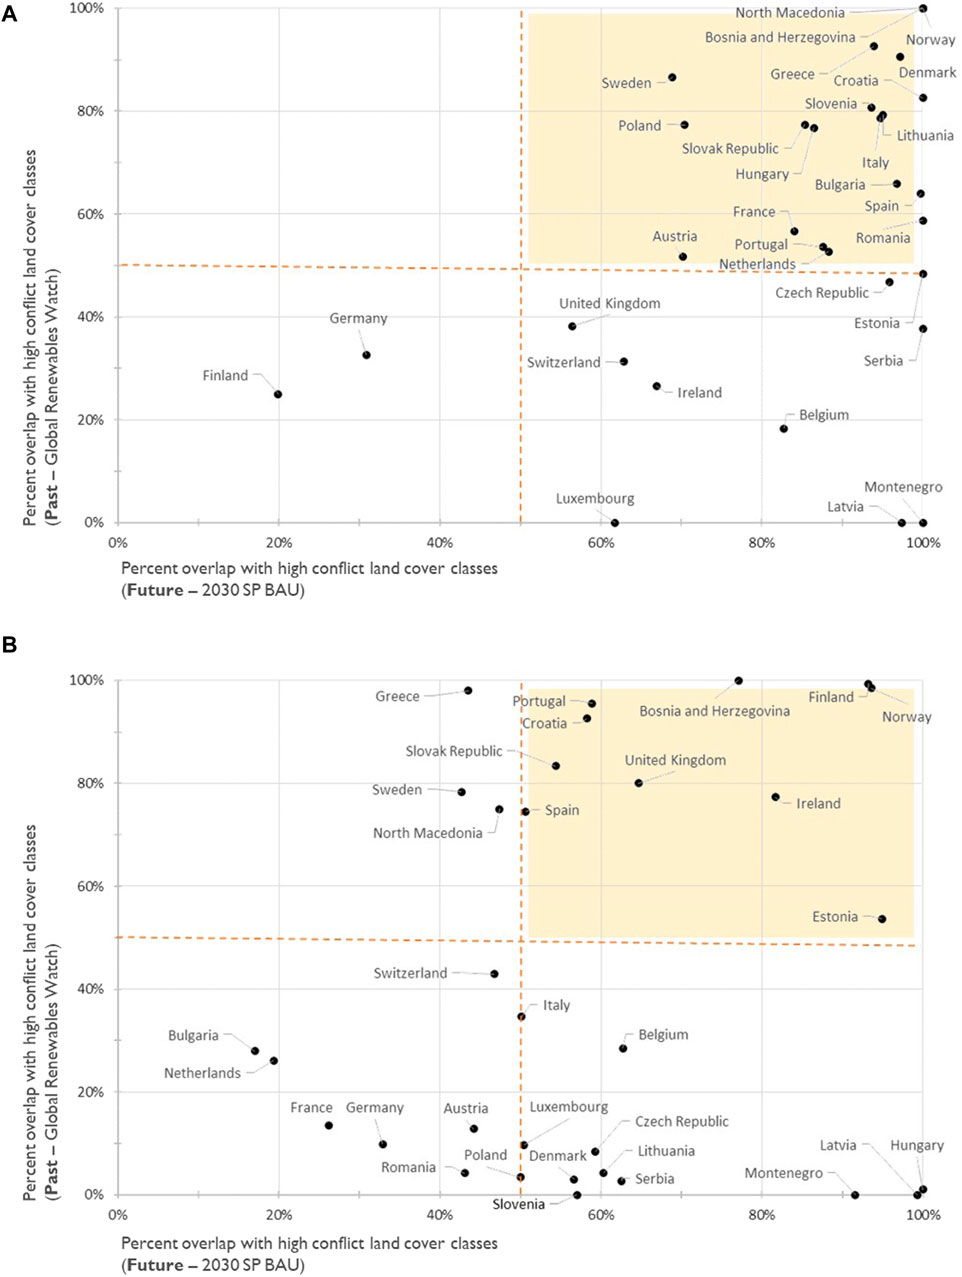
Figure 5. Proportion of high-conflict land cover classes aggregated to each country for current solar (A) and wind installations (B) as identified by Global Renewables Watch (Microsoft et al., 2023) compared to high-conflict land cover classes projected in our 2030 Stated Policy scenario.
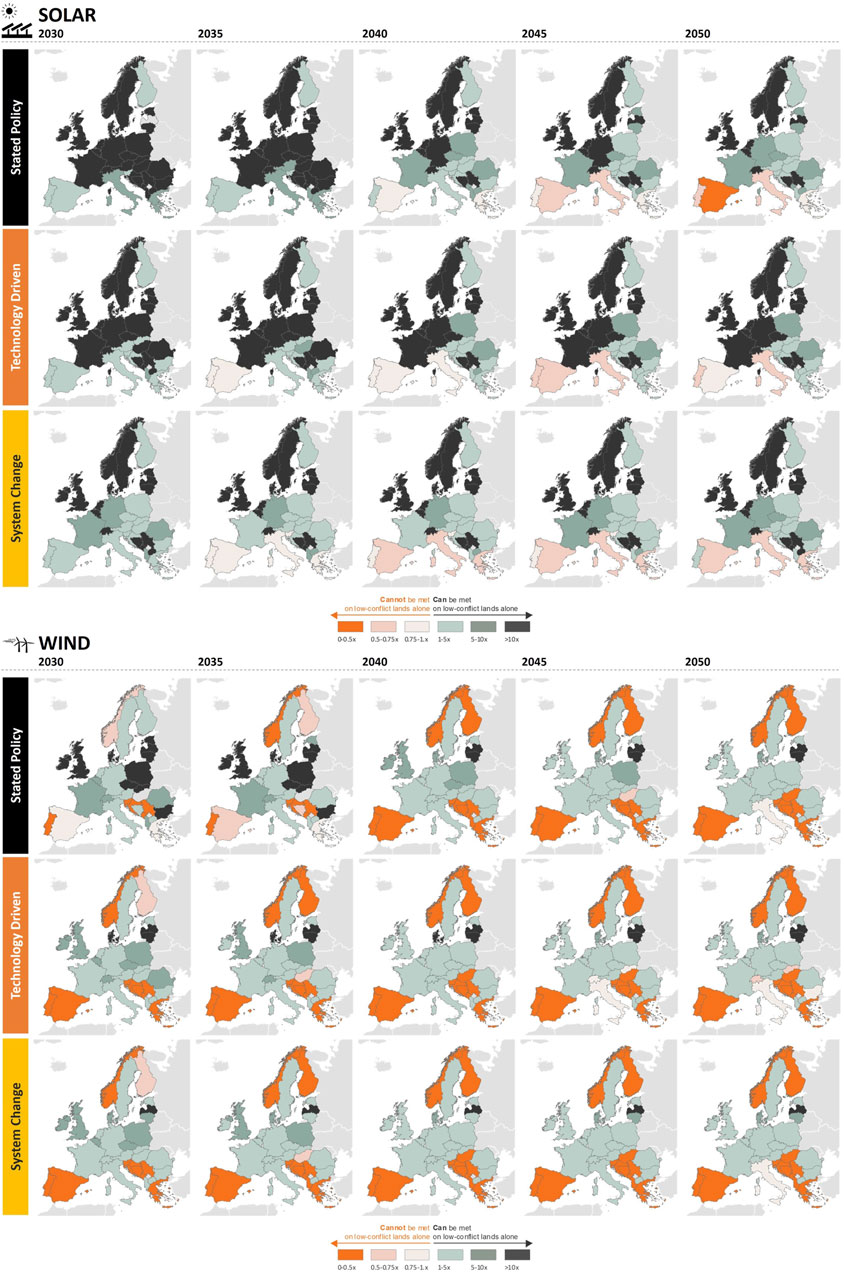
Figure 6. Ratio of available solar and wind resources on low-conflict lands to annual (2030–2050) goals by pathway (i.e., Stated Policy, Technology Driven, System Change).
In addition, BAU development could convert and fragment habitat for IUCN Red-listed species and from 1,028–8,775 km2 (solar) to 16,515–84,016 km2 (wind) of critical biodiversity areas such as Important Bird Areas (IBAs), Key Biodiversity Areas (KBAs), and Natura 2000 and Emerald Network sites that are intended to support the strategic expansion of protected-area networks (Supplementary Tables S5A, S5B).
The largest potential impacts under the BAU scenario across all pathways occurs with agricultural areas (non-irrigated arable land, pastures, complex cultivation areas, agriculture with natural areas, and orchards/olive groves), forest and shrub vegetation classes (coniferous forests, broad-leaved forests, mixed forests, transitional woodland shrub, and sclerophyllous vegetation), and discontinuous urban areas for both solar and wind (Figure 4; Supplementary Tables S6A, S6B). Failure to recognize and manage these potential impacts could slow adherence to renewable energy goals and jeopardize financial investments needed to fuel the renewable energy transition.
Despite this large footprint, after removing areas unsuitable for renewable energy development (i.e., urban areas, permanently protected lands, and areas without economically viable wind and solar resource potential), our analysis also demonstrates that low-conflict converted landcover types have the potential to generate 6.6 million GWh of solar and 3.5 million GWh for wind across Europe—which equals roughly 8–31 times total 2030 solar renewable targets (Supplementary Tables S2A) and 1–5 times 2030 wind renewable targets depending on the development pathway (i.e., Stated Policy, Technology Driven, System Change) (Supplementary Table S2B).
Encouragingly, we found that all countries can meet their 2030 solar development objectives under all three pathways. However, eight countries (Bulgaria, Finland, Hungary, Latvia, Portugal, Slovak Republic, Slovenia, and Spain) have less than twice the energy potential on low-conflict lands alone, leaving limited flexibility in how these objectives can be met in these countries (Figure 5). Starting with 2035 solar objectives, four countries (Greece, Italy, Portugal, and Sweden), cannot meet objectives on low-conflict lands alone.
In marked contrast, 10 countries are unable to meet their 2030 wind development objectives on low-conflict lands alone for two or more pathways (Bosnia and Herzegovina, Croatia, Finland, Greece, Montenegro, Norway, Portugal, Serbia, Slovenia, and Spain). By 2050, an additional seven countries (for a total of 17 countries) are unable to meet wind development objectives on low-conflict lands alone (Austria, Hungary, Italy, Luxembourg, Slovak Republic, Switzerland; Supplementary Tables S3A, S3B).
Discussion
Policymakers in Europe currently face the difficult task of reducing reliance on Russian oil and gas without worsening the situation for businesses and households that are already struggling with high energy prices. All this as communities face heightened price volatility and retail energy companies struggle to manage price regulations and increased demand (Mišík, 2022). In practice, policymakers can either substitute fossil fuel imports from Russia with imports from other countries or reduce their reliance on fossil fuels by investing heavily in low-carbon energy production. And it will be critical that policymakers take the climate crisis into account to avoid making short-term decisions that risk making the necessary longer-term movements toward a low-carbon transition more challenging (Doukas and Nikas, 2022). The current energy crisis and the climate crisis cannot be treated as two separate issues as the decisions made today will cement the future of energy usage and, in turn, hamper efforts to deliver on emission reductions that are needed. Accelerating the build-out of a new clean energy system is the only viable long-term solution to the double crises of energy security and climate urgency facing Europe (Doukas and Nikas, 2022).
Instead of falling back on fossil fuels or turning to large-scale nuclear expansion, European officials should prioritize the multiple clean energy technologies that are available to them today to cut both emissions and energy dependencies. The current situation should spur the EU to move even more quickly toward a clean energy future by pursuing its already ambitious renewable goals. Already, many countries are making great strides away from fossil fuels, especially coal. For example, Germany and Poland, the two biggest coal users, used less coal in winter 2022/2023 than in the previous winter and overall EU fossil generation fell by 12% (coal −11% and gas −13%) in the same period. Romania brought its own exit date forward by 2 years, to2030 from 2032 (Todorović, 2022), and one of Germany’s most significant coal regions committed to exit coal by 2030, ahead of current legal mandates for a 2038 exit date (Kyllmann, 2022). Despite these positive developments, Europe’s overall coal generation in 2022 was higher than 2021, suggesting the need for continued vigilance against turning back to fossil fuels to manage the energy crisis. For example, Greece’s state energy company has suggested it would delay its coal exit by another one to 2 years (Landini and Rashad, 2022). Austria, which stopped using coal for power in 2020, is preparing to reopen a mothballed plant in case of a winter emergency (Tirone, 2022).
A major obstacle for aligning renewable energy deployment with emissions targets is managing the necessary land acquisition and licensing regulations that come with the large land requirements needed for siting renewable projects. Lengthy permitting processes have been one of the biggest challenges slowing projects that might otherwise rapidly advance to construction (Tegen et al., 2016; Dashiell et al., 2019; Kryszk et al., 2023). A shift away from the project-by-project permitting approach to the designation of renewable energy acceleration areas, which are characterized by lowered potential environmental impacts and thus candidates for expedited permitting, will be of particular importance (Kiesecker and Naugle, 2017). However, even under expedited processes, these “renewable energy acceleration areas” should still be subject to environmental licensing protocols and require that we examine ecological and social tradeoffs at an appropriate landscape scale.
The identification of converted land use types using high-resolution land cover classification represents the first step in a series of hierarchical filters that can guide development that reduces impacts to high value lands. Proposals to facilitate the renewable energy transition without proper planning could lead to potentially damaging impacts (González and Sobrini, 2023), create legal uncertainty, and stir otherwise avoidable public opposition, slowing rather than speeding the deployment of renewable energy (Durá-Alemañ et al., 2023). In our analysis, scenarios that examine business as usual development patterns show a propensity for development on lands that are likely to be high-conflict despite the presence of abundant low-conflict siting opportunities. This concern is supported by observations of past patterns of land use conversion associated with both wind and solar development. For example, four of the top 5 emitters, Italy, Poland, France and Spain, that will have the most renewables to build in order to reach emission reductions, build over 50% of the current installed solar capacity on high-conflict land cover types (Figure 5). The top emitting country, Germany, installed 38% of their solar on agricultural lands and ∼4% on natural lands, including Coniferous Forest and Broad-leaved Forest (Figure 7). Similarly, approximately 10% of wind development in Germany was on natural land cover types including Mixed Forest, and Transitional woodland-shrub (Microsoft et al., 2023). Given growing demands for food, converting agricultural land for renewable energy is only likely to further drive conversion of natural habitats to offset the loss of production (Kehoe et al., 2020). Similarly, failure to incorporate natural land values as the renewable transition accelerates could jeopardize the EU’s biodiversity strategy to protect nature and reverse the degradation of ecosystems (European Commission, 2018). We recognize that a LCON focused development strategy may require increased investment to produce the same amount of electricity. However, as renewable development increases, conflicts over impacts to biodiversity and other important land-based ecosystem services, i.e., food production, are likely to become increasingly important. Thus, a proactive approach that seeks to avoid impacts will reduce overall costs and facilitate renewable energy development. Systematic conservation planning and multi-objective spatial optimization tools can allow stakeholders to consider alternative scenarios to meet environmental and renewable energy targets together, assess cumulative impacts from renewable energy and other development to biodiversity alongside other values such as ecosystem services, recreation, viewsheds, and culturally important areas (Kennedy et al., 2016; Sochi et al., 2023).
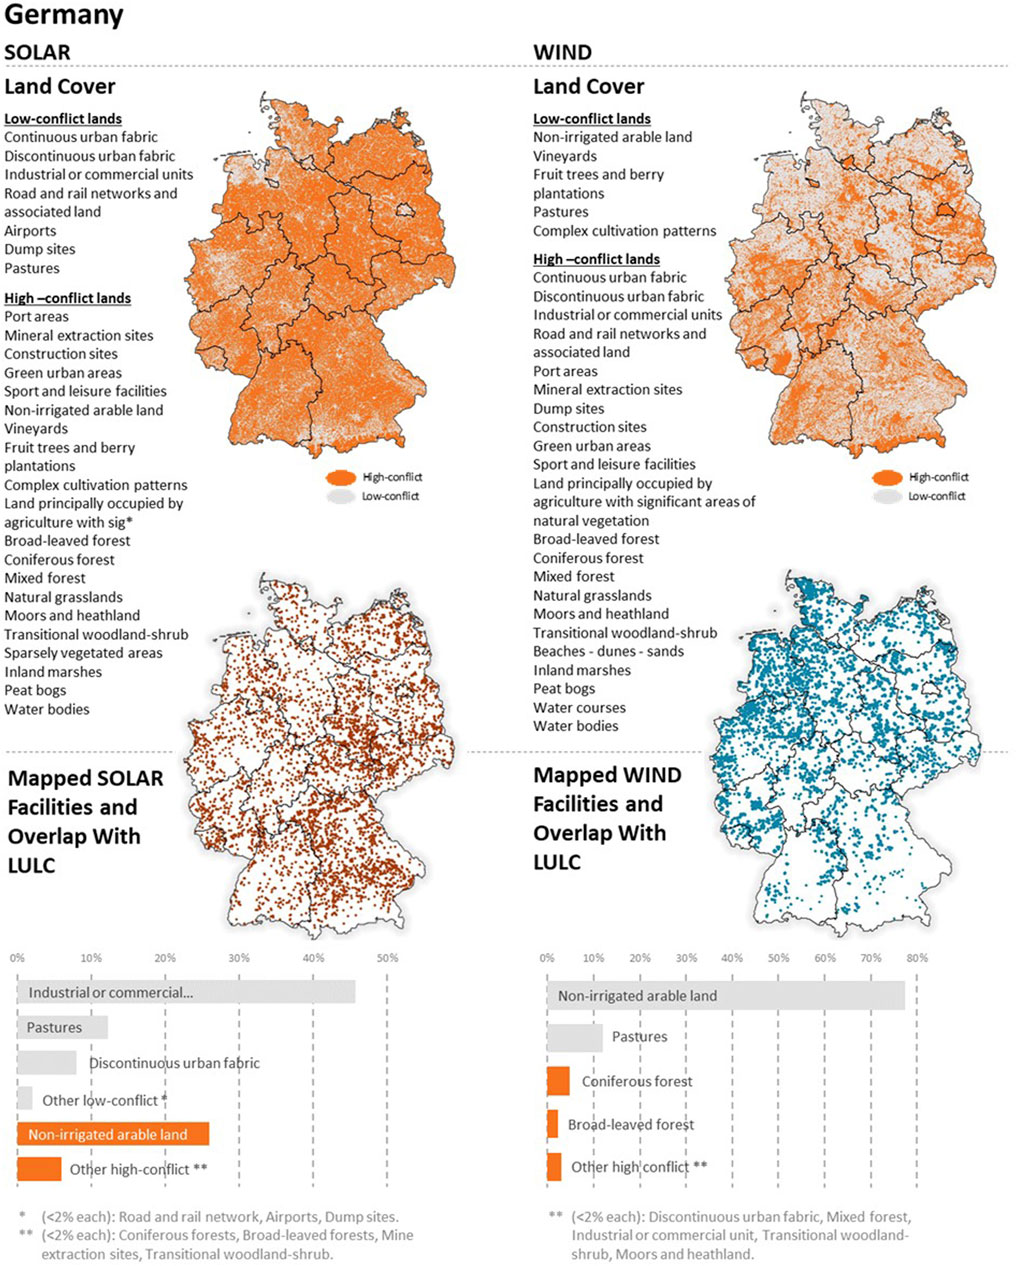
Figure 7. Distribution of CORINE 2018 Land Cover classes (classed as low- and high-conflict for solar and wind development) across Germany and overlap with mapped solar and wind facilities–data from: https://www.globalrenewableswatch.org/.
Our analysis can also be used to identify where further country-level planning is most urgently needed. First, top-emitting countries (i.e., Germany, Italy, Poland, France, Spain) will need country-level customizations to guide low-conflict siting as they have the most renewable energy to build. Second, despite abundant wind and solar potential found on low-conflict land cover types across the continent, several countries do not have enough low-conflict land, or have limited flexibility, to meet their targets (Figure 5). For onshore wind development objectives, Bosnia and Herzegovina, Croatia, Finland, Greece, Montenegro, Norway, Portugal, Serbia, Slovenia, and Spain cannot meet their targets. In addition, Albania, Austria, Hungary, Italy, Luxembourg, and Sweden have limited options to spatially configure how they can meet their wind energy targets on lower-conflict lands. For solar PV targets it is only under the most aggressive scenario—System Change—that Bulgaria, Finland, Greece, Italy, Portugal, Slovak Republic, Slovenia, Spain, and Sweden have limited flexibility in how they can meet these targets on low-conflict lands. These countries should be priorities for more detailed solar development planning.
Given the continental surplus in wind and solar resource potential, countries that cannot meet goals on low-conflict lands alone could import electricity from countries where there is a surplus of low-conflict wind and solar energy potential. This underscores the need for increased collaboration across the EU when developing energy systems for the zero-carbon transition. However, we remain mindful that energy targets are defined at the national level and that countries prioritize their energy security. Moving development, where feasible under existing or future transmission and political constraints, to countries where there is a surplus of wind and solar potential on low-conflict lands can alleviate some of the potential impacts that could slow the transition. There may be options to increase the share of rooftop solar, in turn reducing the amount of ground-based solar needed. In the System Change pathway, which has a bias towards rooftop solar, the fraction of rooftop solar is only 20% in 2035 (Rosslowe et al., 2022). This may well be an underestimate as the EU rooftop fraction is estimated at 65% today. In fact, Solar Power Europe projected that the ground-mounted segment will overtake rooftop before 2030, but in 2026 the fraction of cumulative capacity that is rooftop will still be 59% (Solar Power Europe and LUT University, 2020).
The wind and solar renewable sectors can create opportunities for landowners to reduce their energy expenses and earn new income, but also pose threats to farmland and remaining natural areas. Flat, open farm fields, often the most productive farmland, are highly desirable for solar siting. This new pressure compounds a severe competition for land for housing, food production, and now renewable energy. This analysis focused on the promotion of large-scale or industrial-scale wind and solar development. As a result, we viewed large-scale solar as a consumptive land use; solar deployment “uses up” the land where it is located (Hernandez et al., 2015). We categorized agricultural land as high-conflict for solar development as the development of solar on these lands would displace existing agricultural production. Although integrating solar with agricultural habitat has been successfully deployed in both the United States and Europe, it has been limited in scale (Mamun et al., 2022), even as early research suggests that solar arrays can improve conditions for certain agricultural crops (Trommsdorff et al., 2021). Solar development opportunities for co-located land uses or solar project designs that create valuable co-benefits are possible but would require a shift away from the current model of large-scale solar arrays preferred by the solar industry (Dinesh and Pearce, 2016; Mamun et al., 2022). Given the large extent of agricultural areas within Europe, mechanisms that improve coexistence of these two land uses could dramatically improve options for more renewable energy. Moreover, we recognize that not all agricultural lands are equal; for example, we do not consider pastures as high-conflict with solar (Supplementary Table S1); we also acknowledge that even cultivated areas vary in production and lower yield areas could also be targeted with limited impacts. Although making these determinations is likely best suited to be conducted at the country or landscape-level and would be beyond the scope of our current assessment.
In marked contrast, given turbine spacing needs, a wind farm’s direct footprint typically utilizes only a small portion of a project area, approximately 2%–4% of the land base where development occurs. This diffuse development pattern makes it largely compatible with agricultural production (Burt et al., 2017). Furthermore, compensation associated with wind development increase the profitability of lands providing additional incentives for co-locating agriculture and wind development (Burt et al., 2017). However, this same diffuse development pattern associated with wind can also lead to a significant amount of habitat fragmentation, and associated species impacts, when located in natural cover types (Rehling et al., 2023).
Several caveats limit our ability to conclude that a given land cover class has lower wildlife value. First, we use broadly defined terrestrial land use and land cover classes which may not be consistently associated with the use by birds, bats, and insects (Thaxter et al., 2017). In particular, birds require migratory stopover sites which may occur along rivers, wetlands, or lakes that are often embedded within heavily disturbed agricultural landscapes. Second, terrestrial species may also require migratory corridors to access important habitat areas through what we designate as low-conflict cover types. Third, soaring areas for migratory birds can be disproportionately affected by wind turbine development at the micro-site scale (Marques et al., 2020). Additional research on land-cover and landscape features associated with bird and bat mortality is needed to confidently identify areas where wind development would lead to lowered mortality (May et al., 2015). There are some promising signals that a disturbance-based approach to wind siting can reduce overall impacts to wildlife. Strategies including mitigation measures such as feathering blades to control blade rotation and/or reducing operations during known migratory periods could reduce bird and bat mortality independent of where wind energy is sited (Arnett et al., 2011). Micro-siting of turbines can also reduce bird mortality (Arnett and May 2016). These strategies can be applied to both turbines on low and high-conflict land cover types alike (de Lucas et al., 2012).
Further country-specific analyses would also benefit from finer resolution data inputs. The constraint and power potential maps were derived using global data sets (Oakleaf et al., 2019). and like all global data, are inherently prone to omissions, and inconsistencies in both their spatial features and attributes. Validation analyses of these data produced favorable support for their use, but we emphasize that more localized or detailed spatial analysis should be performed using finer resolution and higher accuracy data when available to fully resolve land suitability. For example, while we utilized land cover data likely to capture human settlements, many countries have regulations that require minimum setbacks from settlements, and using more local data may further limit the availability of suitable land but may also help avoid risks of social conflict (Ryberg et al., 2020; Bampinioti et al., 2023). Ultimately, a localized and comprehensive energy systems analysis that incorporates cost-effective integration of variable renewable energy while optimizing over multiple objectives should be incorporated into best practices for implementation.
While efforts were taken to counter the cost-related bias towards ground-mounted solar installations, these are still likely over-represented in the modelled solar fleet (Rosslowe et al., 2022). Current trends in the solar sector suggest the rooftop segment has played an important role - particularly during Europe’s 2022/23 energy crisis - in driving overall solar growth. Solar Power Europe estimated that rooftop capacity makes up 65% of the EU fleet in 2022 (SolarPower Europe, 2022). Most outlooks foresee ground-mounted systems eventually growing to outnumber rooftop capacity as the energy transition accelerates, however, Solar Power Europe only foresee the rooftop fraction dropping to 59% by 2026. The modelled solar data used in this analysis sees the rooftop fraction drop to 20% in 2035, which is likely an underestimate given current market trends.
Proactive measures are necessary to speed up the development of renewable energy on lands that are identified as low-conflict. The renewable energy industry is expanding rapidly, aided by the decreasing costs of solar and wind development and actions being taken by countries to meet their climate objectives. The passing of the REPowerEU package will further support this expansion. However, the momentum set up by these positive developments may be lost, unless quick actions are taken to develop a blueprint to guide this rapid deployment of renewable energy. To guide the renewable energy transition, it will be critical to ensure that land selection is not only optimal from the perspective of renewable energy generation but also limits ecological and social impacts (Figure 8). It will be important that the development of such projects takes place in a manner that minimizes negative effects on the environment. These guidelines should also consider the dependence of local communities on land, especially vulnerable community groups (Heiner et al., 2019; Kennedy et al., 2023). The identification of lands for renewable energy development should take into account various factors such as protected areas, wildlife corridors and flyways, natural areas like forests and grasslands, biodiversity hotspots, Important Bird Areas (IBAs), Key Biodiversity Areas (KBAs), and habitats of threatened and endangered species. By considering these factors, the guidelines can help ensure that renewable energy projects are developed in a manner that safeguards these important ecological features. Areas providing important ecosystem services, such as water recharge, or areas with forest restoration potential should also be included. Such assessments can direct local municipalities on how to identify “go-to zones” that will have the potential to facilitate a faster and improved due diligence process, to ease regulatory burdens involved in project clearances, and reduce the risk to financial institutions and their investments.
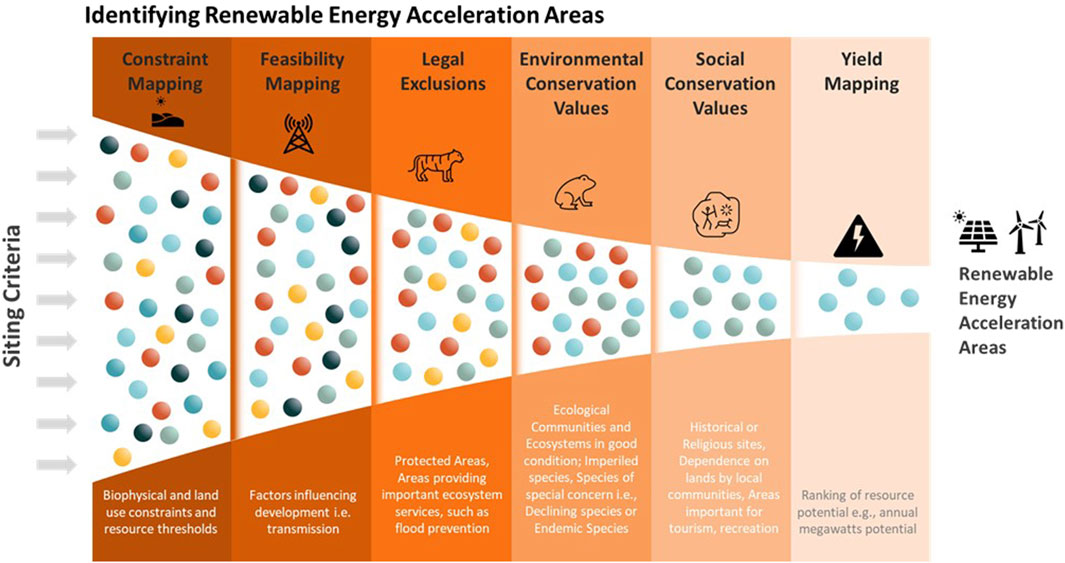
Figure 8. The design of renewable energy acceleration areas should ensure that not only the needs of energy are considered but also environmental and social values. This flow diagram illustrates the series of hierarchical filters that can guide development to areas that reduces impacts to high value lands. For details on the analyses that support these steps see Sochi et al. (2023).
We know that selecting renewable project sites with low biodiversity value and strong community backing can reduce costs and speed up the approval process. The abundance of solar and wind energy resources in Europe makes it feasible to expedite and sustainably guide development to areas that avoid conflicts and have a realistic chance of meeting country and regional climate commitments. Directing development towards areas that have already been developed could be the most effective approach to mitigate the impacts of climate change (Lawrence and Beierkuhnlein, 2023). Keeping natural habitats large and intact, as well as improving the permeability of land for the movement of individuals and ecological processes, could be the optimal way for species and ecological systems to adapt to the changing climate (Anderson et al., 2023). The potential benefits flowing to biodiversity values resulting from mitigating climate change through renewable energy deployment can only be realized if such development patterns can prevent and minimize damage to remaining natural habitats. Our evaluation is an initial step towards creating a plan that promotes sustainable renewable energy development, while still preserving areas important for people and nature.
Conclusion
Meeting the future challenge of balancing climate, nature, and communities is a significant task confronting Europe, along with many other nations, in the next decade. We advocate for policies prioritizing the implementation of renewable energy in areas that represent low environmental impacts as a strategy for achieving this equilibrium. We strongly urge the European Union government, corporate sector, and financial institutions to embrace this approach to expedite the deployment of environmentally friendly renewable energy. Our analysis serves as an initial step aimed at facilitating the shift towards a clean energy future, ensuring that it unfolds in a socially and ecologically responsible manner. Embracing these principles is not only likely to benefit conservation efforts but also the renewable energy sector by significantly reducing project delays and costs. For example, a study on solar projects in the USA revealed that permitting can be completed three times faster with costs 7%–14% lower when projects are situated in areas with low biodiversity value (Dashiell et al., 2019). Similarly, forecasts for wind energy expansion in the United States indicate potential cost increases and installed capacity decreased (by 14% by 2030 and 28% by 2050) if concerns regarding wildlife, communities, and other factors are not adequately addressed (Tegen et al., 2016).
While our analysis has concentrated on the difficulties linked to changes in land use and the socio-ecological consequences arising from the development of wind and solar energy, previous studies have demonstrated that development may yield positive environmental outcomes (Li et al., 2018). Co-location of renewables also present opportunities for landowners to reduce energy expenses and generate additional revenue streams. In the present study, we considered large-scale solar development as a consumptive land use, displacing previous land use, but opportunities for solar development to coexists with other land uses remain. Emerging research on integrating renewable energy with agricultural systems suggests that co-located energy and agriculture production could boost crop yields, offer shade for livestock in pasture lands, and augment livestock production (Kaffine, 2019). In summary, although challenges related to land use in the transition to renewable energy are likely to persist, adopting a more comprehensive perspective on costs and benefits is crucial for guiding sustainable development patterns.
Expediting the expansion of renewable energy on low-conflict lands requires that we act quickly. The renewable energy market is experiencing significant growth due to the declining costs of solar and wind development and by pressing national-level imperatives to achieve climate goals such as the EU’s Green New Deal. A swift transition to renewable energy that aligns with climate objectives requires a development strategy that proactively considers the impacts of that development on climate, conservation, and communities. Research indicates that placing renewable energy projects in areas with low biodiversity value and strong community support can lead to cost reductions and more rapid approval times (Dashiell, 2019). The abundant solar and wind energy resources, particularly in Europe, underscore the opportunities to take decisive steps to guide development sustainably towards areas that minimize conflicts, putting into reach ambitious regional climate commitments.
Data availability statement
Publicly available datasets were analyzed in this study. This data can be found here: https://www.nature.com/articles/s41597-019-0084-8.
Author contributions
JK: Conceptualization, Funding acquisition, Investigation, Methodology, Project administration, Resources, Supervision, Writing–original draft, Writing–review and editing. JE: Formal Analysis, Writing–review and editing. JO: Conceptualization, Data curation, Formal Analysis, Methodology, Writing–original draft, Writing–review and editing. KD: Writing–review and editing. IV: Writing–original draft, Writing–review and editing. ChR: Data curation, Formal Analysis, Writing–review and editing. EC: Writing–review and editing. AB: Writing–original draft, Writing–review and editing. SN: Writing–review and editing. AO: Data curation, Writing–review and editing. CaR: Data curation, Writing–review and editing. JF: Writing–review and editing. MZ: Writing–review and editing. KS: Data curation, Formal Analysis, Investigation, Methodology, Validation, Visualization, Writing–original draft, Writing–review and editing.
Funding
The author(s) declare that financial support was received for the research, authorship, and/or publication of this article. The Nature Conservancy provided all funding for staff time and other resources.
Conflict of interest
The authors declare that the research was conducted in the absence of any commercial or financial relationships that could be construed as a potential conflict of interest.
Publisher’s note
All claims expressed in this article are solely those of the authors and do not necessarily represent those of their affiliated organizations, or those of the publisher, the editors and the reviewers. Any product that may be evaluated in this article, or claim that may be made by its manufacturer, is not guaranteed or endorsed by the publisher.
Supplementary material
The Supplementary Material for this article can be found online at: https://www.frontiersin.org/articles/10.3389/fenvs.2024.1355508/full#supplementary-material
References
Abel, G. J., Brottrager, M., Crespo Cuaresma, J., and Muttarak, R. (2019). Climate, conflict and forced migration. Glob. Environ. Change 54, 239–249. doi:10.1016/j.gloenvcha.2018.12.003
Anderson, M. G., Clark, M., Olivero, A. P., Barnett, A. R., Hall, K. R., Cornett, M. W., et al. (2023). A resilient and connected network of sites to sustain biodiversity under a changing climate. Proc. Natl. Acad. Sci. 120, e2204434119. doi:10.1073/pnas.2204434119
Arneth, A., Barbosa, H., Benton, T., Calvin, K., Calvo, E., Connors, S., et al. (2019). IPCC special report on climate change, desertification, land degradation, sustainable land management, food security, and greenhouse gas fluxes in terrestrial ecosystems.
Arnett, E. B., Huso, M. M., Schirmacher, M. R., and Hayes, J. P. (2011). Altering turbine speed reduces bat mortality at wind-energy facilities. Front. Ecol. Environ. 9, 209–214. doi:10.1890/100103
Arnett, E. B., and May, R. F. (2016). Mitigating wind energy impacts on wildlife: approaches for multiple taxa. Human-Wildlife Interact. 10, 28–41. doi:10.26077/1jeg-7r13
Bampinioti, S., Christakou, N., Paulitz, B., Pöhler, L., Stevens, A., Winter, R., et al. (2023). Land: a crucial resource for Europe’s energy transition. McKinsey & Company. Available at: https://www.mckinsey.com/industries/electric-power-and-natural-gas/our-insights/land-a-crucial-resource-for-the-energy-transition#/ (Accessed August 6, 2023).
Baruch-Mordo, S., Kiesecker, J. M., Kennedy, C. M., Oakleaf, J. R., Opperman, J. J., et al. (2019). From Paris to practice: sustainable implementation of renewable energy goals. Environmental Research Letters. 14, 024013. doi:10.1088/1748-9326/aaf6e0
Belaïd, F. (2022). Implications of poorly designed climate policy on energy poverty: global reflections on the current surge in energy prices. Energy Res. Soc. Sci. 92, 102790. doi:10.1016/j.erss.2022.102790
Bolinger, M., and Bolinger, G. (2022). Land requirements for utility-scale PV: an empirical update on power and energy density. IEEE J. Photovoltaics 12, 589–594. doi:10.1109/jphotov.2021.3136805
Büntgen, U., Urban, O., Krusic, P. J., Rybníček, M., Kolář, T., Kyncl, T., et al. (2021). Recent European drought extremes beyond Common Era background variability. Nat. Geosci. 14, 190–196. doi:10.1038/s41561-021-00698-0
Burt, M., Firestone, J., Madsen, J. A., Veron, D. E., and Bowers, R. (2017). Tall towers, long blades and manifest destiny: the migration of land-based wind from the Great Plains to the thirteen colonies. Appl. Energy 206, 487–497. doi:10.1016/j.apenergy.2017.08.178
Dashiell, S., Buckley, M., and Mulvaney, D. (2019). Green light study: economic and conservation benefits of low-impact solar siting in California. ECONorthwest Nat. Conservancy.
de Lucas, M., Ferrer, M., Bechard, M. J., and Muñoz, A. R. (2012). Griffon vulture mortality at wind farms in southern Spain: distribution of fatalities and active mitigation measures. Biol. Conserv. 147, 184–189. doi:10.1016/j.biocon.2011.12.029
Dinesh, H., and Pearce, J. M. (2016). The potential of agrivoltaic systems. Renew. Sustain. Energy Rev. 54, 299–308. doi:10.1016/j.rser.2015.10.024
Doukas, H., and Nikas, A. (2022). Europe’s energy crisis-climate community must speak up. Nature 608, 472. doi:10.1038/d41586-022-02199-5
Durá-Alemañ, C. J., Moleón, M., Pérez-García, J. M., Serrano, D., and Sánchez-Zapata, J. A. (2023). Climate change and energy crisis drive an unprecedented EU environmental law regression. Conserv. Lett. 16, e12958. doi:10.1111/conl.12958
European Union, Copernicus Land Monitoring Service, European Environment Agency (EEA) (2018). Corine land cover (CLC) 2018, version 2020_20u1. Copenhagen, Denmark: European Environment Agency EEA.
Fargione, J., Kiesecker, J., Slaats, M. J., and Olimb, S. (2012). Wind and wildlife in the northern great plains: identifying low-impact areas for wind development. PLOS ONE 7, e41468. doi:10.1371/journal.pone.0041468
Fjellheim, E. M. (2023). “You can kill us with dialogue:” critical perspectives on wind energy development in a nordic-saami green colonial context. Hum. Rights Rev. 24, 25–51. doi:10.1007/s12142-023-00678-4
González, A., and Sobrini, I. (2023). Environmental assessment simplification in Spain: streamlining or weakening procedures? Impact Assess. Proj. Apprais. 41, 190–193. doi:10.1080/14615517.2023.2170094
Gustafson, E. J., and Parker, G. R. (1992). Relationships between landcover proportion and indices of landscape spatial pattern. Landsc. Ecol. 7, 101–110. doi:10.1007/BF02418941
Heiner, M., Hinchley, D., Fitzsimons, J., Weisenberger, F., Bergmann, W., McMahon, T., et al. (2019). Moving from reactive to proactive development planning to conserve Indigenous community and biodiversity values. Environ. Impact Assess. Rev. 74, 1–13. doi:10.1016/j.eiar.2018.09.002
Hernandez, R. R., Hoffacker, M. K., Murphy-Mariscal, M. L., Wu, G. C., and Allen, M. F. (2015). Solar energy development impacts on land cover change and protected areas. Proc. Natl. Acad. Sci. 112, 13579–13584. doi:10.1073/pnas.1517656112
Hoffmann, R., Muttarak, R., Peisker, J., and Stanig, P. (2022). Climate change experiences raise environmental concerns and promote Green voting. Nat. Clim. Change 12, 148–155. doi:10.1038/s41558-021-01263-8
Johnson, J. A., Kennedy, C. M., Oakleaf, J. R., Baruch-Mordo, S., Polasky, S., and Kiesecker, J. (2021). Energy matters: mitigating the impacts of future land expansion will require managing energy and extractive footprints. Ecol. Econ. 187, 107106. doi:10.1016/j.ecolecon.2021.107106
Jones, N. F., Pejchar, L., and Kiesecker, J. M. (2015). The energy footprint: how oil, natural gas, and wind energy affect land for biodiversity and the flow of ecosystem services. BioScience. 65, 290–301. doi:10.1093/biosci/biu224
Kaffine, D. T. (2019). Microclimate effects of wind farms on local crop yields. J. Environ. Econ. Manag. 96, 159–173. doi:10.1016/j.jeem.2019.06.001
Kehoe, L., dos Reis, T. N. P., Meyfroidt, P., Bager, S., Seppelt, R., Kuemmerle, T., et al. (2020). Inclusion, transparency, and enforcement: how the EU-Mercosur trade agreement fails the sustainability test. One Earth 3, 268–272. doi:10.1016/j.oneear.2020.08.013
Kennedy, C. M., Fariss, B., Oakleaf, J. R., Garnett, S. T., Fernández-Llamazares, Á., Fa, J. E., et al. (2023). Indigenous Peoples’ lands are threatened by industrial development; conversion risk assessment reveals need to support Indigenous stewardship. One Earth 6, 1032–1049. doi:10.1016/j.oneear.2023.07.006
Kennedy, C. M., Hawthorne, P. L., Miteva, D. A., Baumgarten, L., Sochi, K., Matsumoto, M., et al. (2016). Optimizing land use decision-making to sustain Brazilian agricultural profits, biodiversity and ecosystem services. Biol. Conserv. 204, 221–230. doi:10.1016/j.biocon.2016.10.039
Kiesecker, J. M., and Naugle, D. E. (2017). “Energy sprawl solutions: balancing global development and conservation,” in Page energy Sprawl solutions: balancing global development and conservation (Washington, DC, United States: Island Press-Center for Resource Economics).
Kiesecker, J. M., Evans, J. S., Fargione, J., Doherty, K., Foresman, K. R., Kunz, T. H., et al. (2011). Win-Win for Wind and Wildlife: A Vision to Facilitate Sustainable Development. PLoS ONE 6, e17566. doi:10.1371/journal.pone.0017566
Kryszk, H., Kurowska, K., Marks-Bielska, R., Bielski, S., and Eźlakowski, B. (2023). Barriers and prospects for the development of renewable energy sources in Poland during the energy crisis. Energies 16, 1724. doi:10.3390/en16041724
Kyllmann, C. (2022). German coal region brings phase-out forward to 2030 but refires lignite short-term. Available at: https://www.cleanenergywire.org/news/german-coal-region-brings-coal-phase-out-forward-2030-refires-lignite-short-term.
Landini, F., and Rashad, M. (2022). Greece will keep coal-fired plants running for longer amid gas crisis. London, United Kingdom: Reuters.
Lawrence, A., and Beierkuhnlein, C. (2023). Detecting low fragmented sites surrounding European protected areas – implications for expansion of the Natura 2000 network. J. Nat. Conservation 73, 126398. doi:10.1016/j.jnc.2023.126398
Lenton, T. M., Rockström, J., Gaffney, O., Rahmstorf, S., Richardson, K., Steffen, W., et al. (2019). Climate tipping points — too risky to bet against. Nature 575, 592–595. doi:10.1038/d41586-019-03595-0
Li, Y., Kalnay, E., Motesharrei, S., Rivas, J., Kucharski, F., Kirk-Davidoff, D., et al. (2018). Climate model shows large-scale wind and solar farms in the Sahara increase rain and vegetation. Science 361, 1019–1022. doi:10.1126/science.aar5629
Lopez, A., Roberts, B., Heimiller, D., Blair, N., and Porro, G. (2012). U.S. Renewable energy technical potentials. A GIS-based analysis. Golden, CO, United States: National Renewable Energy Lab NREL.
Mamun, M. A. A., Dargusch, P., Wadley, D., Zulkarnain, N. A., and Aziz, A. A. (2022). A review of research on agrivoltaic systems. Renew. Sustain. Energy Rev. 161, 112351. doi:10.1016/j.rser.2022.112351
Marques, A. T., Santos, C. D., Hanssen, F., Muñoz, A.-R., Onrubia, A., Wikelski, M., et al. (2020). Wind turbines cause functional habitat loss for migratory soaring birds. J. Animal Ecol. 89, 93–103. doi:10.1111/1365-2656.12961
May, R., Reitan, O., Bevanger, K., Lorentsen, S.-H., and Nygård, T. (2015). Mitigating wind-turbine induced avian mortality: sensory, aerodynamic and cognitive constraints and options. Renew. Sustain. Energy Rev. 42, 170–181. doi:10.1016/j.rser.2014.10.002
Microsoft, The Nature Conservancy, and Planet (2023). Global renewables Watch. Available at: https://www.globalrenewableswatch.org/.
Mišík, M. (2022). The EU needs to improve its external energy security. Energy Policy 165, 112930. doi:10.1016/j.enpol.2022.112930
Oakleaf, J. R., Kennedy, C. M., Baruch-Mordo, S., Gerber, J. S., West, P. C., Johnson, J. A., et al. (2019). Mapping global development potential for renewable energy, fossil fuels, mining and agriculture sectors. Sci. Data 6, 101–117. doi:10.1038/s41597-019-0084-8
Obermeyer, B., Manes, R., Kiesecker, J., Fargione, J., and Sochi, K. (2011). Development by design: Mitigating wind development’s impacts on wildlife in Kansas. PLoS ONE 6. doi:10.1371/journal.pone.0026698
Portala, J. (2022). Europe’s heatwave may have caused more than 20,000 “excess” deaths. London, United Kingdom: Reuters.
R Core Team (2023). R: a language and environment for statistical computing. Vienna, Austria: R Foundation for Statistical Computing.
Rehling, F., Delius, A., Ellerbrok, J., Farwig, N., and Peter, F. (2023). Wind turbines in managed forests partially displace common birds. J. Environ. Manag. 328, 116968. doi:10.1016/j.jenvman.2022.116968
Richter, F. (2021). This data shows the number of large-scale fires across Europe. Available at: https://www.weforum.org/agenda/2021/08/extreme-fire-season-in-europe/.
Ripple, W., Wolf, C., Newsome, T., Barnard, P., Moomaw, W., and Grandcolas, P. (2019). World scientists’ warning of a climate emergency. BioScience. doi:10.1093/biosci/biz088
Rosenow, J. (2022). Europe on the way to net zero: what challenges and opportunities? PLOS Clim. 1, e0000058. doi:10.1371/journal.pclm.0000058
Rosslowe, C., Cremona, E., and Harrison, T. (2022). New Generation: building a clean European electricity system by 2035. London, UK: Ember.
Rousi, E., Kornhuber, K., Beobide-Arsuaga, G., Luo, F., and Coumou, D. (2022). Accelerated western European heatwave trends linked to more-persistent double jets over Eurasia. Nat. Commun. 13, 3851. doi:10.1038/s41467-022-31432-y
Ryberg, D. S., Tulemat, Z., Stolten, D., and Robinius, M. (2020). Uniformly constrained land eligibility for onshore European wind power. Renewable Energy. 146, 921–931. doi:10.1016/j.renene.2019.06.127
Schumacher, D. L., Zachariah, M., Otto, F., Barnes, C., Philip, S., Kew, S., et al. (2022). High temperatures exacerbated by climate change made 2022 Northern Hemisphere soil moisture droughts more likely. United Kingdom: World Weather Attribution. Available at: https://www.worldweatherattribution.org/high-temperatures-exacerbated-by-climate-change-made-2022-northern-hemisphere-droughts-more-likely/
Sochi, K., Oakleaf, J. R., Bhattacharjee, A., Evans, J. S., Vejnović, I., Zorica Dropuljić, K., et al. (2023). Mapping a sustainable renewable energy transition: handbook for practitioners version 1. The Nature Conservancy.
Solar Power Europe, and LUT University (2020). 100% renewable Europe: how to make Europe’s energy system climate-neutral before 2050.
Swift, T. L., and Hannon, S. J. (2010). Critical thresholds associated withhabitat loss: a review of the concepts, evidence, and applications. Biol. Rev. 85, 35–53. doi:10.1111/j.1469-185x.2009.00093.x
Tegen, S., Lantz, E., Mai, T., Heimiller, D., Hand, M., and Ibanez, E. (2016). An initial evaluation of siting considerations on current and future wind deployment. United States: NREL.
Thaxter, C. B., Buchanan, G. M., Carr, J., Butchart, S. H., Newbold, T., Green, R. E., et al. (2017). Bird and bat species’ global vulnerability to collision mortality at wind farms revealed through a trait-based assessment. Proc. R. Soc. B Biol. Sci. 284, 20170829. doi:10.1098/rspb.2017.0829
Todorović, I. (2022). Romania to accelerate coal phaseout deadline to 2030. Available at: https://balkangreenenergynews.com/romania-to-accelerate-coal-phaseout-deadline-to-2030/.
Trommsdorff, M., Kang, J., Reise, C., Schindele, S., Bopp, G., Ehmann, A., et al. (2021). Combining food and energy production: design of an agrivoltaic system applied in arable and vegetable farming in Germany. Renew. Sustain. Energy Rev. 140, 110694. doi:10.1016/j.rser.2020.110694
UNEP-WCMC and IUCN (2020). Protected planet: the World Database on protected areas (WDPA) and World Database on other effective area-based conservation measures (WD-OECM) [online]. Cambridge, UK: UNEP-WCMC and IUCN.
Wu, G. C., Deshmukh, R., Ndhlukula, K., Radojicic, T., Reilly-Moman, J., Phadke, A., et al. (2017). Strategic siting and regional grid interconnections key to low-carbon futures in African countries. Proc. Natl. Acad. Sci. 114, E3004–E3012. doi:10.1073/pnas.1611845114
Keywords: climate mitigation, development scenarios, energy impacts, energy policy, energy sprawl, energy transition, land use change, renewable energy
Citation: Kiesecker JM, Evans JS, Oakleaf JR, Dropuljić KZ, Vejnović I, Rosslowe C, Cremona E, Bhattacharjee AL, Nagaraju SK, Ortiz A, Robinson C, Ferres JL, Zec M and Sochi K (2024) Land use and Europe’s renewable energy transition: identifying low-conflict areas for wind and solar development. Front. Environ. Sci. 12:1355508. doi: 10.3389/fenvs.2024.1355508
Received: 15 December 2023; Accepted: 22 March 2024;
Published: 09 April 2024.
Edited by:
Farrukh Chishtie, University of British Columbia, CanadaReviewed by:
Jonas Schwaab, ETH Zürich, SwitzerlandPaweł Tomczyk, Wroclaw University of Environmental and Life Sciences, Poland
Matheus Koengkan, University of Aveiro, Portugal
Copyright © 2024 Kiesecker, Evans, Oakleaf, Dropuljić, Vejnović, Rosslowe, Cremona, Bhattacharjee, Nagaraju, Ortiz, Robinson, Ferres, Zec and Sochi. This is an open-access article distributed under the terms of the Creative Commons Attribution License (CC BY). The use, distribution or reproduction in other forums is permitted, provided the original author(s) and the copyright owner(s) are credited and that the original publication in this journal is cited, in accordance with accepted academic practice. No use, distribution or reproduction is permitted which does not comply with these terms.
*Correspondence: Joseph M. Kiesecker, jkiesecker@tnc.org