Research on the spatial spillover effect of carbon trading market development on regional emission reduction
 Yuxin Cui
  Wei Feng
 Xuesong Gu
- School of Economics and Management, Beijing Forestry University, Beijing, China
This paper introduces the current situation of carbon trading market in China and the effect of carbon emission reduction in each region. Theoretically, it expounds the influence mechanism and spatial spillover way of carbon trading market on regional carbon emission. Next, we use the data of 30 provinces in China from 2006 to 2019 to build a continuous spatial difference in difference model (SDM-DID) to empirically study the spatial spillover effect of carbon trading market on regional emission reduction. The results are as follows: First, the implementation of the pilot policy of carbon emission trading has significantly promoted the carbon emission reduction in the pilot areas. From the perspective of impact mechanism, the implementation of carbon trading pilot policy promotes carbon emission reduction in pilot areas by promoting clean transformation of energy consumption structure, improving technology absorption capacity and stimulating development of low-carbon technologies. From the perspective of spatial spillover effect, China’s regional carbon emissions have significant spatial spillover effect, and carbon emissions trading has spatial spillover effect. From the perspective of spatial spillover, the carbon emission trading market promotes the carbon emission reduction in neighboring areas by promoting the clean transformation of energy structure in neighboring areas, improving technology absorption capacity and promoting technological progress.
1 Introduction
As countries around the world pay more and more attention to environmental protection, governments have formulated relevant laws or policies to limit or reduce greenhouse gas emissions in industrial activities. At present, China has become the world’s largest carbon emission country, and low-carbon transformation is imminent. The Chinese government has introduced many emission reduction policies, among which the carbon emission trading mechanism is widely used in the world as a means of carbon emission reduction. Carbon emission trading (hereinafter referred to as carbon trading) aims to promote global greenhouse gas emission reduction and reduce global carbon dioxide emissions. The carbon trading market adopts market-oriented means to achieve the purpose of controlling carbon emissions. Since June 2013, carbon trading markets have been gradually established in Beijing, Tianjin, Shanghai, Chongqing, Hubei, Guangdong, Shenzhen and other places. In December 2017, with the approval of The State Council, the National Development and Reform Commission issued the “National Carbon Emission Trading Market Construction Plan (Power generation industry)", which marked the official launch of the national carbon market construction. As of 31 March 2023, the cumulative volume of carbon emission allowances in the national carbon emission rights trading market was 233 million tons, with a turnover of 10.662 billion yuan. The cumulative volume of domestic regional carbon market quota was 599 million tons, with a turnover of 16.406 billion yuan. With the continuous expansion of carbon trading scale, China’s carbon trading system has gradually matured and improved.
China’s carbon trading pilot has gone through 10 years, and the national carbon trading market has been established. The market is active in trading, stable in operation and has good prospects for development. The main purpose of the construction of carbon trading market is to promote regional emission reduction by market-based means, which will encourage most enterprises to achieve carbon emission reduction by various means. In this context, have carbon trading pilot areas achieved carbon emission reduction? What are the specific influencing mechanisms? Due to the rapid development of inter-regional communication and transportation, inter-regional links are becoming more and more closer. There is no geographical constraint on carbon dioxide emissions, and the geographical environment and resource endowment of neighboring regions are similar. So it is highly likely that there is a certain spatial correlation of carbon dioxide between regions. In this context, has carbon trading led to carbon reduction in other regions? Is there a spatial spillover effect of carbon reduction to promote coordinated development between regions?
The existing literature mainly studies the carbon emission trading market from the following three aspects. First, for the operation of the carbon trading market, domestic and foreign scholars have mainly conducted exploratory studies on the liquidity and effectiveness of carbon trading markets. Some scholars also evaluated the development level of carbon trading market. Yi et al. (2018) tried to construct an evaluation index system and evaluated the development of seven carbon trading pilots in China from three dimensions. Chen et al. (2020) constructed the carbon finance development evaluation index system to measure the development level of China’s carbon finance. Ma and Li (2023) conducted qualitative analysis and quantitative calculation of the development status of China’s carbon trading market, and on this basis, through empirical analysis, studied the reasons leading to the imbalance of regional development of China’s carbon trading market. Second, for the impact of carbon market trading, Fujimori et al. (2015) used welfare losses related to climate mitigation to evaluate the effectiveness of carbon emission trading, and found that carbon emission trading can help reduce economic losses related to climate mitigation through research. Zhan and Gan (2023) adopted the staggered differential method and found that enterprises’ participation in the carbon emission trading market could improve their financial performance. More scholars use DID model to evaluate the impact and mechanism of carbon trading market. For example, He (2022) empirically tested the impact of carbon trading market on enterprise innovation strategies by comprehensively applying differential and other methods. Third, for carbon trading market system and pricing, research on carbon trading price mainly focuses on the pricing of carbon emission rights and financial derivatives (Zhao et al., 2017; Lee, 2019). Hao and Tian (2020) proposed a hybrid forecasting framework for carbon price forecasting that considers multiple influencing factors, which can be used as an effective forecasting tool for carbon trading market forecasting and management.
It is very important to study the influencing factors of carbon emission to choose the path of carbon emission reduction. Most scholars conduct research from a non-financial perspective (Ren and Long, 2022). Yang (2023) pointed out that population density, urbanization level and industrial structure would promote carbon emission. A small number of scholars have studied the influencing factors of carbon emissions from the perspective of finance. Scholars have used data analysis from various countries to confirm the conclusion that financial development can promote carbon reduction. Shanhbaz et al. (2013) concluded through empirical research that Malaysia’s financial development reduced carbon emissions, while energy consumption and economic growth increased carbon emissions.
As for the research on the emission reduction effect of carbon trading policy, most of the existing literature adopts the intermediary effect, DID and other methods to study carbon emission reduction. Some scholars (Liu et al., 2022; Zhang et al., 2023) found that carbon trading policy has a significant promoting effect on carbon emission reduction in pilot areas. Cheng and Xiao (2023) empirically tested the action path and generation mechanism of the impact of carbon trading policies from the perspectives of mechanism channels, spatial correlation and policy coordination. The results show that the carbon trading policy can significantly promote the carbon emission reduction in the pilot areas, and there is a certain policy expected effect. Ren and liu (2023) comprehensively evaluated the baud effect and carbon emission reduction effect of carbon trading policy based on multi-period differential method and synthetic control method. And the research results showed that carbon trading policy brought about obvious carbon emission reduction effect and Baud effect. Liu et al. (2023) studied carbon emission reduction from the perspective of the power industry. The research showed that carbon trading policy significantly promoted carbon emission reduction in the power industry, and the longer the implementation of carbon trading policy, the stronger the inhibition effect.
Currently, there are fewer studies on whether there is a spatial spillover effect of carbon emission reduction in carbon trading to drive carbon emission reduction in neighboring regions, thus promoting interregional synergistic development. Spillover effect is a dynamic process and its formation mechanism is also very complex. The main research on spillover effect includes the spillover brought about by technological innovation. For example, Wei et al. (2019) pointed out that technological innovation has spatial correlation and spatial spillover effect. Some scholars use the spatial econometric model to study the spatial spillover effect of carbon emissions. For example, Du (2023) found that the development of digital economy has a significant promoting effect on carbon emissions and a negative spatial spillover effect on carbon emissions in spatially related regions. Yuan (2023) found that there is a positive spatial correlation of carbon emissions among cities in the Yangtze River Economic Belt. The impact of digital financial development in neighboring regions on local carbon emissions shows an inverted “U” type relationship, promoting first and then inhibiting. The enhancement of its carbon emission reduction capacity can effectively promote local carbon emission reduction. Liu and Zhong (2023) tested the spatial spillover effect and action path of carbon emission reduction through the intermediary effect test. And they found that carbon emission rights trading has positive spatial spillover effect.
Yang and Ding (2023) used SCM and S-DID methods to quantitatively analyze the policy effects and spatial effects of carbon trading policies in pilot provinces and cities. Wang and Li (2022) built a spatial difference in difference model and concluded that the adjustment of energy consumption structure formed the policy spillover effect and promoted the carbon emission reduction in neighboring regions. All these prove that the spatial difference in difference method is feasible to study the spatial spillover effect of regional emission reduction. Based on extensive reference to theories and literature results, we adopt a combination of normative theory and empirical research to explore the impact of carbon trading market on regional carbon emission reduction and spatial spillover effects. Firstly, the mechanism and spatial spillover path of carbon trading market on regional carbon emissions are explained theoretically. Then, the spatial spillover effect of carbon trading market on regional emission reduction is studied by using SDM-DID method based on spatial Dubin model. The spatial spillover effect is further disassembled by the deformation of spatial Dubin model to explore the impact of carbon trading market on carbon emissions.
To sum up, this paper has the following innovations and major contributions:
First, this paper improves the traditional differential method and adopts the continuous spatial difference in difference method. At present, most of the studies on the emission reduction effect of carbon trading are conducted by synthetic control method and DID method. Few studies consider its spatial spillover effect. By testing the spatial correlation of China’s carbon emissions, we conclude that there is indeed a spatial positive correlation. The SDM-DID model is constructed to analyze the spatial spillover effect of the development of China’s carbon trading market on regional carbon emission reduction, enriching the relevant research on the spatial spillover effect of carbon trading.
Second, we use the volume and turnover of carbon emission allowances to represent the development level of the carbon trading market instead of the 0–1 dummy variable, and makes an empirical analysis of the regional emission reduction spatial spillover effect of the carbon trading market. It provides theoretical support for the establishment of a national unified carbon market. At present, there are only a few studies on the spatial spillover effect of carbon trading, which mainly study the spatial spillover effect of carbon trading pilot policies. And they are impossible to measure the impact of carbon trading markets at different development levels on carbon emissions, but only the average effect of carbon trading pilot policies on carbon emissions can be investigated. In this paper, the volume and turnover of carbon emission quota are used to study its spatial spillover effect, which can not only represent the impact of policies, but also measure the impact of carbon trading markets at different levels of development on carbon emissions. It also enriches the relevant research on the spatial spillover effect of carbon trading markets. It has certain reference significance for the country to vigorously build the national carbon market and expand the scope of emission control enterprises entering the carbon trading market.
Thirdly, we put forward the idea of constructing spatial weight matrix from three dimensions: geographical distance, economic distance and new economic distance. At present, there is a lack of research on the transmission mechanism of regional emission reduction promoted by the development of carbon trading market. We construct S-DID model to estimate the emission reduction effect brought about by the increase in the development level of carbon trading. It also studies the spatial spillover mechanism of carbon emission reduction caused by the development of carbon market through energy structure, technology absorption capacity and technological progress. It has certain reference significance for provinces to formulate carbon emission reduction policies and smooth the carbon trading transmission path.
2 Theoretical mechanism
2.1 Theoretical mechanism for the development of carbon trading market to promote regional emission reduction
The main purpose of the carbon trading market is to promote emissions reduction, and most companies will adopt various ways to achieve carbon reduction. First, we need to achieve a clean transformation of the energy structure. Carbon trading encourages enterprises to optimize energy consumption structure through cost pressure, and energy consumption structure is the most direct and effective factor affecting carbon emission reduction. Under the carbon trading system, carbon emissions are endogenous emission reduction costs for enterprises. In order to reduce the marginal cost of emission reduction and obtain more marginal benefits, high energy-consuming industries such as power and steel will inevitably reduce their use of fossil energy. They will tend to use clean energy and adopt low-carbon energy to replace high-carbon energy, thus promoting carbon emission reduction in the whole region. Secondly, it will improve technology absorption capacity. The implementation of carbon trading policy will attract and cultivate high-level talents in related industries. The high-level talents often have strong technology absorption capacity and can provide more experience in carbon trading management, providing intellectual support and talent guarantee for carbon trading and carbon emission reduction in the region. Third, we should increase investment in research and development to achieve low-carbon technological innovation and technological progress. In order to achieve long-term regional carbon emission reduction and sustainable development, emission control enterprises must carry out low-carbon technology innovation, increase R&D investment, improve technological innovation level, improve production efficiency and energy utilization rate. By doing these, emission control enterprises can improve the market competitiveness, and we can promote low-carbon technological innovation in the entire region, and ultimately realize regional carbon emission reduction.
2.2 Analysis of the spatial spillover path of the development of carbon trading market to regional carbon emission reduction
The government should reasonably set the annual total carbon emission quota according to the requirements of the carbon intensity reduction target. After the quota is allocated, if the company’s annual carbon emissions exceed this quota, it must buy from the government or on the carbon trading market, or it will be penalized. If it falls below this quota, it can be converted into carbon emission allowances and traded in the carbon trading market according to certain rules. Faced with the pressure of carbon emission quota restriction, trading entities are faced with two choices: First, enterprises can keep their own carbon emissions below their quotas by reducing total energy consumption, increasing investment in research and development, and using clean energy. The remaining quota can be sold to other subjects through the carbon trading market for profit. Secondly, enterprises cannot reduce their carbon emissions below the quota on their own, but can only choose to pay a fine or purchase carbon emission rights at market prices in the carbon trading market to offset the carbon emissions exceeded by their own production activities.
In summary, it is clear that most companies will adopt the first option, which is to achieve carbon reduction through various means. First, achieving a clean transformation of the energy structure. Second, attracting and cultivating high-level talents in related industries. Third, increasing investment in research and development to achieve low-carbon technological innovation and technological progress. It is highly likely that there is a certain spatial correlation of carbon dioxide between regions, and the development of carbon trading markets may have a spatial spillover effect on regional carbon emission reduction.
(1) The spillover effect of the development of carbon trading market on carbon emission reduction through the clean transformation of energy consumption structure.
In order to reduce marginal emission reduction costs and obtain more marginal benefits, emission control enterprises in pilot areas will inevitably reduce the use of fossil energy, tend to use clean energy, adopt low-carbon energy to replace high-carbon energy, and adjust the energy structure to reduce carbon emissions. Therefore, carbon trading can promote the clean transformation of energy structure in pilot areas, and the utilization of clean energy will drive neighboring areas to reduce the use of fossil energy, tend to use clean energy, adopt low-carbon energy to replace high-carbon energy, and ultimately drive the clean transformation of energy structure in neighboring areas. Yang and Ding (2023) found that carbon emission reduction could be achieved by changing the energy consumption structure. The increase in the cost of carbon emissions and the opportunity cost of carbon trading also relatively raises the marginal returns to energy structure optimization. Enterprises are prompted to shift from high-carbon fossil energy sources to cleaner and low-carbon energy sources with lower carbon emission factors, changing the regional energy consumption structure and thus realizing a reduction in carbon intensity.
(2) The spillover effect of the development of carbon trading market on carbon emission reduction through the improvement of technology absorption capacity.
Regions with higher levels of carbon trading markets will attract and train high-level talent in related industries. High-level talents often have strong technology absorption capacity and can provide more experience in carbon trading management. The development of carbon trading requires innovative thinking and creative ability, which is where high-level talents have an advantage. Talents have a wealth of knowledge and experience, and they are able to identify problems, propose low-carbon solutions, and translate them into practical low-carbon technology applications. Talents can deeply absorb the technology and provide intellectual support and talent guarantee for carbon trading and carbon emission reduction in the region. Finally, an increase in the level of carbon trading development can improve the attractiveness to high-level talents in neighboring regions, provide more experience in carbon trading management and low-carbon technology application, and provide more innovative thinking and innovation capabilities. The talents will absorb the technology in depth, thus improving the technology absorption capacity of the neighboring regions and promoting the emission reduction work in the neighboring regions.
(3) The spillover effect of the development of carbon trading market on carbon emission reduction through technological progress.
The development of carbon trading market has a significant effect on technological progress. Some scholars (Su, 2023) found that the implementation of carbon trading policy encourages enterprises to pay more attention to the research and development of new technologies and the mastery of core technologies, which positively promotes the independent innovation of enterprises to a certain extent. Cao and Su (2023) found that carbon trading policies significantly promoted carbon neutral technological innovation in pilot areas, and the promotion effect was significant in both the short and long term after the implementation of the policies. Du et al. (2021) study confirmed that each region can promote the improvement of local carbon emission efficiency by learning the carbon emission reduction technologies of neighboring regions. Increased investment in R&D and technological innovation related to energy and environmental protection can promote the development of low-carbon technologies and effectively reduce carbon emissions. Neighboring regions will also benefit from increased R&D investment, higher levels of technological innovation, and improved productivity and energy efficiency, thereby achieving technological progress and reducing carbon emissions in neighboring regions.
3 Empirical research design
3.1 Main variables
3.1.1 Explained variables
Among the seven carbon emission trading pilot regions listed above, Shenzhen is a city-level region and located in Guangdong Province. Considering the equivalence of the relevant variable data of provincial units, only the other six provinces are selected as representatives of the pilot regions in this paper. The carbon emission and carbon emission intensity (carbon dioxide emission per unit GDP) of each pilot area are used as explained variables to reflect the carbon emission in the process of pilot development. The combustion of fossil fuels is the main source of
Where,
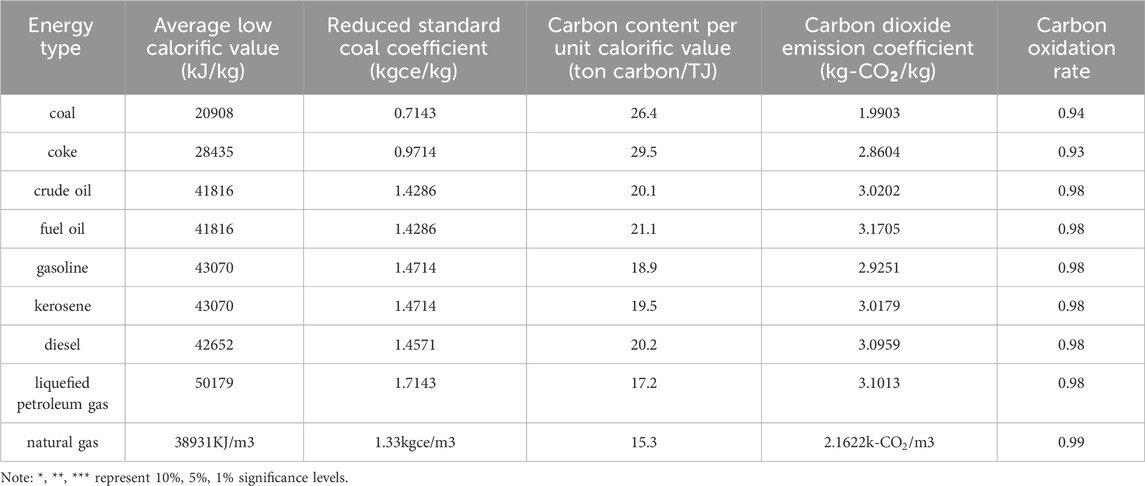
Table 1. Various energy consumption data and carbon dioxide emission coefficients.
3.1.2 Control variables
To control the influence of other factors, referring to the existing research and considering the availability of data, we select the economic development level, industrial structure, forest coverage rate and urbanization level as control variables.
Level of economic development (
Industrial structure (
Forest coverage rate (
Urbanization level (
3.1.3 Core explanatory variables
In this paper, the interaction term (
The quota trading volume of the carbon trading market (
The dummy variable of the time of the carbon trading pilot policy (post). Although the carbon trading pilot program was launched in 2011, actual trading took place after June 2013. In particular, the opening of the carbon market in the six pilot provinces of interest in this paper centered from November 2013 to June 2014, the year when carbon trading policies began to hit the pilot regions. Therefore, we take 2013 as the year when the pilot regions started to be affected by the carbon trading policy, and assigns a value of 1–2013 and the years after 2013, and a value of 0 to the years before 2013.
After the benchmark regression, the interaction term (
Data on the volume and turnover of carbon trading markets in six pilot provinces come from the WIND database.
3.1.4 The mediating variables
Energy consumption structure (
Technology absorption capacity (
Technological progress (
3.2 Data source
The data of GDP, added value of secondary industry, permanent resident population, urban population and rural population of each province at the end of the year are from China Statistical Yearbook and Statistical Yearbook of each province. The data of various energy consumption in each province are from China Energy Statistical Yearbook. The data of R&D expenditure intensity in each province are from China Statistical Yearbook on Science and Technology. The forest coverage of each province is from the China Forestry and Grassland Statistical Yearbook.
3.3 Descriptive statistics
In 2011, the “Notice on the Pilot Work of Carbon Emission Trading” was issued. Thereafter, China’s carbon emission trading market was launched one after another. Since June 2013, carbon trading markets have been gradually established in Beijing, Tianjin, Shanghai, Chongqing, Hubei, Guangdong and Shenzhen, etc. The carbon emissions in the pilot areas of carbon emission trading are shown in Figure 1. 2011 is the launch time of the carbon emission trading market in seven pilot provinces, 2013 and 2014 are the years when the pilot carbon market will be launched successively, so it can be inferred that the implementation of the pilot carbon trading policy has a significant effect on carbon emission reduction.
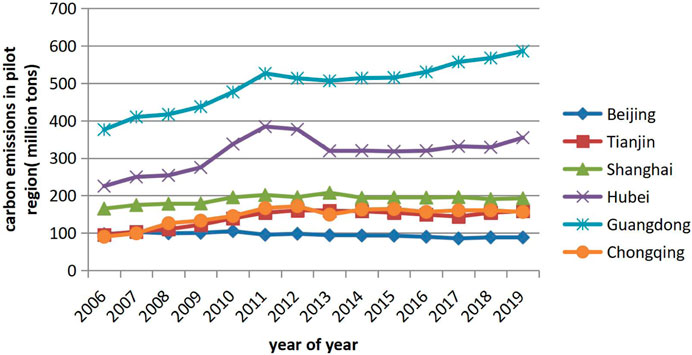
Figure 1. Carbon emissions of carbon trading pilot areas from 2006 to 2019.
Table 2 presents descriptive statistics of the relevant variables. It can be seen from the results in the table that the carbon emission level of the experimental group was significantly different from that of the control group during the study period. And the carbon emission, carbon emission intensity and per capita carbon emission of the control group were all higher than those of the experimental group. In addition, other control variables and intermediary variables were also significantly different. The experimental group’s economic development level, urbanization level, foreign investment level, financial development level, research and development investment, scientific and technological personnel were higher than the control group. Compared with the control group, the experimental group had a lower proportion of secondary industry, forest coverage, and a cleaner energy structure. In view of this, in order to make the evaluation results of the spatial differential model more realistic and effective, it is necessary to impose restrictions on other factors that change over time except policy factors. In addition, all the variables used in this paper are stationary, and there is no multicollinearity in the control variables.
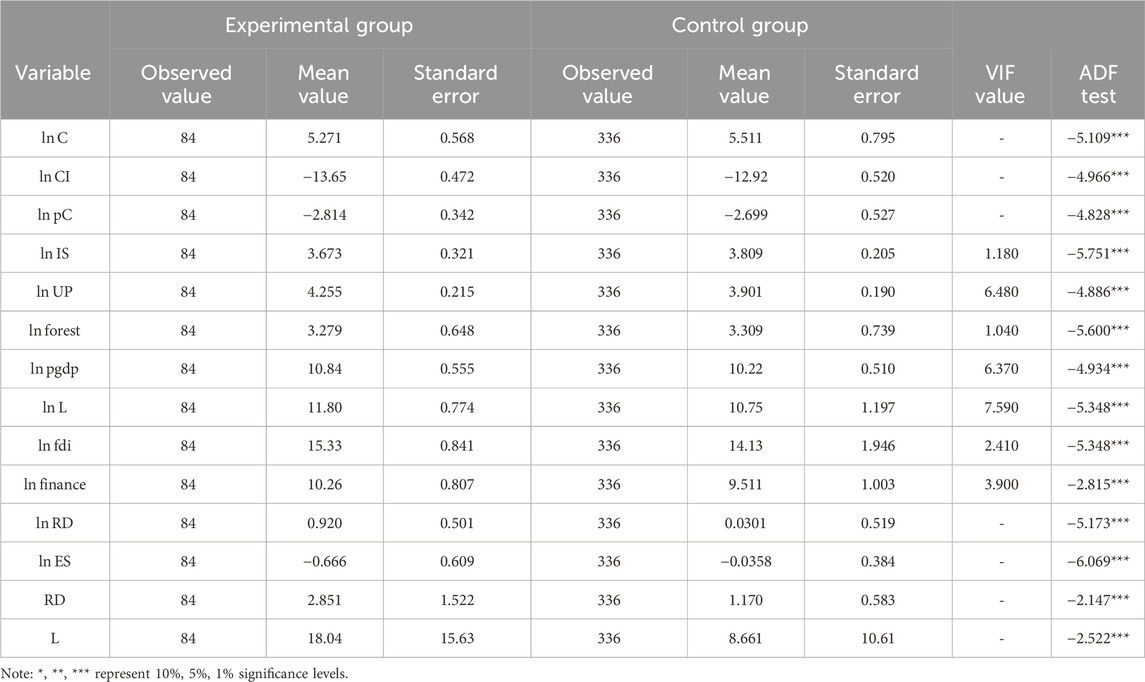
Table 2. Descriptive statistical results of main variables.
3.4 Metrological model setting
3.4.1 Model setting
In this study, a continuous S-DID model based on SEM, SAR and SDM was constructed. Formulas 2–4 represent SEM-DID model, SAR-DID model and SDM-DID model respectively:
Where
3.4.2 Decomposition of spillover effects
The partial differential method is proposed to decompose the regression coefficient of the spatial lag term of the explained variable into direct effect, indirect effect and total effect. In this paper, the general spatial Dubin model is taken as an example. The calculate formulas are given in Eqs 5–8.
Move the
Multiply both sides by
The matrix of partial differential equations with respect to the Kth variable in the dependent variable is as follows:
The direct effect measures the average effect of the level of development of the carbon trading market in a region on local carbon emissions, that is, the intra-regional spillover effect. It is equivalent to the average of the diagonal elements of the matrix in Eq. 8. The carbon trading volume in the non-pilot area is 0, so it has no impact on the carbon emissions in the local area. Therefore, the direct effect measures the impact of the level of carbon trading in the pilot regions on the region’s carbon emissions.
The indirect effect, also known as spatial spillover effect, measures the average effect of the development level of carbon trading market in neighboring areas on the local carbon emissions, that is, the inter-regional spillover effect. It is equivalent to the off-diagonal average of the matrix in Eq. 8. The carbon trading volume in non-pilot areas is 0, so it has no impact on carbon emissions in other areas. Therefore, the spatial spillover effect in this paper measures the impact of the trading level of pilot areas on the carbon emissions of other regions.
The total effect measures the average effect of the impact of the development level of carbon trading market in all regions on the carbon emissions of the region. The carbon trading volume in the non-pilot area is 0, so it will not affect the carbon emissions of the local area or other areas. So the total effect measures the effect of the trading level in pilot regions on carbon emissions in this region and other regions.
3.4.3 Test of transmission mechanism
In order to further explore the transmission mechanism and spatial characteristics of carbon trading pilot emission reduction, we use formula (4) model as the benchmark regression model to study the transmission mechanism. In the study of carbon trading policy, economic growth, technological absorption capacity and technological progress are considered to be important factors affecting carbon emissions. In this paper, energy consumption structure (
4 Empirical results and analysis
4.1 Spatial correlation analysis
4.1.1 Analysis of global Moran index
Table 3 and Figure 2 show the global Moran index of carbon emissions of 30 provinces from 2006 to 2019. It can be seen that in the sample interval from 2006 to 2019, the Moran’s I index of carbon emissions in 30 provinces is significantly greater than 0, and the standardized test value Z is positive and almost all of them are greater than 1.96. This shows that during the sample period, the global Moran’s index of carbon emissions in 30 provinces in China shows significant positive spatial correlation, and the spatial distribution of carbon emissions in China shows spatial agglomeration characteristics, with the possibility of spatial spillover. That is to say, the carbon emissions in this region will have a great impact on the carbon emissions in other regions. Therefore, when studying the effect of carbon trading market development on regional emission reduction, it is very necessary to consider spatial heterogeneity, and the selection of spatial econometric models can make the research results more reasonable and accurate.
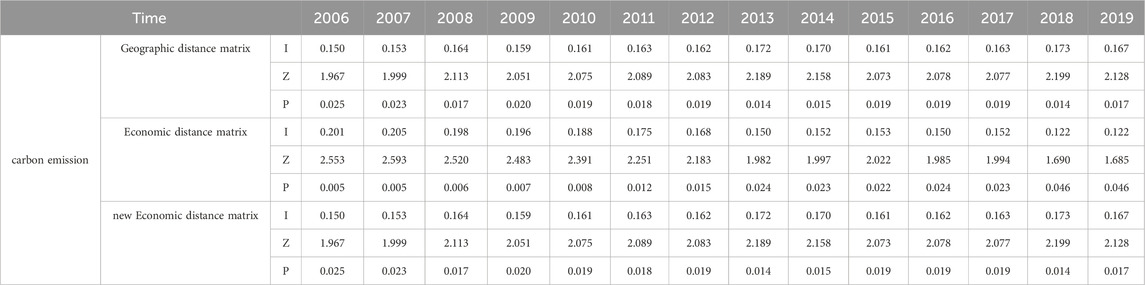
Table 3. Global autocorrelated Moran’s I index of carbon emissions.
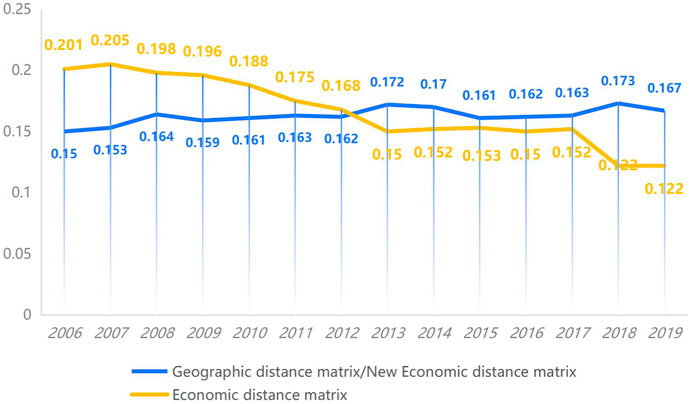
Figure 2. Global autocorrelated Moran’s I index of carbon emissions.
4.1.2 Local Moran scatter plot
The global Moreland index can only reflect that China’s regional carbon emissions are spatially positively correlated on a global scale, but the local spatial characteristics are not shown. Therefore, we further use the local Moreland scatter plot to test the local spatial correlation of regional carbon emissions, and draws the Moreland scatter plot from three time nodes in 2006, 2013, and 2019. Seeing Figures 3–5, the horizontal coordinate represents the carbon emission in the current year, and the vertical coordinate represents the carbon emission weighted by the geospatial weight matrix, that is, the spatial lag term of carbon emission. In the first and third quadrants, high values and high values, low values and low values are clustered, reflecting the spatial dependence. In the second and fourth quadrants, low values and high values, high values and low values are aggregated, reflecting the spatial dispersion. It can be seen that most provinces and cities are clustered in one or three quadrants, which also partially confirms the spatial aggregation effect of carbon emissions. From the perspective of development trend, from 2005 to 2013 and then to 2019, all provinces gradually shifted to the third quadrant, which indicates that more and more provinces’ carbon emissions gradually decreased. And more importantly, carbon emissions gradually tended to decrease.
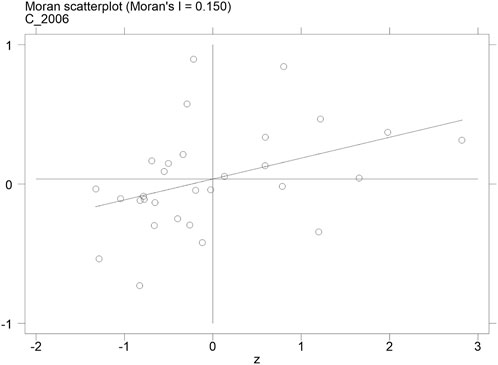
Figure 3. Local Moran scatter plot of regional carbon emissions in China in 2006.
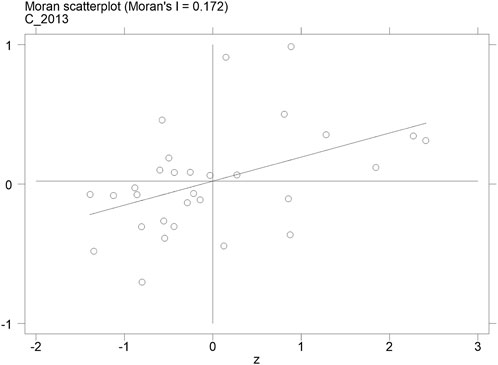
Figure 4. Local Moran scatter plot of regional carbon emissions in China in 2013.

Figure 5. Local Moran scatter plot of regional carbon emissions in China in 2019.
4.2 Analysis of results of spatial econometric model
4.2.1 Baseline regression (SDID) analysis
In order to be precise and accurate, SAR-DID, SEM-DID and SDM-DID models were used respectively for regression. According to the regression results, the coefficients of spatial lag terms of both SAR-DID model and SDM-DID model are significantly positive, indicating that the development of carbon emission trading market has policy spillover and diffusion effects on regional carbon emissions. The coefficients of
Columns (3), (6) and (9) in Table 4 list the regression results of SDM-DID model based on three spatial weight matrices. Among them, the coefficients of
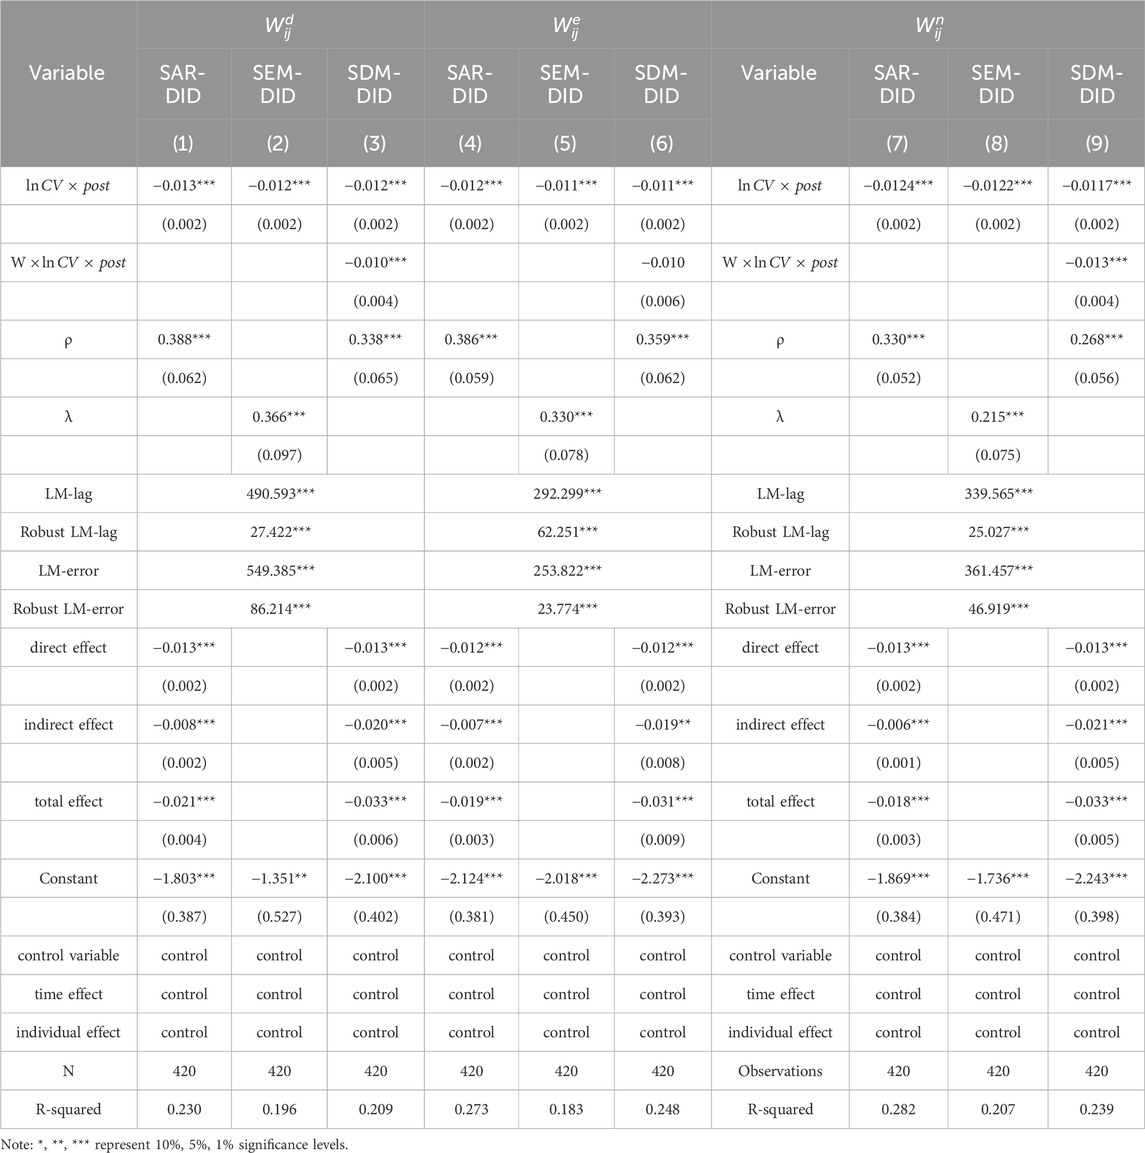
Table 4. Regression results of spatial double difference model.
4.2.2 Decomposition of spatial spillover effect
According to formula 7 of the partial differential equation, the regression coefficient can be decomposed into direct effect, indirect effect and total effect. The indirect effect is the spatial spillover effect, and the specific calculation results are shown in Table 4. As can be seen from the table, in the SDM-DID regression based on geographic matrix, the direct effect of carbon emission rights trading market is −0.0126 and the spatial spillover effect is −0.0200. In the SDM-DID regression based on economic matrix, the direct effect of carbon emission rights trading market is −0.0121 and the spatial spillover effect is −0.0192. In the SDM-DID regression based on the spatial weight matrix of the new economic distance, the direct effect of the carbon emission right trading market is −0.0127, and the spatial spillover effect is −0.0206, both of which are significant at the 1% level. It indicates that the increase of carbon emission right trading volume has an emission reduction effect on the pilot provinces, and also has an emission reduction effect on the neighboring provinces.
4.3 Robustness test
In order to verify the robustness of the benchmark regression results in this chapter, the accuracy of key conclusions is ensured as much as possible. In this section, methods such as replacing core explanatory variables, adding control variables, and eliminating policy years will be adopted in order to eliminate the possibility that these factors lead to inaccurate baseline regression results.
4.3.1 Change the core explanatory variable
The logarithm and time dummy variable (
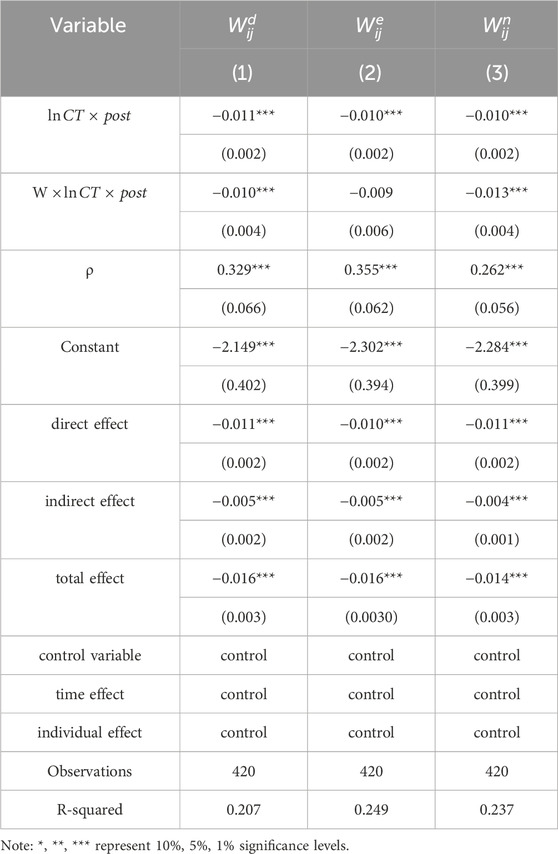
Table 5. Regression results of SDM-DID with changing core variables.
4.3.2 Increase control variables
In view of the large differences in various aspects in different regions, we add two control variables, namely the number of scientific research employees (
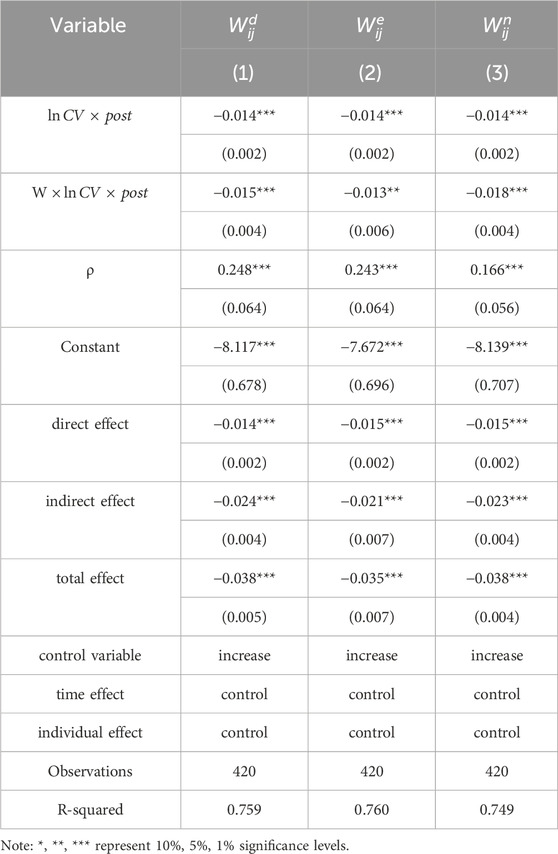
Table 6. Regression results of SDM-DID with added control variables.
4.3.3 Excluded policy year
In order to eliminate the possible measurement error, the policy implementation year 2013 is eliminated from the sample research interval. The regression results are shown in Table 7 after excluding the samples in 2013. Based on the three spatial weight matrices, the coefficients of
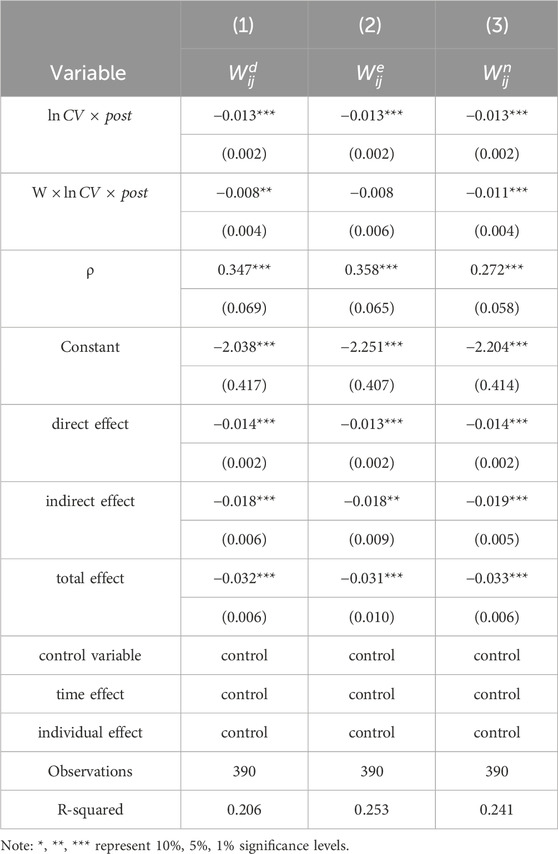
Table 7. Regression results of SDM-DID model excluding policy years.
4.4 The development of carbon trading market promotes the transmission path of carbon emission reduction
In order to further explore the transmission mechanism and spatial characteristics of carbon trading pilot emission reduction, we use the general spatial Dubin model as the benchmark regression model to study the transmission mechanism, and adopts the geographical distance matrix for regression. The regression results are shown in Table 8.
(1) Energy structure. The coefficient of the core explanatory variable is significantly negative at the level of 1%, indicating that the increase in the trading volume of carbon emission rights promotes the clean transformation of the energy structure. The spatial lag coefficient of the explained variables is significantly negative at the level of 5%, indicating that there is a cross-border conduction effect of the energy structure, and the clean transformation of the energy structure in the pilot region will significantly promote the clean transformation of the energy structure in neighboring regions. The direct effect is −0.0283, and the spatial spillover effect is −0.0339, both at the level of 1%, which indicates that the increase of carbon emission trading volume promotes the clean transformation of energy structure in the region and in neighboring regions.
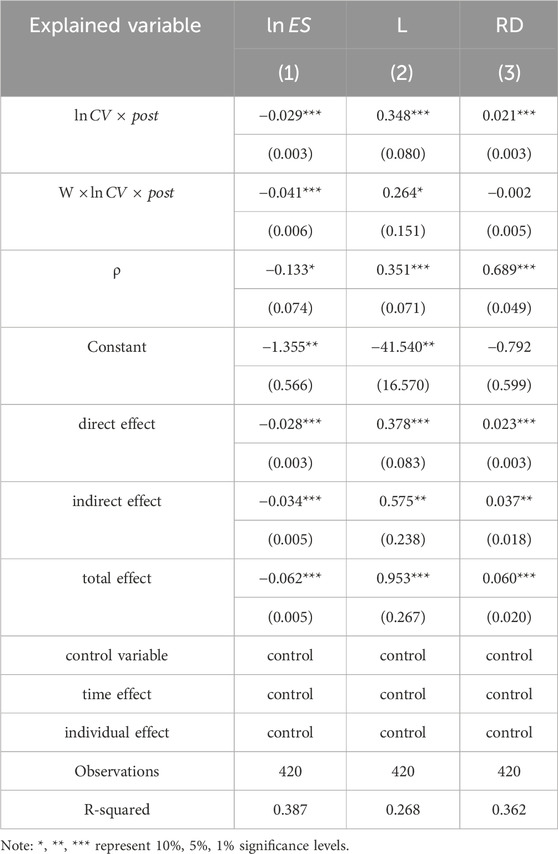
Table 8. Conduction mechanism test.
China’s energy consumption structure is dominated by coal, and coal combustion is the main source of carbon emissions. With the reduction of coal consumption, the energy structure has gradually changed to a cleaner direction, and the carbon dioxide released under the premise of the total energy consumption remains unchanged. Therefore, the improvement of the development level of carbon trading can promote the emission reduction in neighboring areas by promoting the clean transformation of the energy structure.
(2) Technology absorption capacity. The coefficient of the core explanatory variable is significantly positive at the 1% level, indicating that the increase in the volume of carbon emissions trading improves technological absorptive capacity. The spatial lag coefficient of the explanatory variables is significantly positive, indicating that there is a cross-border transmission effect of scientific research talent, and the number of scientific research talent in the pilot region will increase significantly in neighboring regions. The direct effect is 0.378 and the spatial spillover effect is 0.575, which are both significant at the 1% level, indicating that the increase in the volume of carbon emissions trading improves the technology absorption capacity in the region and neighboring regions.
(3) Technological progress. The coefficient of the core explanatory variable is significantly positive at the level of 1%, indicating that the increase in the trading volume of carbon emission rights promotes technological progress. The spatial lag coefficient of the explained variables is significantly positive, indicating that there is a cross-border conduction effect of scientific research talents, and the number of scientific research talents in the pilot area will significantly increase in the adjacent area. The direct effect is 0.0231, and the spatial spillover effect is 0.0367, both of which are significant at the level of 1%, indicating that the increase of carbon emission trading volume promotes the technological progress of both the local and neighboring regions. Technological advances allow companies to use energy more efficiently, thus releasing less carbon dioxide during normal production activities. Therefore, the improvement of the development level of carbon trading can promote the emission reduction of neighboring areas by promoting the technological progress of neighboring areas.
In the previous studies on the emission reduction effect of carbon trading policy, most scholars only came to the conclusion that carbon trading policy can significantly promote carbon emission reduction in pilot areas (Liu et al., 2022; Zhang et al., 2023). At present, a few scholars only come to the conclusion that there is spatial spillover effect of carbon emission reduction in carbon trading to drive carbon emission reduction in neighboring areas, but the research on specific transmission mechanism is still lacking (Du, 2023; Yang and Ding, 2023; Yuan, 2023). The empirical results show that the implementation of the pilot policy of carbon emissions trading has significantly promoted the carbon emission reduction in the pilot areas. China’s regional carbon emissions have a significant spatial spillover effect. The carbon emissions trading market promotes the carbon emission reduction in neighboring areas by promoting the clean transformation of energy structure in neighboring areas, improving technology absorption capacity and promoting technological progress.
5.Conclusions and policy implications
5.1 Conclusions
China gradually launched a pilot carbon trading program in 2013, and officially launched a national carbon trading market in July 2021. Exploring the impact of the development of carbon trading market on China’s regional carbon emissions and its action path can provide basis for improving the construction of carbon trading market and promoting regional carbon emission reduction. This paper firstly introduces the development status of China’s carbon trading market and the emission reduction effect of each region, and theoretically expounds the influence mechanism and spatial spillover path of the development of carbon trading market on regional carbon emissions. Then, using the data of 30 provinces in China from 2006 to 2019, the spatial difference in difference model (SDM-DID) was constructed to conduct an empirical analysis of the spatial spillover effect of carbon trading market development on regional emission reduction. The results are as follows:
First, from the viewpoint of spatial spillover effect, China’s regional carbon emissions have a significant spatial spillover effect, and carbon emissions trading has a spatial spillover effect. That is, the development of the carbon trading market can not only promote the emission reduction of the pilot region, but also significantly promote the carbon emission reduction of the neighboring regions.
Secondly, from the perspective of spatial spillover mechanism, the development of carbon trading market promotes the carbon emission reduction in neighboring regions by promoting the clean transformation of regional energy structure, improving technology absorption capacity and technological progress. First of all, the increase in the trading volume of carbon emission rights in the pilot areas not only promotes the clean transformation of the local energy structure but also promotes the clean transformation of the energy structure in the neighboring areas, thus promoting the carbon emission reduction in the surrounding areas. Next, the increase in the trading volume of carbon emission rights in the pilot areas not only improves the technology absorption capacity of the local area but also improves the technology absorption capacity of the neighboring areas. The high-quality talent reserve provides intellectual support and talent guarantee for carbon trading and the realization of carbon sect in other areas, thus promoting the carbon emission reduction in the surrounding areas. Finally, the increase in the trading volume of carbon emission permits in the pilot region promotes technological progress in both the region and the neighboring region. Technological progress improves the energy utilization efficiency of enterprises, thus promoting carbon emission reduction in surrounding areas, providing theoretical support for the realization of interregional carbon trading market connectivity and the development of low-carbon technology innovation cooperation.
5.2 Policy implications
Based on the above research conclusions, the following policy implications can be drawn: First, from the perspective of carbon market construction, the construction and improvement of national unified carbon trading market should be accelerated. The implementation of the pilot carbon emission trading policy can significantly promote the emission reduction in the pilot areas and achieve the goal at the beginning of the implementation of the policy. Therefore, the construction and development of the carbon trading market should be firmly supported. Second, from the perspective of carbon emission reduction, more enterprises should be encouraged to participate in carbon emission trading. Due to the spatial spillover effect of carbon emission trading, and with the growth of carbon emission trading volume and trading volume, it can not only promote the emission reduction in pilot areas, but also significantly promote the carbon emission reduction in surrounding areas. Therefore, it is suggested to gradually expand the scope of emission control enterprises and promote the growth of carbon trading scale, so as to promote the realization of carbon emission reduction in various regions. Third, from the perspective of energy structure, we should vigorously promote the clean transformation of energy structure. Clean energy can be developed selectively according to the situation of different regions. For example, solar energy can be developed in areas with long sunshine time, wind energy can be developed in areas with strong wind power, and hydropower can be developed in coastal cities, so as to reduce the use of fossil energy (such as coal, etc.) with high unit carbon emissions and promote carbon emission reduction. Fourth, from the perspective of technological progress, investment in research and development should be increased to promote technological research and development of enterprises and low-carbon technological innovation. Low-carbon technology innovation is the most effective solution for enterprises to achieve carbon emission reduction. The government can also encourage technological innovation by giving incentives to enterprises that develop new technologies. Finally, from the perspective of interregional cooperation, we should pay attention to the joint governance of interregional carbon emissions and realize the coordinated emission reduction between regions. China’s regional carbon emissions have a significant spatial spillover effect in space. Provincial governments should formulate carbon emission reduction policies according to local conditions, give full play to the policy incentive role, and promote carbon emission reduction in their own provinces and neighboring regions.
5.3 Limitations and future prospects
(1) There are many factors affecting carbon emissions. Referring to previous literature and considering the availability of data, we only select four control variables. And there may still be variables affecting carbon emissions that have not been taken into account, which will be perfected in the subsequent research to make the results of the paper more convincing.
(2) Restricted by the availability of data, the data used in this paper is only up to 2019, and the subsequent research will continue to update the data and continue to study the carbon emission reduction effect of the carbon trading market.
(3) This paper mainly studies the spatial spillover effect of the carbon trading market on regional emission reduction, and will conduct further research on regulation analysis and comparative analysis to make the study more comprehensive.
Data availability statement
The original contributions presented in the study are included in the article/supplementary material, further inquiries can be directed to the corresponding authors.
Author contributions
YC: Writing–review and editing, Writing–original draft, Conceptualization, Investigation, Project administration, Software, Data curation. WF: Writing–review and editing, Writing–original draft, Investigation, Visualization, Methodology, Software. XG: Writing–original draft, Writing–review and editing, Conceptualization, Data curation, Formal Analysis, Methodology, Project administration, Supervision, Validation, Visualization, Funding acquisition.
Funding
The author(s) declare that financial support was received for the research, authorship, and/or publication of this article. We are grateful for the financial support from the National Social Science Foundation Project of China (No. 23BJY079), the Research Project of the Humanity and Social Science Fund of the Ministry of Education of China (No. 22YJA790015) and the Fundamental Research Funds for the Central Universities in Beijing Forestry University (2023SKQ04).
Conflict of interest
The authors declare that the research was conducted in the absence of any commercial or financial relationships that could be construed as a potential conflict of interest.
Publisher’s note
All claims expressed in this article are solely those of the authors and do not necessarily represent those of their affiliated organizations, or those of the publisher, the editors and the reviewers. Any product that may be evaluated in this article, or claim that may be made by its manufacturer, is not guaranteed or endorsed by the publisher.
Footnotes
130 provinces including Hebei, Shanxi, Liaoning, Jilin, Heilongjiang, Jiangsu, Zhejiang, Anhui, Fujian, Jiangxi, Shandong, Henan, Hubei, Hunan, Guangdong, Hainan, Sichuan, Guizhou, Yunnan, Shaanxi, Gansu, Qinghai, Inner Mongolia, Guangxi, Ningxia, Xinjiang, Beijing, Tianjin, Shanghai and Chongqing. Almost all of China’s provincial administrations are included, but Tibet, Hong Kong, Macao and Taiwan are excluded due to limitations in data availability.
References
Cao, X., and Su, X. E. (2023). Whether pilot carbon emission trading policies promote carbon neutral technological innovation. China Popul. Resour. Environ. 33 (07), 94–104.
Chen, Z. Y., Xu, L., and Qian, C. X. (2020). Measurement and dynamic evolution of carbon finance in China. J. Quantitative Tech. Econ. 37 (08), 62–82. doi:10.13653/j.cnki.jqte.2020.08.004
Cheng, Y. T., and Xiao, H. Y. (2023). Research on the economic and emission reduction effects of China's carbon emission trading policy. Statistics Inf. Forum 38 (07), 61–74.
Du, Q., Deng, Y., Zhou, J., Wu, J., and Pang, Q. (2021). Spatial spillover effect of carbon emission efficiency in the construction industry of China. Environ. Sci. Pollut. Res. Int. 29, 2466–2479. doi:10.1007/s11356-021-15747-9
Du, X. (2023). Mechanism and effect of digital economy promoting carbon emission reduction: an empirical study from the perspective of green technology progress. Sci. Technol. Prog. Countermeas. 40 (19), 22–32.
Fujimori, S., Masui, T., and Matsuoka, Y. (2015). Gains from emission trading under multiple stabilization targets and technological constraints. Energy Econ. 48 (mar.), 306–315. doi:10.1016/j.eneco.2014.12.011
Hao, Y., and Tian, C. (2020). A hybrid framework for carbon trading price forecasting: the role of multiple influence factor. J. Clean. Prod. 262, 120378. (prepublish). doi:10.1016/j.jclepro.2020.120378
He, Y. N. (2022). The impact and mechanism of carbon trading market on enterprise innovation strategy. China Popul. Resour. Environ. 32 (07), 37–48.
Lee, J. (2019). Operational decision model with carbon cap allocation and carbon trading price. J. Open Innovation Technol. Mark. Complex. 5 (1), 11. doi:10.3390/joitmc5010011
Liu, H. Y., and Zhong, Y. (2023). Study on emission reduction effect and action path of carbon trading and "carbon tax. Bus. Res. (01), 98–107. doi:10.13902/j.cnki.syyj.2023.01.013
Liu, K., Zhao, L. L., and Li, J. J., 2022. Study on emission reduction effect and mechanism of carbon emission trading pilot in China Industrial Technical Economics,41(12):53–60.
Liu, L. L., Feng, T. T., and Kong, J. J. (2023). Can carbon trading policy and local public expenditures synergize to promote carbon emission reduction in the power industry? Resour. Conserv. Recycl. 188, 106659. doi:10.1016/j.resconrec.2022.106659
Ma, Y., and Li, M. Y. (2023). Analysis on the scale, structure and influencing factors of China's carbon trading market. Financial Mark. Res. (04), 99–112.
Ren, F., and Liu, X. L. (2023). Evaluation of carbon emission reduction effect and porter effect of China's carbon trading policy. Environ. Sci. Pollut. Res. Int. 30 (16), 46527–46546. doi:10.1007/s11356-023-25593-6
Ren, F., and Long, D. H. (2022). Estimation, analysis of influencing factors and prediction model selection of carbon emissions in Guangdong Province. Ecol. Econ. 38 (05), 21–27+32.
Shanbaz, M., Solarin, S. A., Mahmood, H., and Arouri, M. (2013). Does financial development reduce CO2 emissions in Malaysian economy? A time series analysis. Econ. Model. 35 (5), 145–152. doi:10.1016/j.econmod.2013.06.037
Su, J. Q. (2023). Research on the impact of carbon trading policy on enterprise technological innovation: a quasi-natural experiment based on carbon trading pilot provinces and cities. Sci. Technol. Industry 23 (18), 61–67.
Wang, X. P., and Li, Y. J. (2022). Research on the spatial spillover effect of carbon emission reduction in electricity from carbon trading policy. Therm. Power Gener. 51 (10), 72–81. doi:10.19666/j.rlfd.202207142
Wei, X. Y., Wang, H. W., and Xu, H. L. (2019). The spatial correlation and spillover effect of technological innovation in high-tech industries. Econ. Issues Explor. (10), 155–164.
Yang, D., and Ding, C. (2023). Emission reduction effect and spatial spillover of carbon trading policy: empirical analysis based on SCM and S-DID methods in China. Chin. J. Public Adm. 39 (05), 132–140. doi:10.19735/j.issn.1006-0863.2023.05.16
Yang, Y. F. (2023). Spatial and temporal pattern of carbon emissions from energy consumption and its influencing factors: a case study of the Yangtze River Delta urban Agglomeration. Mod. Mark. (next issue) 795 (01), 78–81. doi:10.19932/j.cnki.22-1256/F.2023.01.078
Yi, L., Li, Z. P., Yang, L., et al. (2018). Comparative study on the development degree of seven carbon trading pilot projects in China. China Popul. Resour. Environ. 28 (02), 134–140.
Yuan, M. (2023). Carbon emission reduction effect of digital finance in the Yangtze River Economic Belt: an empirical analysis from a spatial perspective. Regional Finance Res. (03), 52–59.
Zhan, S. P., and Gan, H. H. (2023). Is carbon emission trading a green blessing or a curse for firm performance in China? A quasi-experiment design and exploring the spatial spillover effect. Environ. Sci. Pollut. Res. Int. doi:10.1007/s11356-023-28511-y
Zhang, Y. Z., Liu, Y. K., and Zhao, J. (2023). Study on the impact of environmental regulation on carbon emission reduction: a quasi-natural experiment based on carbon emission trading pilot policy. Ecol. Econ. 39 (07), 29–35+44.
Keywords: carbon trading market, carbon emissions, carbon reduction, spatial spillover effect, regional cooperation
Citation: Cui Y, Feng W and Gu X (2024) Research on the spatial spillover effect of carbon trading market development on regional emission reduction. Front. Environ. Sci. 12:1356689. doi: 10.3389/fenvs.2024.1356689
Received: 16 December 2023; Accepted: 28 March 2024;
Published: 11 April 2024.
Edited by:
Wei Zhang, China University of Geosciences Wuhan, ChinaReviewed by:
Weifeng Gong, Qufu Normal University, ChinaLingui Qin, Shenyang Agricultural University, China
Copyright © 2024 Cui, Feng and Gu. This is an open-access article distributed under the terms of the Creative Commons Attribution License (CC BY). The use, distribution or reproduction in other forums is permitted, provided the original author(s) and the copyright owner(s) are credited and that the original publication in this journal is cited, in accordance with accepted academic practice. No use, distribution or reproduction is permitted which does not comply with these terms.
*Correspondence: Xuesong Gu, guxuesong@bjfu.edu.cn