 Nanlin Hu1,2
 Guodong Wang1*
 Zijun Ma1,2
 Meiling Zhao1,2Yusong Yuan1,2Tao Zhang1Qi Chen1,2Jingci Meng1Jiaying Wang1
- 1Key Laboratory of Wetland Ecology and Environment, Northeast Institute of Geography and Agroecology, Chinese Academy of Sciences, Changchun, Jilin, China
- 2University of Chinese Academy of Sciences, Beijing, China
Introduction: Wetland has been exposed to tremendous stresses and hazards, leading to many potential ecological risks in the past few decades. There is an urgent need to assess the ecological risk status of the wetland, especially when examining how the intensity of socio-economic growth, policy changes, and other variables affect land use and ecological risk changes.
Methods: This study models the LULC pattern in the Liaohe Estuary National Nature Wetland Reserve under various future scenarios in 2000–2040 and develops a long-term Pressure-State-Response ecological risk assessment model based on the characteristics of the northern wetland environment in China, combined with the simulated multi-scenario PLUS model.
Results: As the two most distinct vegetation types in the reserve area, Phragmites australis and Suaeda glauca presented decreasing trends of 59.7 ha/year and 9.0 ha/year in the economy development scenario (EDS), higher than 57.3 ha/year, 8.2 ha/year in the natural increase scenario (NIS), and 35.4 ha/year and 5.8 ha/year in the ecological protect scenario (EPS). From the core area to the buffer area to the outer experimental area, the slope rate of vegetation deterioration rises severely. In comparison to the scenario of EDS, the area of aquiculture and oil wells can be lowered by 11.4 ha/year and 1.1 ha/year with the application of ecological protection measures. Besides, under three scenarios, mean ecological risks are all showing an increasing trend from 2000 to 2040, which is generally higher in the EDS scenario than that in the NIS and EPS scenarios. The proportion of the high and very high level of ecological risk area continually increased from 28.8% to 40.4% from 2000 to 2040, which was mainly located in the south estuary and west urban areas. In addition, among the three protected areas, the ecological risk in the core area has a lower growth rate than that in the outer buffer zone and experimental zone.
Discussion: Aiming for the development of Liaohe Estuary National Park, these findings provide quantitative guidance for protecting and restoring natural resources.
1 Introduction
Wetlands, as multifunctional natural zones between terrestrial and aquatic systems, have unique hydrological, soil, and vegetation conditions (Engelhardt and Ritchie, 2001; Mitsch and Gosselink, 2015). In addition, wetlands provide specific ecosystem services and activities such as water resource conservation, runoff control and regional water balance maintenance, et al. (Zedler and Kercher, 2005; Meng and Dong, 2019; Hu et al., 2023). However, due to climate change, eutrophication, and anthropogenic activities, wetlands and their environments are severely changing (Mao et al., 2020; Dar et al., 2021; Rashid et al., 2023). Less than 6% of the earth’s territory is made up of wetlands, and the majority of that land has deteriorated, putting the wetland ecosystem in grave danger (Zedler and Kercher, 2005; Endter-Wada et al., 2020; Endter-Wada et al., 2018; Dar et al., 2020). For instance, since the 1950s, the Sanjiang Plain, which is also an important national nature reserve in the northeast of China along with the Liaohe Estuary wetland, has lost more than 80% of its wetlands (Lou et al., 2015). Thus, a necessary condition for the coexisting growth of humans and environment is the scientific management of these ecological hazards (Lu and Liu, 2008). Predicting land use and land cover (LULC) and evaluating its ecological risk under various planning techniques is a necessary step towards lowering the risk of disaster through LULC planning (Zhou et al., 2020; Gao et al., 2022). Using multi-scenario simulation to forecast and predict the future LULC condition under various plans is a crucial way to achieve the above goals and illustrate the trends of evolution in wetland area and the contradictions of LULC in sustainable development.
With the development of multi-indicator comprehensive evaluation methods, the understanding of the structure and function of ecosystems has been continuously deepened. As a result, exploring the comprehensive evaluation of multiple stress factors such as physics, chemistry, and biology to reflect the cumulative impact of multiple factors on regional habitats has become a research trend (Liu et al., 2020; Chen et al., 2021; Liao et al., 2022; Sun et al., 2023). For example, Relative risk model is one of the techniques created to assess the ecological risk of urban areas in accordance with the efficiency principle of ecological modeling. Li et al. (Li et al., 2019) used the three dimensions of “nature-human-society landscape pattern” to identify the landscape ecological risk of the Ningjiang River Basin in Guangdong. However, the evaluation dimension in several former studies was based solely on the vulnerability of various landscapes, which was relatively single-minded (Sadeghi and Hazbavi, 2017). Comparatively, the further developed Pressure States Response model (PSR) examines the link between environmental pressure, system state, and response measures based on causal relationships at the regional scale while taking into account the feedback and reaction of wetlands to external and self-stress, providing a robust scientific perspective for comprehensive ecological risk assessment of wetlands (Sun et al., 2019; Hazbavi et al., 2020). Wetland is a natural-economic-social composite ecosystem, involving multiple disciplines and fields on evaluation indicators. However, the risk assessment of wetland ecosystems is still poor on a multi-index evaluation framework in the context of notable disparities in wetland ecosystems on a regional scale, especially examine how the intensity of socio-economic growth, policy changes, and other variables affect land use and ecological risk changes in the annual series analysis.
The fine-grained changes in LULC are important ways to investigate the ecological risks attributed to the unbalance of ecosystem services provided by wetlands or the enhanced sensitivity of the wetland environment (Liao et al., 2018; Gao et al., 2022). For example, Hishe et al. (2020) simulated the future change based on the past LULC patterns using the Cellular Automata (CA)-Markov model in northern Ethiopia. Nath et al. (2020) predicted the future LULC map and analyzed the future potential landscape risk area of the 2008 great earthquake at Dujiangyan City. However, prior researches on land use change modeling have mostly concentrated on transitioning between common land types, such as impermeable surfaces, cultivated land, etc. (Hu et al., 2022; Xu et al., 2022), while there is still little knowledge on nature reserves, which are composed mainly of wetlands, such as freshwater swamps, saline swamps, Phragmites australis fields, and Suaeda salsa area, et al. (Bao et al., 2019; Athapaththu et al., 2020). Moreover, by taking into account the interactions within different patches, the CA-based model has been widely used to simulate the complicated self-organization behavior of land use (Guan et al., 2011). Through digging up the rules of land-use transition metrics and figuring out the probability of various land types in each cell, this kind of model finally develops future land use data (Clarke and Gaydos, 1998). However, due to the lack of spatiotemporal continuity, the model is unable to simulate the evolution of land use patches, thereby reducing the accuracy of ecological risk assessment (Gao et al., 2022). A novel CA model based on a multi-type patch generation method is proposed by the PLUS model, which is supported by land-use data across various periods and is more suitable for modeling real landscapes (Liang et al., 2021). The PLUS model has been extensively used to simulate and forecast various land-use scenarios (Li et al., 2021), ecological risks (Gao et al., 2022), and other fields (Wei et al., 2024). Thus, the comprehensive ecological risk assessment, which combines various indicator evaluations and multi-scenario simulation, contributes to improving the robustness and accuracy of the study.
Liaohe wetland area in Panjin international wetland city, was firstly selected as a national nature reserve in 1988 and an internationally important wetland in 2005 (Song et al., 2022). With China and local governments paying close attention to the preparations for the establishment of a national park in 2021 and the adoption of the Panjin City Wetland Protection Regulations and other measures, it is imperative to link LULC, associated land surface processes, ecological risk, and construction suggestions to improve our understanding of the current degradation state of these ecosystems and be useful for landscape planning and environmental management in this area in an effective and sustainable manner. Therefore, in this study, we aim to 1) Simulating the future land use in Liaohe Estuary National Nature wetland Reserve under three scenarios of natural increase scenario (NIS), ecological protect scenario (EPS) and economy development scenario (EDS); 2) Comprehensively evaluating the ecological risk level of combining various Pressure-Status-Response indicator evaluation and multi-scenario simulation from the whole reserve area to core, buffer and experimental protect districts; and 3) Providing suggestions for the future development planning of Liaohe Estuary National Nature wetland Reserve based on the simulated scenarios for different policy implementation results.
2 Methods and materials
2.1 Study area
The core and its surrounding area of Liaohe Estuary National Nature Wetland Reserve (121°23'∼ 122°29′E, 40°39'∼ 41°27′N) were taken as the study area (Figure 1), located in Panjin City at the estuary of China’s northeastern coast. It is a crucial stopover point for waterbirds such as Grus japonensis migrating between East Asia and Australia, and also the largest breeding and habitat for Larus saundersi in the world, and holds significant importance in international wetland and biodiversity research and conservation.
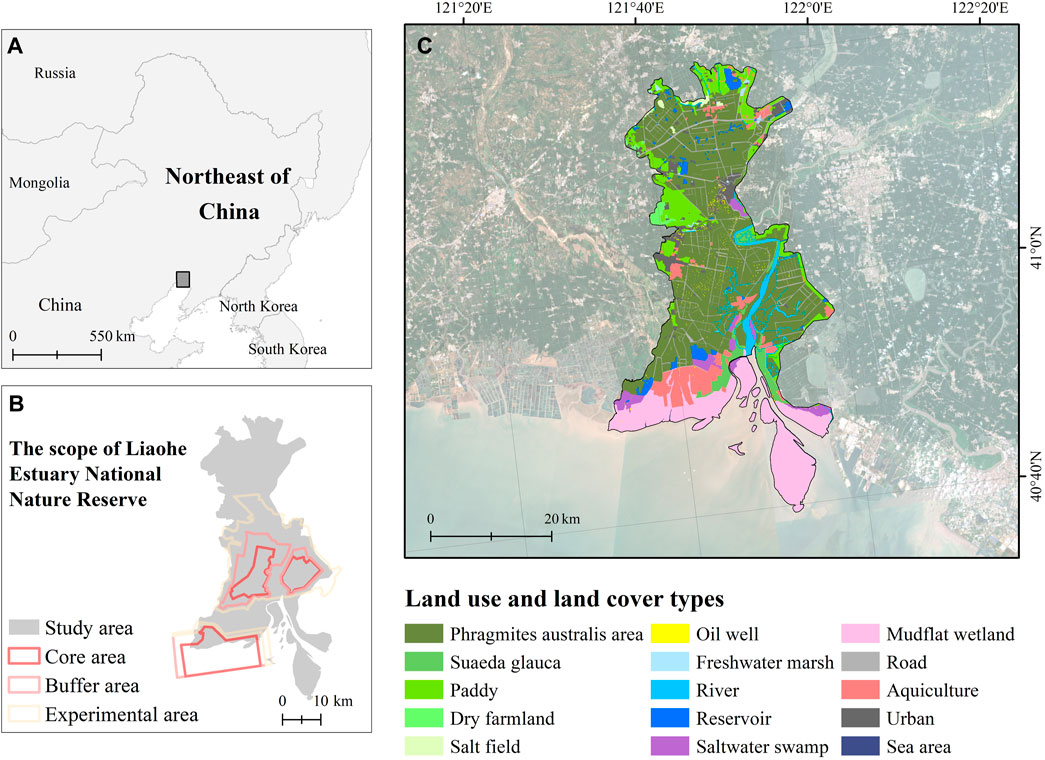
FIGURE 1. Study area. (A) the location of the study area; (B) the scope of the study area; (C) the land use and land cover types of the study area in 2020.
The area belongs to a temperate continental monsoon climate with an average annual rainfall of 650 mm and an average annual temperature of 8.5°C. Liaohe River and Daling River in the wetland are the main sources of forming and maintaining the hydrological network in the study area. There are tides on the wetland coast, and large areas of mudflat are distributed in the intertidal zone. S. salsa and Phragmites australis are the two main wetland vegetation types, with a limited distribution of other wetland vegetation types (Song et al., 2022). The planting industry of Phragmites australis is well-known worldwide, while the S. salsa community blooms bright red in summer each year, which is known as the “red beach”. According to China’s National Nature Reserve System, nature reserves are divided into three categories, i.e., national parks, nature reserves, and natural parks, in order of ecological value and protection intensity. The Liaohe estuary wetland area was listed as a national-level nature reserves in 1988, designated as an important international wetland in 2005, and launched the national park project in 2021, receiving high attention from the national and local governments.
2.2 Data
The datasets used in this study include the Landscape characteristics, Soil, climate, and vegetation datasets (Table 1). Due to the lack of long-term high-resolution fine land use data in the Liaohe Estuary wetland area, land use datasets with a fine classification resolution of 30 m in 2000, 2010, and 2020 were produced, based on calibrated Top of Atmosphere Reflectance (TOA) images, which were captured by Landsat instruments Enhanced Thematic Mapper Plus (ETM+) and Operational Land Imager (OLI) (Dong et al., 2021). According to the classification scheme developed by previous researches as well as the research targets in this study, the land-use datasets were reclassified into fifteen types: Sea area, Freshwater marsh, Road, Dry farmland, River, Urban, Phragmites australis area, Reservoir, Paddy, Mudflat wetland, Saltwater swamp, Suaeda glauca, Salt field, Aquiculture and Oil well (Zhou et al., 2020; Gao et al., 2022; Liao et al., 2022). Based on field surveys and verification points from high-resolution historical images of Google Earth, the results show that the overall accuracy is over 74% with a kappa coefficient of over 0.73.
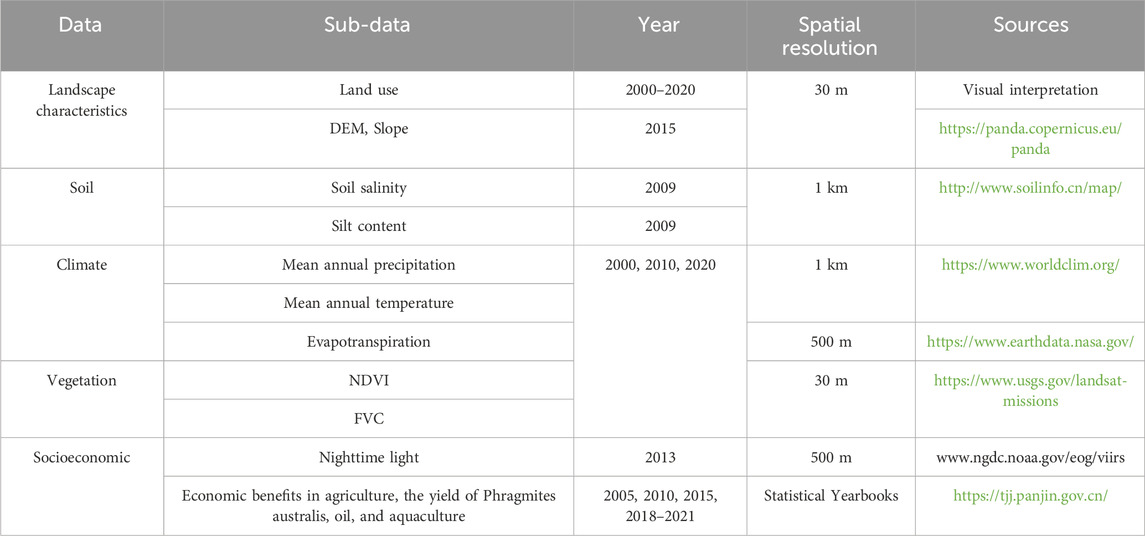
TABLE 1. Details of all data.
Climate and Soil datasets were used for the ecological risk assessment, containing soil salinity, silt content, mean annual precipitation (MAP), mean annual temperature (MAT), and evapotranspiration. Vegetation datasets consist of NDVI, FVC. Besides, we conducted the yield of Phragmites australis used for the ecological risk assessment, using binary linear regression analysis between FVC and the annual yield of Phragmites australis obtained from Bureau of Statistics of Panjin City. The results showed a significant positive correlation (R2 = 0.21). Socioeconomic datasets consist of nighttime light dates. Then, we also calculated the slope of DEM, the distance to roads, the distance to water, the distance to oil well, and the distance to aquiculture, and added them together with NDVI, nighttime light, MAP, MAT as driving factors into the PLUS model. When determining the transition probability of a certain land type in a multi-objective scenario, the socioeconomic data from the Panjin Statistical Yearbook is also considered. The PLUS model was then used after all land-use and driving factor datasets had been resampled to 30 m resolution.
2.3 Methodology
As shown in Figure 2, Firstly, to match the pixels as the input dataset in the PLUS model’s, the land use dataset and driving factors are resampled. Then, the conversion probability of each land-use type under the NIS, EPS, and EDS scenarios are set in accordance with the local governance policy, and the Markov model is used to calculate the number of pixels for different land-use types in each of the three development scenarios. Afterwards, input the above dataset and pixel count into the PLUS model to obtain land use information in different scenarios. Moreover, to estimate multi-variable ecological risks, the PSR ecological risk assessment model is used, using the entropy method to integrate indices of land-use, climate, soil, landscape characteristics, ecosystem service, and vegetation factors. Lastly, an evaluation and comparison of various ecological risk levels for each of the three scenarios is conducted, with the spatiotemporal dynamic changes in land-use from 2000 to 2040.
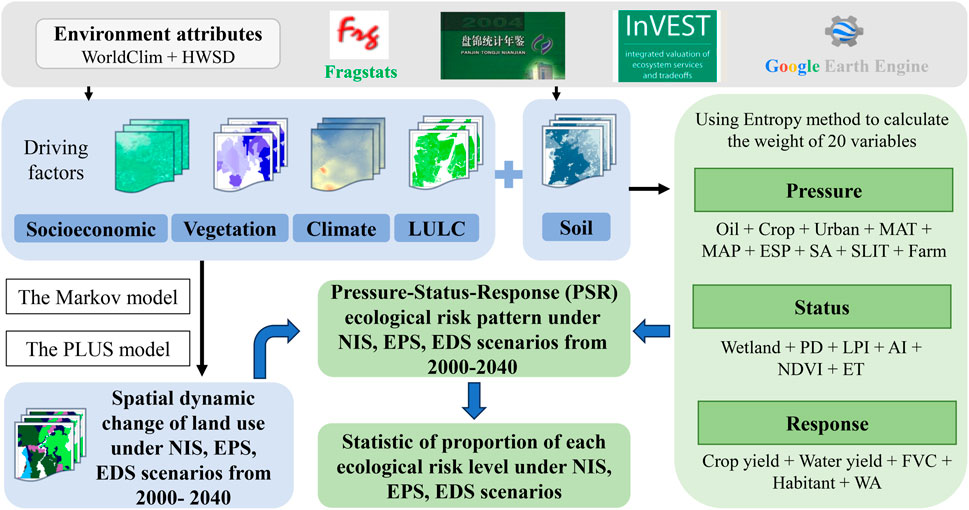
FIGURE 2. The workflow of this study. Note: LULC: land use and land cover; NIS: natural increase scenario; EPS: ecological protect scenario; EDS: economy development scenario; MAT: mean annual temperature; MAP: mean annual precipitation; ESP: soil salinity; SLIT: silt content; Farm: aquaculture area; PD: patch density; LPI: largest patch index; AI: aggregation index; NDVI: normalized difference vegetation index; ET: evapotranspiration; Crop yield: the unit area yield of Phragmites australis; Water yield: annual water yield; FVC: fractional vegetation cover; Habitant: habitat quality; WA: wetland accessibility.
2.3.1 The PLUS-Markov model
The PLUS model mainly consists of the Land Expansion Analysis Strategy (LEAS) module and the Multi-type Random Patch Seeds (CARS) module (Liang et al., 2021). We first overlay and extract the changes in land-use data from two periods in the PLUS model. Then it investigates the relationship between those changes and the driving forces using the random forest method in the LEAS. By calculating the development potential raster of each land use type using LEAS, combining the pixel counts, conversion matrices, neighborhood weights of each land use type, and the constraints of core protected areas, we further simulated the future land use based on CARS. Under the restrictions of growth probability, new land use patches can develop naturally owing to the spatiotemporally dynamic (with temporal consistency) CARS (Gao et al., 2022).
2.3.2 Multi-scenario design
We designed three scenarios, i.e., the natural increase scenario (NIS), the ecological protect scenario (EPS), and the economy development scenario (EDS), to predict and evaluate the land-use types in Liaohe Estuary in 2040. The NIS scenario indicates the natural development of land-use in accordance with historical natural tendencies. The EPS scenario aims to provide a high level of ecological protection against various land-use scenarios. According to current local policies aimed at dismantling aquaculture farms and restoring wetlands in Panjin city, 5,726.7 ha of wetlands have been restored, making up 3% of the total area during 2018 and 2020, and 100 ha of Suaeda glauca have been restored in 2021, with the latter expanding more than ten times in just 5 years. Thus, in this study, we set the conversion probability of other land-use types to Suaeda glauca +30% and aquaculture farms to wetland +20%. In comparison to other land use scenarios, the EDS scenario seeks to maximize economic advantage and economic development. According to the Panjin City Statistical Yearbook, the development of oil and marine resources is the key industry. As a result, we set the conversion probability of other land-use to +20% for oil wells and aquaculture farms and +10% for urban areas. The detailed transition matrix and land demands under NIS, EPS, and EDS are shown in Supplementary Tables S2–S4.
There is also a main spatial restriction under different scenarios, which is the prohibition of development and habitation within the area of the Liaohe Estuary National Nature Wetland Reserve, especially in its core area. Thus, this area is also set as a conversion limitation area in the PLUS model.
2.3.3 Ecological risk assessment
Since the land-use varied significantly under three scenarios, we further investigated the ecological risks from 2000 to 2040 using a multi-variable Pressure-State-Response (PSR) model. It consists of twenty variables reflecting the pressure of the environment, wetland status, and ecological response (Table 2). The entropy method is used to determine each indicator’s weight. Among them, the pressure of ecological risk mainly comes from the impact of natural environment and human activity interference; thus, the indicators of Pressure and their weights are Oil area (0.067), Crop area (0.116), Urban area (0.106), MAT (0.029), MAP (0.023), Soil salinity (0.036), Suaeda glauca area (0.01), Silt content (0.018), and Aquaculture area (0.129). The state of ecological risk provides information about the ecosystem conditions and characteristics under environmental pressure; thus, the indicators of State and their weights are wetland area (0.025), Patch density (PD, 0.029), Largest patch index (LPI, 0.051), Aggregation index (AI, 0.022), NDVI (0.068), and Evapotranspiration (0.018), in which PD, LPI, and AI are calculated by land use in Fragstats software (Qu et al., 2021). The response of ecological risk characterizes the ecological services that wetlands continue to offer to society in the face of current stresses and situations; thus, the indicators of Response and their weights are consist of four ecosystem services, i.e., The unit area yield of Phragmites australis (Pyield, 0.072), Annual water yield (Wyield, 0.011), FVC (0.081), Habitat quality (HQ, 0.067), and wetland accessibility (0.021), in which the Pyield is calculated by the linear relationships between FVC and annual statistical Yearbook yield in R 4.2.0 (Supplementary Figure S1), and HQ is calculated by the habitat module in the InVEST model (Liu et al., 2017).
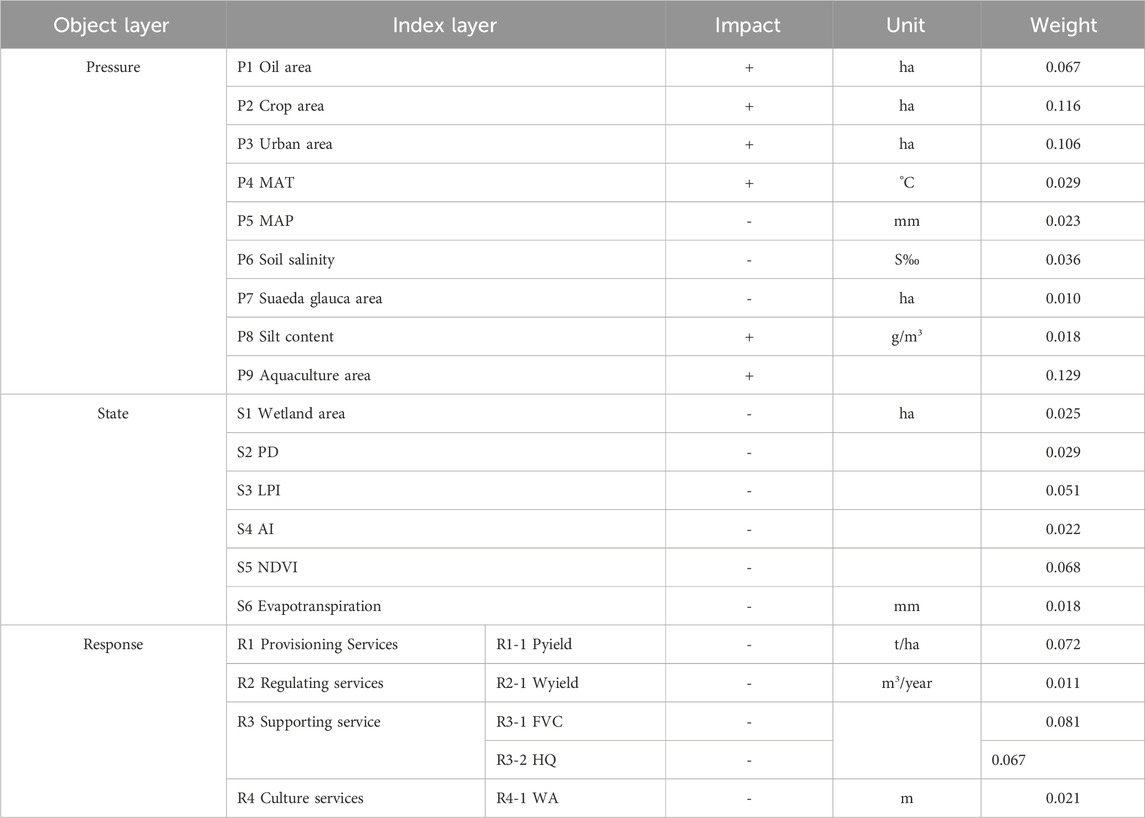
TABLE 2. Ecosystem risk evaluation index and weight. The key for the abbreviations for variable names is presented in Figure 2.
An objective way of weighting, the entropy method bases the weight on the variability of the indicators (Sun et al., 2023). After determining the weights, based on twenty variables to quantitatively evaluate the ecological risk of the Liaohe River Estuary wetland, and the term is calculated as follows:
Where ER represents regional ecological risk, Wn is the weight of the n indicator, and Cn is the standardized value of the n indicator. The ecological risk values are separated into five levels using the natural break method to quantitatively compare ecological risks, as shown in Supplementary Table S5.
Additionally, the land use area and proportion under different scenarios are computed independently for 2000, 2010, 2020, and 2040. The yearly fluctuation of land use and ecological risks (Slope) is calculated using linear regression analysis:
where t represents the time point (t = 1,2,3,4), A represents the land-use area or risk area at time t, and n represents the duration of the time series in years (n = 40). In the analysis, the regression relationship’s significance threshold is set at 0.05. A positive slope value indicates an increasing trend in the land-use area or risk area; the higher the change in the land-use area or risk area, the larger the slope’s absolute value.
3 Results
3.1 Simulated results of land use under three scenarios
We first calculated the land-use in 2020 to verify the validity of the PLUS model based on historical land-use patterns and driving factors in 2000 and 2010, using both the Markov chain and linear regression methods to calculate the land demands. The comparison result between the actual data and the predictions in 2020 shows that the total accuracy of the Markov chain method is 0.74, which is higher than linear regression, indicating that the PLUS model has a high degree of accuracy in land use modeling. Subsequently, the real land-use data in 2020 and the land demands and transition metrics of each land-use type in 2040 under the natural increase scenario (NIS), ecological protect scenario (EPS), and economy development scenario (EDS) scenarios are inputted into the CARS module of the PLUS model to simulate the land-use map in 2040 under three scenarios (Supplementary Tables S2–S4).
Under three scenarios, the predicted land-use results show a minor spatial difference in land-use change in Liaohe Estuary National Nature Wetland Reserve, which is mainly in the south and west areas, and the area of Phragmites australis accounts for the majority of the reserve (Figure 3). Among them, under the effective EPS, the area of Phragmites australis is 564.7 ha, which accounts for 45.4% of the total area and increases by 5.9% and 6.5% of the total area relative to the NIS and EDS scenarios (Table 3). Meanwhile, the EPS scenario could effectively decrease the loss of Suaeda glauca 7.9ha and 10.6ha relative to the NIS and EDS scenarios. In particular, the EDS scenario has a higher proportion of oil wells, aquiculture, and urban areas than the NIS and EPS scenarios.
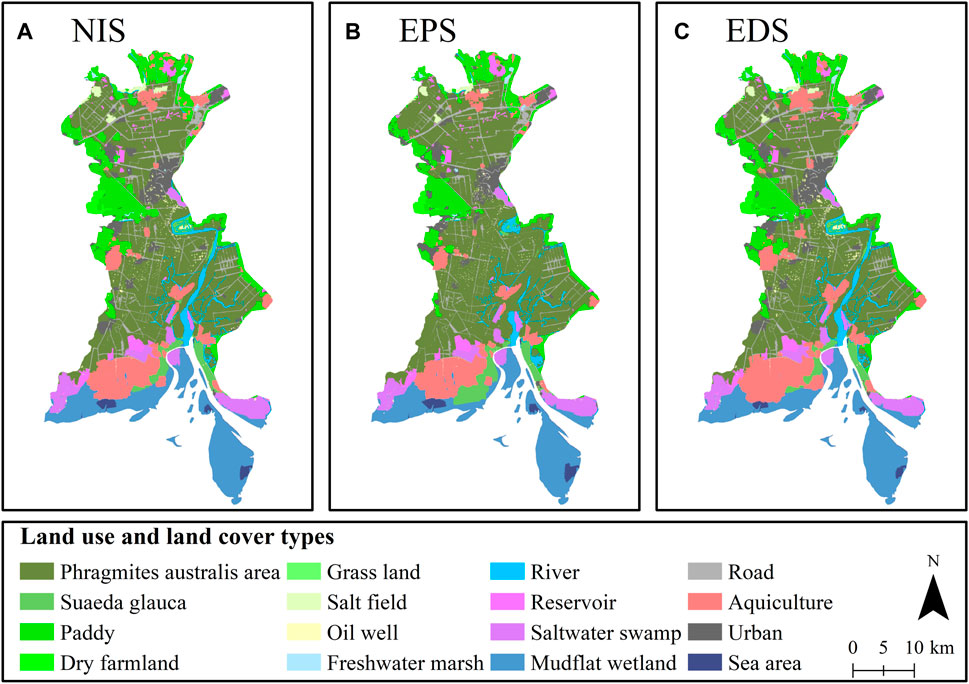
FIGURE 3. The spatial distribution of land use under different scenarios in 2040. (A) the land use in NIS scenario; (B) the land use in EPS scenario; (C) the land use in EDS scenario.
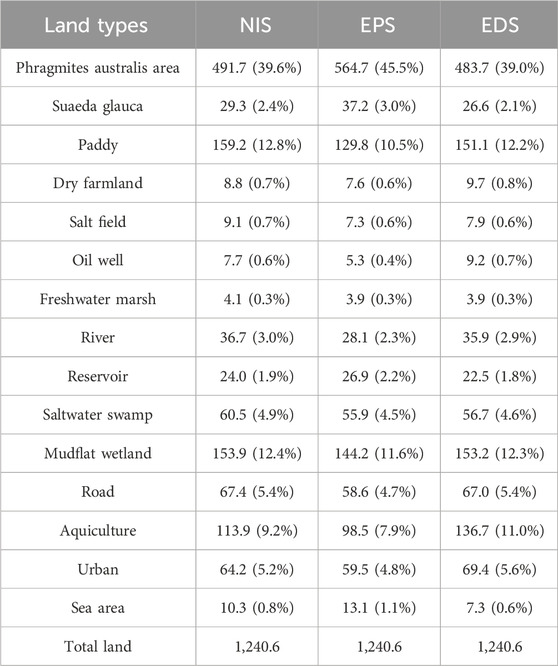
TABLE 3. Area and proportion of different land use types under three scenarios in 2040.
3.2 Land use conversion from 2000 to 2040
The LULC has changed significantly from 2000 to 2040 in Liaohe Estuary National Nature Wetland Reserve, especially with the decline of Phragmites australis and Suaeda glauca, as well as the increase of aquiculture, urban, and oil wells (Figure 4). As the two most distinct vegetation types in the reserve area, there are decreasing trends of Phragmites australis and Suaeda glauca under all three scenarios and a sharp decline in 59.7 ha/year and 9.0 ha/year in the EDS scenario, higher than 57.3 ha/year, 8.2 ha/year in the NIS, and 35.4 ha/year and 5.8 ha/year in the EPS (Figure 4; Table 4). It should be mentioned that, from the core area to the buffer area to the outer experimental area, the change in slope rate of vegetation deterioration rises severely. In addition, Mudflat wetland, Sea area, Freshwater marsh, Dry farmland and River is also degenerate to various degrees from 2000 to 2040. Otherwise, artificial landscapes such as Paddy, Aquiculture, Urban, Road and Reservoir showed an increasing trend of slopes more than 5 ha/year from 2000 to 2040 and are sharper in the EPS scenario. Therefore, more powerful policies need to be taken to suppress the increasing area of artificial landscapes in future planning management.
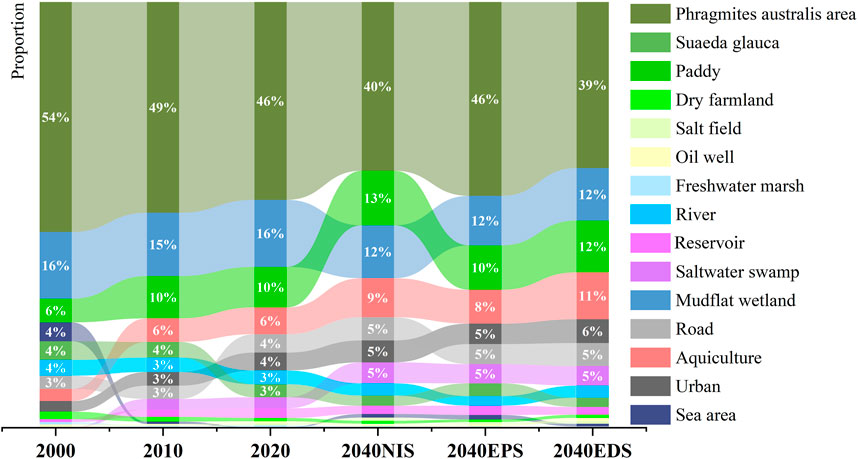
FIGURE 4. The change of land use from 2000 to 2040.
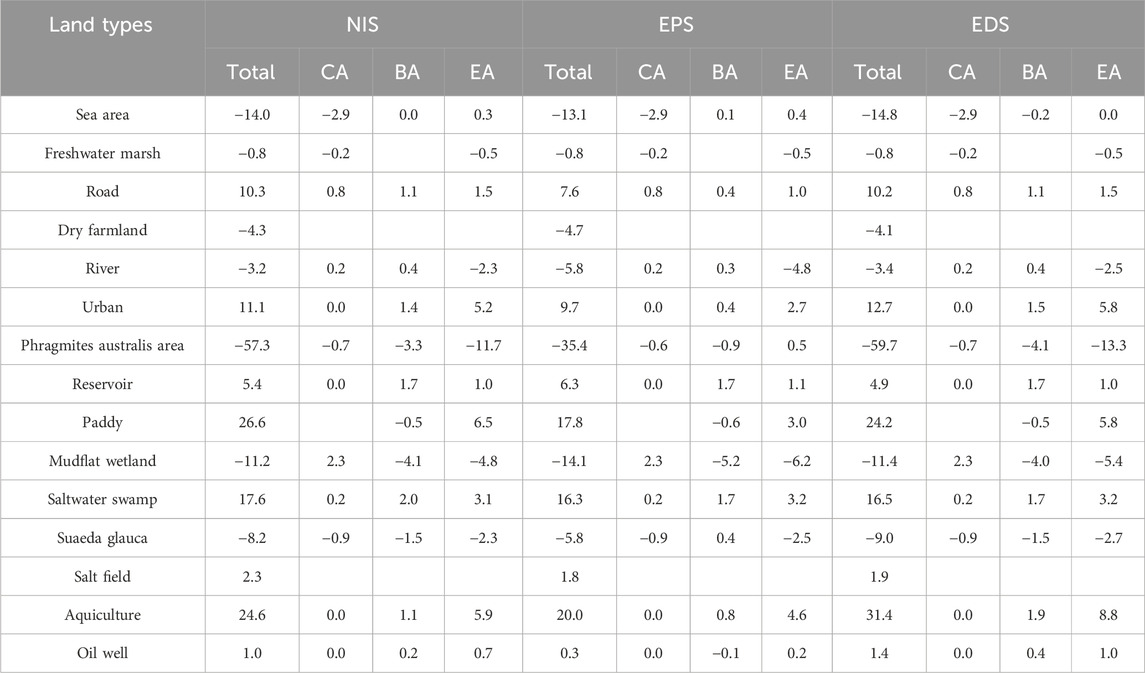
TABLE 4. The slope change rate of land use from 2000 to 2040 under three scenarios. CA: core area; BA: buffer area; EA: experimental area.
In comparison to the scenario of economic development, the area of Aquiculture and Oil well can be lowered by 11.4 ha/year (reducing 36.3%) and 1.1 ha/year (reducing nearly 78.6%) with the application of ecological protection measures. However, the growth of artificial landscapes is unavoidable.
3.3 Ecological risk assessment
Under three scenarios, mean ecological risks show an increasing trend from 2000 to 2040, while being higher in the experimental area than in the buffer area and core area (Figure 5A). The ecological risk in the EDS scenario is generally higher than that in the NIS and EPS scenarios, especially in the experimental area. In addition, the proportion of the high and very high level of ecological risk area continually increased from 28.8% to 40.4% from 2000 to 2040, which was mainly located in south estuary and west urban area, while the proportion of the very low level of ecological risk area steadily declined from 2000 to 2020, and by 2040, there were essentially no very low level of ecological risk area under three scenarios (Figures 5B–H).
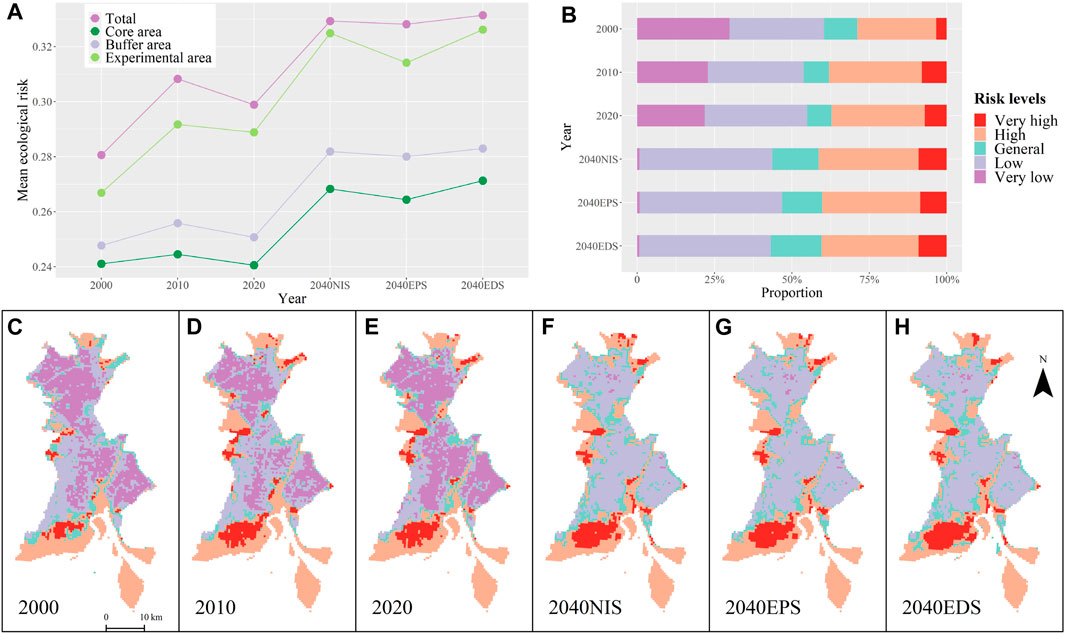
FIGURE 5. Spatial evolution in ecological risks from 2000 to 2040 under different scenarios. (A) the mean ecological risk of four levels of protected areas from 2000 to 2004; (B) proportion of different levels of ecological risk from 2000 to 2040; (C–H) spatial distribution of ecological risks from 2000 to 2040.
Among the three protected areas, the ecological risk evolved differently, wherein the core area having a lower growth in ecological risks than the outer buffer zone and experimental zone (Figure 6). Besides, there is no obvious difference between EPS and EDS in the core area under the five levels of ecological risk, while they are significantly different in the outer experimental area, indicating the spatial differences in the impact of protected area policies. Thus, it would be beneficial to adopt different management strategies from the core area to the buffer area to the outer experimental area.
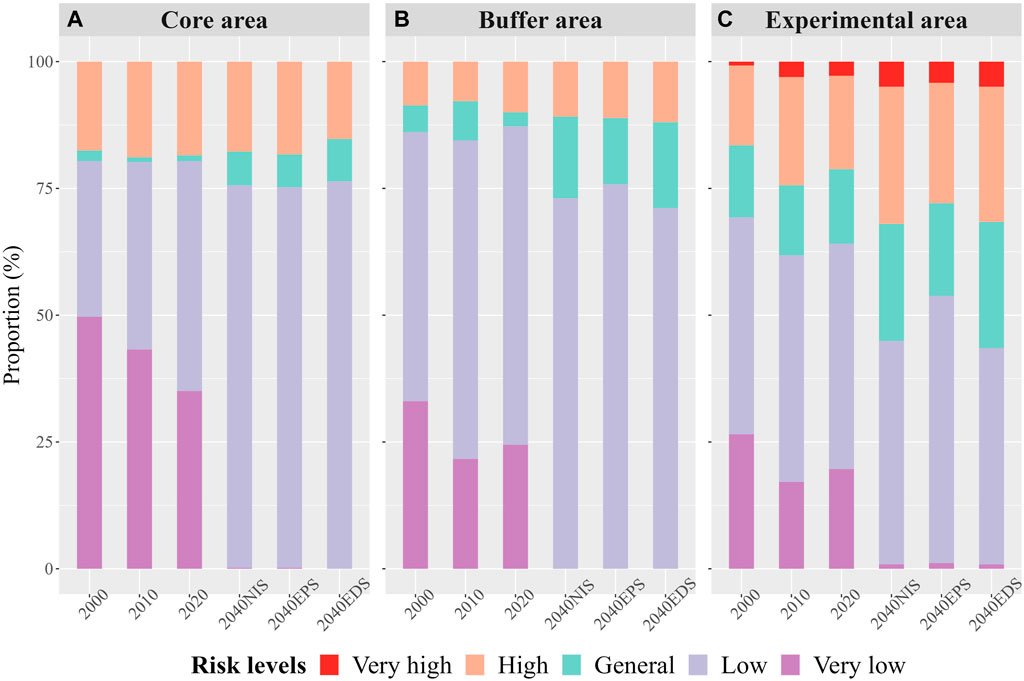
FIGURE 6. The ecological risks evolution in diferent levels of protected areas from 2000 to 2040 under different scenarios. (A) proportion of ecological risk in Core protected area; (B) proportion of ecological risk in Buffer protected area; (C) proportion of ecological risk in Experimental protected area.
4 Discussion
4.1 Uniqueness of the study area
In the global context of attaining peak carbon emissions and carbon neutrality, as well as sustainable development, the field of ecological conservation is highly valued worldwide. Since the 1970s, developed countries such as the US and Europe have emphasized the social duty of protecting wetlands through legislation and have also used laws to control social behavior related to wetlands exploitation. For example, the United States federal government implements the Clean Water Act to support the conservation of water resources and wetlands (Greenhill et al., 2024). At that time, European nations established the greatest conservation network in the world by launching initiatives like the Ramsar Convention to conserve wetlands in the Mediterranean and the Convention for the Protection of the Marine Environment of the Northeast Atlantic et al. (Munguía and Heinen, 2021). However, compared to developed countries, although poor nations like Africa have participated in conservation plans such as the Convention on Wetlands of International Importance Especially as Waterfowl Habitat, the implementation of relevant policies is relatively backward and the effect is not significant (Xu et al., 2019).
Wetlands have long been a priority to be protected and restored since China joined the Convention on Wetlands of International Importance Especially as Waterfowl Habitat in 1992, and it has been proposed in government reports to promote the development of national parks as the main body for the construction of a nature reserve system. Liaohe Estuary wetland area in Panjin international wetland city was first selected as a national nature reserve in 1988, an internationally important wetland in 2005, and launched the national park project in 2021 (Song et al., 2022). Both the national and local governments place a high value on the establishment of the Liaohe Estuary National Park and the efforts to restore the ecosystem of the wetland resources. For example, Liaoning Province has issued the “Implementation Plan for Wetland Protection and Restoration System”, the “Panjin Wetland Protection Regulations”, and many other laws and regulations.
The implementation and assessment of ecological restoration projects need to understand the extent and the impact factors on the loss of natural resources in order to provide evidence for ecological restoration (He et al., 2017). According to the second national wetland resource survey, the top threats to wetlands in China have changed to five key factors: pollution, reclamation, infrastructural occupancy, overfishing and collecting, and species invasion (Wang, 2016). The risk assessment of Liaohe Estuary wetland ecosystems is still poor on a multi-index evaluation framework in the significantly different context of wetland ecosystems on a regional scale, especially examining the effectiveness of ecological protection measures. To ensure the sustainable growth of the ecological, social, and economic elements of the Liaohe Estuary wetland, it is imperative to conduct a comprehensive analysis of the spatiotemporal evolution of regional ecosystem threats in order to improve and safeguard the wetland natural resources.
4.2 Comparison of land use and ecological risks from 2000 to 2040
In contrast to previous studies about land-use and ecological risk simulations, this study further considers wetland-related indicators, such as the distance to oil wells and the distance to aquaculture in the LEAS module of the PLUS model, and Soil salinity, Silt content, yield of Phragmites australis, and wetland accessibility in the PSR model. As a consequence, the simulation and evaluation results are more consistent with the features of the study area (Tang et al., 2021; Zhou et al., 2021; Gao et al., 2022).
As reported by the local government, a total of 1,533 ha were covered by the coastal wetland restoration project that Panjin City started in 2015. The objectives of this project are natural tidal ditch restoration, the recovery of aquiculture, and the restoration of Suaeda glauca by planting S. glauca on both sides of the tidal creek. However, according to the changing trend from 2000 to 2040 in this study, although the growth rate of regional ecological risks has slowed down between 2010 and 2020, it will continue to worsen with the current level of environmental protection efforts in the future. Besides, the outer buffer area and experimental area are more easily influenced by the protection policy, while the core area is rather constant (Figure 6). Understanding the trends of land-use evolution and its influence on ecological risks scientifically and efficiently is an essential requirement for regional ecological construction. As mentioned in recent research in the Yellow River Basin, one of the important policies is to create a core area and a peripheral linkage area for ecological conservation, which focus on high-quality ecological protection and economy-ecology balanced development, respectively, forming an effective paradigm for ecological protection (Qu et al., 2021). In the process of land use change, its ecological effects should be considered and strengthen the self-healing function of the ecosystem, based on the ecological environment capacity and regional resource endowment conditions. For eastern Chongming wetlands, as a key experimental area for ecosystem-oriented development in Shanghai, has transformed from the reclamation-oriented utilization toward the protection of wetland ecosystems to adapt to future development under climate change (Bao and Gao, 2021). Considering the results of this study in Liaohe Estuary wetland, ecological protection policies can effectively reduce ecological risks by promoting sensible land use planning, especially in outer buffer area and experimental area which are more easily influenced by the protection policy. Thus, it is important to note that in the future, policies for ecological protection will still need to be strengthened to alleviate the continuing decreasing trends of Phragmites australis and Suaeda glauca (Figure 4; Table 4).
4.3 Diversity of scenario choices and policy implications
It is evident from the results of regional risks that the EPS scenario has lower values than the EDS scenario, which can effectively reduce the ecological risks. However, different conclusions might be drawn from the different distributions of risk levels.
One of the main distribution areas of Suaeda salsa is located in the southern region along the seashore, with a large area of aquaculture. According to the results of the PLUS simulation and the PSR ecological risk assessment model, there is only a minor difference between the NIS and EPS scenarios and they cannot significantly alleviate local ecological risks. However, there is a considerable expansion in the impact area of ecological risks under the economy development scenario (Figure 7). It is clear that a single development approach in a specific region of Liaohe Estuary wetland cannot accomplish the aim of alleviating ecological risk. The recovery of Suaeda salsa is a long process and is easily disturbed by external factors such as human activities (Wang et al., 2019; Zhao et al., 2021).
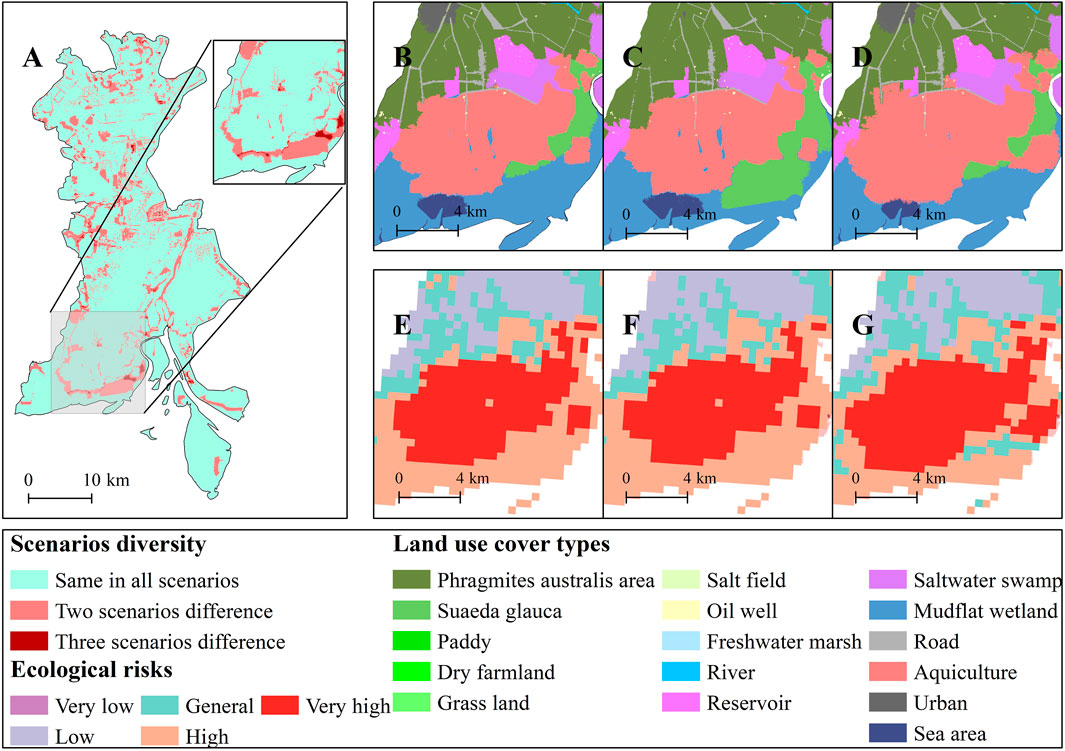
FIGURE 7. Diversity maps under three land-use scenarios with an example of land-use types and ecological risks. (A): Scenarios diversity map; (B–D): the land use cover types under NIS, EPS, and EDS scenarios, respectively. (E–G): the ecological risks under NIS, EPS, and EDS scenarios, respectively.
To accomplish sustainable resource management, different methods should be implemented based on the characteristics of each region, including considering the regional characteristics in land-use management, such as natural-based solutions. Kato and Huang (2021) examined how land-use changed in a central Japanese watershed and suggested sustainable ways to manage upland forest ecosystems and secondary forest-paddy land-human systems, wherein using primary and secondary forests to stop flooding, wind, and sand erosion and using rice paddies as a kind of flood control dam. Aiming for the establishment of Liaohe Estuary National Park, it is necessary to comprehensively consider the regional characteristics of the national park and establish several differentiated control areas over the core protection area and general control area, achieving effective control over the protection and utilization of natural resources. Moreover, the expansion of local coastal wetland islands with severe siltation of rivers and tidal creeks has greatly weakened the self-cleaning capacity of wetland, leading to serious degradation of vegetation and wetland ecological functions. It is necessary to demolish abandoned embankments and carry out channel dredging projects so as to connect the existing wetland restoration units, especially the core protected areas, improve water quality, and circulate nutrients. Based on this, it is beneficial to create shallow water surfaces and artificial islands of different areas and depths, and attract a variety of waterfowl, especially providing a resting place during high tide periods, thereby enhancing the ecological function of the wetland.
5 Conclusion
This paper develops a long-term Pressure-State-Response ecological risk assessment model based on the characteristics of the northern wetland environment in China, combined with the simulated multi-scenario PLUS model for the characteristics of the Liaohe Estuary National Nature Wetland Reserve. The LULC has changed significantly from 2000 to 2040, especially with the decline of Phragmites australis and Suaeda glauca, as well as the increase of aquiculture, urban, and oil wells. As the two most distinct vegetation types in the reserve area, Phragmites australis and Suaeda glauca presented decreasing trends of 59.7 and 9.0 ha/year in the EDS scenario, higher than 57.3 ha/year, 8.2 ha/year in the NIS, and 35.4 ha/year and 5.8 ha/year in the EPS. Besides, from the core area to the buffer area to the outer experimental area, the change in slope rate of vegetation deterioration rises severely. In comparison to the scenario of economic development, the area of Aquiculture and Oil well can be lowered by 11.4 and 1.1 ha/year with the application of ecological protection measures. Under three scenarios, mean ecological risks show an increasing trend from 2000 to 2040. The ecological risk in the EDS scenario is generally higher than that in the NIS and EPS scenarios, especially in the experimental area. In addition, the proportion of the high and very high level of ecological risk area continually increased from 28.8% to 40.4% from 2000 to 2040, which is mainly located in south estuary and west urban area, while the proportion of the very low level of ecological risk area steadily declined from 2000 to 2020, and by 2040, there are essentially no very low level of ecological risk area under three scenarios. Among the three protected areas, the ecological risk evolved differently, wherein the core area having a lower growth in ecological risks than the outer buffer zone and experimental zone. Aiming for the establishment of Liaohe Estuary National Park, it is necessary to comprehensively consider the regional characteristics of the national park and establish several differentiated control areas over the core protection area and general control area, achieving effective control over the protection and utilization of natural resources.
Data availability statement
The raw data supporting the conclusion of this article will be made available by the authors, without undue reservation.
Author contributions
NH: Conceptualization, Data curation, Formal Analysis, Investigation, Methodology, Project administration, Software, Validation, Visualization, Writing–original draft, Writing–review and editing. GW: Conceptualization, Funding acquisition, Supervision, Validation, Writing–original draft, Writing–review and editing. ZM: Supervision, Validation, Writing–original draft. MZ: Supervision, Validation, Writing–original draft. YY: Supervision, Validation, Writing–original draft. TZ: Supervision, Validation, Writing–original draft. QC: Supervision, Validation, Writing–original draft. JM: Supervision, Validation, Writing–original draft. JW: Supervision, Validation, Writing–original draft.
Funding
The author(s) declare that financial support was received for the research, authorship, and/or publication of this article. This study was supported by the National Key R&D Program of China (2022YFF1301000), the National Natural Science Foundation of China (42077070, 41877075, U19A2042), and the Youth Innovation Promotion Association CAS (2019234, 2020237).
Conflict of interest
The authors declare that the research was conducted in the absence of any commercial or financial relationships that could be construed as a potential conflict of interest.
Publisher’s note
All claims expressed in this article are solely those of the authors and do not necessarily represent those of their affiliated organizations, or those of the publisher, the editors and the reviewers. Any product that may be evaluated in this article, or claim that may be made by its manufacturer, is not guaranteed or endorsed by the publisher.
Supplementary material
The Supplementary Material for this article can be found online at: https://www.frontiersin.org/articles/10.3389/fenvs.2024.1361970/full#supplementary-material
References
Athapaththu, A., Wickramasinghe, D., and Somachandra, M. (2020). Hotspots of land use/land cover change around bolgoda wetland, Sri Lanka. J. Natl. Sci. Found. SRI LANKA 48 (3), 219. doi:10.4038/jnsfsr.v48i3.9376
Bao, J., and Gao, S. (2021). Wetland utilization and adaptation practice of a coastal megacity: a case study of chongming island, Shanghai, China. Front. Environ. Sci. 9. doi:10.3389/fenvs.2021.627963
Bao, J., Gao, S., and Ge, J. (2019). Salt and wetland: traditional development landscape, land use changes and environmental adaptation on the central jiangsu coast, China, 1450–1900. Wetlands 39 (5), 1089–1102. doi:10.1007/s13157-019-01144-z
Chen, Z., Zhou, T. G., Li, H. Z., Zhao, D. Z., and Pan, Y. M. (2021). Wetland ecological risk assessment of Guangdong-Hong Kong-Macao greater bay area. J. Hydroecology 42 (05), 40–51. doi:10.15928/j.1674-3075.202104010089
Clarke, K. C., and Gaydos, L. J. (1998). Loose-coupling a cellular automaton model and GIS: long-term urban growth prediction for San Francisco and Washington/Baltimore. Int. J. Geogr. Inf. Sci. 12, 699–714. doi:10.1080/136588198241617
Dar, S. A., Bhat, S. U., Rashid, I., and Dar, S. A. (2020). Current status of wetlands in srinagar city: threats, management strategies, and future perspectives. Front. Environ. Sci. 7. doi:10.3389/fenvs.2019.00199
Dar, S. A., Rashid, I., and Bhat, S. U. (2021). Linking land system changes (1980–2017) with the trophic status of an urban wetland: implications for wetland management. Environ. Monit. Assess. 193 (11), 710. doi:10.1007/s10661-021-09476-2
Dong, Y., Ren, Z., Fu, Y., Yang, R., Sun, H., and He, X. (2021). Land use/cover change and its policy implications in typical agriculture-forest ecotone of central jilin province, China. Chin. Geogr. Sci. 31 (2), 261–275. doi:10.1007/s11769-021-1189-5
Endter-Wada, J., Kettenring, K. M., and Sutton-Grier, A. (2020). Protecting wetlands for people: strategic policy action can help wetlands mitigate risks and enhance resilience. Environ. Sci. Policy 108, 37–44. doi:10.1016/j.envsci.2020.01.016
Endter-Wada, J., Kettenring, K. M., and Sutton-Grier, A. E. (2018). Sustaining wetlands to mitigate disasters and protect people. Front. Ecol. Environ. 16, 431. doi:10.1002/fee.1959
Engelhardt, K. A. M., and Ritchie, M. E. (2001). Effects of macrophyte species richness on wetland ecosystem functioning and services. Nature 411, 687–689. doi:10.1038/35079573
Gao, L., Tao, F., Liu, R., Wang, Z., Leng, H., and Zhou, T. (2022). Multi-scenario simulation and ecological risk analysis of land use based on the PLUS model: a case study of Nanjing. Sustain. Cities Soc. 85, 104055. doi:10.1016/j.scs.2022.104055
Greenhill, S., Druckenmiller, H., Wang, S., Keiser, D. A., Girotto, M., Moore, J. K., et al. (2024). Machine learning predicts which rivers, streams, and wetlands the Clean Water Act regulates. Science 383, 406–412. doi:10.1126/science.adi3794
Guan, D., Li, H., Inohae, T., Su, W., Nagaie, T., and Hokao, K. (2011). Modeling urban land use change by the integration of cellular automaton and Markov model. Ecol. Model. 222, 3761–3772. doi:10.1016/j.ecolmodel.2011.09.009
Hazbavi, Z., Sadeghi, S. H., Gholamalifard, M., and Davudirad, A. A. (2020). Watershed health assessment using the pressure–state–response (PSR) framework. Land Degrad. Dev. 31, 3–19. doi:10.1002/ldr.3420
He, X., Jia, M., Wang, Z., Ren, C., Zheng, H., Guo, Y., et al. (2017). Remote sensing based evaluation of effectiveness of wetland protection project in Sanjiang Plain, China. Bull. Chin. Acad. Sci. 32 (01), 3–10. doi:10.16418/j.issn.1000-3045.2017.01.001
Hishe, S., Bewket, W., Nyssen, J., and Lyimo, J. (2020). Analysing past land use land cover change and CA-Markov-based future modelling in the Middle Suluh Valley, Northern Ethiopia. Geocarto Int. 35, 225–255. doi:10.1080/10106049.2018.1516241
Hu, N., Wang, G., Ma, Z., Ren, Z., Zhao, M., and Meng, J. (2023). The cooling effects of urban waterbodies and their driving forces in China. Ecol. Indic. 156, 111200. doi:10.1016/j.ecolind.2023.111200
Hu, X., Liu, F., Qi, Y., Zhang, J., and Li, X. (2022). A novel strategy to assimilate category variables in land-use models based on Dirichlet distribution. Environ. Model. Softw. 149, 105324. doi:10.1016/j.envsoft.2022.105324
Kato, S., and Huang, W. (2021). Land use management recommendations for reducing the risk of downstream flooding based on a land use change analysis and the concept of ecosystem-based disaster risk reduction. J. Environ. Manag. 287, 112341. doi:10.1016/j.jenvman.2021.112341
Li, C., Yang, M., Li, Z., and Wang, B. (2021). How will Rwandan land use/land cover change under high population pressure and changing climate? Appl. Sci. 11, 5376. doi:10.3390/app11125376
Li, Y., Lin, J., Li, Y., and Nyerges, T. (2019). Developing a resilience assessment framework for the urban land–water system. Land Degrad. Dev. 30, 1107–1120. doi:10.1002/ldr.3297
Liang, X., Guan, Q., Clarke, K. C., Liu, S., Wang, B., and Yao, Y. (2021). Understanding the drivers of sustainable land expansion using a patch-generating land use simulation (PLUS) model: a case study in Wuhan, China. Comput. Environ. Urban Syst. 85, 101569. doi:10.1016/j.compenvurbsys.2020.101569
Liao, J., Jia, Y., Tang, L., Huang, Q., Wang, Y., Huang, N., et al. (2018). Assessment of urbanization-induced ecological risks in an area with significant ecosystem services based on land use/cover change scenarios. Int. J. Sustain. Dev. World Ecol. 25, 448–457. doi:10.1080/13504509.2017.1415234
Liao, J., Tang, L., and Shao, G. (2022). Multi-scenario simulation to predict ecological risk posed by urban sprawl with spontaneous growth: a case study of quanzhou. Int. J. Environ. Res. Public Health 19, 15358. doi:10.3390/ijerph192215358
Liu, W., Guo, Z., Jiang, B., Lu, F., Wang, H., Wang, D., et al. (2020). Improving wetland ecosystem health in China. Ecol. Indic. 113, 106184. doi:10.1016/j.ecolind.2020.106184
Liu, Z. F., Tang, L. N., Qiu, Q. Y., Xiao, L. S., and Yang, L. (2017). Temporal and spatial changes in habitat quality based on land-use change in Fujian province. Acta Ecol. Sin. 37, 4538–4548. doi:10.5846/stxb201602050263
Lou, Y., Zhao, K., Wang, G., Jiang, M., Lu, X., and Rydin, H. (2015). Long-term changes in marsh vegetation in Sanjiang Plain, northeast China. J. Veg. Sci. 26, 643–650. doi:10.1111/jvs.12270
Lu, X., and Liu, X. (2008). Wetland research progresses in China—dedicated to the 50th anniversary of northeast Institute of Geography and agroecology, CAS. Sci. Geogr. Sin. (03), 301–308. doi:10.3969/j.issn.1000-0690.2008.03.001
Mao, D., Wang, Z., Du, B., Li, L., Tian, Y., Jia, M., et al. (2020). National wetland mapping in China: a new product resulting from object-based and hierarchical classification of Landsat 8 OLI images. ISPRS J. Photogrammetry Remote Sens. 164, 11–25. doi:10.1016/j.isprsjprs.2020.03.020
Meng, L., and Dong, J. (2019). LUCC and ecosystem service value assessment for wetlands: a case study in nansi lake, China. Water 11, 1597. doi:10.3390/w11081597
Munguía, S. M., and Heinen, J. T. (2021). Assessing protected area management effectiveness: the need for a wetland-specific evaluation tool. Environ. Manag. 68, 773–784. doi:10.1007/s00267-021-01527-1
Nath, B., Wang, Z., Ge, Y., Islam, K., Singh, R., and Niu, Z. (2020). Land use and land cover change modeling and future potential landscape risk assessment using markov-CA model and analytical hierarchy process. ISPRS Int. J. Geo-Information 9, 134. doi:10.3390/ijgi9020134
Qu, Y., Zong, H., Su, D., Ping, Z., and Guan, M. (2021). Land use change and its impact on landscape ecological risk in typical areas of the Yellow River Basin in China. Int. J. Environ. Res. Public Health 18, 11301. doi:10.3390/ijerph182111301
Rashid, I., Aneaus, S., Dar, S. A., Javed, O., Khanday, S. A., and Bhat, S. U. (2023). A novel GIS-based multicriteria analysis approach for ascertaining the catchment-scale degradation of a Himalayan wetland. Environ. Res. 229, 115967. doi:10.1016/j.envres.2023.115967
Sadeghi, S. H., and Hazbavi, Z. (2017). Spatiotemporal variation of watershed health propensity through reliability-resilience-vulnerability based drought index (case study: shazand Watershed in Iran). Sci. Total Environ. 587, 168–176. –588. doi:10.1016/j.scitotenv.2017.02.098
Song, Z., Sun, Y., Chen, P., and Jia, M. (2022). Assessing the ecosystem health of coastal wetland vegetation (Suaeda salsa) using the pressure state response model, a case of the Liao River Estuary in China. Int. J. Environ. Res. Public Health 19, 546. doi:10.3390/ijerph19010546
Sun, B., Tang, J., Yu, D., Song, Z., and Wang, P. (2019). Ecosystem health assessment: a PSR analysis combining AHP and FCE methods for Jiaozhou Bay, China1. Ocean Coast. Manag. 168, 41–50. doi:10.1016/j.ocecoaman.2018.10.026
Sun, N., Chen, Q., Liu, F., Zhou, Q., He, W., and Guo, Y. (2023). Land use simulation and landscape ecological risk assessment on the qinghai-tibet plateau. Land 12, 923. doi:10.3390/land12040923
Tang, F., Fu, M., Wang, L., Song, W., Yu, J., and Wu, Y. (2021). Dynamic evolution and scenario simulation of habitat quality under the impact of land-use change in the Huaihe River Economic Belt, China. PLOS ONE 16, e0249566. doi:10.1371/journal.pone.0249566
Wang, C. (2016). Driving forces behind the construction of an eco-compensation mechanism for wetlands in China. Front. Earth Sci. 10, 487–497. doi:10.1007/s11707-016-0563-6
Wang, G., Jiang, M., Wang, M., and Xue, Z. (2019). Natural revegetation during restoration of wetlands in the Sanjiang Plain, northeastern China. Ecol. Eng. 132, 49–55. doi:10.1016/j.ecoleng.2019.04.001
Wei, R., Fan, Y., Wu, H., Zheng, K., Fan, J., Liu, Z., et al. (2024). The value of ecosystem services in arid and semi-arid regions: a multi-scenario analysis of land use simulation in the Kashgar region of Xinjiang. Ecol. Model. 488, 110579. doi:10.1016/j.ecolmodel.2023.110579
Xu, T., Weng, B., Yan, D., Wang, K., Li, X., Bi, W., et al. (2019). Wetlands of international importance: status, threats, and future protection. Int. J. Environ. Res. Public Health 16, 1818. doi:10.3390/ijerph16101818
Xu, T., Zhou, D., and Li, Y. (2022). Integrating ANNs and cellular Automata–Markov chain to simulate urban expansion with annual land use data. Land 11, 1074. doi:10.3390/land11071074
Zedler, J. B., and Kercher, S. (2005). WETLAND RESOURCES: status, trends, ecosystem services, and restorability. Annu. Rev. Environ. Resour. 30, 39–74. doi:10.1146/annurev.energy.30.050504.144248
Zhao, Y., Wang, G., Zhao, M., Wang, M., Hu, N., Jiang, M., et al. (2021). The potentials of wetland restoration after farming differ between community types due to their differences in seed limit and salt tolerances in the Songnen Plain, China. Ecol. Indic. 131, 108145. doi:10.1016/j.ecolind.2021.108145
Zhou, L., Dang, X., Sun, Q., and Wang, S. (2020). Multi-scenario simulation of urban land change in Shanghai by random forest and CA-Markov model. Sustain. Cities Soc. 55, 102045. doi:10.1016/j.scs.2020.102045
Keywords: land use simulation, ecological risks, the PLUS model, pressure-status-response (PSR) model, liaohe estuary national nature wetland reserve
Citation: Hu N, Wang G, Ma Z, Zhao M, Yuan Y, Zhang T, Chen Q, Meng J and Wang J (2024) Multi-scenario simulation of land use dynamics and ecological risk: a case study of the liaohe estuary national wetland reserve using PLUS-Markov and PSR models. Front. Environ. Sci. 12:1361970. doi: 10.3389/fenvs.2024.1361970
Received: 27 December 2023; Accepted: 26 February 2024;
Published: 06 March 2024.
Edited by:
Shuisen Chen, Guangzhou Institute of Geography, ChinaReviewed by:
Shahid Ahmad Dar, University of Kashmir, IndiaJavier Martínez-Vega, Spanish National Research Council (CSIC), Spain
Copyright © 2024 Hu, Wang, Ma, Zhao, Yuan, Zhang, Chen, Meng and Wang. This is an open-access article distributed under the terms of the Creative Commons Attribution License (CC BY). The use, distribution or reproduction in other forums is permitted, provided the original author(s) and the copyright owner(s) are credited and that the original publication in this journal is cited, in accordance with accepted academic practice. No use, distribution or reproduction is permitted which does not comply with these terms.
*Correspondence: Guodong Wang, d2FuZ2dkQGlnYS5hYy5jbg==