Enhanced defluoridation by nano-crystalline alum-doped hydroxyapatite and artificial intelligence (AI) modeling approach
 Nitin Pratap Varma1*
  Jaydev Kumar Mahato
- 1Department of Environmental Science and Engineering, Indian Institute of Technology, Dhanbad, India
- 2Environmental Science and Engineering Department, Indian Institute of Technology Bombay, Mumbai, India
The study aimed to investigate the defluoridation capacity of nano-hydroxyapatite (HAP) [Ca10(PO4)6(OH)2] and alum-doped hydroxyapatite (AHAP) [Ca8Al(PO4)6.(OH)2] as an environmental friendly adsorbent. The physicochemical characteristics of both the material (HAP and AHAP) were examined using XRD, FE-SEM-EDS, and BET techniques. The batch adsorption study revealed a fluoride removal efficiency of up to 83% (AHAP) and 74% (HAP) under acidic conditions (pH-2). The doping of alum alters the surface chemistry and enhances the affinity of AHAP for fluoride adsorption. The pseudo-second-order kinetic (R2–0.9941) and Langmuir isotherm (R2–0.9425) models best describe the adsorption mechanism and behavior. The thermodynamic analysis indicated the spontaneous and endothermic nature of the adsorption process. The study also tested the applicability of the artificial neural network (ANN) modeling approach using MATLAB R2013a to simulate the simulated absorptive efficiency of AHAP. This study suggests that AHAP proved an effective adsorbent for defluoridation.
1 Introduction
Fluoride is one of the most profuse elements and is found in groundwater around the globe. For both humans and animals, it is a crucial trace element (Shaji et al., 2024). The potential benefits or hazards of fluoride in water are determined by its concentration and the overall quantity consumed. The impact of fluoride levels in drinking water extends beyond human health, affecting various living organisms. Elevated fluoride concentrations influence the tissues of osseous (teeth and bones) and soft (liver, kidney, brain, etc.) (Jagtap et al., 2012; Ali et al., 2021; Choubisa et al., 2023). Additionally, alterations in the function and metabolism of the liver and kidneys are induced by increased fluoride levels (Yang et al., 2019; Singh et al., 2022). The main cause of fluoride in drinking water is the dissolution of fluoride-bearing minerals and rocks like fluorspar, cryolite, fluorite, and fluorapatite. However, unregulated industrial discharge is one of the biggest concerns pertaining to fluoride contamination (Chouhan and Flora, 2010). According to the World Health Organization (WHO), 1.5 mg/L for drinking water and 8 mg/L for industrial discharge are the recommended maximum concentration limits (MCLs) (WHO, 2008). In groundwater, the amount of fluoride ions can reach more than 30 mg/L. The daily consumption of 20–80 mg of fluoride over the duration of 10–20 years causes skeletal fluorosis, which causes severe bone damage (Singh et al., 2016; Lacson et al., 2021). It has also been reported to cause dental fluorosis, DNA aberrations, neurological damage, and interference with normal organ metabolism (Xiong et al., 2007; WHO, 2008; Chen et al., 2011; Singh et al., 2016; Amalraj and Pius, 2017). Around 200 million people worldwide have been reported to be affected by fluoride pollution. Fluorosis has adversely impacted India, with more than 66 million individuals, including 6 million children under the age of 14, being affected by this prevalent geochemical disease (Ayoob and Gupta, 2006; Prasad et al., 2014). Thus, it is crucial to defluoridate drinking water that contains a high amount of fluoride to protect public health. As a result, different methods for defluoridating aqueous solutions have been developed over the past decade.
Defluoridation of potable water is achieved through various physical and chemical methods (Chouhan and Flora, 2010). Bio-sorbents made from plant materials and bacterial bioremediation are two biological methods for phytoremediation and defluoridation of the air. Defluoridation technologies have been described, viz., adsorption, chemical precipitation, electrocoagulation, nanofiltration, reverse osmosis, and ion exchange (Ahmad et al., 2015; Nkansah et al., 2022). Among them, adsorption, especially mineral-based and surface-modified adsorbents, has shown promising results in removing excess fluoride from water, and it is one popular method for defluoridation (Mohapatra et al., 2009; Bhatnagar et al., 2011; Loganathan et al., 2013). Hydroxyapatite, Ca10(PO4)6(OH)2 (HAP) as calcium phosphate-based bioceramics is widely used in biotechnology and medical applications to repair damaged parts of the body as an implant. HAP as an adsorbent has demonstrated comparatively good defluoridation performance in several studies (Bhatnagar et al., 2011; Tang et al., 2022). Previous studies have demonstrated that the HAP’s surface hydroxyl groups are an active site for adsorption.
In current scenarios, significant efforts have been made to advance new and cost-effective sorbents for fluoride removal by impregnating low-cost adsorbents with chemicals, aiming to enhance defluoridation efficiency. Fluorine is a very undesirable element with a strange tendency to induce attraction by charged ions like metallic elements. Aluminum is frequently used in defluoridation methods due to its highly electropositive nature, which makes it easily able to interact with fluorine atoms. Tripathy et al. (2006) demonstrated 99% defluoridation performance using alum-impregnated activated alumina (Tripathy et al., 2006). Amalraj and Pius (2017) also demonstrated a significant fluoride adsorption efficiency of 26.03 mg/g using aluminum hydroxide-modified activated carbon. Hydroxyapatite has also been successfully modified with Aluminum (AHAP) to acquire an advanced defluoridation capacity of 32.57 mg F−/g than unmodified hydroxyapatite (HAP) with 16.38 mg F−/g capacity (Nie et al., 2012). Sasaki et al. (2017) have revealed that accelerated defluoridation results from the Al3+ ions’ effective transport of F- to the hydroxyapatite/fluorapatite precursor.
Artificial Neural Network (ANN) has gained increasing consideration for water quality prediction and treatment modeling simulation in recent years. This approach is particularly suitable in applications where the mechanisms underlying process performance are highly complex and non-linear, such as the adsorption process. Hence, ANN is a suitable approach for modeling the adsorptive efficiency of adsorbents (Mahato and Gupta, 2022).
In this study, the influence of alum (KAl(SO4)2.12H2O) on the adsorption of F− under biomimetically synthesized nano-crystalline HAP and Alum-doped HAP (AHAP) is examined. The adsorption parameter is studied beneath by contact time, pH, and reaction temperature on F− adsorption. Isotherms and kinetic models are also used to validate the experimental data. The kinetic, thermodynamic, and equilibrium analyses support the AHAP’s absorption mechanism. In addition, the adsorptive efficiency of AHAP was also simulated with the Artificial Neural Network (ANN) modeling approach using MATLAB R2013a.
2 Materials and methods
2.1 Chemicals
All the reagents used for synthesis include di-ammonium hydrogen phosphate [(NH4)2HPO4] (Merck, India) and calcium nitrate tetrahydrate [Ca(NO3)2.4H2O] (Rankem, India). Ammonium solution and polyvinyl alcohol (PVA) were acquired from Acros Organics and used without supplementary refinement.
Analytical grade alum (Aluminium potassium sulfate dodecahydrate, KAl(SO4)2·12H2O), sodium fluoride (NaF), sodium hydroxide (NaOH), and nitric acid (HNO3) were purchased from Merck (India). The stock solution of fluoride was prepared with deionized water using NaF, where HNO3 (0.1 M) and NaOH (0.1 M) solutions were used to adjust the pH of the solution.
2.2 Synthesis of Al-doped hydroxyapatite
Nano-hydroxyapatite (HAP) (Ca10(PO4)6(OH)2) was synthesized biomimetically using a chemical co-precipitation technique utilizing di-ammonium hydrogen phosphate and calcium nitrate tetrahydrate as precursors with PVA as stabilizing matrix, which controls the shape and size of HAP. The co-precipitation process is the most commonly used method for synthesizing HAP and has been discussed elsewhere (Sinha et al., 2003; Sinha et al., 2008). Setting the atomic ratio of [Ca + P] to 1.67 allowed the biomimetic synthesis of nano-hydroxyapatite (HAP).
Hydroxyapatite suspension was prepared using 5 g of dried HAP nanoparticles suspended in 100 mL double distilled water (DDW) followed by pH measurement of suspension (pH 7.5). To the suspension, 5.7 g of alum was added, and the pH was adjusted using 1N HNO3. The suspension’s final pH was set at 3, and it was stirred for 1.5 h at 70°C, followed by incubation for 1 h. Alum-doped HAP (AHAP) nanoparticles were obtained by processing the precipitates, cleaning them with DDW several times, and then air-drying them at 650°C for 24 h. The chemical structure of HAP and AHAP is illustrated in Figures 1A, B.
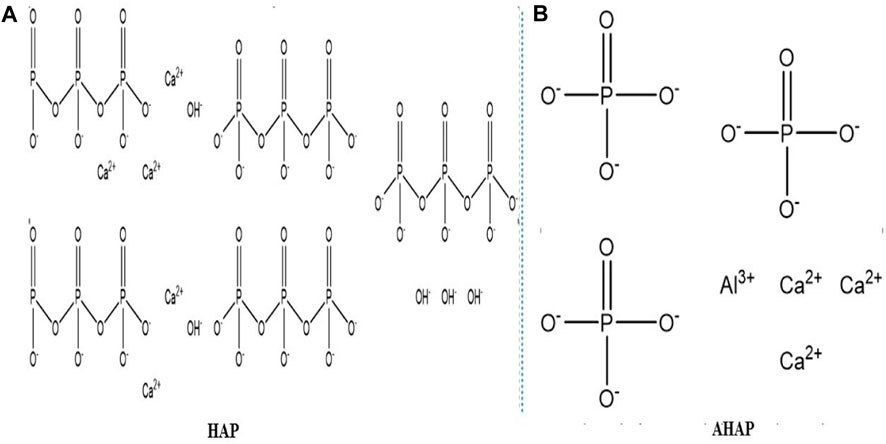
FIGURE 1. The chemical structure of (A) HAP and (B) AHAP.
2.3 Characterization of the adsorbents
The superficial morphology of HAP and AHAP was characterized by a Scanning Electron Microscope (FE-SEM, Zeiss Supra 55VP, United States) on a high-resolution instrument equipped with a Gemini Field Emission Column and an Energy Dispersive X-ray Spectrometer (EDS) probe (Phoenix) equipped with a sapphire detector for digital signal processing for semi-quantitative chemical analysis. X-ray diffraction (XRD) patterns of synthetic HAP and AHAP were captured before and after fluoride adsorption on an X-ray powder diffractometer, the (XRD, Bruker Advanced X-Ray Solutions, GMBH, Germany) to examine the structure of the adsorbent. The specific surface area of the HAP and AHAP was determined by the BET surface area analyzer (NOVA 4000e, Quantachrome Instruments, United States).
2.4 Adsorption experiments
Batch adsorption experiments were carried out in 100 mL Erlenmeyer flasks using the working volume of 50 mL. The flasks were closed and kept in an orbital thermostat shaker (Rivotek, Kolkata, India) after adding HAP/AHAP (0.5 g/L) to the fluoride solution at 180 rpm for 1 h. The effect of pH was examined with different pH values, i.e., 2, 3, 4, 5, 6, 7, 8, and 9 on adsorption. The effect of contact time was also analyzed by shaking the sample for 6 h at optimum pH. The adsorption kinetics were carried out at a constant temperature of 303 K. The thermodynamic study was conducted at 293 K, 303 K, and 313 K. The fluoride concentration was measured using pH/ISE meter (Orion Model, EA 940 Expandable Ion Analyzer) attached to fluoride–selective electrode (Orion Model 96–09). The blank solution was also run parallelly for fluoride measurement. All the experiments were performed in triplicate.
The equilibrium uptake of fluoride was calculated using Eq. 1:
where qt is the measure of fluoride adsorbed on the adsorbent (mg/g) at time t, C0 is the initial concentration of F− in solution (mML-1), Ct is the concentration of F− in solution (mg L-1) after time t, V is the volume of solution in (L) and W is the adsorbent weight (g) used. The data reported here are the average of the three readings from each experiment.
2.5 Artificial neural network (ANN) modeling
Applying an ANN model has recently been quite prevalent for predicting water quality. This study used a three-layered backpropagation neural network with a neural transfer function (purelin) at the output layer and a tangent sigmoid transfer function (tansig) at the hidden layer using MATLAB R2013a. The pH, contact time, and initial fluoride concentration were considered input parameters, and the percentage adsorption of fluoride was the output parameter. Of all the batch adsorption data sets, 70% was used for training, 15% for validation, and 15% for testing. All the data were normalized using the min-max normalization method to facilitate network learning and meet the required algorithm. This method normalizes the raw values in the range of 0–1 for better prediction and has the advantage of preserving all relationships in the data.
3 Results and discussions
3.1 Characteristics of the nanosized HAP and AHAP
The surface area of the HAP and AHAP examined by the BET was 154 m2 g−1 and 209 m2 g−1, respectively, indicating an enhancement in surface area after alum doping. The smaller particle size of the metal ions-doped HAP increased surface area. Various studies have acknowledged the increase in surface area after doping HAP (Karunakaran et al., 2019). X-ray diffraction patterns of synthesized HAP and AHAP are represented in Figures 2A, B. XRD peaks were used to characterize the crystallographic evidence about the materials. The XRD spectra of the HAP spectra show its crystalline nature (Figure 2A), confirming the presence of crystalline HAP, as demonstrated by (101), (111), (002), (210), (211), (112), (300), (202), (310), (311), (113), (203), (222), (312), (213), (321), (410), (411), (322), (313), (304), and (323), respectively. In addition, the aluminum doping might induce phase transformations within the hydroxyapatite structure. This could result in the formation of new phases or the disruption of the original crystal lattice, leading to a reduction in crystallinity. The XRD patterns of the synthetic AHAP (Figure 2B) and those of HAP were nearly identical. No peaks that resemble alum were found. There is no significant change in the peak structure after the composition formation. This may be due to the incorporation of an aluminum compound into hydroxyapatite. Similar XRD patterns were reported by Nie et al. (2012) and Kolekar et al. (2016).
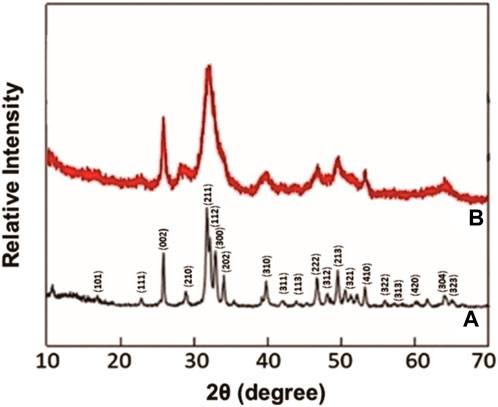
FIGURE 2. XRD diffraction pattern of (A) HAP and (B) AHAP.
SEM-EDS spectra analysis was conducted to evaluate the morphology microstructure and for quantifiable elemental component analysis of HAP and AHAP samples. Figure 3A shows an FE-SEM image of HAP revealing two particles of different shapes attached, forming a highly porous structure. Figure 3B shows the signal-originated structure for Al and S in the EDS spectra due to alum doped on HAP. Figure 3C shows the EDS spectra after the adsorption of F− onto HAP, and Figure 3D reveals surface adsorption of F− onto AHAP.
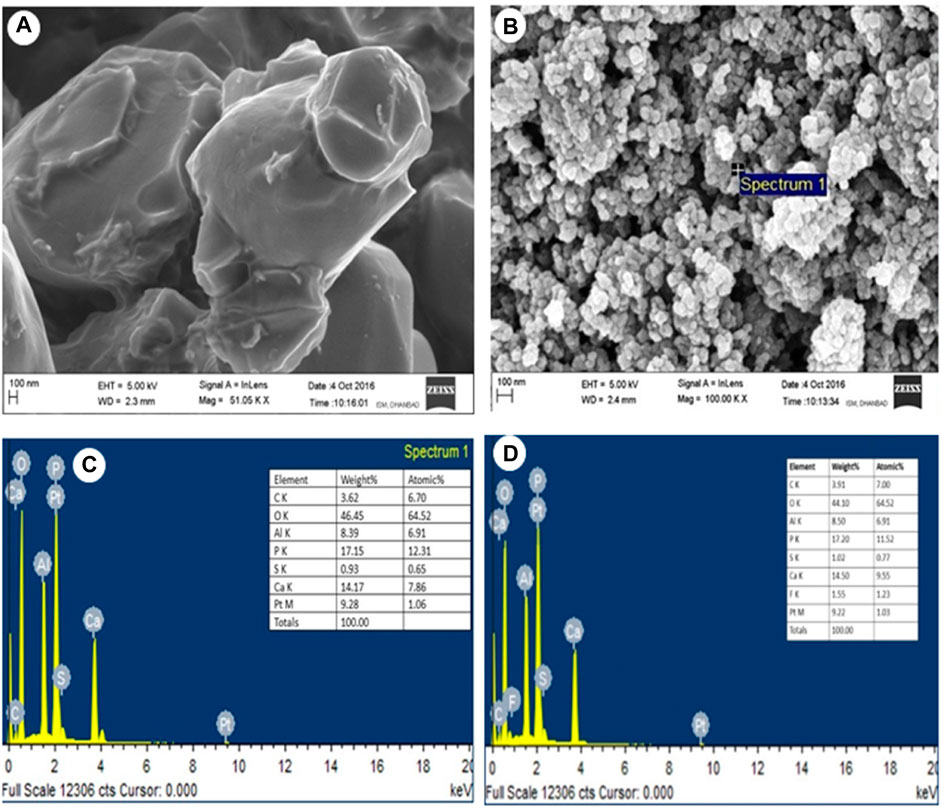
FIGURE 3. (A) FE-SEM image of AHAP (B) SEM-EDS analysis of AHAP (C) EDS analysis of AHAP before fluoride adsorption. (D) After fluoride adsorption.
3.2 Effect of pH
pH of the solution significantly affects the adsorption behaviors (Mahato and Gupta, 2020). It controls the adsorbent and adsorbate’s surface charges in solution. The highest uptake of F− was obtained at pH 2 for both HAP and AHAP, as shown in Figure 4. The adsorption of F− decreased monotonously with an increase in the pH of the solution. This suggests that as pH values were increased, the presence of OH− in the solution was increased, which could potentially compete with F− for the adsorption sites. This could be due to the two ions with similar charge and ionic radius (Nie et al., 2012). AHAP was found to be insoluble in all pH studies, exhibiting its applicability at a wider pH range.
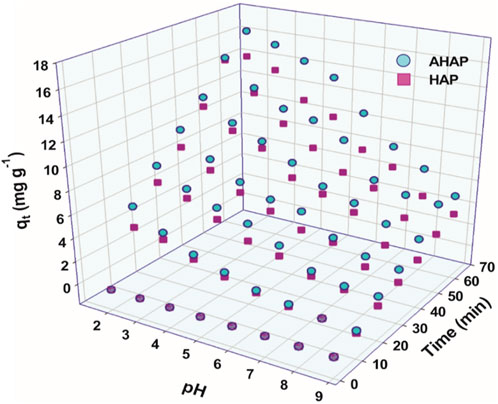
FIGURE 4. Effect of initial pH and time on the adsorption rate (mg g-1) of fluoride by HAP and AHAP.
3.3 Effect of contact time
The outcomes of the study on the impact of interaction time on the adsorption of F− by HAP and AHAP are shown in Figure 5. It can be observed from the figure that a quick removal of F− takes place in the first 2 h, followed by a subsequent reduction in the rate of removal till equilibrium at 3 h. Additionally, it was found that as the contact time increased, so did the amount of adsorption. After 3 h, the maximum adsorption capacity for both HAP and AHAP was achieved; afterward, there was almost no further increase in the adsorption. As a result, a fixed equilibrium contact time was chosen for the subsequent absorption experiment.
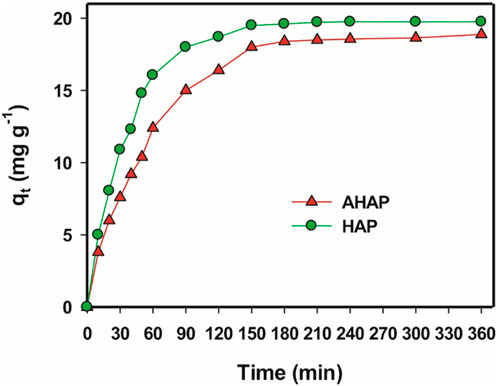
FIGURE 5. Effect of contact time on the defluoridation performance.
3.4 Effect of initial fluoride concentration
Figure 6 demonstrates the adsorption capacities of HAP and AHAP for F−, through adsorbent-adsorbate solutions at different concentrations of fluoride (0.217–1.08 mM/L). Visibly the adsorbed amount of F− increases by increasing the initial F-concentration. This is caused by the fact that there are more adsorbate ions present close to the adsorbents (Saber-Samandari et al., 2014).
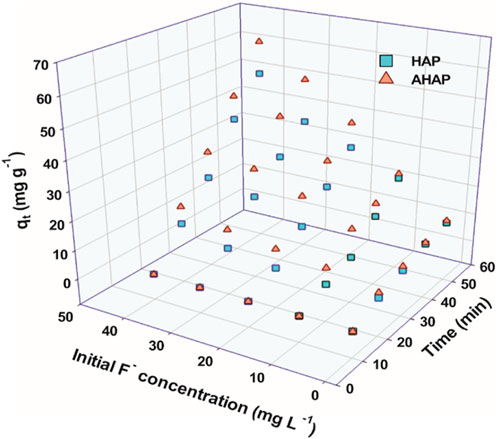
FIGURE 6. Effect of initial fluoride concentration and time on the adsorption amount mg g-1) of fluoride by HAP and AHAP.
3.5 Adsorption kinetics studies
The fluoride adsorption rate is highly dependent on contact time. To examine the dynamics of adsorption progression on HAP and AHAP, the pseudo-first-order, pseudo-second-order, Elovich, Bangham, and intraparticle diffusion models were applied. The pseudo-first-order rate reaction mechanism is explained in (Figure 7A). Pseudo-first-order equation is expressed as shown in Eq. (2):
where qe and qt (mg g-1) is the amount of F− adsorbed at equilibrium and at time t (min), respectively, and k1 (min-1) is the pseudo-first-order rate constant. Mousa et al. (2016) proposed a kinetic experimental model based on the free sites between inter-particle diffusion. The pseudo-second-order model is used on the hypothesis that adsorption follows a second-order mechanism, whereas the rate of sorption is proportional to the square of the number of untenanted sites (Ho et al., 2000). Pseudo-second-order equation is expressed as shown in Eq. 3.
where k2 represent the pseudo-second-order rate constant (g mg-1 min-1). The different parameters of the kinetics models are concisely shown in Table 1. The pseudo-second-order model can accurately represent the adsorption kinetics much more effectively than the pseudo-first-order model despite having strong correlation coefficients (R2–0.9941) Figure 7B and strong arrangements between experimental qexp and calculated qe values. In this instance, the adsorption of F- is likely caused by surface complexation reactions at specific adsorption sites, and the adsorption rate-limiting step may be chemisorption (Ersan et al., 2015).
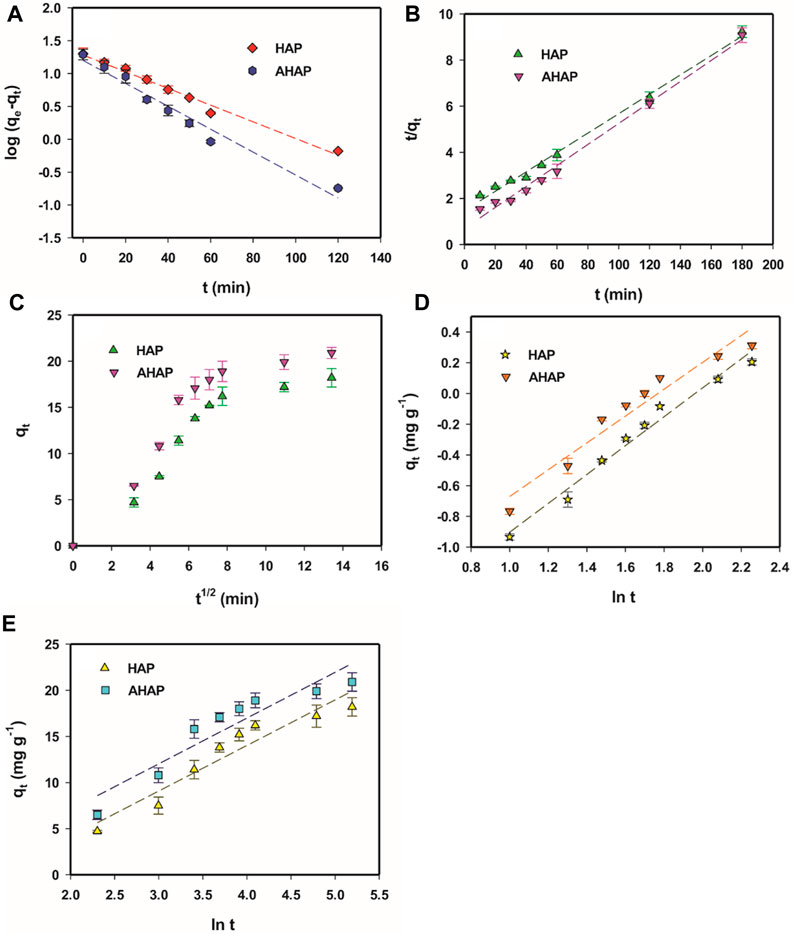
FIGURE 7. Pseudo first order plots for F− adsorption (A), Pseudo second order plots (B), Intraparticle diffusion model plots (C), Bangham model plots (D), and Elovich plots (E).

TABLE 1. Kinetic parameters for F− adsorption using HAP and AHAP.
This process is a rate preventive method and should be further envisaged. Pseudo-first-order and pseudo-second-order models cannot distinguish diffusion mechanisms during sorption. The diffusion mechanisms during the sorption process cannot be distinguished by pseudo-first-order or pseudo-second-order models. In order to better understand the intraparticle diffusion mechanism, Weber and Morris plots are useful as shown in Figure 7C, where qt can be calculated using Eq. 4.
Here, kp and C represent intraparticle diffusion rate constant and intercept, respectively, in mg g-1 min-1/2. When the diffusion mechanism is measured by intra-particle diffusion, the intercept C should cross the derivation (Saruchi, 2019). However, if the plot does not pass across the basis, as in this study, having an intercept (C) indicates the thickness of the boundary layer; a larger intercept suggests a greater boundary layer effect (Table 1). Additionally, it suggests that while intraparticle diffusion plays a role in adsorption, it is not the only rate-limiting mechanism. Other mechanisms, such as film diffusion, may also be involved. Most possibly, surface adsorption (pseudo-second-order) and intraparticle diffusion may occur simultaneously (Ghorai et al., 2013).
Adsorbate pore diffusion activities studied by the Bangham model (Figure 7D) which is expressed linearly as Eq. (5):
where C0 is the initial concentration of F− (mg L-1), V is solution volume (mL), M is the adsorbent weight (g/L), qt is the amount of adsorbate retained at time t (mg g-1), and α (<1), kB are constants, which can be attained from slope and intercept, respectively. Bangham’s plot should be linear if intraparticle diffusion is the only rate-controlling step. In the present study, the plot was in the linear form for each adsorbent with a good correlation coefficient value (>0.9), suggesting that a pore diffusion mechanism governs the adsorption of fluoride onto HAP and AHAP.
Assuming that the actual solid surfaces are actively heterogeneous, the Elovich equation (Figure 7E) illustrates the second-order kinetic, but the equation does not suggest any specific mechanism for adsorbate-adsorbent interaction (Sparks, 1989). It is widely acknowledged that a semi-empirical equation can adequately describe the chemosorption process (Zhang and Stanforth, 2005) and can be expressed as Eq. (6).
where qt (mg g-1) represents the amount of adsorbate adsorbed at time t, α is a constant related to chemisorption rate, and β is a constant that illustrates the level of surface exposure. The two constants (α and β) were obtained from the intercept and slope of the plot of qt versus ln(t), respectively, as shown in Table 1. The kinetic sorption curve fit well with the model with R2 > 0.8684 (Table 1). If the configuration is determined solely by equation, it may be assumed that diffusion is the rate-determining step, and this equation should apply in situations where the desorption rate can be neglected (Pavlatou and Polyzopouls, 1988; Rudzinksi and Panczyk, 1998).
3.6 Adsorption isotherms
Adsorption isothermal studies of HAP and AHAP were carried out at different temperatures between 293 K and 313 K. Langmuir (1916), Freundlich (1906), and Temkin and Pyzhev, (1940) isotherm models have all been investigated to examine the synergistic behavior between the adsorbent and adsorbate molecules and the designed parameters are shown in Table 2. The Langmuir isotherm is valid for monolayer sorption because the surface is uniform and composed of a finite number of equivalent and identical localized sites, with no steric hindrance or lateral interaction between the adsorbed molecules, even on adjacent sites. According to the Langmuir Isotherm, the sorption of pollutants on solids can be described by Eq. 7:
where, qe = fluoride removal capacity at equilibrium (mg g-1); Q = maximum monolayer coverage capacities (mg g-1); KL = Langmuir isotherm constant (L mg-1); Ce = at equilibrium concentration (mg L-1). Plot of 1/qe vs. 1/Ce yields the values of slope and intercept from which the values of KL and Q were calculated. The computed maximum adsorption capability (Q) for AHAP was 0.905 mML-1 at 40°C, suggesting significantly larger adsorption than HAP (0.558 mML-1). According to Ayad and El-Nasar (2010), an important characteristic of the Langmuir isotherm can be expressed in terms of a dimensionless factor called the separation factor (RL), which is defined by the following Eq. (8):
where KL (L mg-1) is the Langmuir constant relates to the heat of adsorption and C0 is the initial concentration of F− (mg L-1). The isotherm’s shape is determined by the value of RL, which can be unfavorable (RL > 1), linear (RL = 1), irreversible (RL = 0), or favorable (0 RL 1). RL was between zero and unity, indicating that F− adsorption was advantageous, and as the temperature rose, it got closer to zero, indicating irreversible adsorption (Ghorai et al., 2013).
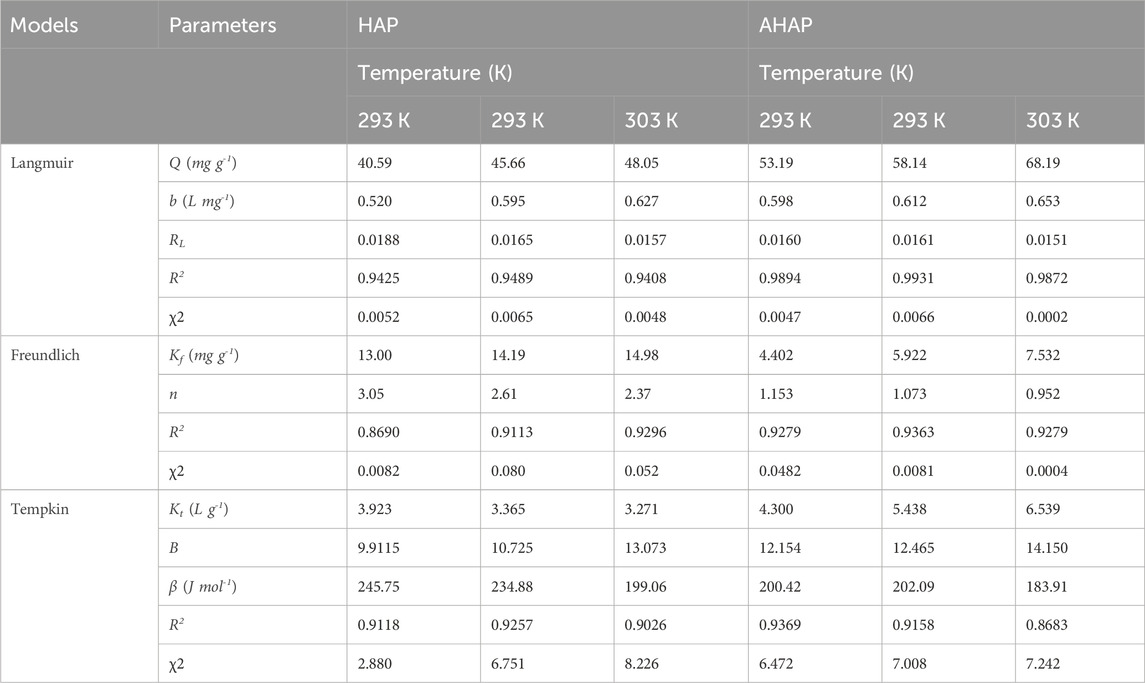
TABLE 2. Parameters for different isotherm models for F− adsorption using AHAP.
The Freundlich isotherm assumes that multilayer sorption occurs to take up F- molecules on a heterogeneous surface. Eq. 9 is given below and represents the linear form of the Freundlich isotherm model.
Where Ce = equilibrium concentration (mg L-1); n = adsorption intensity; qe = amount of adsorbate in the adsorbent at equilibrium (mg g-1); Kf = Freundlich isotherm constant (mg g-1) proportional to adsorption capacity. The applicability of the Freundlich equation was indicated by the linear plot of log qe vs log Ce. The value of 1/n determined from the Freundlich isotherm plot denotes adsorption intensity. Generally, 0.1 < 1/n < 0.5 is regarded as easily absorbing; 0.5 < 1/n < 1, some difficulties exist with the adsorption; 1/n > 1, it is quite difficult to adsorb (Ozbay et al., 2013). When the F- ions were either simple to adsorb or there were some challenges, the scale of variation in 1/n, with a value ranging from 0.5 to 0.56, became apparent, accelerating with an increase in reaction temperature. Moreover, a value of 1/n below unity in this study implies the occurrence of the chemisorption process (Wu, 2007).
Temkin isotherm model, specifically takes adsorbing species-adsorbent interactions into account. Adsorbent-adsorbate interactions cause all of the molecules in the layer’s heat of adsorption to fall linearly with surface coverage. The adsorption is assumed to be characterized by a continuous distribution of binding energies up to a maximum binding energy (Temkin and Pyzhev, 1940; Mall et al., 2005). The linear form of Temkin isotherm equation is given as shown in Eq. 10.
where
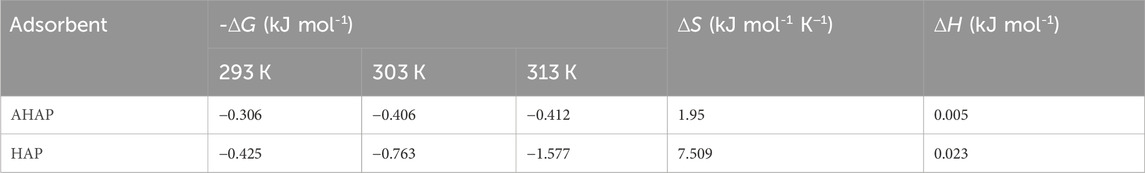
TABLE 3. Thermodynamic parameters for the adsorption of F− using AHAP.
3.7 Thermodynamic study
Thermodynamic parameters, like change in Gibb’s free energy (∆G⁰), and can be calculated using Eqs (11)–(12), change in entropy (∆S⁰), and change in enthalpy (∆H⁰) were calculated using Van’t Hoff’s equation from a plot of ln KL versus 1/T and are documented in Table 3.
where, KL = Langmuir adsorption constant (L mg-1); ∆S⁰ = adsorption entropy (J mol-1 K−1); ∆H⁰ = apparent enthalpy of adsorption (kJ mol-1); ∆G⁰ = adsorption free energy (kJ mol-1); R = gas constant (0.008314 kJ mol K−1); T = solution temperature (K). The experimental values of ∆G⁰, ∆S⁰ and ∆H⁰ were determined from the linear plot of ln KL vs. 1/T. The endothermic nature of adsorption is confirmed by the positive values of ∆H⁰ and ∆S⁰, which is supported by the increase in the adsorption of F− with temperature. It might be due to the displaced water molecules’ higher translational entropy acquisition than the entropy lost due to F- uptake onto HAP and AHAP. It is evident that all of the tested temperatures had negative free energy values (∆G⁰). The positive ∆S⁰ value implied that the adsorption reaction is related to a dissociative mechanism and improved randomness during adsorption because ∆S⁰ > -10–2 kJ mol-1 typically denotes a dissociative mechanism (Aksu and Isoglu, 2005). The higher translational entropy might cause the displaced water molecules to be acquired compared to what was lost from F-uptake onto HAP and AHAP. All the tested temperatures had negative free energy values (∆G⁰). This demonstrates that the adsorption is spontaneous and advantageous from a thermodynamic standpoint. Additionally, the greater driving force of adsorption implied by the more negative value of (∆G⁰) with a temperature rise indicated a higher adsorption capacity (Saber-Samandari et al., 2014).
3.8 ANN simulation of AHAP’s adsorption efficiency
The ANN model obtained a good relationship from the training data and performed relatively well in the validation and testing (Figures 8A–D). The value of correlation coefficients (R2- 0.9996) also confirms the predictive ability of the ANN model for the simulation of the adsorption efficiency of AHAP. Overall, the ANN modeling approach performed satisfactorily for the batch adsorption experimental dataset of the present study. The higher generalization capacity of ANN increased its tolerance to noisy data, eliminating the chances of any biased prediction (Mahato and Gupta, 2022).
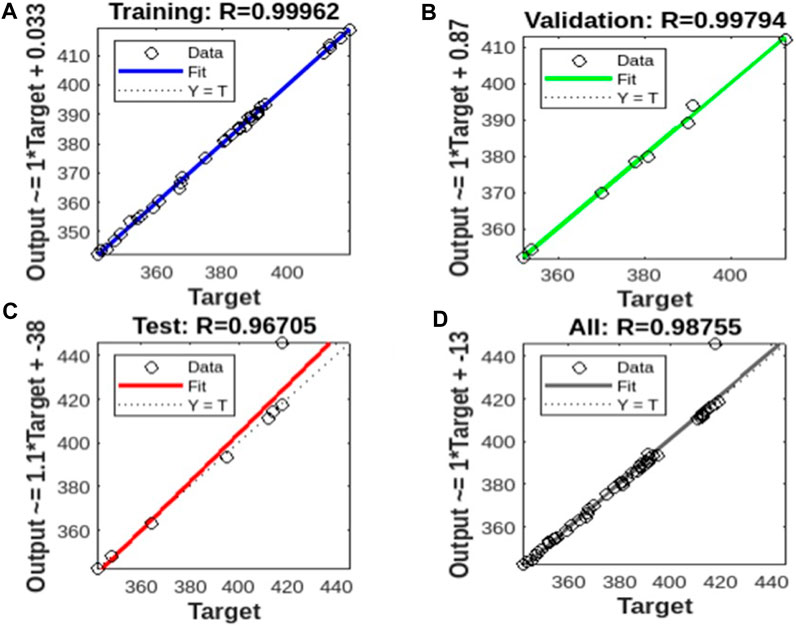
FIGURE 8. ANN model plot on (A) the training set, (B) the validation set, (C) the test set, and (D) the whole dataset.
4 Conclusion
HAP and AHAP were synthesized biomimetically using a chemical co-precipitation technique.
Both adsorbents exhibited the effective capability of defluoridation under acidic conditions. However, the maximum fluoride adsorption capacity of AHAP (68.19 mg/g) was observed to be higher than HAP (48.05 mg/g), which was attributed to the alum doping. The Langmuir isotherms model was more suitable for fitting experimental data, demonstrating the monolayer adsorption process. The application of ANN modeling best simulated (R2- 0.9996) the adsorptive efficiency of AHPA. The study provides promising development direction of AHPA for effective and environmentally safe defluoridation.
Data availability statement
The raw data supporting the conclusion of this article will be made available by the authors, without undue reservation.
Author contributions
NV: Writing–original draft. AS: Supervision, Writing–original draft, Writing–review and editing. SG: Conceptualization, Writing–review and editing. JM: Conceptualization, Investigation, Writing–review and editing. PC: Data curation, Writing–review and editing.
Funding
The author(s) declare that no financial support was received for the research, authorship, and/or publication of this article.
Acknowledgments
The authors thank the Department of Environmental Science and Engineering, Indian Institute of Technology (Formality Indian School of Mines), Dhanbad-826004, India, for providing the necessary facilities for conducting these experiments.
Conflict of interest
The authors declare that the research was conducted in the absence of any commercial or financial relationships that could be construed as a potential conflict of interest.
Publisher’s note
All claims expressed in this article are solely those of the authors and do not necessarily represent those of their affiliated organizations, or those of the publisher, the editors and the reviewers. Any product that may be evaluated in this article, or claim that may be made by its manufacturer, is not guaranteed or endorsed by the publisher.
References
Ahmad, M. A., Ahmad, N., and Bello, O. S. (2015). Modified durian seed as adsorbent for the removal of methyl red dye from aqueous solutions. Appl. Water Sci. 5, 407–423. doi:10.1007/s13201-014-0208-4
Aksu, Z., and Isoglu, I. A. (2005). Removal of copper (II) ions from aqueous solution by biosorption onto agricultural waste sugar beet pulp. Process Biochem. 40, 3031–3044. doi:10.1016/j.procbio.2005.02.004
Ali, S., Mahato, K., Gupta, S. K., Sinha, A., and Islam, R. (2021). Defluoridation of ground-water using formaldehyde-treated agricultural waste-wheat, oats, and pea straw. Eart Envi Scie Res Rev 4 (2), 109–115.
Amalraj, A., and Pius, A. (2017). Removal of fluoride from drinking water using aluminium hydroxide coated activated carbon prepared from bark of Moringa tinctoria. Appl. Water Sci. 7, 2653–2665. doi:10.1007/s13201-016-0479-z
Ayad, M. M., and El-Nasr, A. A. (2010). Adsorption of cationic dye (methylene blue) from water using polyaniline nanotubes base. J. Phys. Chem. C 114, 14377–14383. doi:10.1021/jp103780w
Ayoob, S., and Gupta, A. K. (2006). Fluoride in drinking water: a review on the status and stress effects. Crit. Rev. Environ. Sci. Technol. 36 (6), 433–487. doi:10.1080/10643380600678112
Bhatnagar, A., Kumar, E., and Sillanpää, M. (2011). Fluoride removal from water by adsorption- A review. Chem. Eng. J. 171 (3), 811–840. doi:10.1016/j.cej.2011.05.028
Chen, N., Zhang, Z., Feng, C., Zhu, D., Yang, Y., and Sugiura, N. (2011). Preparation and characterization of porous granular ceramic containing dispersed aluminum and iron oxides as adsorbents for fluoride removal from aqueous solution. J. Hazard. Mater. 186, 863–868. doi:10.1016/j.jhazmat.2010.11.083
Choubisa, S. L., Choubisa, D., and Choubisa, A. (2023). Fluoride contamination of groundwater and its threat to health of villagers and their domestic animals and agriculture crops in rural Rajasthan, India. Environ. Geochem. Health 45 (3), 607–628. doi:10.1007/s10653-022-01267-z
Chouhan, S., and Flora, S. J. S. (2010). Arsenic and fluoride: two major ground water pollutants. Indian J. Exp. Biol. 48, 666–678.
Ersan, M., Guler, U. A., Acıkel, U., and Sarioglu, M. (2015). Synthesis of hydroxyapatite/clay and hydroxyapatite/pumice composites for tetracycline removal from aqueous solutions. Process Saf. Environ. Prot. 96, 22–32. doi:10.1016/j.psep.2015.04.001
Freundlich, H. M. F. (1906). Uber die Adsorption in Lösungen. Z. für Phys. Chem. 57, 385–470. doi:10.1515/zpch-1907-5723
Ghorai, S., Sarkar, A. K., Panda, A. B., and Pal, S. (2013). Effective removal of Congo red dye from aqueous solution using modified xanthan gum/silica hybrid nanocomposite as adsorbent. Bioresour. Technol. 144, 485–491. doi:10.1016/j.biortech.2013.06.108
Ho, Y. S., Mckay, G., Wase, D. J., and Foster, C. F. (2000). Study of the sorption of divalent metal ions on to peat. Adsorpt. Sci. Technol. 18, 639–650. doi:10.1260/0263617001493693
Jagtap, S., Yenkie, M. K., Labhsetwar, N., and Rayalu, S. (2012). Fluoride in drinking water and defluoridation of water. Chem. Rev. 112 (4), 2454–2466. doi:10.1021/cr2002855
Karunakaran, G., Cho, E.-B., Kumar, G. S., Kolesnikov, E., Janarthanan, G., Pillai, M. M., et al. (2019). Ascorbic acid-assisted microwave synthesis of mesoporous Ag-doped hydroxyapatite nanorods from biowaste seashells for implant applications. ACS Appl. Bio Mater. 2, 2280–2293. doi:10.1021/acsabm.9b00239
Kolekar, T. V., Thorat, N. D., Yadav, H. M., Magalad, V. T., Shinde, M. A., Bandgar, S. S., et al. (2016). Nanocrystalline hydroxyapatite doped with aluminium: a potential carrier for biomedical applications. Ceram. Int. 42, 5304–5311. doi:10.1016/j.ceramint.2015.12.060
Lacson, C. F. Z., Lu, M.-C., and Huang, Y.-H. (2021). Fluoride-containing water: a global perspective and a pursuit to sustainable water defluoridation management -An overview. J. Clean. Prod. 280, 124236. doi:10.1016/j.jclepro.2020.124236
Langmuir, I. (1916). The constitution and fundamental properties of solids and liquids. J. Am. Chem. Soc. 38, 2221–2295. doi:10.1021/ja02268a002
Loganathan, P., Vigneswaran, S., Kandasamy, J., and Naidu, R. (2013). Defluoridation of drinking water using adsorption processes. J. Hazard. Mater. 248 (249), 1–19. doi:10.1016/j.jhazmat.2012.12.043
Mahato, J. K., and Gupta, S. K. (2020). Modification of Bael fruit shell and its application towards Natural organic matter removal with special reference to predictive modeling and control of THMs in drinking water supplies. Environ. Technol. Innovation 18, 100666. doi:10.1016/j.eti.2020.100666
Mahato, J. K., and Gupta, S. K. (2022). Exploring applicability of artificial intelligence and multivariate linear regression model for prediction of trihalomethanes in drinking water. Int. J. Environ. Sci. Technol. 19 (6), 5275–5288. doi:10.1007/s13762-021-03392-1
Mall, I. D., Srivastava, V. C., Agarwal, N. K., and Mishra, I. M. (2005). Removal of congored from aqueous solution by bagasse fly ash and activated carbon: kinetic study and equilibrium isotherm analyses. Chemosphere 61, 492–501. doi:10.1016/j.chemosphere.2005.03.065
Mohapatra, M., Anand, S., Mishra, B. K., Giles, D. E., and Singh, P. (2009). Review of fluoride removal from drinking water. J. Environ. Manag. 91 (1), 67–77. doi:10.1016/j.jenvman.2009.08.015
Mousa, S. M., Ammar, S. N., and Ibrahim, H. A. (2016). Removal of lead ions using hydroxyapatite nano-material prepared from phosphogypsum waste. J. Saudi Chem. Soc. 20, 357–365. doi:10.1016/j.jscs.2014.12.006
Nie, Y., Hu, C., and Kong, C. (2012). Enhanced fluoride adsorption using Al (III) modified calcium hydroxyapatite. J. Hazard. Mater. 233-234, 194–199. doi:10.1016/j.jhazmat.2012.07.020
Nkansah, M. A., Dua, A. B., Aryee, G. A., and Adusei-Gyamfi, J. (2022). Evaluation of scales of Tilapia sp. and sciaenops ocellatus as low cost and green adsorbent for fluoride removal from water. Front. Chem. 10, 813533. doi:10.3389/fchem.2022.813533
Ozbay, İ., Ozdemir, U., Ozbay, B., and Veli, S. (2013). Kinetic, thermodynamic, and equilibrium studies for adsorption of azo reactive dye onto a novel waste adsorbent: charcoal ash. Desalination Water Treat. 51 (31-33), 6091–6100. doi:10.1080/19443994.2013.763387
Pavlatou, A., and Polyzopouls, N. A. (1988). The role of diffusion in the kinetics of phosphate desorption: the relevance of the Elovich equation. Eur. J. Soil Sci. 39, 425–436. doi:10.1111/j.1365-2389.1988.tb01228.x
Prasad, K. S., Amin, Y., and Selvaraj, K. (2014). Defluoridation using biomimetically synthesized nano zirconium chitosan composite: kinetic and equilibrium studies. J. Hazard. Mater. 276, 232–240. doi:10.1016/j.jhazmat.2014.05.038
Rudzinksi, W., and Panczyk, P. (1998). in Surfaces of nanoparticles and porous materials. Editors J. A. Schwarz, and C. I. Contescu (New York: Dekker), 355.
Saber-Samandari, S., Saber-Samandari, S., Nezafati, N., and Yahya, K. (2014). Efficient removal of lead (II) ions and methylene blue from aqueous solution using chitosan/Fe-hydroxyapatite nanocomposite beads. J. Environ. Manag. 146, 481–490. doi:10.1016/j.jenvman.2014.08.010
Saruchi, K. V. (2019). Adsorption kinetics and isotherms for the removal of rhodamine B dye and Pb+2 ions from aqueous solutions by a hybrid ion-exchanger. Arabian J. Chem. 12 (3), 316–329. doi:10.1016/j.arabjc.2016.11.009
Sasaki, K., Nagato, S., Ideta, K., Miyawaki, J., and Hirajima, T. (2017). Enhancement of fluoride immobilization in apatite by Al3+ additives. Chem. Eng. J. 311, 284–292. doi:10.1016/j.cej.2016.11.096
Shaji, E., Sarath, K. V., Santosh, M., Krishnaprasad, P. K., Arya, B. K., and Babu, M. S. (2024). Fluoride contamination in groundwater: a global review of the status, processes, challenges, and remedial measures. Geosci. Front. 15 (2), 101734. doi:10.1016/j.gsf.2023.101734
Singh, J., Singh, P., and Singh, A. (2016). Fluoride ions vs removal technologies: a study. Arabian J. Chem. 9, 815–824. doi:10.1016/j.arabjc.2014.06.005
Singh, Y., Solanki, M. A., Gupta, A. B., SanjeevGupta, P. S., and Shukla, P. (2022). Fluoride occurrences, health problems, detection, and remediation methods for drinking water: a comprehensive review. Sci. Total Environ. 807, 150601. doi:10.1016/j.scitotenv.2021.150601
Sinha, A., Nayar, S., Agrawal, A., Bhattacharyya, D., and Ramachandrarao, P. (2003). Synthesis of nanosized and microporous precipitated hydroxyapatite in synthetic polymers and biopolymers. J. Am. Ceram. Soc. 86, 357–359. doi:10.1111/j.1151-2916.2003.tb00024.x
SinhaMishra, A. T., and Ravishankar, N. (2008). Polymer assisted hydroxyapatite microspheres suitable for biomedical application. J. Mater. Sci. Mater. Med. 19, 2009–2013. doi:10.1007/s10856-007-3286-0
Tang, J., Xiang, B., Li, Y., Tan, T., and Zhu, Y. (2022). Adsorption characteristics and charge transfer kinetics of fluoride in water by different adsorbents. Front. Chem. 10, 917511. doi:10.3389/fchem.2022.917511
Temkin, M. J., and Pyzhev, V. (1940). Recent modifications to Langmuir isotherms. Acta Physicochem. URSS 12, 217–222.
Tripathy, S. S., Bersillon, J. L., and Gopal, K. (2006). Removal of fluoride from drinking water by adsorption onto alum-impregnated activated alumina. Sep. Purif. Technol. 50, 310–317. doi:10.1016/j.seppur.2005.11.036
Who, (2008). Guidelines for drinking water quality incorporating 1st and 2nd addenda, recommendations. 3rd edn. Geneva: World Health Organization.
Wu, C. H. (2007). Adsorption of reactive dye onto carbon nanotubes: equilibrium, kinetics and thermodynamics. J. Hazard. Mater. 144, 93–100. doi:10.1016/j.jhazmat.2006.09.083
Xiong, X., Liu, J., He, W., Xia, T., He, P., Chen, X., et al. (2007). Dose–effect relationship between drinking water fluoride levels and damage to liver and kidney functions in children. Environ. Res. 103, 112–116. doi:10.1016/j.envres.2006.05.008
Yang, K., Liang, X., and Quan, C. (2019). Reference module in earth systems and environmental sciences. Amsterdam, Netherlands: Elsevier, 34. doi:10.1016/B978-0-12-409548-9.11083-8
Keywords: nano-hydroxyapatite, alum, defluoridation, Bangham kinetics, ANN
Citation: Varma NP, Sinha A, Gupta SK, Mahato JK and Chand P (2024) Enhanced defluoridation by nano-crystalline alum-doped hydroxyapatite and artificial intelligence (AI) modeling approach. Front. Environ. Sci. 12:1363724. doi: 10.3389/fenvs.2024.1363724
Received: 05 January 2024; Accepted: 07 February 2024;
Published: 05 March 2024.
Edited by:
Tavishi Tewary, Fore School of Management, IndiaReviewed by:
Deep Raj, SRM University, IndiaAneek Kuila, Technion Israel Institute of Technology, Israel
Copyright © 2024 Varma, Sinha, Gupta, Mahato and Chand. This is an open-access article distributed under the terms of the Creative Commons Attribution License (CC BY). The use, distribution or reproduction in other forums is permitted, provided the original author(s) and the copyright owner(s) are credited and that the original publication in this journal is cited, in accordance with accepted academic practice. No use, distribution or reproduction is permitted which does not comply with these terms.
*Correspondence: Nitin Pratap Varma, nitinpratapvarma@yahoo.com; Jaydev Kumar Mahato, jay_devkumar@rediff.com