Spatial-temporal evolution of plateau and plain lakes and climate driving factors based on Google Earth Engine platform
 Qiaozhen Guo
 Guang Yang1
  Xiaoxu Wu
- 1School of Geology and Geomatics, Tianjin Chengjian University, Tianjin, China
- 2State Key Laboratory of Remote Sensing Science, Faculty of Geographical Science, Beijing Normal University, Beijing, China
- 3School of Basic Science, Tianjin Agricultural University, Tianjin, China
Accurate understanding of lake water dynamic changes is beneficial to sustainable utilization of water resources and maintenance of ecological balance. Lake change is sensitively reflective of climate and environment change. This study chooses plateau lake and plain lake as the study area, and uses Landsat TM/ETM+/OLI and meteorological data as data source. Based on the Google Earth Engine platform, lake areas are extracted using NDWI method, and lake morphological characteristics are analyzed. The model between climate factors and lake area is established and analyzed in sections according to the difference of lake change trend. The results indicate that the morphological characteristic index of the plateau lakes changes little, but that of the plain lakes changes greatly. Precipitation in the plain lakes fluctuates more violently than that in the plateau lakes. The temperature fluctuation in the plateau lakes is larger than that in the plain lakes.
1 Introduction
Lakes are an important part of the terrestrial hydrosphere. They are able to affect and improve the regional ecological environment, and they are closely related to human production and life (Wantzen et al., 2008). They are the main body of the terrestrial water cycle and also the precious natural resources (Li et al., 2013; Ma et al., 2019; Qiao et al., 2019). The lake is not only a special natural complex, but also a storage site of water resources, participating in the material and energy cycle of nature (Zhang et al., 2017). The formation and disappearance, expansion and contraction of lakes, and their incurred ecological environment change are all caused by interaction between tectonic and climate events at local, regional and global scales (Haghighi and Kløve, 2015). Due to the sensitive response to global warming as well as the impact of human activities, the water level and area of most terrestrial lakes have decreased (Du et al., 2011; Xiao et al., 2016; Wurtsbaugh et al., 2017). Between 1984 and 2015 almost 90,000 square kilometers of permanent surface water around the world disappeared (Pekel et al., 2016). Some lakes have broken up and dried up, and the groundwater level around the lakes has decreased and the water area has decreased. This renders water yield of the lakes cannot make ends meet. Therefore, the study on the dynamic change of lake water is helpful to evaluate the impact of climate change and human activities on regional water resource change (Nie et al., 2013). It provides scientific basis for maintaining ecological balance, rationally allocating water resources and promoting sustainable development of ecological environment. It is of great significance to understand the correlation between lake dynamic and climate change.
With the rapid development of remote sensing technology, remote sensing satellites with high temporal and spatial resolution have been successfully launched and put used, which makes remote sensing technology more rapid and effective in solving long-term and large-area dynamic monitoring of ground objects (Huang et al., 2018). Moreover, the remote sensing technology is conducive to study the trend of dynamic changes of the land surface and predict its future development (Al-Bakri et al., 2013; Karimi et al., 2017; Liu et al., 2020a). It can not only quickly obtain abundant satellite image data, but also scientifically interpret and analyze the image to get the required data results.
At present, using remote sensing technology to extract information, such as lake water boundary and water area, has become a widely used method to study the changes of lake area (Chipman, 2019). It is difficult to monitor the most of lakes with traditional methods. Remote sensing has the advantages of rapid, comprehensive and timely reflecting the characteristics of lake area changes. Many researches (Lei et al., 2014; Jiang et al., 2017; Nielsen et al., 2017; Xia et al., 2019; Zhang et al., 2019) have been conducted on the dynamic changes of lakes using remote sensing technology, mainly focusing on the area and water level of lakes, that is their shrinkage, expansion and related causes. This is of great significance for understanding the dynamic changes of regional waters, ecological environment change, climate change and sustainable development. With the development in recent decades, abundant regional and global databases on lakes and wetlands have been established in many countries (Mao et al., 2018; Busker et al., 2019). They are used to study the response of lake change to climate change and human activities. The data used in the study of the dynamic change of lake water mainly include Landsat image (Jennifer et al., 2012; Olmanson and Bauer, 2017), HJ-1 (Liu et al., 2020b; Lu et al., 2020), China and Brazil Earth Resource Satellite (CBERS) (Ma et al., 2010), Multiple Altimeter Beam Experimental Lidar (MABEL) (Ma et al., 2019), Moderate Resolution Imaging Spectroradiometer (MODIS) (Hou et al., 2017; Lu et al., 2017), Advanced Spaceborne Thermal Emission and Reflection Radiometer (ASTER) (Ryu et al., 2002), laser altimetry data (Li et al., 2018; Cui et al., 2020), and radar (Yuan et al., 2019).
In terms of lake research, many methods have been proposed to extract lake, including water index method (McFEETERS, 1996; Xu, 2006; Feyisa et al., 2014), support vector machine (SVM) (Yang et al., 2015), single-band threshold method (Frazier and Page, 2000) and multi-band spectral relationship method (Haibo et al., 2011). The water index method is now a widely used water extraction method. It is able to suppress the information of other features and highlight the water information, by normalizing the band. In 1996, McFeeters built a normalized differential water index (NDWI), based on the green band and near-infrared band. NDWI method utilizes the reflection characteristics of water in green band and near infrared band to highlight water information and reduce the effect of vegetation and soil on the water extraction results (McFEETERS, 1996). Based on the NDWI method, the modified normalized difference water index (MNDWI) is established by replacing the near-infrared band in NDWI with the mid-infrared band, and the MNDWI is found better in water extraction in urban built-up area (Xu, 2006).
Traditional remote sensing methods are very time-consuming in obtaining and processing a large number of satellite imagery, so remote sensing images of large spatial coverage and long time are seldomly used. Google Earth Engine (GEE) has improved the traditional remote sensing processing methods (Kumar and Mutanga, 2018). Its huge remote sensing image data set and high-performance computing power have helped researchers successfully map land cover, mangrove and surface water and become a new approach for long-term and large-scale analysis (Gorelick et al., 2017). The influence of lake change varies with different altitude and geographical environment, therefore in this study, two typical plateau lakes and two typical plain lakes in China are selected to conduct a comparative analysis. Based on GEE platform, long-time series Landsat data are used for analysis on dynamic change of lake water. The morphological characteristics and migration of the lake centroid of the four lakes are further analyzed. Furthermore, the relationship between lake area and key climate factors, including precipitation, temperature, wind speed, and sunshine duration, is analyzed.
2 Study area and data
Qinghai Lake, Namco Lake, Cuiping Lake and Hengshui Lake are chosen as the study area. Qinghai Lake is located in the northeastern part of the Qinghai-Tibet Plateau and within the Qinghai Province. As the largest inland lake in China, it is an important water body to maintain the ecological security in the northeastern part of the Qinghai-Tibet Plateau (Dong et al., 2019). It is located between 99°36′ and 100°16′E, and between 36°32′ and 37°15′N, the lake is 3,260 m above sea level. Namco Lake, located in the central part of the Tibet Autonomous Region, is the second largest lake in Tibet and the third largest saltwater lake in China. This lake is 4,718 m above sea level, making it the highest large lake in the world (Zhang et al., 2011). It is located between 90°16′ and 91°03′E, and between 30°30′ and 30°35'. N. Cuiping Lake is located in Jizhou District of Tianjin City, between 117°25′ and 117°40′E, and between 40°0′ and 40°5′N. It is listed as an important national drinking water source by the ministry of water resources and an urban water source under national protection. Hengshui Lake is located in Hengshui City, Hebei Province, between 115°27′ and 115°42′E, and between 37°31′ and 37°41′N. It is the most representative freshwater lake in the North China Plain (Li et al., 2010). The geographical location of the study area is shown in Figure 1.
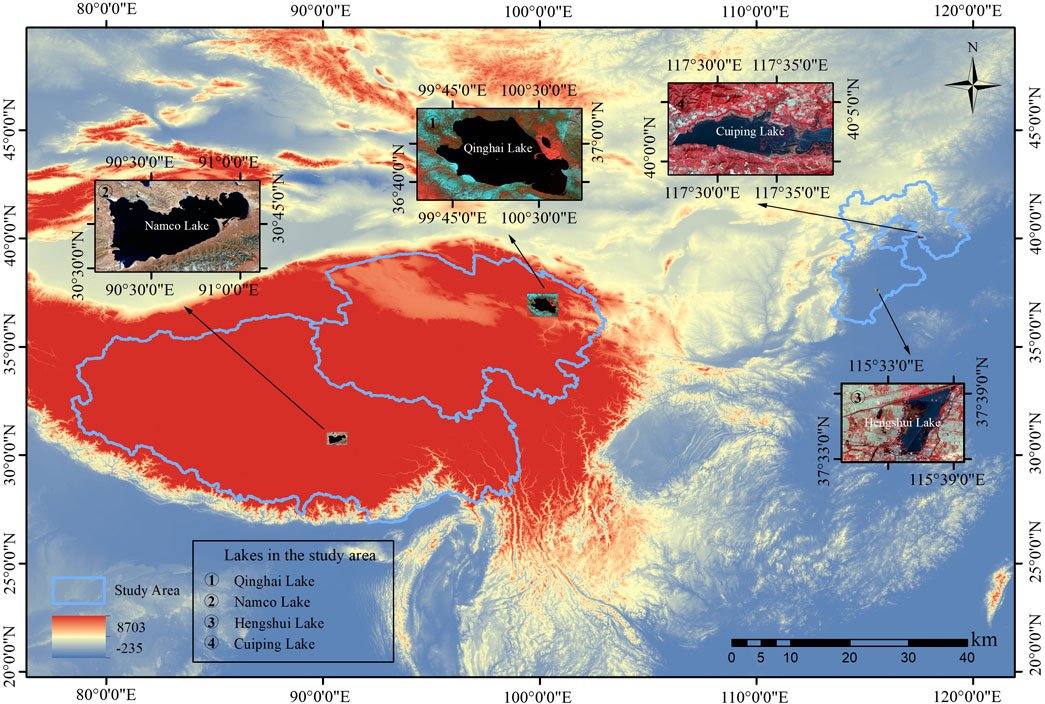
Figure 1. Geographical location of the study area.
Surface reflectance images of GEE platform from 1990 to 2020 are used, and the sensors are Landsat 5 TM, Landsat 7 ETM+ and Landsat 8 OLI. Landsat 5 and 7 have been atmospherically corrected using LEDAPS. Landsat 8 have been atmospherically corrected using LaSRC. The data are selected once a year, and the imaging time of each image is from October to November after the rainy season. However, because of data missing, 30 phases of data are selected from Qinghai Lake, 27 phases of data from Namco, 27 phases of data from Cuiping Lake, and 25 phases of data from Hengshui Lake. The tracking numbers of Qinghai Lake are 133/34 and 133/35, of Namco Lake is 138/39, of Cuiping Lake is 122/32 and of Hengshui Lake is 123/34.
Daily monitoring data of meteorological data were obtained from http://data.cma.cn. Precipitation, temperature, wind speed and sunshine duration of meteorological stations around the study area are selected. Precipitation data are processed as annual total precipitation, while temperature, wind speed and sunshine duration are processed as annual average data.
3 Methods
3.1 Water extraction
Based on GEE platform, the image with the least influence of cloud amount from October to November is selected to calculate NDWI (McFEETERS, 1996). After several experiments, the optimal threshold value is obtained, and then threshold segmentation is performed on NDWI images. Finally, the lake boundary from 1990 to 2020 is preliminarily extracted. The NDWI is calculated for each image using Eq. 1.
Where, Green denotes the Green band that represents reflected green light, and NIR denotes near infrared band that represents reflected near-infrared radiation.
The preliminarily extracted lake boundary is imported into ArcGIS, and visual correction is made against the image, so as to eliminate the lakes misclassified due to water pollution and other reasons as much as possible. The lake extraction results are shown in Figure 2.
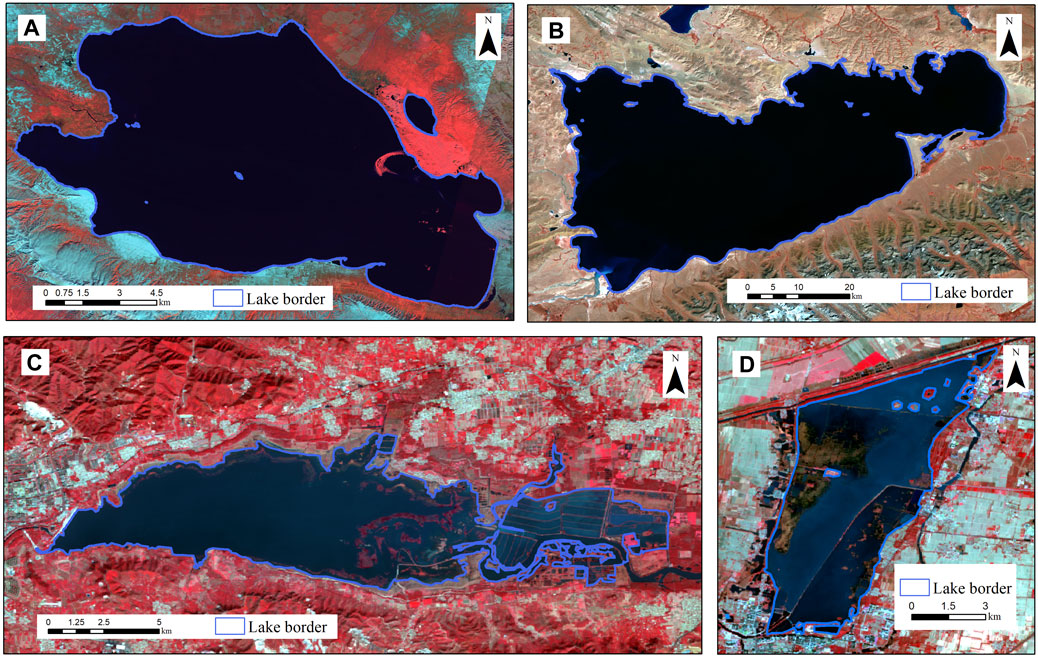
Figure 2. Extraction results of four lakes in 2020: (A) Qinghai Lake; (B) Namco Lake; (C) Cuiping Lake; (D) Hengshui Lake.
3.2 Lake morphological characteristic index
Round-degree is an index used to describe how close the shape of research elements is to roundness (Wang et al., 2022). The larger the round-degree, the closer the shape of the lake is to the circle, and the shorter the shape circumference is. It is calculated using Eq. 2.
Where, R is the round-degree, A is the area of the lake and P is the perimeter of the lake.
Shoreline development index is used to evaluate the degree of shoreline irregularity (Wang et al., 2022). The larger the shoreline development index is, the more variable the shoreline is in morphology. It is calculated using Eq. 3.
Where, A is the area of the lake and P is the perimeter of the lake.
3.3 Centroid calculation
The lake centroid is used to describe movement of the lake, and is calculated according to the geometric features of the lake (Jia et al., 2015). The migration direction of the lake centroid is able to reveal the overall characteristics of spatial changes of the lake (Li et al., 2015). It is calculated using Eq. 4 and Eq. 5.
Where, Xt and Yt are respectively the longitude and latitude coordinates of the lake centroid in year t; Cti is the area of the i lake in the year t; Xi and Yi respectively represent the longitude and latitude coordinates of the i lake patch.
3.4 Driving factors analysis method of lake area change
Based on the correlation analysis between meteorological factors and lake area, this paper takes meteorological factors as independent variables and lake area as dependent variables, standardizes the data, and finally uses the least square method to derive each coefficient of the regression equation. The selection of climatic factors including precipitation, temperature, wind speed and sunshine duration in the study is scientifically reasonable for the study of lake area change, and is closely related to the characteristics and climatic conditions of the Qinghai-Tibet Plateau and the North China Plain.
4 Results and discussion
4.1 Temporal dynamic change of lake area
The dynamic change map of area of the four lakes during 1990–2020 is shown in Figure 3, and the area of the lakes is shown in Figure 4. The temporal change of Qinghai Lake area is shown in Figure 4A. From 1990 to 2004, it shows a decrease trend; afterwards, it shows a rapid growth trend. Overall, the area of Qinghai Lake increases by 5.35% during 1990–2020. The temporal change of Namco Lake area is shown in Figure 4B. From 1990 to 1995, it first increases and then decreases; and from 1995 to 2008, it increases sharply; then from 2008 to 2020, it changes steadily. On the whole, the area of Namco Lake increases by 3.38% during 1990–2020. The temporal change of Cuiping Lake area is shown in Figure 4C. The overall area of Cuiping Lake showed a downward trend. The lake area went down to the maximum in 1995 with a value of 100.19 km2 and reached a minimum in 2003 with a value of 58.33 km2. Overall, the area of Cuiping Lake declines by 15.82% during 1990–2020. The temporal change of Hengshui Lake area is shown in Figure 4D. From 1990 to 2000, it changes sharply and reaches the lowest values in 1992. From 2000 to 2020, it generally shows a decrease trend, and the fluctuation is weaker than that during 1990–2000. Overall, the area of Hengshui Lake decreases by 4.61% during 1990–2020. It is noteworthy that the area changes of the two plateau lakes show a trend contrary to that of plain lakes. The two plateau lakes are larger in area, smaller in increase amplitude, the area change has a certain trend; however, the two plain lakes are less in area, larger in fluctuation, and the area change fluctuates obviously.
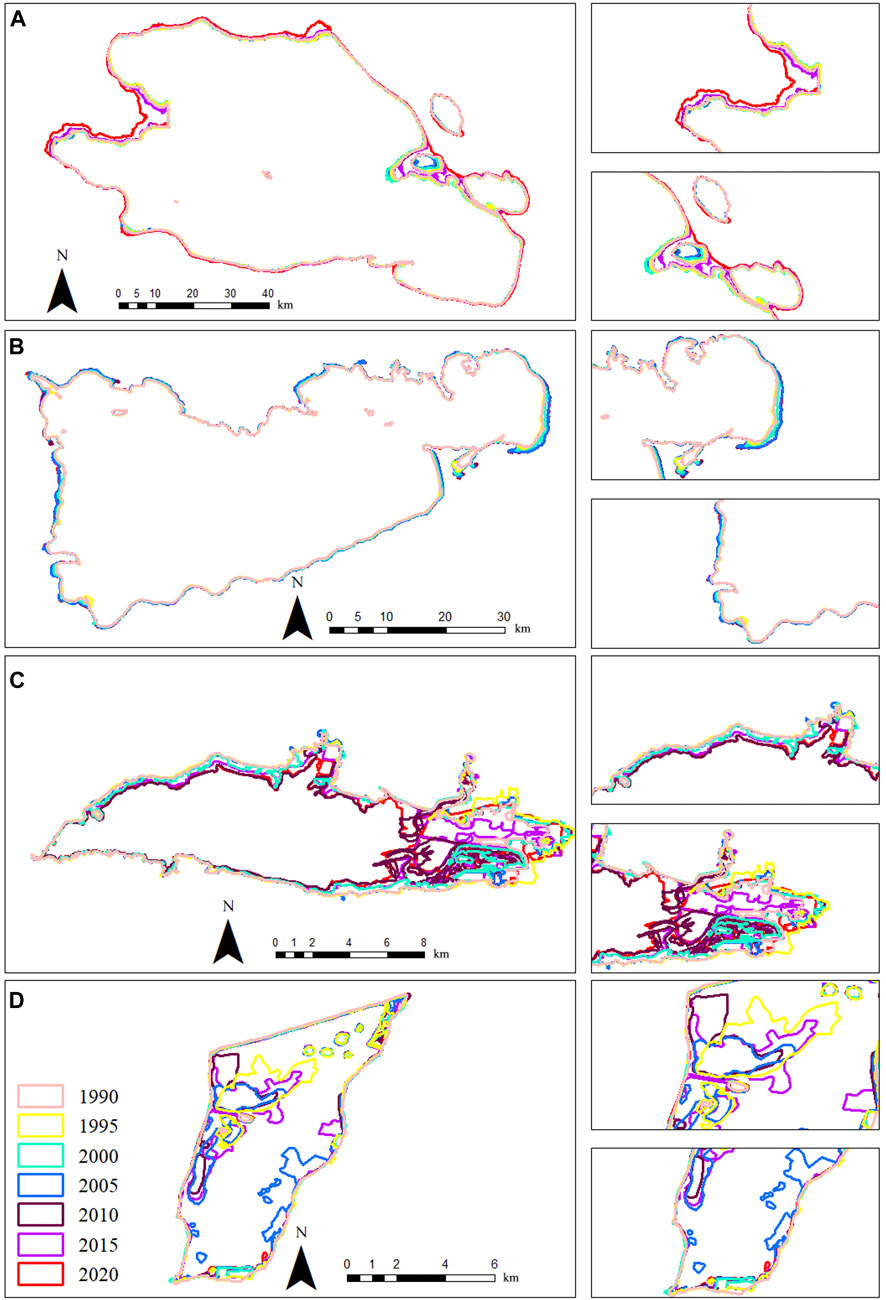
Figure 3. Dynamic change map of water area during 1990–2020 for the four lakes: (A) Qinghai Lake; (B) Namco Lake; (C) Cuiping Lake; (D) Hengshui Lake.
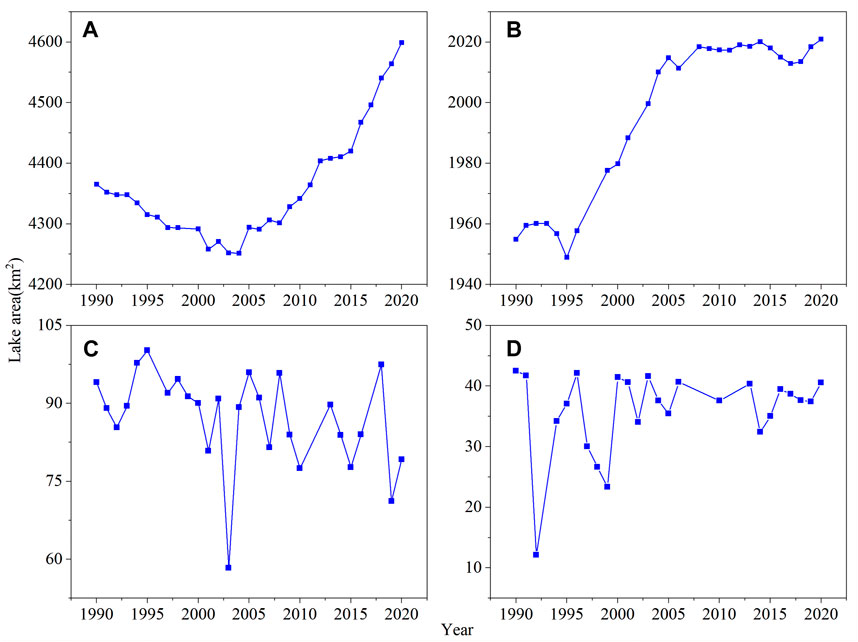
Figure 4. Temporal change of water area during 1990–2020 for the four lakes: (A) Qinghai Lake; (B) Namco Lake; (C) Cuiping Lake; (D) Hengshui Lake.
4.2 Morphological characteristics of the lakes
Round-degree and shoreline development index of two indicators, analysis of the four lakes evolution characteristics of the coastline of form in the last 30 years. As shown in Figure 5A, the shoreline development index of Qinghai Lake shows a downward trend on the whole. The shoreline development index reaches the highest value of 2.32 in 2013 and the lowest value of 1.86 in 2020, decreasing by 0.23 during the study period. From 1990 to 2013, the shoreline development index is slightly affected by the change of lake area. After 2013, the lake area increases and the shoreline development index decreases, mainly because Shadao Lake and Haiyan Bay on its east coast basically confluence with Qinghai Lake, which weakens the complexity of the shoreline morphology of Qinghai Lake. The round-degree ranges from 0.19 to 0.29, and is 0.23 and 0.24 in most years. The variation trend of round-degree ranges is opposite to the shoreline development index.
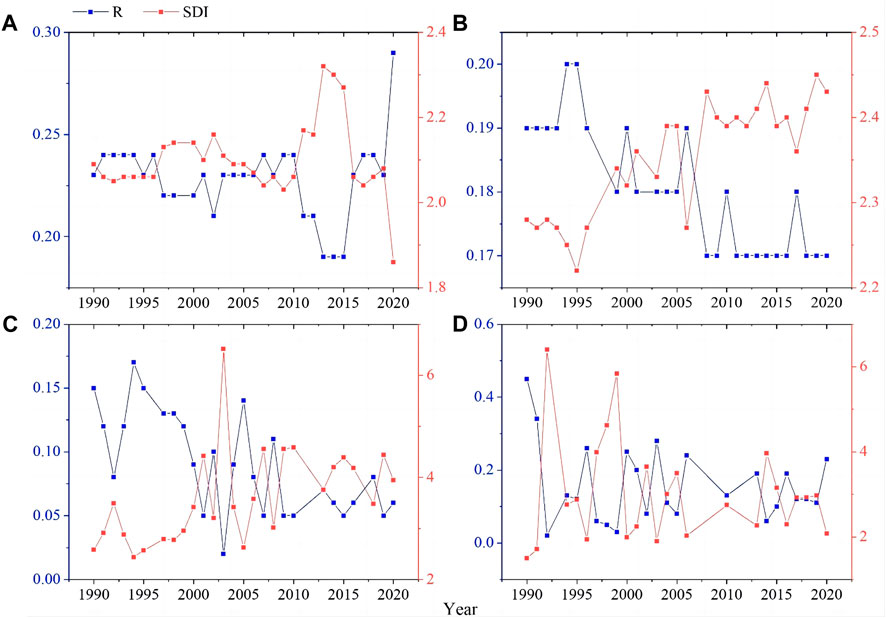
Figure 5. Temporal change of morphological characteristics during 1990–2020 for the four lakes: (A) Qinghai Lake; (B) Namco Lake; (C) Cuiping Lake; (D) Hengshui Lake.
As shown in Figure 5B, the shoreline development index of Namco Lake shows an upward trend on the whole. The shoreline development index reaches the highest value of 2.45 in 2019 and the lowest value of 2.22 in 1995, increasing by 0.15 during the study period. The changes of lake shoreline development index and lake area are synchronous. The round-degree ranges from 0.17 to 0.20, and the shape of the lake changes little.
As shown in Figures 5C, D, the shoreline development index and round-degree of the two plain lakes change significantly. The shoreline development index of Cuiping Lake and Hengshui Lake are 2.44–6.51 and 1.50–6.40, respectively. The round-degree of Cuiping Lake and Hengshui Lake are 0.02–0.17 and 0.02–0.45, respectively. The change of shoreline development index and round-degree is synchronous with the change of area. With the increase of lake area, the shoreline development index increases and the round-degree decreases. Comparing the morphological characteristics indexes of plateau lakes and plain lakes, it can be seen that the shoreline development index of plateau lakes is relatively small, with small fluctuation, indicating that the plateau lakes are less affected by human beings, and the lake morphology gradually tends to be simple. The shoreline development index of plain lakes is relatively large and fluctuates greatly, and lake morphology may be solidified by human influence.
The morphology of lake shoreline is affected by the fluctuation of lake water area, which shows the trend and amplitude of change on time scale. This kind of change reflects the feedback of lake dynamic changes to the land-water interface, especially in the area where the lake changes significantly in recent years. Thus it is typical and necessary to study the morphology of lake shoreline and its change law.
4.3 Migration of the lake centroid
The migration of the centroid position of the four lakes during 1990–2020 is shown in Figure 6. As shown in Figure 6A, the centroid of the Qinghai Lake migrates 450.41 m to the northwest, and the overall migration is relatively small. From 1990 to 2005, the centroid of this lake migrates to the southwest, mainly because the eastern shore near the Sand Island Lake expands inward. From 2005 to 2015, the waters in the east shore recovers, and the centroid of the lake migrates to the northeast. From 2015 to 2020, the waters in the northwest shore of the lake increases, and the migration rate of centroid is fast, with a migration to the northwest.
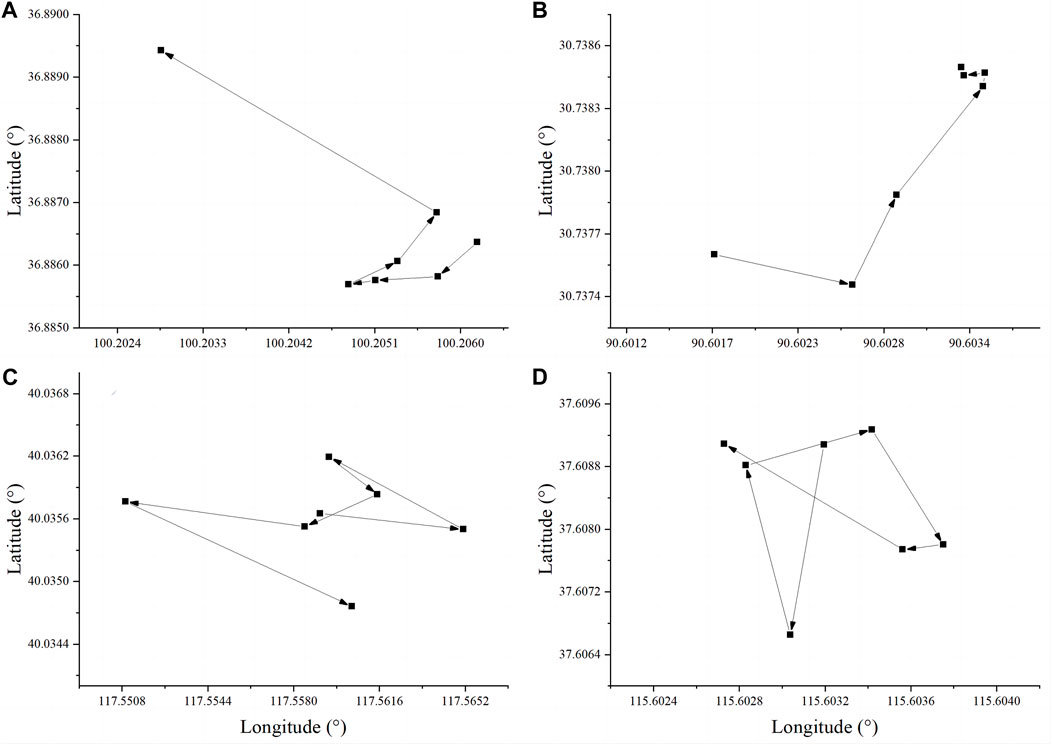
Figure 6. Migration of the centroid position of the four lakes during 1990–2020: (A) Qinghai Lake; (B) Namco Lake; (C) Cuiping Lake; (D) Hengshui Lake.
As shown in Figure 6B, the centroid of the Namco Lake migrates 179.05 m to the northeast, and overall the migration is not significant. From 1990 to 1995, the centroid of this lake migrates to the southeast. From 1995 to 2005, the centroid of the lake gradually and rapidly migrates to the northeast, mainly due to the outward expansion of the eastern shore of the lake. From 2005 to 2020, the lake area is stable and the centroid movement is small.
As shown in Figure 6C, the centroid of Cuiping Lake mainly migrates in the east-west direction, and the centroid of this lake migrates 151.34 m to the southeast on the whole. The change of lake centroid is mainly affected by the change of water in the east bank. As the water in the east bank increases, the lake centroid migrates to the east, and conversely, the lake centroid migrates to the west.
As shown in Figure 6D, the centroid of Hengshui Lake mainly migrates in the north-south direction, and the centroid of this lake migrates 41.06 m to the northwest on the whole. From 1990 to 1995, the lake centroid migrates to the south, mainly because the water area of the northwest shore of the lake decreases seriously. From 1995 to 2005, northwest of lake water area increases, and the south east water area reduces, so the centroid of the lake migrates to the north. From 2005 to 2015, the area on both sides of the lake changes significantly, and the centroid of the lake migrates to the south. From 2015 to 2020, the water area on both sides recovers and the and the centroid of the lake migrates to the north again. The migration distance of the centroid of the plateau lakes is small, and the migration has a certain direction, indicating that these lakes evolve in the same direction in a certain period of time, and their evolution has some rule. On the contrary, the migration of the centroid of the plain lakes is dramatic compared with the length of their shoreline, and the migration has no obvious rule.
4.4 Relationship between lake area change and climate change
The variation of the four meteorological factors in the four lakes during 1990–2020 is shown in Figures 7–10. As shown in Figures 7A, 8A, 9A, 10A, the precipitation shows an increase trend in fluctuation in the plateau lakes, and it shows a decrease trend in the plain lakes. The precipitation fluctuation of plain lakes is more violent than that of plateau lakes. As shown in Figures 7B, 8B, 9B, 10B, the temperature of the four lakes show an increasing trend. And temperature has increased from 2.31°C to 2.92°C in Qinghai Lake (Figure 7B), from 0.55°C to 1.95°C in Namco Lake (Figure 8B), from 11.41°C to 12.86°C in Cuiping Lake (Figure 9B), and from 13.11°C to 14.35°C in Hengshui Lake (Figure 10B). As shown in Figures 7C, 8C, 9C, 10C, the variation characteristics of the wind speed in the four study areas are similar, all showing a decreasing trend. As shown in Figures 7D, 8D, 9D, 10D, the sunshine duration of the four lakes fluctuates greatly. In Qinghai Lake, sunshine duration firstly increases and then decreases (Figure 7D). In Namco Lake, sunshine duration shows a decreasing trend except for a sudden increase in 2020 (Figure 8D). In Cuiping Lake, sunshine duration decreases in fluctuation (Figure 9D). In Hengshui Lake, sunshine duration shows a decreasing trend on the whole (Figure 10D). Based on the temporal changes of both temperature and precipitation, it demonstrates a trend of warming and wetting in the plateau lakes and a trend of warming and drying in the plain lakes.
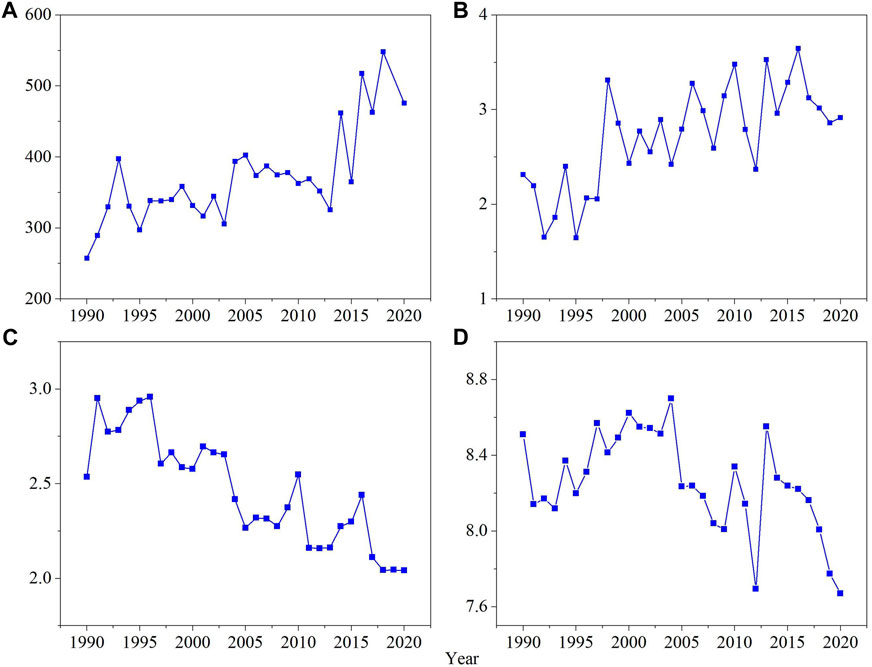
Figure 7. Annual variation of meteorological factors in Qinghai lake during 1990–2020: (A) precipitation (mm); (B) temperature (°C); (C) wind speed (m/s); (D) sunshine duration (h).
Figure 8. Annual variation of meteorological factors in Namco Lake during 1990–2020: (A) precipitation (mm); (B) temperature (°C); (C) wind speed (m/s); (D) sunshine duration (h).
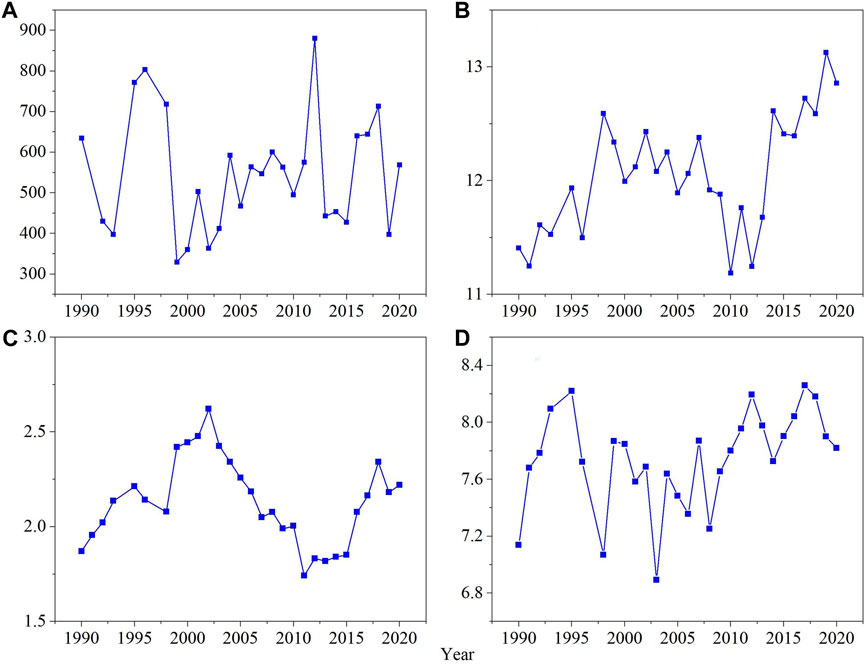
Figure 9. Annual variation of meteorological factors of Cuiping lake during 1990–2020: (A) precipitation (mm); (B) temperature (°C); (C) wind speed (m/s); (D) sunshine duration (h).
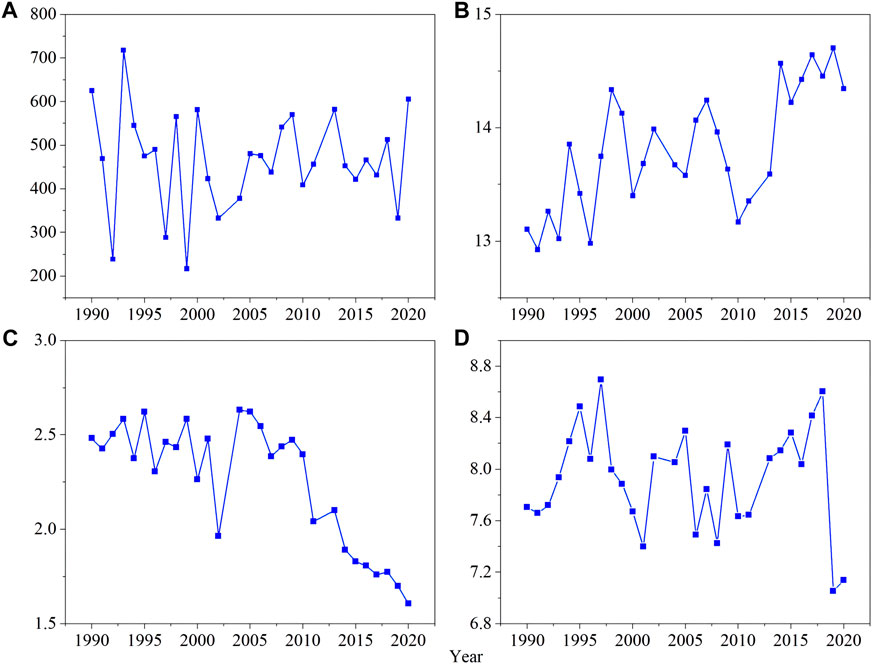
Figure 10. Annual variation of meteorological factors of Hengshui lake during 1990–2020: (A) precipitation (mm); (B) temperature (°C); (C) wind speed (m/s); (D) sunshine duration (h).
The extent to which climate factors explain lake area change is investigated by correlation analysis and multiple regression models. According to the breakpoint where the variation trend of lake area changes, the study period is divided into two periods for modeling respectively, and the modeling results are shown in Table 1. From 1990 to 2004, the area of Qinghai Lake shows a decreasing trend, the precipitation in the basin shows an increase trend, but the precipitation is low and the increase rate is small, both the temperature and sunshine duration increase rapidly. The decrease of lake area may be due to the insignificant effect of precipitation on the increase of lake area and the increase of evaporation due to the increase of temperature and sunshine duration. During 2004–2020, the annual precipitation in the basin shows an increase trend, and it is higher than that in the previous period. The temperature shows an increase trend in fluctuation; the sunshine duration decreases rapidly. The precipitation is high and shows an increase trend, thus the precipitation replenishments to the lake increases, while the wind speed and sunshine duration begin to decrease, and the temperature variation is not obvious, which may lead to the decrease of evaporation. These may be the sources of the increase in lake area during this period. The correlation coefficients between lake area and precipitation, temperature, wind speed and sunshine duration are 0.71, 0.3, −0.61 and −0.67, respectively. Correlation analysis shows that the replenishment of the Qinghai Lake is mainly in the form of precipitation. The results of multiple linear regression analysis also show that lake area is positively correlated with precipitation, and negatively correlated with wind speed and sunshine hours. From 2004 to 2020, the R-square of the regression model is the highest, indicating that the combination of meteorological factors in this period has a significant impact on the water surface area.
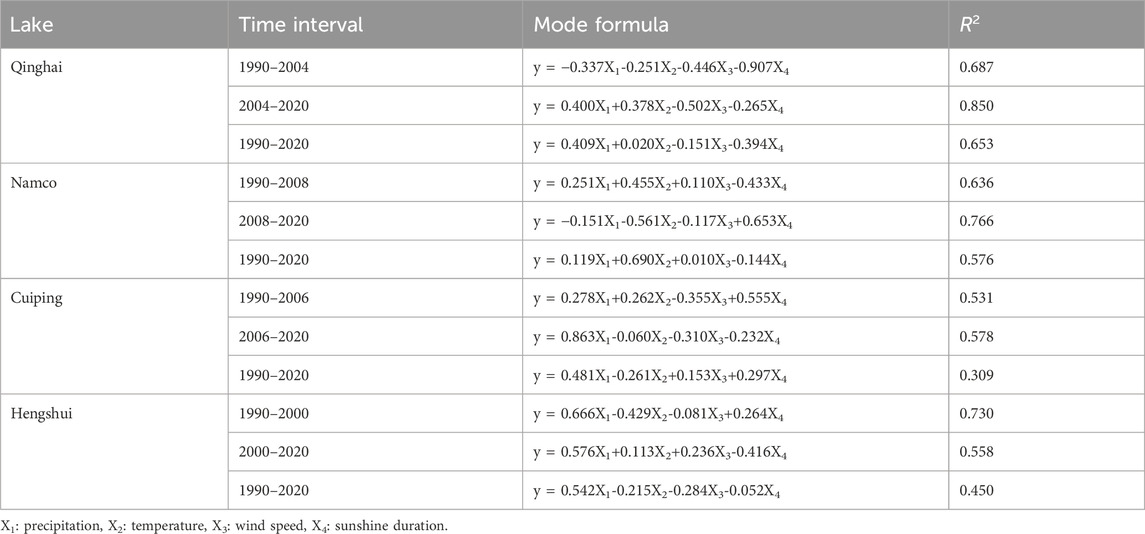
Table 1. Linear models between meteorological factors and lake area.
In the Namco Lake basin, the Gangdise-Nyenchen Tanggula Mountain is located in the south, which have many modern glaciers. During 1990–2008, lake area decreased first and then increased, and precipitation, temperature and wind speed showed similar trends. Therefore, the increase in lake area is the result of a combination of increasing precipitation and glacial meltwater. During 2008–2020, the precipitation and sunshine duration showed a slight increase trend. The temperature showed a trend of fluctuation and increase, wind speed showed a trend of fluctuation and decrease. The correlation coefficients between lake area and precipitation, temperature, wind speed and sunshine duration are 0.23, 0.73, −0.29 and −0.33, respectively. As a key factor of glacier dynamic change, temperature rise leads to increase of meltwater. Multiple regression analysis indicates that Namco Lake mainly replenishes lake water in the form of glacial meltwater. The results of multiple linear regression analysis show that only the temperature and lake area are positively correlated in the three periods, which further proves that the temperature is the main factor affecting the change of Namco Lake area. From 2008 to 2020, the R-square of the regression model is the highest, indicating that the combination of meteorological factors in this period has a significant impact on the lake water area.
Cuiping Lake, as a city lake, is one of the main water supplies in Tianjin City. During 1990–2006, the precipitation in 1992, 1993, and 2003 was smaller than that in the other years, and the lake area in corresponding year is also smaller. The precipitation in 1995 and 1998 is bigger than that in the other years, and the lake area in corresponding years is also bigger. During 2006–2020, the variation trend of lake area is consistent with that of precipitation, and precipitation is the main influencing factor of lake area evolution during this period. The correlation coefficients between lake area and precipitation, temperature, wind speed and sunshine duration are 0.43, −0.17, −0.06 and 0.23, respectively. This indicates that the lake area is only slightly affected by meteorological factors. The results of multiple linear regression analysis show that the R-square of the regression models in the three periods is less than 0.6, which further indicates that the impact of meteorological factors on the lake area is not significant.
For Hengshui Lake, the most important water source is local precipitation, which is also one of the main factors affecting the water level and lake area. During 1990–2000, the area of Hengshui Lake fluctuates sharply, reaching the local minimum value of 12.12 and 26.65 in 1992 and 1999 respectively. The precipitation and lake area have similar trends. In 1990, 1991 and 1996, the temperature is lower, but the lake area is higher and the other two meteorological factors have no obvious relationship with lake change. During 2000–2020, the fluctuation of precipitation is small, and the change of lake area is small compared with that of the previous period, and the change trend of lake area is basically consistent with that of precipitation. The correlation coefficients between lake area and precipitation, temperature, wind speed and sunshine duration are 0.64, −0.13, −0.24 and −0.20, respectively, this indicates that the lake area is mainly affected by precipitation. The results of multiple linear regression analysis show that the influence coefficients of precipitation in the regression models of the three periods are greater than 0.5, which shows that precipitation is the main factor affecting the increase of lake area.
The expansion of the lake area and the increase in water volume will significantly affect the surrounding ecological environment, change the local and regional climate, and even produce extreme weather events. Understanding the changes of the lake will further promote our understanding of the past state, future fate and impact of the lake (Zhang and Duan, 2021). In addition to meteorological factors, the spatio-temporal variation of lake area is also affected by the parameter of “the opening time of the lake from the ice in spring.” Due to global warming, the meteorological records in the past 60 years at the three meteorological stations in the hinterland of the Qinghai-Tibet Plateau show that climate is becoming increasingly warm and humid, and temperature warming rate is twice the global average in the same period (Zhou et al., 2022). The opening time of the lake from the ice in spring is becoming more and more important in influencing the temporal and spatial changes of the lake. Due to the heating of the ice by the Sun, the uncovered thick ice will begin to melt at the ice surface. If there is snow on the ice, this process will change greatly, and this phenomenon has an impact on the spatio-temporal changes of plateau lakes (Dombrovsky, 2024). Some studies on Qinghai Lake found that the early melting of ice leads to an increase in the energy absorbed by spring lakes, and more solar radiation directly enters the lake without reflection by the ice sheet. The delayed freezing date results in increased pre-freezing energy loss (Su et al., 2019). In plateau lakes, stable stratification up to 1–2 months is a special feature of high-altitude freshwater. Strong temperature gradients and deep convective mixing at the ice-water interface indicate a variety of biogeochemical and ecological interactions, different from high-altitude lakes (Kirillin et al., 2021). For the analysis of large rivers covered by ice and the melting of sea ice, the calculation model of solar heating of glacial lakes under different climatic conditions was built and the Lake Engelin in the Qinghai-Tibet Plateau was taken as a case to show calculation results (Dombrovsky and Kokhanovsky, 2023). Due to lack of data on opening time of the lake from the ice in spring of the four studied lakes, this study will not analyze this parameter temporarily, and it will be one of the important research directions in our later period.
The comparative study is conducted through selecting two typical lakes in Qinghai-Tibet Plateau, including Qinghai Lake and Namco Lake, and two typical lakes in North China Plain, including Cuiping Lake and Hengshui Lake as the study areas. Lake area extraction and morphology analysis are conducted using remote sensing data. Compared with the study of equal-interval years, it is able to more accurately capture the year when the lake area changes (Li et al., 2019; Dai et al., 2020). Furthermore, based on the meteorological factor data, the influence of climate change in different basins on lake area is modeled and analyzed.
Compared with traditional water extraction, GEE platform has rich data sources and cloud computing capabilities. It saves the time of data preprocessing. The batch processing and output of remote sensing images by JavaScript language makes it convenient and quick to monitor the change of lake area in long time series.
In this study, the climate factors and lake area are modeled and analyzed in sections according to the difference of lake change trend. Compared with the modeling of lake area and climate factors in the whole period, the subsection modeling according to different change trend can understand the response of lake area change to climate change in different periods, and quantitatively analyze the relationship between lake area and climate factors from a statistical point of view, which is more intuitive reliable understanding of the impact of climate change on lake area. The significant order of climate factors in Qinghai Lake are as follows: precipitation > sunshine duration > wind speed > temperature. The significant order of climate factors in Namco is as follows: temperature > sunshine duration > wind speed > precipitation. The significant order of climate factors in Cuiping Lake are as follows: precipitation > sunshine duration > temperature > wind speed. The significant order of climate factors in Hengshui Lake are as follows: precipitation > wind speed > sunshine duration > temperature. The lake area of Qinghai Lake is negatively correlated with wind speed and sunshine duration, but positively correlated with precipitation and temperature. The lake area has the strongest correlation with precipitation, followed by sunshine duration. The lake area is negatively correlated with wind speed and sunshine duration, but positively correlated with precipitation and temperature, and the lake area has the strongest correlation with temperature. Cuiping Lake and Hengshui Lake have poor correlation with temperature, wind speed and sunshine duration, and the lake area is mainly affected by precipitation.
5 Conclusion
Based on Landsat data and GEE platform, lakes are interpreted and extracted. The area and morphological changes of lakes in the Tibetan Plateau and the North China Plain are analyzed. Multiple linear regression analysis is used to investigate the relationship between lake area and four meteorological factors, including annual precipitation, annual average temperature, annual average wind speed and annual average sunshine duration. The fluctuation of lakes on the Qinghai-Tibet Plateau is small, and the lake area shows a small expansion. In the North China Plain, lake boundaries fluctuate greatly and the lake area fluctuation decreases. The centroid migration of plateau lakes is directional, but that of plain lakes is not. The fluctuation of shoreline development coefficient and circularity of plateau lakes is obviously smaller than that of plain lakes, which indicates that shoreline of plain lakes changes greatly. From 1990 to 2020 in Qinghai Lake and Namco Lake, precipitation and temperature present the increase trend, wind speed and sunshine duration present the downward trend, lake area are positively correlated with precipitation and temperature, negatively correlated with wind speed and sunshine duration. The temperature in Cuiping Lake and Hengshui Lake shows a rising trend, wind speed in Hengshui Lake shows a decreasing trend, and other meteorological factors show fluctuations. The multiple regression model between meteorological factors and lake area can further prove the impact of meteorological factors on lake area. When the change trend of lake area is stable, meteorological factors can better explain the change of lake area.
Inevitably, there are still some limitations in our study. First, time span and spatial resolution of data are a major limitation of our research. Due to data limitation, although our current study has covered the changes of typical lake area in the past 30 years, it cannot cover a long enough time span, which may limit our comprehensive understanding of lake changes. In the future, we hope to analyze the evolution characteristics of lakes in the last hundred years on the basis of historical data, relevant literature and data. In the future, the time scale of the study will be further refined, and the analysis of seasonal, annual changes and even long-term trends of change in lake area will be discussed. Due to the time span and spatial resolution of the data, we cannot carry out long-term modeling work. In the future study, we will try to establish a mathematical model of the meteorological factor-lake area, which can provide a basis for analyzing future lake changes. The spatial scale can also be refined, such as comparing differences between different lakes or the differences in varying regions within the same lake. When the amount of data is sufficient, the control variable method can be combined with regression analysis. For example, the temperature can be divided into several intervals to analyze the influence of other meteorological factors on the lake area in different temperature ranges, and the influence analysis of various climate factors on the lake change under different climate conditions can be further refined. Second, there are still some important factor data that cannot be obtained at present, including the spring deicing time data of the studied lakes.
Data availability statement
The original contributions presented in the study are included in the article, further inquiries can be directed to the corresponding authors.
Author contributions
QG: Conceptualization, Funding acquisition, Writing–original draft, Writing–review and editing. GY: Methodology, Writing–original draft. XW: Formal Analysis, Writing–review and editing. HJ: Formal Analysis, Writing–review and editing. YT: Investigation, Writing–review and editing.
Funding
The author(s) declare financial support was received for the research, authorship, and/or publication of this article. This research was funded by the Technology Research and Development Program of Tianjin, China, grant number 23KPHDRC00300.
Acknowledgments
The authors extend their gratitude to the reviewers and editors for their insightful feedback.
Conflict of interest
The authors declare that the research was conducted in the absence of any commercial or financial relationships that could be construed as a potential conflict of interest.
Publisher’s note
All claims expressed in this article are solely those of the authors and do not necessarily represent those of their affiliated organizations, or those of the publisher, the editors and the reviewers. Any product that may be evaluated in this article, or claim that may be made by its manufacturer, is not guaranteed or endorsed by the publisher.
References
Al-Bakri, J. T., Duqqah, M., and Brewer, T. (2013). Application of remote sensing and GIS for modeling and assessment of land use/cover change in amman/Jordan. J. Geogr. Inf. Syst. 5, 509–519. doi:10.4236/jgis.2013.55048
Busker, T., Roo, A. D., Gelati, E., Schwatke, C., Adamovic, M., Bisselink, B., et al. (2019). A global lake and reservoir volume analysis using a surface water dataset and satellite altimetry. Hydrol. Earth Syst. S. C. 23 (2), 669–690. doi:10.5194/hess-23-669-2019
Chipman, J. (2019). A multisensor approach to satellite monitoring of trends in Lake Area, water level, and volume. Remote Sens. 11 (2), 158. doi:10.3390/rs11020158
Cui, Y., Peng, G., and Yuqi, B. (2020). Performance assessment of ICESat-2 laser altimeter data for water-level measurement over lakes and reservoirs in China. Remote Sens. 12 (5), 770. doi:10.3390/rs12050770
Dai, X., Yang, X., Wang, M., Gao, Y., Liu, S., and Zhang, J. (2020). The dynamic change of bosten Lake Area in response to climate in the past 30 years. Water 12 (1), 4. doi:10.3390/w12010004
Dombrovsky, L. A. (2024). An effect of a snow cover on solar heating and melting of lake or sea ice. Front. Therm. Eng. 3, 1354265. doi:10.3389/fther.2023.1354265
Dombrovsky, L. A., and Kokhanovsky, A. A. (2023). Solar heating of ice-covered lake and ice melting. J. Quantitative Spectrosc. Radiat. Transf. 294, 108391. doi:10.1016/j.jqsrt.2022.108391
Dong, H., Song, Y., and Zhang, M. (2019). Hydrological trend of Qinghai Lake over the last 60 years: driven by climate variations or human activities? J. Water Clim. Change 10 (3), 524–534. doi:10.2166/wcc.2018.033
Du, Y., Xue, H., Wu, S., Ling, F., Xiao, F., and Wei, X. (2011). Lake area changes in the middle Yangtze region of China over the 20th century. J. Environ. Manage 92 (4), 1248–1255. doi:10.1016/j.jenvman.2010.12.007
Feyisa, G. L., Meilby, H., Fensholt, R., and Proud, S. R. (2014). Automated Water Extraction Index: a new technique for surface water mapping using Landsat imagery. Remote Sens. Environ. 140, 23–35. doi:10.1016/j.rse.2013.08.029
Frazier, P. S., and Page, K. J. (2000). Water body detection and delineation with Landsat TM data. Photogramm. Eng. Rem. S. 66 (12), 1461–1467. doi:10.1016/S1361-8415(00)00023-2
Gorelick, N., Hancher, M., Dixon, M., Ilyushchenko, S., Thau, D., and Moore, R. (2017). Google Earth engine: planetary-scale geospatial analysis for everyone. Remote Sens. Environ. 202, 18–27. doi:10.1016/j.rse.2017.06.031
Haghighi, A. T., and Kløve, B. (2015). A sensitivity analysis of lake water level response to changes in climate and river regimes. Limnologica 51, 118–130. doi:10.1016/j.limno.2015.02.001
Haibo, Y., Zongmin, W., Hongling, Z., and Yu, G. (2011). Water body extraction methods study based on RS and GIS. Procedia Environ. Sci. 10, 2619–2624. doi:10.1016/j.proenv.2011.09.407
Hou, X., Feng, L., Duan, H., Chen, X., Sun, D., and Shi, K. (2017). Fifteen-year monitoring of the turbidity dynamics in large lakes and reservoirs in the middle and lower basin of the Yangtze River, China. Remote Sens. Environ. 190, 107–121. doi:10.1016/j.rse.2016.12.006
Huang, C., Chen, Y., Zhang, S., and Wu, J. (2018). Detecting, extracting, and monitoring surface water from space using optical sensors: a review. Rev. Geophys 56 (2), 333–360. doi:10.1029/2018RG000598
Jennifer, R., Lei, J., Bruce, K. W., and Larry, L. T. (2012). Establishing water body areal extent trends in interior Alaska from multi-temporal Landsat data. Remote Sens. Lett. 3 (7), 595–604. doi:10.1080/01431161.2011.643507
Jia, M., Wang, Z., Zhang, Y., Ren, C., and Song, K. (2015). Landsat-based estimation of mangrove forest loss and restoration in guangxi Province, China, influenced by human and natural factors. IEEE J-STARS 8 (1), 311–323. doi:10.1109/JSTARS.2014.2333527
Jiang, L., Nielsen, K., Andersen, O. B., and Bauer-Gottwein, P. (2017). Monitoring recent lake level variations on the Tibetan Plateau using CryoSat-2 SARIn mode data. J. Hydrol. 544, 109–124. doi:10.1016/j.jhydrol.2016.11.024
Karimi, M., Mesgari, M. S., Sharifi, M. A., and Pilehforooshha, P. (2017). Developing a methodology for modelling land use change in space and time. J. Spat. Sci. 62 (2), 261–280. doi:10.1080/14498596.2017.1283253
Kirillin, G. B., Shatwell, T., and Wen, L. (2021). Ice-covered lakes of Tibetan Plateau as solar heat collectors. Geophys. Res. Lett. 48 (14), e2021GL093429. doi:10.1029/2021GL093429
Kumar, L., and Mutanga, O. (2018). Google Earth engine applications since inception: usage, trends, and potential. Remote Sens. 10 (10), 1509. doi:10.3390/rs10101509
Lei, Y., Yang, K., Wang, B., Sheng, Y., Bird, B. W., Zhang, G., et al. (2014). Response of inland lake dynamics over the Tibetan Plateau to climate change. Clim. Change 125 (2), 281–290. doi:10.1007/s10584-014-1175-3
Li, C., Wang, J., Hu, R., Yin, S., Bao, Y., and Li, Y. (2018). ICESat/GLAS-derived changes in the water level of Hulun Lake, Inner Mongolia, from 2003 to 2009. Front. Earth Sci. 12 (2), 420–430. doi:10.1007/s11707-017-0666-8
Li, H., Mao, D., Li, X., Wang, Z., and Wang, C. (2019). Monitoring 40-year Lake Area changes of the qaidam basin, Tibetan plateau, using Landsat time series. Remote Sens. 11 (3), 343. doi:10.3390/rs11030343
Li, L., Xia, H., Li, Z., and Zhang, Z. (2015). Temporal-spatial evolution analysis of lake size-distribution in the middle and lower yangtze river basin using Landsat imagery data. Remote Sens. 7 (8), 10364–10384. doi:10.3390/rs70810364
Li, W., Du, Z., Ling, F., Zhou, D., Wang, H., Gui, Y., et al. (2013). A comparison of land surface water mapping using the normalized difference water index from TM, ETM+ and ALI. Remote Sens. 5 (11), 5530–5549. doi:10.3390/rs5115530
Li, X., Li, C., and Zhang, L. (2010). Modeling the scenarios of wetland restoration in Hengshui Lake national nature reserve. Procedia Environ. Sci. 2, 1279–1289. doi:10.1016/j.proenv.2010.10.138
Liu, H., Jiao, F., Yin, J., Li, T., Gong, H., Wang, Z., et al. (2020a). Nonlinear relationship of vegetation greening with nature and human factors and its forecast – a case study of Southwest China. Ecol. Indic. 111, 106009. doi:10.1016/j.ecolind.2019.106009
Liu, H., Zheng, L., Jiang, L., and Liao, M. (2020b). Forty-year water body changes in Poyang Lake and the ecological impacts based on Landsat and HJ-1 A/B observations. J. Hydrol. 589, 125161. doi:10.1016/j.jhydrol.2020.125161
Lu, P., Han, J., Li, Z., Xu, R., Li, R., Hao, T., et al. (2020). Lake outburst accelerated permafrost degradation on Qinghai-Tibet Plateau. Remote Sens. Environ. 249, 112011. doi:10.1016/j.rse.2020.112011
Lu, S., Jia, L., Zhang, L., Wei, Y., Baig, M. H. A., Zhai, Z., et al. (2017). Lake water surface mapping in the Tibetan Plateau using the MODIS MOD09Q1 product. Remote Sens. Lett. 8 (3), 224–233. doi:10.1080/2150704X.2016.1260178
Ma, R., Duan, H., Hu, C., Feng, X., Li, A., Ju, W., et al. (2010). A half-century of changes in China's lakes: global warming or human influence? Geophys Res. Lett. 37, L24106. doi:10.1029/2010GL045514
Ma, Y., Xu, N., Sun, J., Wang, X. H., Yang, F., and Li, S. (2019). Estimating water levels and volumes of lakes dated back to the 1980s using Landsat imagery and photon-counting lidar datasets. Remote Sens. Environ. 232, 111287. doi:10.1016/j.rse.2019.111287
Mao, D., Wang, Z., Wu, J., Wu, B., Zeng, Y., Song, K., et al. (2018). China's wetlands loss to urban expansion. Land Degrad. Dev. 29 (8), 2644–2657. doi:10.1002/ldr.2939
McFEETERS, S. K. (1996). The use of the Normalized Difference Water Index (NDWI) in the delineation of open water features. Int. J. Remote Sens. 17 (7), 1425–1432. doi:10.1080/01431169608948714
Nie, Y., Zhang, Y., Ding, M., Liu, L., and Wang, Z. (2013). Lake change and its implication in the vicinity of Mt. Qomolangma (Everest), central high Himalayas, 1970–2009. Environ. Earth Sci. 68 (1), 251–265. doi:10.1007/s12665-012-1736-6
Nielsen, K., Stenseng, L., Andersen, O., and Knudsen, P. (2017). The performance and potentials of the CryoSat-2 SAR and SARIn modes for lake level estimation. Water 9 (6), 374. doi:10.3390/w9060374
Olmanson, L. G., and Bauer, M. E. (2017). Land cover classification of the Lake of the Woods/Rainy River Basin by object-based image analysis of Landsat and lidar data. Lake Reserv. Manage. 33 (4), 335–346. doi:10.1080/10402381.2017.1373171
Pekel, J., Cottam, A., Gorelick, N., and Belward, A. S. (2016). High-resolution mapping of global surface water and its long-term changes. Nature 540 (7633), 418–422. doi:10.1038/nature20584
Qiao, B., Zhu, L., and Yang, R. (2019). Temporal-spatial differences in lake water storage changes and their links to climate change throughout the Tibetan Plateau. Remote Sens. Environ. 222, 232–243. doi:10.1016/j.rse.2018.12.037
Ryu, J., Won, J., and Min, K. D. (2002). Waterline extraction from Landsat TM data in a tidal flat: a case study in Gomso Bay, Korea. Remote Sens. Environ. 83 (3), 442–456. doi:10.1016/S0034-4257(02)00059-7
Su, D., Hu, X., Wen, L., Lyu, S., Gao, X., Zhao, L., et al. (2019). Numerical study on the response of the largest lake in China to climate change. Hydrology Earth Syst. Sci. 23 (4), 2093–2109. doi:10.5194/hess-23-2093-2019
Wang, Z., Liu, K., Zhan, P., Wang, C., Fan, C., Song, C., et al. (2022). Spatiotemporal changes of lake shoreline morphology in Tibetan Plateau during 1990-2018. Geogr. Res. 41 (04), 980–996. doi:10.11821/dlyj020210176
Wantzen, K. M., Rothhaupt, K. O., Mörtl, M., Cantonati, M., G.-Tóth, L., and Fischer, P. (2008). Ecological effects of water-level fluctuations in lakes: an urgent issue. Hydrobiologia 613 (1), 1–4. doi:10.1007/s10750-008-9466-1
Wurtsbaugh, W. A., Miller, C., Null, S. E., DeRose, R. J., Wilcock, P., Hahnenberger, M., et al. (2017). Decline of the world's saline lakes. Nat. Geosci. 10 (11), 816–821. doi:10.1038/ngeo3052
Xia, H., Zhao, J., Qin, Y., Yang, J., Cui, Y., Song, H., et al. (2019). Changes in water surface area during 1989–2017 in the huai river basin using Landsat data and Google Earth engine. Remote Sens. 11 (15), 1824. doi:10.3390/rs11151824
Xiao, S., Peng, X., and Tian, Q. (2016). Climatic and human drivers of recent lake-level change in East Juyan Lake, China. Reg. Environ. Change 16 (4), 1063–1073. doi:10.1007/s10113-015-0822-1
Xu, H. (2006). Modification of normalised difference water index (NDWI) to enhance open water features in remotely sensed imagery. Int. J. Remote Sens. 27 (14), 3025–3033. doi:10.1080/01431160600589179
Yang, Y., Liu, Y., Zhou, M., Zhang, S., Zhan, W., Sun, C., et al. (2015). Landsat 8 OLI image based terrestrial water extraction from heterogeneous backgrounds using a reflectance homogenization approach. Remote Sens. Environ. 171, 14–32. doi:10.1016/j.rse.2015.10.005
Yuan, C., Gong, P., Liu, C., and Ke, C. (2019). Water-volume variations of Lake Hulun estimated from serial Jason altimeters and Landsat TM/ETM+ images from 2002 to 2017. Int. J. Remote Sens. 40 (2), 670–692. doi:10.1080/01431161.2018.1516316
Zhang, B., Wu, Y., Zhu, L., Wang, J., Li, J., and Chen, D. (2011). Estimation and trend detection of water storage at Nam Co Lake, central Tibetan Plateau. J. Hydrol. 405 (1-2), 161–170. doi:10.1016/j.jhydrol.2011.05.018
Zhang, G., and Duan, S. (2021). Lakes as sentinels of climate change on the Tibetan Plateau. All Earth 33 (1), 161–165. doi:10.1080/27669645.2021.2015870
Zhang, G., Li, J., and Zheng, G. (2017). Lake-area mapping in the Tibetan Plateau: an evaluation of data and methods. Int. J. Remote Sens. 38 (3), 742–772. doi:10.1080/01431161.2016.1271478
Zhang, G., Yao, T., Chen, W., Zheng, G., Shum, C. K., Yang, K., et al. (2019). Regional differences of lake evolution across China during 1960s–2015 and its natural and anthropogenic causes. Remote Sens. Environ. 221, 386–404. doi:10.1016/j.rse.2018.11.038
Keywords: plateau lake, plain lake, Google Earth Engine, morphological characteristic, climate factor
Citation: Guo Q, Yang G, Wu X, Jin H and Tian Y (2024) Spatial-temporal evolution of plateau and plain lakes and climate driving factors based on Google Earth Engine platform. Front. Environ. Sci. 12:1365972. doi: 10.3389/fenvs.2024.1365972
Received: 05 January 2024; Accepted: 15 March 2024;
Published: 05 April 2024.
Edited by:
Alexander Kokhanovsky, German Research Centre for Geosciences, GermanyReviewed by:
Leonid A. Dombrovsky, Joint Institute for High Temperatures (RAS), RussiaCheng Chen, Nanjing Hydraulic Research Institute, China
Weibo Liu, Florida Atlantic University, United States
Copyright © 2024 Guo, Yang, Wu, Jin and Tian. This is an open-access article distributed under the terms of the Creative Commons Attribution License (CC BY). The use, distribution or reproduction in other forums is permitted, provided the original author(s) and the copyright owner(s) are credited and that the original publication in this journal is cited, in accordance with accepted academic practice. No use, distribution or reproduction is permitted which does not comply with these terms.
*Correspondence: Xiaoxu Wu, wuxx@bnu.edu.cn; Huiyi Jin, tjujin@126.com