Use of remote sensing and image processing for identification of wild orchids
 Shara Ahmed Jack Lightbown Simon R. Rutter Nabanita Basu Catherine E. Nicholson Justin J. Perry
  John R. Dean*
- Department of Applied Sciences, Northumbria University, Ellison Building, Newcastle upon Tyne, United Kingdom
A novel multi-technique approach has been applied for the identification and mapping of wild orchids using a combination of remote sensing and spectral image analysis. The five orchid species identified were the common spotted-orchid (Dactylorhiza fuchsia), heath spotted-orchid (Dactylorhiza maculata), pyramidal orchid (Anacamptis pyramidalis), heath fragrant-orchid (Gymnadenia borealis), and the dark-red helleborine (Epipactis atrorubens). Field studies have been done using a hand-held spectrometer operating in the 400–700 nm visible spectrum, photogrammetry using a digital camera as well as a multispectral image camera operating at the specific spectral bands of 450 nm (blue), 560 nm (green), 650 nm (red), 730 nm (red edge) and 840 nm (near-infrared) attached to an unmanned aerial vehicle Data analysis, using the hand-held spectrometer, followed by pattern recognition using principal component analysis and partial least squares-discriminant analysis, have identified the key distinguishing wavelengths for identification of the 5 orchid types as 400, 410, 420 and 560 nm. The use of remote sensing, using the UAV-MSI, and application of a dedicated spectral index has enabled field identification of the orchids. Finally, object-based image analysis of field gathered photogrammetry imagery, has enabled use of shape, size, and color to identify and distinguish orchid species. The developed data analytic tool, using random forest classification, can be used to identify and characterize wild orchids across multiple sites within their short lifespan with an accuracy of 86%. Any longer-term study would provide invaluable information on the diversity and complexity of orchid habitat, population variation both intra- and inter-site location, as well as the impact of climate change.
1 Introduction
Wild orchids (family: Orchidaceae) appear in the UK in a variety of habitats that range from moorland, sand dunes to verges, wasteland, and derelict sites annually, between late spring and early summer. In the UK there are 57 native orchid species (British Naturalist Association, 2023), while globally numbers are estimated to be around 28,000 species. Orchids occur geographically in either a sporadic, localized or widely distributed format. This diversity in species and aesthetic attractiveness make them ideal for application of novel approaches of identification and occurrence. In addition, orchids often face issues for their survival based on destruction of habitat from climate change, impact of pollution, and illegal harvesting for horticulture and tourism industries (Wraith and Pickering, 2018). Other threats for wild orchids, and their specific habitats, can be recognized due to pressures on the available land for residential and commercial development, recreational activities, development of the land for agricultural use and its associated use of fertilizers and pesticides, as well as potential new developments relating to (re-)establishment of the land as quarries and mines. This study has focused on three sites in northeast England, with identification of 5 species in total: the common spotted-orchid (Dactylorhiza fuchsia), heath spotted-orchid (Dactylorhiza maculata), pyramidal orchid (Anacamptis pyramidalis), heath fragrant-orchid (Gymnadenia borealis), and the dark-red helleborine (Epipactis atrorubens). While the orchids investigated are not at this time considered to be under threat, in terms of the International Union for Conservation and Nature (IUCN) Red List of Threatened Species (International Union for Conservation and Nature IUCN, 2023), nor in England, as reported in the Natural England Research Report (Natural England Research Report, 2022) however, it was noted that all the orchids investigated in this study are considered to be in decline in terms of their population.
The common spotted-orchid (D. fuchsia) is the most common and widespread orchid in the United Kingdom. It occurs in a variety of habitats that include woodland, grassland, wet meadows, marshes, and dune slacks as well as derelict sites (wasteland, railway embankments and road verges). It is characterized by a variety of flower colors that can range from pale pink to purplish pink and finally white (Figures 1A–H). The heath spotted-orchid (D. maculata), which is closely related to the common spotted-orchid is similar in appearance but with a preference, often, for a different habitat (acid heathland and moorland). The flowers can vary in color between pale to dark pink (Figure 1I). The pyramidal orchid (A. pyramidalis) is so named because of the flowers shape. It is mainly found in southern England. Its normal habitat can include former industrial sites, chalk and limestone grassland and sand dunes. The flowers range in color between pale pink, pink or reddish pink (Figure 1J). The heath fragrant-orchid (G. borealis) is more likely to be found in northern parts of the UK, with a sweet clove-like scent. Its habitat includes grassy moorland, roadside verges, and hill pastures. The flowers range in color between lilac and dark pink (Figure 1K). Finally, the dark-red helleborine (E. atrorubens) is the rarest of the orchids investigated and only normally found in areas of limestone rock, of which the site investigated is a known location. The flowers, as the name suggests, are dark red and occur on opposite sides of the stem (Figure 1L).
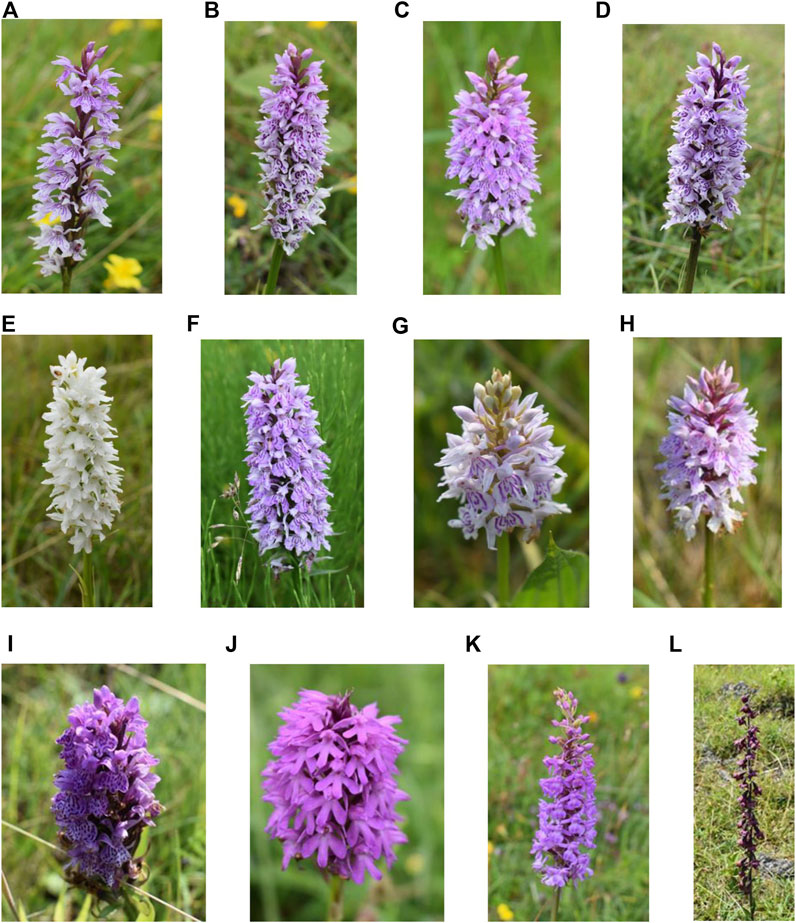
Figure 1. Example orchids across the sites investigated. (A–E) Common spotted-orchids (Dactylorhiza fuchsia) at Bishop Middleham Nature Reserve, (F) Common spotted-orchid (Dactylorhiza fuchsia) at Prudhoe, (G,H) Common spotted-orchids (Dactylorhiza fuchsia) at Weetslade Country Park, (I) Heath spotted-orchid (Dactylorhiza maculata) at Weetslade Country Park, (J) Pyramidal orchid (Anacamptis pyramidalis) at Bishop Middleham Nature Reserve, (K) Heath fragrant-orchid (Gymnadenia conopsea var. borealis) at Bishop Middleham Nature Reserve, and (L) Dark-red helleborine (Epipactis atrorubens) at Bishop Middleham Nature Reserve.
Most of the previous studies have used satellite data to investigate orchid occurrence. For example, a study in south-eastern Estonia, over an area of 300 km2, monitored the occurrence and distribution of up to 10 orchids using historic satellite datasets, and correlated their findings with ground-truth field data (Remm et al., 2009). Abstracted data was investigated using a machine learning algorithm, using the earliest data for training, and the most up to date data for validation of their model. The developed approach was successful in assessing 4 of the preferred orchid species. An ambitious project to globally map orchids was reported in 2022 (Estopinan et al., 2022). Again, using satellite imagery data, they built a dataset for training and validation of a species distribution model (SDM). Using a training set with 13,700 species, and a validation data set of 4,290 species, they were able to build and report on a substantial dataset with data gathered over a 12-month period. By monitoring over time, they were able to monitor orchid seasonal patterns, the importance of habitat, as well as species diversity. An alternate satellite data acquired investigation, focused on a specific orchid type (Cyclopogon luteo-albus), that grows in central Mexico (Diaz-Toribio et al., 2022). Using ecological niche modelling analyses, based on minimum volume ellipsoids, and field data they were able to assess the environmental suitability for the orchid within the study region. The generated model was able to predict the presence of the orchid with 80% reliability.
However, few studies have used unmanned aerial vehicles (i.e., a drone) for monitoring orchid distribution. One drone study highlighted the need to monitor an ecologically threatened species of orchid as an indicator of conservation effort (Groschler and Oppelt, 2022). It is noted that orchids are sometimes used as a proxy for an ecosystem’s health, and so effective monitoring approaches are required, that go beyond simple field studies. Specifically, this group (Groschler and Oppelt, 2022) used a drone, flying at 150 m, to monitor the broad-leaved orchid (Dactylorhiza majalis). Using a drone (Wingtra One) with a multispectral image camera, and a spatial resolution of 3.4 cm, they developed a new algorithm, a magenta vegetation index VI), specifically to enhance monitoring of this orchid species during flowering (July 2021). The multispectral image camera on the drone (MicaSense Altum) collected images in the blue, green, red, red-edge and near-infrared regions. The selected site, in northern Germany, is well known for the presence of this type of broad-leaved orchid (Seer and Schrautzer, 2014). Ground truth data was collated by randomly placing a 1 m2 frame on the ground and manually counting the number of species and recording the coordinates using a GPS device. By integrating the magenta VI within a supervised machine learning algorithm (Random Forest) they were able to classify the orchid to a high degree of certainty (99%). They concluded that drone mapping was an effective tool in assisting the conservation effort and optimizing site-specific management strategies.
Identifying orchid species can be challenging due to their abundance, diversity and short-lived nature. Approaches using image analysis techniques, e.g., Object-Based Image Analysis (OBIA), which can segment image pixels based on their color, shape, and texture characteristic could be applied to classify different orchid species (Chen et al., 2018; Hossain and Chen, 2019). The key steps involved in OBIA for classification of orchid species are segmentation, feature extraction and classification. In segmentation the orchid shape is segmented from the background image using thresholding and k-means. Feature extraction allows relevant features to be identified from the segmented orchid shape, i.e., color, texture, and shape descriptors. Finally, in classification, the extracted features are interrogated using machine learning algorithms, e.g., support vector machine (SVM), random forest, and deep neural networks, to enable accurate identification of orchid species. Previous studies, using OBIA, has been applied to identify three cultivated orchid species from images using SVM with an accuracy of 82.2% (Sabri et al., 2019). In this study (Sabri et al., 2019), the features used for classification were color and the shape features of perimeter, area, eccentricity, and circularity. Similarly, another study used color and the texture features of a Gray-level co-occurrence matrix (GLCM) to classify cultivated orchid species using the supervised classification algorithm of SVM, naïve Bayes and k-nearest neighbour (k-NN) (Andono et al., 2021). The results from the study highlighted the classification accuracy for naïve Bayes as 66%, k-NN as 98% and SVM as 98%. Further, several other studies utilised deep neural networks to classify cultivated orchid species (Arwatchananukul et al., 2020; Sarachai et al., 2022; Ou et al., 2023). A recent study used taxonomic features, which are additional botanic features apart from color, shape, and texture, to classify 63 cultivated orchid species using naïve Bayes and tree-augmented Bayesian networks (TAN) (Apriyanti et al., 2023). The accuracy of this classification algorithm to classify the orchid species was recorded as 89%. While only a limited number of studies on orchid species have been reported, the high accuracy of classification reported shows considerable promise for the development and application of OBIA methods. However, it must be noted that the reported orchid species classification approaches (Sabri et al., 2019; Arwatchananukul et al., 2020; Andono et al., 2021; Sarachai et al., 2022; Apriyanti et al., 2023; Ou et al., 2023) have all been done on cultivated orchids and not applied to species found in the wild.
The aim of this study is to apply remote sensing and image processing analysis to 1) obtain the spectral profile of a range of different orchids using a hand-held spectrometer operating in the visible spectrum (400–700 nm), 2) investigate the possibility of spectral profiling orchids to aid differentiation, 3) apply an unmanned aerial vehicle with a multispectral image camera, operating across the visible to near infrared spectrum (450, 560, 650, 730 and 840 nm), to identify and classify the orchids using a vegetation index, 4) to use the vegetation index to rapidly and effectively map the orchid population on an alternate site, 5) develop an approach for OBIA using field-gathered photogrammetry data followed by machine learning using random forest classification, and 6) consider the potential for mapping habitat and location using image analysis for rapid and accurate identification during the short lifespan of orchids.
2 Materials and methods
2.1 Field sites
Weetslade Country Park (national grid reference: NZ 260 723) is a former coal colliery site, located north of Newcastle upon Tyne. The sinking of the colliery began on the 6 August 1900 with it becoming operational in 1903. It remained active, under different ownership, until it closed on the 10 September 1966. After laying abandoned for several years the spoil heaps were extensively landscaped and became Weetslade Country Park in 2006. The site is now managed by Northumberland Wildlife Trust (Northumberland, 2023) on behalf of the Land Trust (Land Trust, 2023). Of specific interest is marshland located on the lower slope of the north side of the site. Bishop Middleham Nature Reserve (national grid reference: 332,326) is a former quarry, located 4 km northwest of Sedgefield, Co. Durham. The Magnesian limestone quarry ceased to exist in 1934. In 1968, the site was designated as a biological site of special scientific interest (SSSI). The site is colonized with a wide range of plants characteristic of limestone soils, several of which are rare and include the dark-red helleborine (E. atrorubens). The site is managed by Durham Wildlife Trust (Durham, 2023). An additional site was investigated in Prudhoe, Northumberland (National grid reference: NZ 088 634), on wasteland adjacent to the site known as the Prudhoe Transport Interchange, at the junction of Station Road and Princess Way.
2.2 Unmanned aerial vehicle
A multirotor UAV (DJI Phantom 4, supplied by Coptrz Ltd., Leeds, UK) was used with a multispectral camera, stabilized with a 3-axis gimbal, with a 5 camera-array covering the blue (450 ± 16 nm), green (560 ± 16 nm), red (650 ± 16 nm), red edge (730 ± 16 nm) and near-infrared (840 ± 26 nm) spectra with an additional camera that can also provide live images in RGB (visible) mode. In all cases, the camera was angled perpendicular to the ground, with data capture occurring in hover and capture mode. Images were captured as 16-bit TIF files corrected for ambient radiance values. All flights were recorded with a resolution of 1.0 cm/px, a front overlap ratio of 75%, a side overlap ratio of 60% and a course angle of 90°. The UAV speed was 5.0 m/s and had an average height of 18.6 m (294 waypoints at Bishop Middleham Quarry), 18.4 m (393 waypoints at Weetslade Country Park), and 18.2 m (19 waypoints at Prudhoe Transport Interchange). The UAV-MSI camera data was captured at Weetslade Country Park on the 13, 16 and 29 June 2023 and 13 July 2023; Bishop Middleham Quarry on the 6 July 2023; and Prudhoe Transport Interchange on the 6 July 2023. Specific weather conditions relating to daytime temperature during flight, wind speed and direction were assessed using a weather app (XCWeather.co.uk), along with UAV pilot anecdotal observations on cloud coverage.
Data processing of the individual multispectral UAV images was done, by merging and alignment, to create a sparse point cloud which was then precisely positioned to create a 3D point cloud based on the GPS coordinates of each image, leading to the development of a solid mesh model. Finally, an orthomosaic image was generated using the WGS 1984 Web Mercator coordinate system (Agisoft Metashape Professional (64 bit) software v.1.7.1, Agisoft LLC, St. Petersburg, Russia). Orchid identification was done by generation of a dedicated spectral index, the magenta vegetation index, MaVI (Gröschler and Oppelt, 2022) using the raster calculator tool (QGIS v.3.30.3 software, QGIS Development Team). Interrogation of the MaVI map was done using ArcGIS Pro software (ESRI, California, United States):
Subsequently, object-based image analysis (OBIA), on the RGB orchid images, was done using MATLAB software (MATLAB v. R2020b, MathsWorks Inc., United States), alongside image segmentation and classification for identification of orchids based on shape, size, and color.
2.3 Hand-held visible spectroscopy
Visible wavelength data was captured using a pocket-size portable hand-held spectrometer (Spectro 1, Variable, Inc., Chattanooga, TN, United States). The Spectro 1, has an 8 mm measurement aperture which allows spectrophotometric measurements in the visible region from 400 to 700 nm at 10 nm intervals. Spectral information was gathered by placing the hand-held spectrometer on the top of the orchid and recording its spectrum from an axial or end-on position. Prior to each measurement, the spectrometer was calibrated using a white, green, and blue plate according to the manufacturer’s instruction. As the device is operated with the Spectro application software (Variable, Inc., Chattanooga, TN, United States) on the user’s smartphone, the collected reflectance data was automatically uploaded and stored in the manufacturer’s cloud storage service.
For Weetslade Country Park, visible spectrometer data was collected on the 29 June 2023, for 20 orchids, i.e. 16 common spotted-orchid (D. fuchsia) and 4 Heath spotted-orchid (D. maculata). At Bishop Middleham Quarry, spectral data was collected on the 6 July 2023, for 11 orchid species, i.e. 7 common spotted-orchid (D. fuchsia, 1 Pyramidal orchid (A. pyramidalis), 2 Heath fragrant-orchid (G. borealis), and 1 dark-red helleborine (E. atrorubens), while at Prudhoe Transport Interchange, spectral data was collected on the 1 July 2023, for 15 individual common spotted-orchids (D. fuchsia) and on the 2 July 2023, for 10 repeats of the same common spotted-orchid. Orchid identification was done using both Google Lens, an AI-powered app, as well as a dedicated website that includes a section of photographs and specific details on wild orchids of Britain and Ireland (First Nature, 2022). For each orchid, a GPS recording of its position was done using a hand-held system (Garmin GPSMAP® 65, Garmin (Europe) Ltd., Southampton, UK).
For the hand-held spectrometer, data was auto scaled prior to chemometric analysis. Principal Component Analysis (PCA), using 95% confidence regions, was visualized using 2D scores plots, loadings plots and box and whisker plots for reflectance wavelengths. In addition, partial least squares-discriminant analysis (PLS-DA) was used, and data visualized using heat maps based on the variable importance in projection (VIP). All chemometric analysis was done using metaboanalyst (MetaboAnalyst, 2022). Further analysis of orchid reflectance data was done using a statistical t-test (2 paired), at the 95% confidence interval.
2.4 Photographic image collection
A Nikon D3500 body with a Nikon DV VR AF-P Nikkor 18–55 mm 1:3.5–5.6 G was used to capture the top view of each orchid species (Figure 1). Images (93 photographs of the 6 orchid species) were taken in daylight, and at the same location and dates as per the UAV and hand-held spectrometer data. To extract significant features from the 93 photographic images, a precise image segmentation method (MATLAB) was implemented to segment the region of interest, i.e., the orchid shape, from the background. This was done using the image segmentation methods of thresholding and k-means for RGB (red, green and blue), LAB (L represents the brightness of color, A the color along the green and red axis and B the color along the blue to yellow axis), HSV (hue, saturation and value) and YCbCr color spaces. A range of segmentation methods were applied: 1) greyscale, stretch histogram and binarize, 2) k-means segmentation, LAB color space, 3) k-means segmentation, RGB color space, 4) k-means segmentation, HSV color space, 5) k-means segmentation, YCbCr (Y represents brightness of the color, Cb represents the difference between blue and the luminance, and Cr represents the deference between red and the luminance) color space, 6) k-means segmentation, RGB color space with Gabor filters, 7) k-means segmentation, RGB color space with smoothed Gabor filters, and 8) k-means segmentation, LAB color space (with L omitted).
Subsequently the features (shape and color) were extracted using the regionprops function (MATLAB) which measures the properties, such as, the area, centroid and bounding box of each orchid image. The color and shape features extracted from the segmented orchid images for each species are shown in Table 1. Finally, the derived image data for the 6 orchid species, from the 93 original photographic images, were classified using a random forest approach (R software) (R Core Team, 2021). The image data was split to allow both training of the developed appoach (using the majority of the data, i.e. 70%) and its subsequent testing using the color and shape features outlined in Table 1. The number of trees used in the classification was 200. The model accuracy, sensitivity, specificity, precision and F1-score for each orchid species classified was calculated for further evaluation.
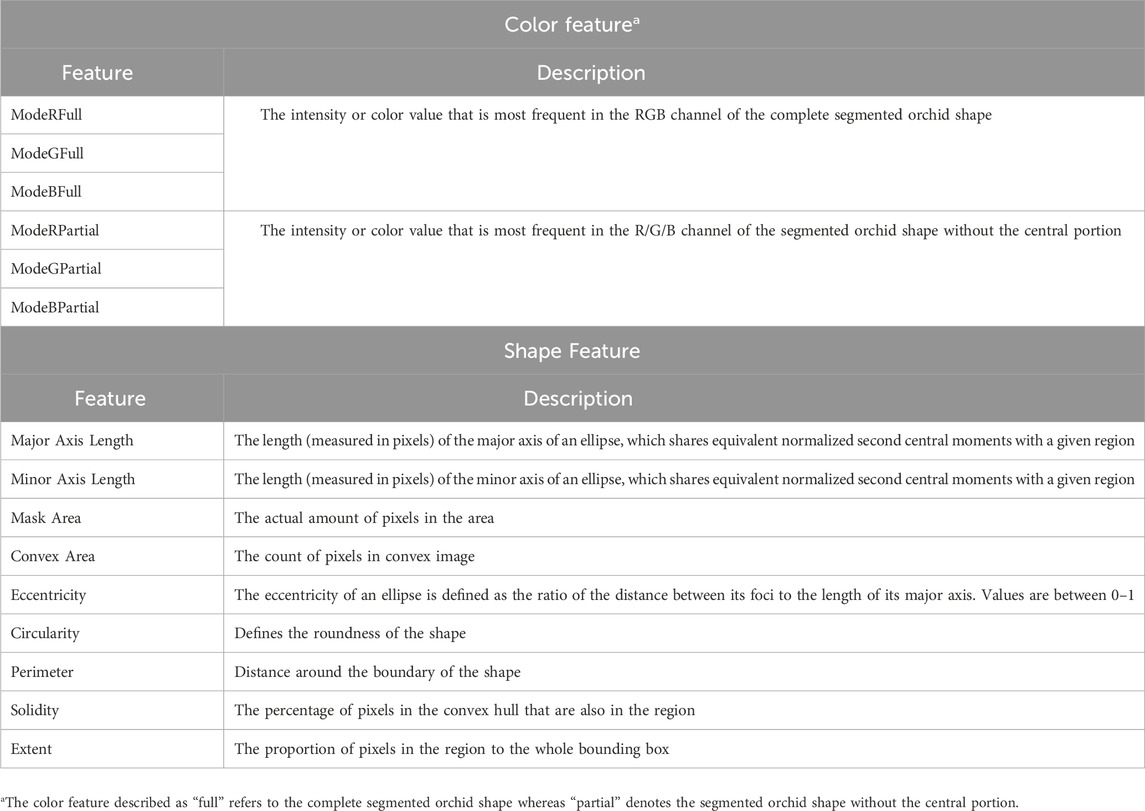
Table 1. Color and Shape features extracted from the orchid species (Chen et al., 2018; Hossain and Chen, 2019).
The accuracy provides a measure of how well the random forest model performs across all the classes. The accuracy is indicated by the sum of the true positives (TP) and true negatives (TN) divided by the total of all four components (TP, TN, false positives (FP), and false negatives (FN)):
When it comes to minimising false negatives, sensitivity is an important statistic to consider, since it provides insight into how well a model performs in recognising positive outcomes. Sensitivity is calculated as below:
Specificity is an important statistic to consider while minimising false positives, since it reveals how well a model performs in correctly recognising negative outcomes of the class. Specificity is calculated as below:
Precision is an important parameter when it comes to minimising the false positives since it reveals how well a model performs in creating accurate positive predictions. To provide a thorough evaluation of a classification model, it is frequently used with other measures, such as, sensitivity and the F1 score. Precision is calculated as below:
The F1 score is a useful statistic for classification tasks since it provides a compromise between precision and sensitivity, and it is especially beneficial when dealing with imbalanced datasets. The F1-score is calculated as below:
3 Results and discussion
3.1 Analysis of orchid data using a hand-held spectrometer
All spectroscopic data of the orchids, from the hand-held device, was framed within the manufacturer provided reference plates (white, green, and blue). The generated spectroscopic data for the reference plates is shown in Supplementary Figure S1. Excellent precision and repeatability are observed across all recorded spectral ranges from 400 to 700 nm, obtained on different days and locations, within an 8-day time period. To investigate whether the various orchid types (Figure 1) could be identified from each other, irrespective of their location, PCA was used. As can be seen in Figure 2A the orchid types can been grouped by their reflectance readings regardless of their location. The PCA visualization of the 92 orchids (47 common spotted-orchid, 6 white common spotted-orchids, 4 heath spotted-orchid, 10 pyramidal orchid, 14 heath fragrant-orchid, and 11 dark-red helleborine), identified 6 distinct clusters that were explained by 92.6% of the total variance. However, most of the datapoints were not discernible from each other with co-clustering occurring, apart from the white common spotted-orchid. An alternate data treatment approach using PLS-DA of the variable importance in projection (VIP) reflectance bands has been done (Figure 2B). The reflectance wavelengths with the highest VIP scores (x > 1.5) were identified as 400, 560 and 410 nm. However, by closer inspection of Figure 3B it was noted that the inclusion of the additional reflectance wavelength of 420 nm, would allow additional differentiation from within the common spotted-orchids, whilst still maintaining the approach of using the high VIP scores (x > 1.2).
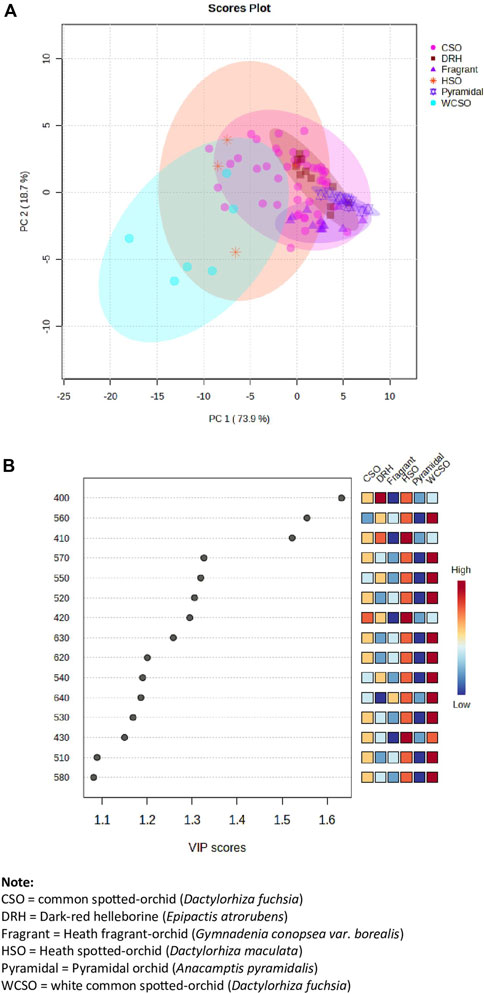
Figure 2. Hand-held spectrometer data of all orchids from the 3 sites investigated. (A) Principal component analysis (PCA) of orchid types across all reflectance bands from 400 to 700 nm and locations, and (B) partial least squares-discriminant analysis (PLS-DA) of the variable importance in projection (VIP) reflectance bands for the 15 top wavelengths.
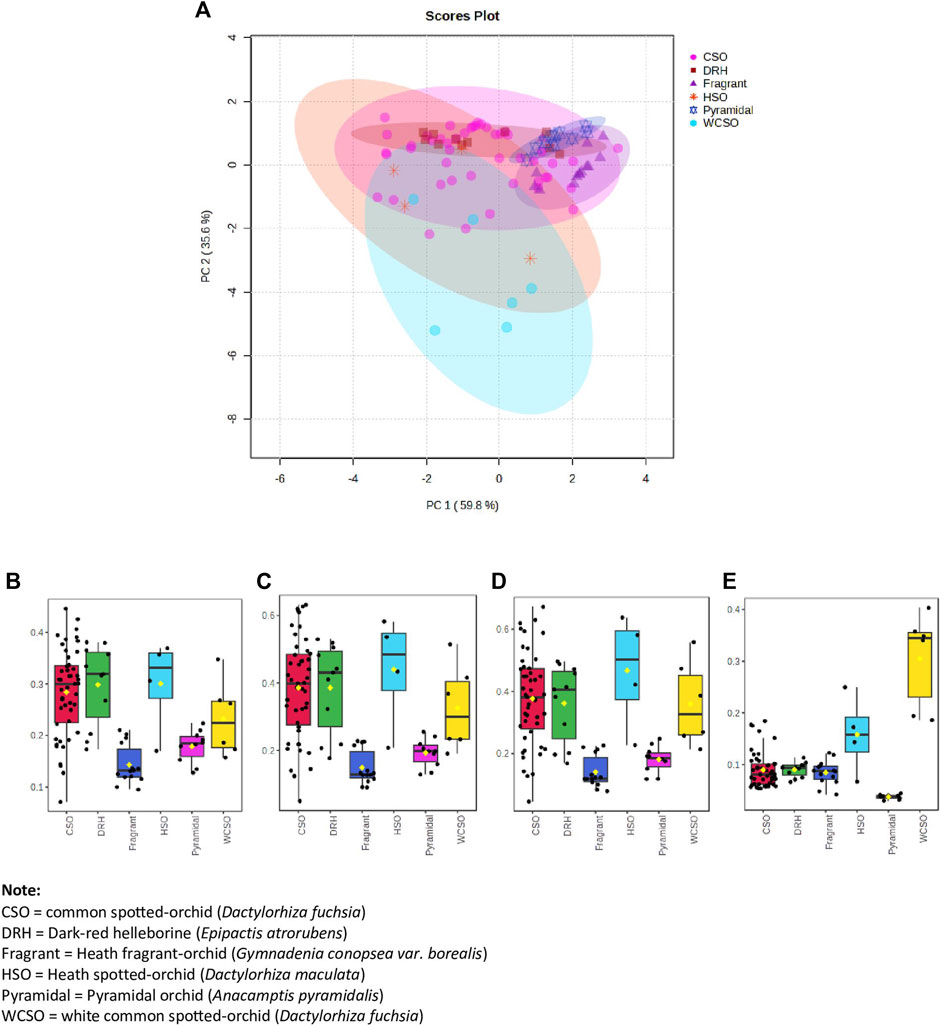
Figure 3. Hand-held spectrometer data of all orchids from the 3 sites investigated. (A) Principal component analysis (PCA) of orchid types using top 3 reflectance wavelengths of 400, 560 and 410 nm plus the 7th top reflectance wavelength of 420 nm, (B) box and whisker plot at 400 nm, (C) box and whisker plot at 410 nm, (D) box and whisker plot at 420 nm, and (E) box and whisker plot at 560 nm.
The PCA of all orchids using the 4 identified reflectance wavelengths was done (Figure 3). Again, 6 distinct groupings, with a total variance of 95.4%, was obtained with some degree of separation between clusters, most notably by the white common spotted-orchid. By additionally plotting box and whisker plots for the four reflectance wavelengths (Figures 3B−E) illustrates both the inter-relationship of wavelengths and their independence in discriminating between different orchids. By using the median (middle value of each orchid reflectance) it is possible to visually differentiate each orchid from another for each wavelength, i.e. 400, 410, 420 and 560 nm. However, by inclusion of all the reflectance data from the minimum to maximum whiskers does not always allow significant differentiation for the reflectance wavelengths of 400 nm (Figure 3B), 410 nm (Figure 3C) and 420 nm (Figure 3D) due to the variation in the spectral reflectance of the common spotted orchid (Figures 1A–H). However, the inclusion of the reflectance wavelength of 560 nm (Figure 3E), allows clear differentiation between the white common spotted-orchid (D. fuchsia) and the other orchids, as well as the pyramidal orchid (A. pyramidalis) and the other orchids. While the reflectance wavelengths of 410 and 420 nm, allow clear differentiation between the heath spotted-orchid (D. maculata) and the pyramidal orchid (A. pyramidalis) and (heath) fragrant orchid (G. borealis).
A final PCA visualisation, using the reflectance wavelengths of 400, 410, 420 and 560 nm, focused on whether it was possible to differentiate the white common spotted-orchid from the common spotted-orchid (Figure 4A). The PCA identified 2 distinct groupings, with a total variance of 99.2%, and with separation between the clusters, of the common spotted-orchids, irrespective of location. The slight overlap between the clusters by the white common spotted-orchid can be illustrated in the photographs in Figures 4B, C. These photographs show a distinct variation within white common spotted-orchids, that while they appear all white from a lateral or side-on view (not shown, but also see Figure 1A), they can have a color variation difference in the axial or end-on view, as used by the hand-held spectrometer.
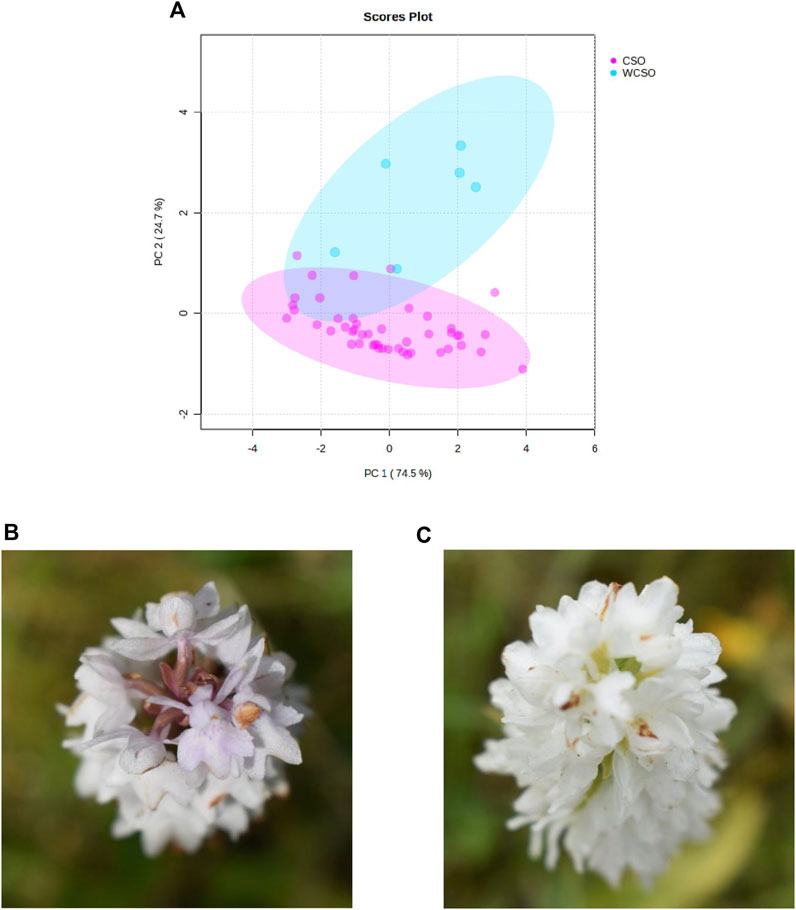
Figure 4. Hand-held spectrometer data of the common spotted-orchid from the 3 sites investigated. (A) PCA of common spotted-orchid (CSO) and white common spotted-orchid (WCSO) using top 3 reflectance wavelengths of 400, 560 and 410 nm plus the 7th top reflectance wavelength of 420 nm, and (B) top image of a white common spotted-orchid, and (C) top photograph of a different white common spotted-orchid.
3.2 Analysis of orchid data using a UAV with MSI camera
Two types of orchid species were found in Weetslade Country Park, i.e., the common spotted-orchid (D. fuchsia) (Figures 1G, H) and the heath spotted-orchids (D. maculata) (Figure 1I). Using the UAV-MSI data, the MaVI was used to map orchid species across Weetslade Country Park in the short duration growth period. The orchids were mapped by considering their shape and the MaVI pixel value. These two factors are significant and prevent misidentification, and hence avoid misclassification of orchids, even when similar pixel values occur in the landscape proximity. It is noted that although the common-spotted and heath spotted orchids are visually distinguishable by lateral (side-on) photographs (Figures 1G, H from Figure 1I), it is challenging to distinguish the two species of orchids using the axially acquired UAV-MSI data. This is exemplified in Figures 5A, B which shows the RGB photographs of both orchids as spherical in shape and form. In addition, to the shape and form, the UAV-MSI RGB images and derived MaVI pixel value (−50,000 to −70,000) images (Figure 5) show their similarities and the inability to distinguish between the two orchid types. The UAV-MSI camera data was however corroborated, with ground reference data obtained on the 29 June 2023, in Weetslade Country Park. It was found that the use of the derived MaVI images was able to identify and map 56% of the common spotted-orchids (D. fuchsia) and 75% of the heath spotted-orchids (D. maculata). The discrepancy in the coincidence of identification was attributed to the physical small size and stature of the orchids, and in some cases, the presence of surrounding vegetation that masked their visualization. However, using the MaVI images, the number of orchids present could be tracked (Figure 6A) and mapped (Figure 6B) across Weetslade Country Park during their growth period (see also Supplementary Figure S2). The data illustrates the short lifecycle of these wild orchids in northeast England and emphasizes the importance of monitoring and mapping that is achievable using UAV-MSI camera data.
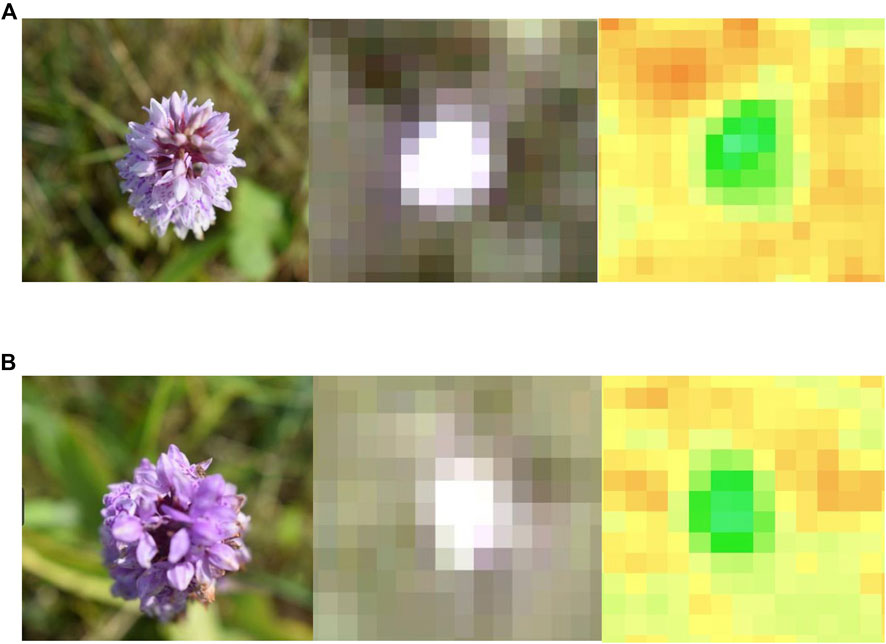
Figure 5. Spectral identification of the (A) Common spotted-orchid (Dactylorhiza fuchsia) and (B) Heath spotted orchid (Dactylorhiza maculata) in Weetslade Country Park, using a Canon RGB camera (axial view) photograph, the UAV-RGB image, and the MaVI generated image, respectively.
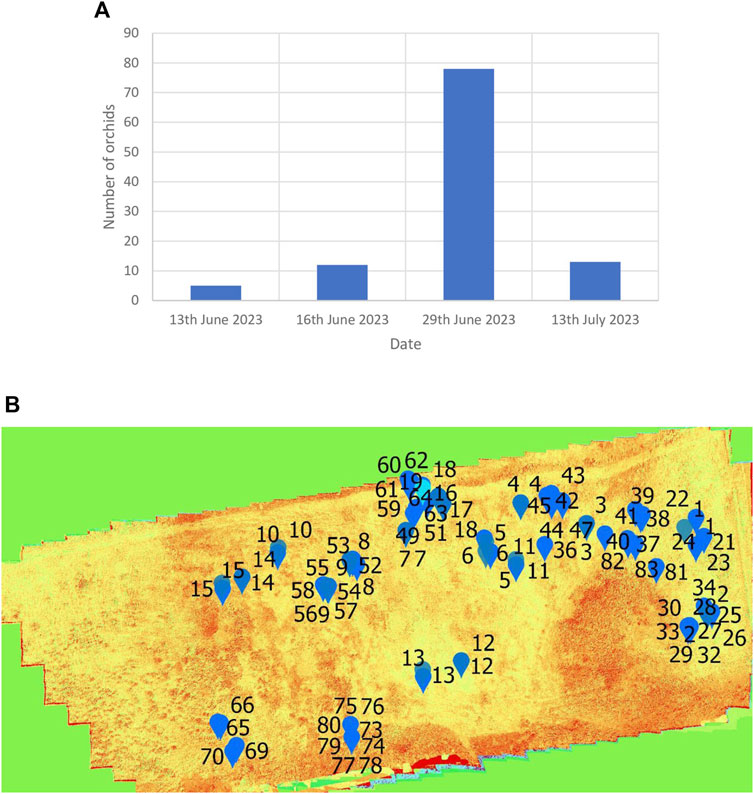
Figure 6. Emergence and appearance of the common-spotted and heath spotted orchids in Weetslade Country Park. (A) The number of orchids, and (B) the distribution of the 78 orchids on the 29th June 2023.
3.3 Orchid mapping in Bishop Middleham Quarry
Using the UAV-MSI data, MaVI was applied to identify and map a range of orchid species across Bishop Middleham Quarry. Using the same approach as the previous site, all derived MaVI images were corroborated using ground-truth data obtained on the 6 July 2023. It was found that MaVI images were able to identify the orchid species; common spotted-orchid (D. fuchsia), common spotted-orchid albino (D. fuchsia) and pyramidal orchid (Anacamptis pyramidalis) (Figure 7) that allowed translation of the information to a map of the site (Figure 8). Issues in terms of identification were found for the heath fragrant-orchid (Gymnadenia conopsea var. borealis) and the dark red helleborine (E. atrorubens), Figures 1K, L, respectively. This inability to identify was inferred due to their smaller axial shape, linked to the UAV-MSI camera’s insufficient spatial resolution.
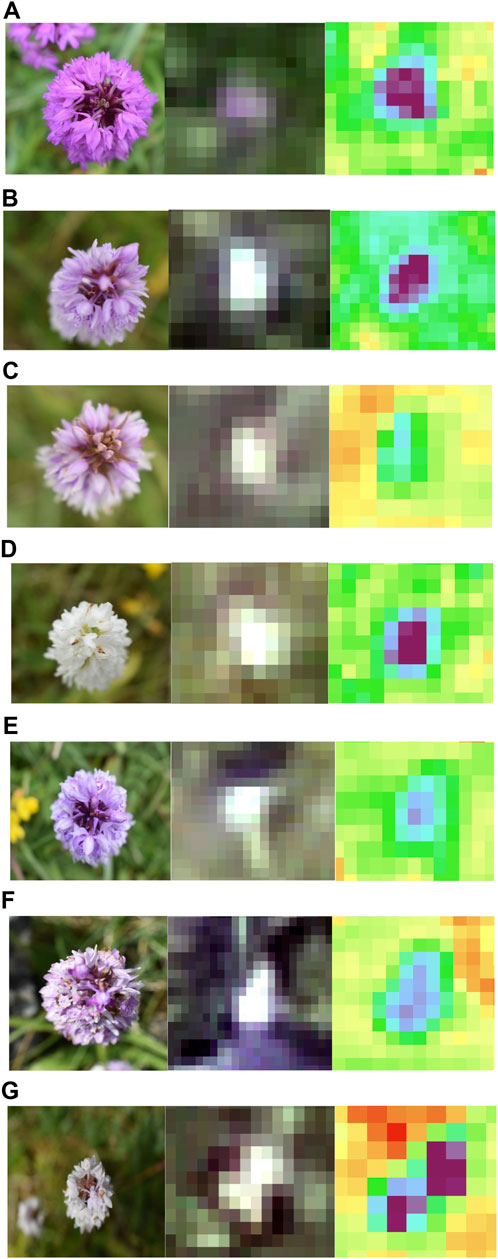
Figure 7. Spectral identification of the (A) Pyramidal orchid (Anacamptis pyramidalis), (B) Common spotted-orchid (Dactylorhiza fuchsia), (C) Common spotted-orchid (Dactylorhiza fuchsia), (D) Common spotted-orchid albino (Dactylorhiza fuchsia), (E) Common spotted-orchid (Dactylorhiza fuchsia), (F) Common spotted-orchid (Dactylorhiza fuchsia), and (G) Common spotted-orchid albino (Dactylorhiza fuchsia) in Bishop Middleham Quarry, using a Canon RGB camera (axial view) photograph, the UAV-RGB image, and the MaVI generated image, respectively.
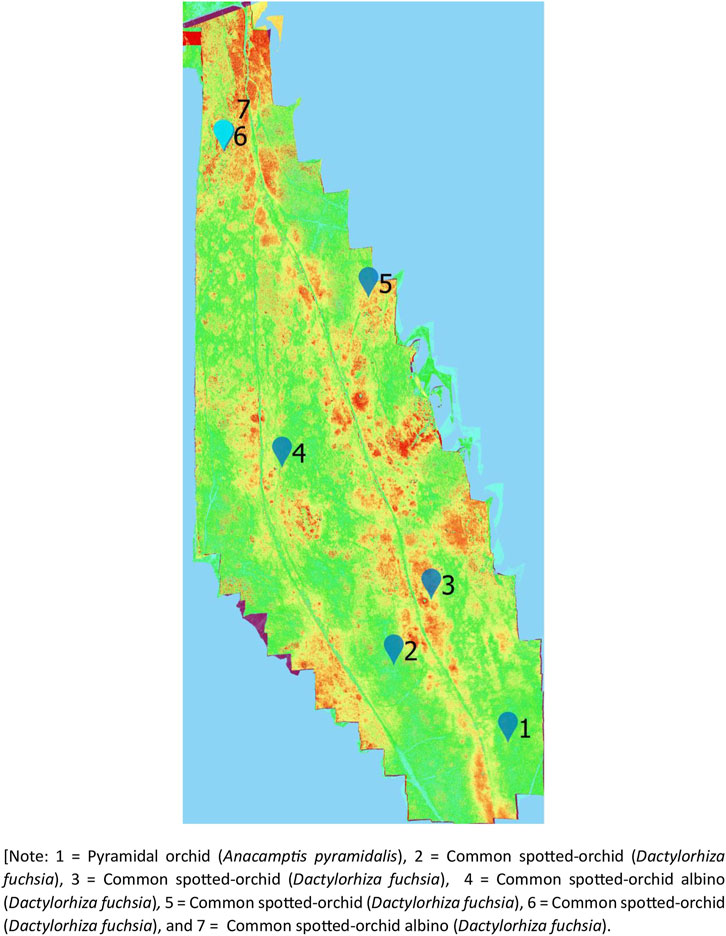
Figure 8. Identification and location of orchids in Bishop Middleham Quarry.
3.4 Object-based image analysis of orchids using RGB photographs
An alternate approach for identification of wild orchids used object-based image analysis (OBIA) of photographic images. In this approach, OBIA classifies objects based on their shape, size, and spectral features (Karantanellis et al., 2020). The two steps involved in OBIA are segmentation and classification. The technique of segmentation divides the pixels in an image into groups of objects or features which possess similar spectral and spatial properties (Chen et al., 2018; Hossain and Chen, 2019). Whereas, the technique of classification classifies the objects using size (area and length), shape (roundness, asymmetry and rectangular), texture (smoothness), spatial and spectral properties (Davis, 2019). In this research, MaVI has so far been applied to identify orchids within Weetslade Country Park and Bishop Middleham Quarry. However, some limitations were identified which prevented MaVI from fully being able to classify orchids across the sites; this was largely due to the similar color of the different orchids (Figure 1), which made it challenging to identify them only by considering their spectral characteristics using a vegetation index, such as MaVI. By considering OBIA allows additional features to be taken into consideration to classify the variety of orchid species across sites. The OBIA method allows RGB photographs of different orchid species to be classified by the image classification method of thresholding.
Eight different segmentation approaches were used in this study to select the most accurate segmentation method. The first approach converted the images to greyscale, followed by a stretch histogram and finally binarised. The remaining segmentation approaches used k-means segmentation, an unsupervised classification approach, that segments objects into groups with similar pixel values. K-means segmentation was performed on a variety of color spaces and Gabor filter images. Color can be described by its colorfulness, brightness, and hue, which makes it an important attribute in image segmentation as this can allow discrimination between objects (Ganesan et al., 2019). Hence, utilising the different color spaces of RGB, LAB, HSV and YCbCr can be an effective approach for image segmentation. An example of the application of all the segmentation methods, for the common spotted-orchid albino (D. fuchsia), is shown in Figure 9. From these different segmentation methods, it is concluded that k-means segmentation using the LAB color space is the most effective approach (Figure 9B) as it most closely follows the actual orchid petal outline. Table 2 summarises the percentage accuracy of the different segmentation approaches and indicates that k-means segmentation using LAB color space has the highest percentage accuracy (72.9%) (see Supplementary Material). Therefore, k-means segmentation using the LAB color space was applied to segment the orchid shape from the images and to extract the features listed in Table 1.
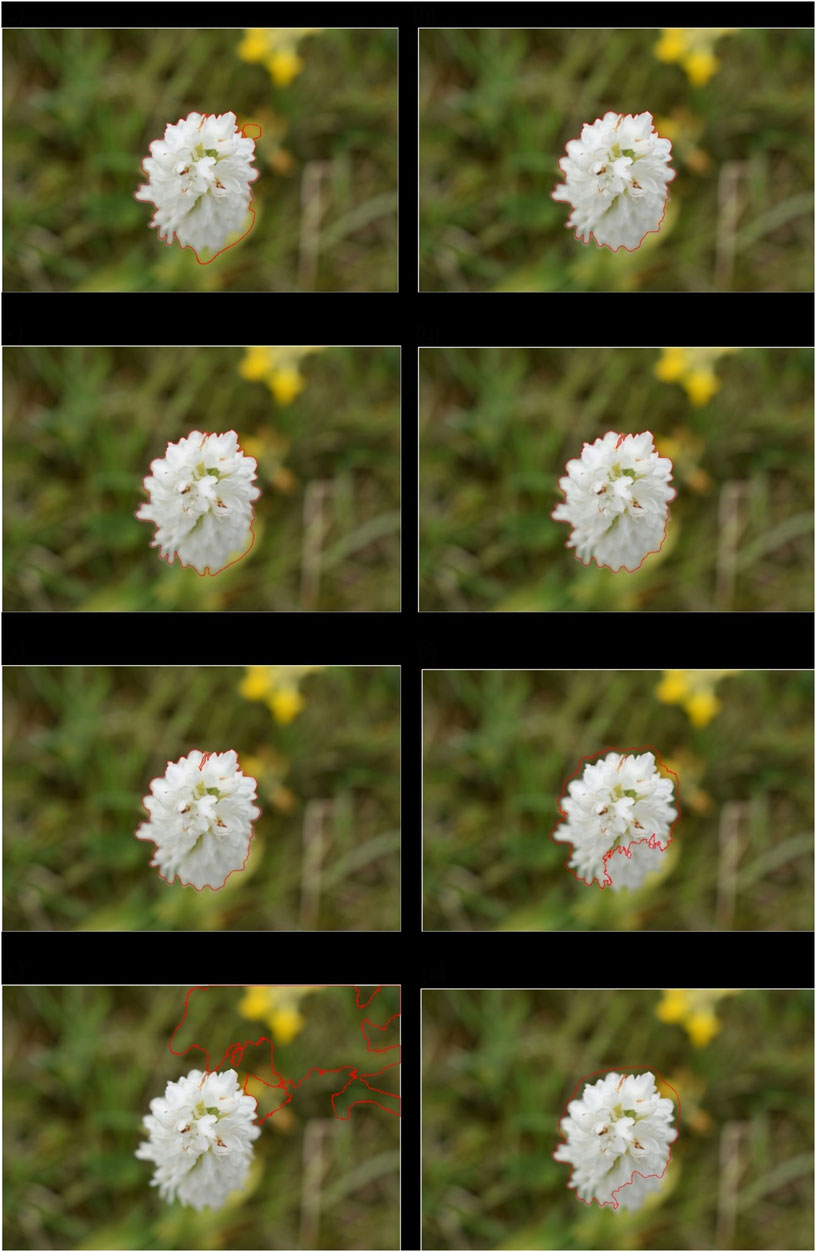
Figure 9. Common spotted-orchid albino (Dactylorhiza fuchsia) using (A) Greyscale, stretch histogram and binarize (B) K-means segmentation, LAB color space (C) K-means segmentation, RGB color space (D) K-means segmentation, HSV color space (E) K-means segmentation, YCbCr color space (F) K-means segmentation, RGB color space with gabor filters (G) K-means segmentation, RGB color space with smoothed Gabor filters (H) K-means segmentation, LAB color space (with L omitted) [Note: The outline of the region of interest (orchid shape) has been overlaid as a red line on the original image for visualisation].
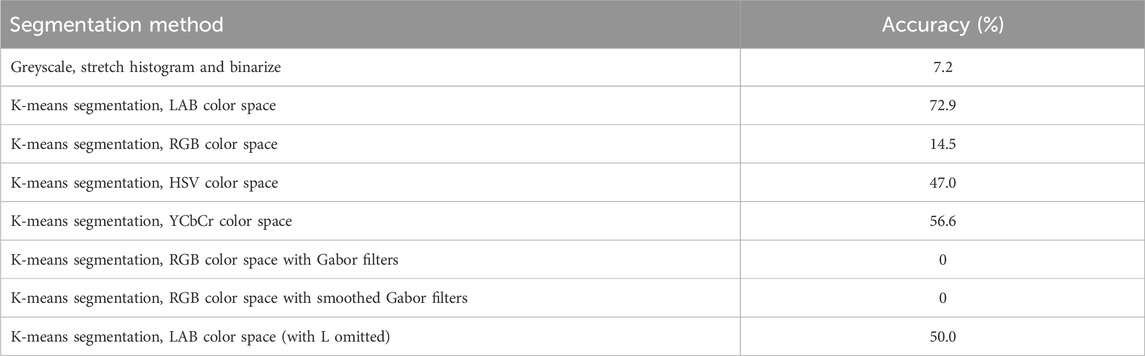
Table 2. Segmentation methods with the percentage accuracy.
3.5 Random forest classification
Random forest classification is a supervised machine learning algorithm which uses multiple decision trees trained on different data to make robust prediction (Simon et al., 2023). Random forest also provides a measure of the significant features which contributes to an accurate prediction using this approach. Random forest classification was used to classify the six different orchid species using the 15 features indicated in Table 1. Model evaluations were defined from the confusion matrix (Table 3). The confusion matrix provides a summary of the predictions made by the random forest model, providing an understanding of how well the model has performed in terms of its accuracy, sensitivity, specificity, precision, and F1-score [see Supplementary Material].
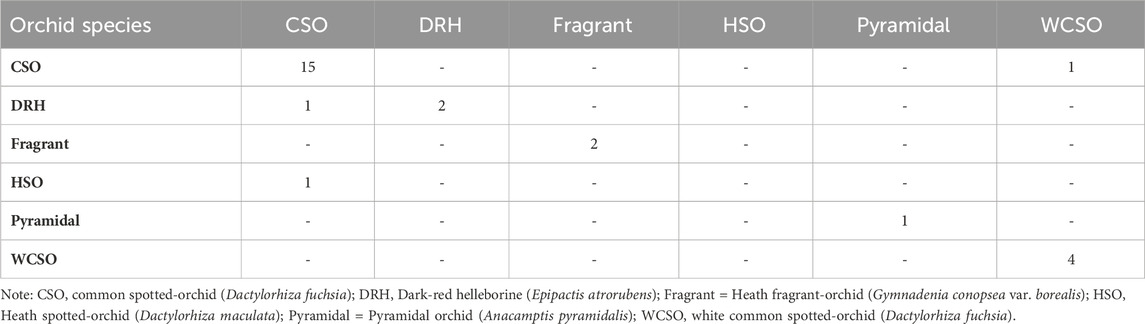
Table 3. Confusion matrix of random forest classification model.
The accuracy of the random forest model at classifying the orchid species was 86%. According to the performance metrics, shown in Table 4, a higher sensitivity, specificity, precision, and F1-score was recorded for all orchid species except for the heath spotted orchid. This could be due to the limited number of sampling data for the heath spotted orchid in comparison to other orchid species. In addition, a MeanDecreaseGini plot using all the features in Table 1 was plotted (Figure 10). A greater MeanDecreaseGini value for a feature indicates that this feature is more significant in the Random Forest decision making. According to Figure 10 the two features which show the greatest MeanDecreaseGini values are the ConvexArea and Eccentricity. This indicates that by incorporating these two features, in a random forest model, increases the classification accuracy of identifying the orchid species.
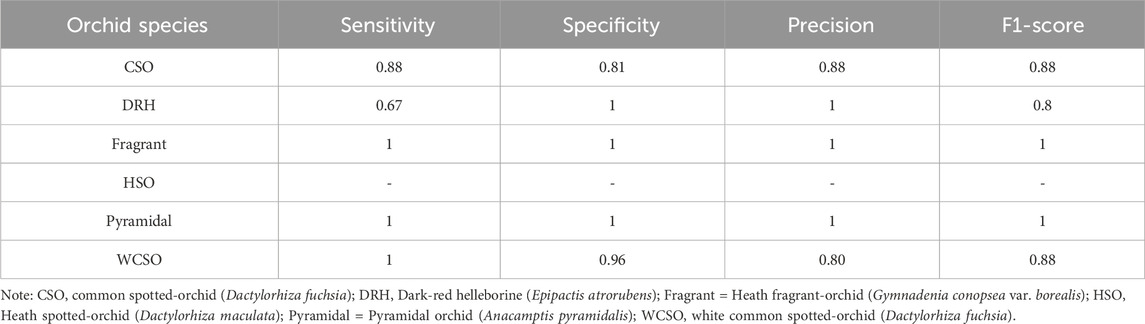
Table 4. Performance metrics evaluated by confusion matrix for orchid species.
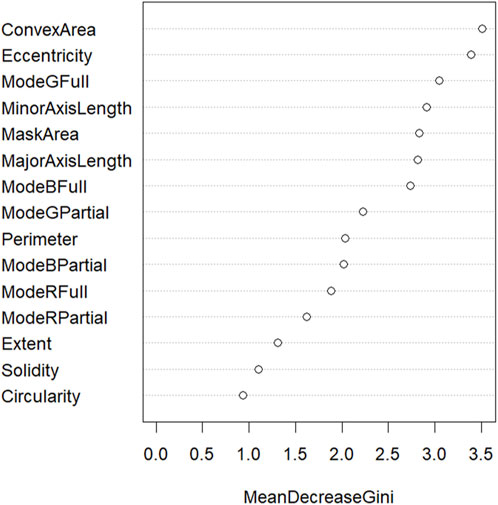
Figure 10. Important variable for classifying orchid species by random forest model.
Other researchers have applied machine learning (Sabri et al., 2019; Andono et al., 2021) or neural network algorithms (Arwatchananukul et al., 2020; Apriyanti et al., 2021; Sarachai et al., 2022; Apriyanti et al., 2023; Ou et al., 2023) to extract flower features (e.g., colour, shape) from the library images of orchids. These approaches were also able to obtain high accuracies (82%–99%). However, and in contrast to our research, they all relied on the use of orchid image databases, with photographs taken from predominantly a lateral viewpoint prior to image analysis. Another approach used leaf cuttings from 13 types of orchids, obtained from a nursery, followed by analysis of their spectral profile (4000–550 cm-1) using Fourier-transform infrared spectroscopy (Chen et al., 2019). Subsequent data analysis was done using a stacked sparse auto-encoder (SSAE) for identification purposes. The results indicated a classification accuracy of 99.4%. Another interesting approach (Jin et al., 2015) has used digitized images of plant leaf cuttings to investigate leaf shape, venation and texture using an automated sparse representation-based classifier model. The accuracies, across eight types of plants, was assessed to be within the range 73%–79%. The limitations of these approaches are highlighted by the plant information required for the subsequent data analysis. In all cases the samples’ data was either obtained from leaf cuttings or by using photographs from a digital library. In contrast the different machine learning approaches chosen, have all provided high accuracies, irrespective of the object-based image analysis approach taken. However, one of the unique aspects of our research was that digitized images of orchids were obtained in-situ in the wild and that we required images from an axial (or top-down) perspective. Our approaches have been investigated with the aim of being able to deploy an UAV fitted with a high-resolution multispectral image camera or high-resolution photogrammetry.
4 Conclusion
Several approaches for the identification and mapping of wild orchids in northeast England have been described. A combination of the different approaches has provided a comprehensive tool kit for orchid identification, based on the available data. Data obtained using the hand-held spectrometer identified the key differentiating wavelengths for orchid identification. By selecting different wavelengths allowed differentiation between the different orchids, specifically by using 560 nm, the white common-spotted orchid and pyramidal orchid from the other orchids. In addition, by using 410 nm and 420 nm, allowed differentiation between the heath spotted orchid and either the pyramidal orchid or the heath fragrant orchid. Deployment and analysis of the data from the UAV-MSI camera using the magenta vegetation index (MaVI) allowed identification and location of both the common spotted-orchids (57%) and heath spotted-orchids (75%) which was successfully corroborated with ground-truth data. Object-based image analysis was applied to the photogrammetry images using k-means segmentation, with LAB color space. This allowed highly accurate identification of orchids (72.9%). Data from the OBIA was subjected to classification using a random forest approach. The developed model allowed orchid identification with 86% accuracy. Finally, the research has provided an insight as to how a more rapid approach for screening of wild orchid populations could take place. Future opportunities to combine the use of remote sensing approaches with OBIA using machine learning models provides opportunities, for automatically evaluating across multiple sites, to assess the population, distribution, and characteristics of orchid species.
Data availability statement
The original contributions presented in the study are included in the article/Supplementary Material, further inquiries can be directed to the corresponding author.
Author contributions
SA: Data curation, Formal Analysis, Investigation, Methodology, Writing–original draft, Writing–review and editing. JL: Data curation, Formal Analysis, Investigation, Methodology, Writing–original draft, Writing–review and editing. SR: Data curation, Formal Analysis, Methodology, Writing–original draft, Writing–review and editing. NB: Formal Analysis, Methodology, Writing–original draft, Writing–review and editing. CN: Investigation, Methodology, Writing–original draft, Writing–review and editing. JP: Conceptualization, Funding acquisition, Methodology, Resources, Writing–original draft, Writing–review and editing. JD: Conceptualization, Data curation, Formal Analysis, Funding acquisition, Investigation, Methodology, Project administration, Resources, Supervision, Writing–original draft, Writing–review and editing.
Funding
The author(s) declare that financial support was received for the research, authorship, and/or publication of this article. Details of all funding sources should be provided, including grant numbers if applicable. Please ensure to add all necessary funding information, as after publication this is no longer possible.
Acknowledgments
Access to Weetslade Country Park was granted by Geoff Dobbins, Senior Estates officer (Reserves), Northumberland Wildlife Trust. While access to Bishop Middleham Quarry was granted by Mark Dinning, Head of Conservation, Durham Wildlife Trust.
Conflict of interest
The authors declare that the research was conducted in the absence of any commercial or financial relationships that could be construed as a potential conflict of interest.
Publisher’s note
All claims expressed in this article are solely those of the authors and do not necessarily represent those of their affiliated organizations, or those of the publisher, the editors and the reviewers. Any product that may be evaluated in this article, or claim that may be made by its manufacturer, is not guaranteed or endorsed by the publisher.
Supplementary material
The Supplementary Material for this article can be found online at: https://www.frontiersin.org/articles/10.3389/fenvs.2024.1371445/full#supplementary-material
References
Andono, P. N., Rachmawanto, E. H., Herman, N. S., and Kondo, K. (2021). Orchid types classification using supervised learning algorithm based on feature and color extraction. Bull. Electr. Eng. Inf. 10 (5), 2530–2538. doi:10.11591/EEI.V10I5.3118
Apriyanti, D. H., Spreeuwers, L. J., and Lucas, P. J. (2023). Deep neural networks for explainable feature extraction in orchid identification. Appl. Intell. 53 (21), 26270–26285. doi:10.1007/s10489-023-04880-2
Apriyanti, D. H., Spreeuwers, L. J., Lucas, P. J. F., and Veldhuis, R. N. J. (2021). Automated color detection in orchids using color labels and deep learning. PloS ONE 16 (10), e0259036. doi:10.1371/journal.pone.0259036
Arwatchananukul, S., Kirimasthong, K., and Aunsri, N. (2020). A new Paphiopedilum orchid database and its recognition using convolutional neural network. Wirel. Personal. Commun. 115, 3275–3289. doi:10.1007/s11277-020-07463-3
British Naturalist Association (2023). Orchid species found in the UK. Available at: https://www.bna-naturalists.org/id-guide-orchids/ (Accessed August 15, 2023).
Chen, G., Weng, Q., Hay, G. J., and He, Y. (2018). Geographic object-based image analysis (GEOBIA): emerging trends and future opportunities. GIScience Remote Sens. 55 (2), 159–182. doi:10.1080/15481603.2018.1426092
Chen, Y., Chen, Y., Feng, X., Yang, X., Zhang, J., Qiu, Z., et al. (2019). Variety identification of orchids using Fourier transform infrared spectroscopy combined with stacked sparse auto-encoder. Molecules 24, 2506. doi:10.3390/molecules24132506
Davis, D. S. (2019). Object-based image analysis: a review of developments and future directions of automated feature detection in landscape archaeology. Archaeol. Prospect. 26 (2), 155–163. doi:10.2139/ssrn.3827105
Diaz-Toribio, D., Flores-Palacios, A., Maqueo, O. P., Lira-Noriega, A., and Garcia-Franco, J. G. (2022). Remote sensing and field information aid in predicting the presence of the terrestrial orchid Cyclopogon luteo-albus. Nordic J. Bot. 2022, e03608. doi:10.1111/njb.03608
Durham (2023). Durham Wildlife Trust. Available at: https://www.durhamwt.com (Accessed August 15, 2023).
Estopinan, J., Servajean, M., Bonnet, P., Munoz, F., and Joly, A. (2022). Deep species distribution modeling from sentinel-2 image time-series: a global scale analysis on the orchid family. Front. Plant Sci. 13, 839327. doi:10.3389/fpls.2022.839327
First Nature (2022). Wild orchid photo gallery. Available at: https://www.first-nature.com/flowers/∼wildorchids.php.
Ganesan, P., Sathish, B. S., Vasanth, K., Sivakumar, V. G., Vadivel, M., and Ravi, C. N. (2019). “A comprehensive review of the impact of color space on image segmentation,” in 2019 5th International Conference on Advanced Computing and Communication Systems (ICACCS), USA, 15-16 March 2019 (Coimbatore, India:ICACCS), 962–967. doi:10.1109/ICACCS.2019.8728392
Groschler, K.-C., and Oppelt, N. (2022). Using drones to monitor broad-leaved orchids (Dactylorhiza majalis) in high-nature-value grassland. Drones 6, 174. doi:10.3390/drones6070174
Gröschler, K. C., and Oppelt, N. (2022). Using drones to monitor broad-leaved orchids (dactylorhiza majalis) in high-nature-value grassland. Drones 6 (7), 174. doi:10.3390/drones6070174
Hossain, M. D., and Chen, D. (2019). Segmentation for Object-Based Image Analysis (OBIA): a review of algorithms and challenges from remote sensing perspective. ISPRS J. Photogrammetry Remote Sens. 150, 115–134. doi:10.1016/j.isprsjprs.2019.02.009
International Union for Conservation and Nature (IUCN) (2023). Red list of threatened species. Available at: https://www.iucnredlist.org/species (Accessed November 6, 2023).
Jin, T., Hou, X., Li, P., and Zhou, F. (2015). A novel method of automatic plant species identification using sparse representation of leaf tooth features. PloS One 10 (10), e0139482. doi:10.1371/journal.pone.0139482
Karantanellis, E., Marinos, V., Vassilakis, E., and Christaras, B. (2020). Object-based analysis using unmanned aerial vehicles (UAVs) for site-specific landslide assessment. Remote Sens. 12 (11), 1711. doi:10.3390/rs12111711
Land Trust (2023). Land Trust. Available at: https://thelandtrust.org.uk (Accessed August 15, 2023).
MetaboAnalyst (2022). MetaboAnalyst. Available at: https://www.metaboanalyst.ca/.
Natural England Research Report (2022). Outcome indicator framework for england's 25 Year environment plan: D5 conservation status of our native species. Available at: https://publications.naturalengland.org.uk/publication/6315201438941184 (Accessed November 6, 2023).
Northumberland (2023). Northumberland Wildlife Trust. Available at: https://www.nwt.org.uk (Accessed August 15, 2023).
Ou, C. H., Hu, Y. N., Jiang, D. J., and Liao, P. Y. (2023). “An ensemble voting method of pre-trained deep learning models for orchid recognition,” in 2023 IEEE International Systems Conference (SysCon), Vancouver, BC, Canada, 17-20 April 2023 (IEEE), 1–5. doi:10.1109/SysCon53073.2023.10131263
R Core Team (2021). R: a language and environment for statistical computing. Vienna, Austria: R Foundation for Statistical Computing.
Remm, K., Linder, M., and Remm, L. (2009). Relative density of finds for assessing similarity-based maps of orchid occurrence. Ecol. Model. 220, 294–309. doi:10.1016/j.ecolmodel.2008.10.017
Sabri, N., Kamarudin, M. F., Hamzah, R., Manghsor, N. N. A., Samah, K. A. F. A., and Hasan, N. (2019). “Combination of color, shape and texture features for orchid classification,” in 2019 IEEE 9th International Conference on System Engineering and Technology (ICSET), China, 7-7 Oct. 2019 (IEEE), 315–319. doi:10.1109/ICSEngT.2019.8906322
Sarachai, W., Bootkrajang, J., Chaijaruwanich, J., and Somhom, S. (2022). Orchid classification using homogeneous ensemble of small deep convolutional neural network. Mach. Vis. Appl. 33 (1), 17–13. doi:10.1007/s00138-021-01267-6
Seer, F. K., and Schrautzer, J. (2014). Status, future prospects, and management recommendations for alkaline fens in an agricultural landscape: a comprehensive survey. J. Nat. Conserv. 22, 358–368. doi:10.1016/j.jnc.2014.03.003
Simon, S. M., Glaum, P., and Valdovinos, F. S. (2023). Interpreting random forest analysis of ecological models to move from prediction to explanation. Sci. Rep. 13, 3881. doi:10.1038/s41598-023-30313-8
Keywords: orchids, unmanned aerial vehicle, multispectral imaging, photogrammetry, object-based image analysis
Citation: Ahmed S, Lightbown J, Rutter SR, Basu N, Nicholson CE, Perry JJ and Dean JR (2024) Use of remote sensing and image processing for identification of wild orchids. Front. Environ. Sci. 12:1371445. doi: 10.3389/fenvs.2024.1371445
Received: 17 January 2024; Accepted: 25 March 2024;
Published: 26 April 2024.
Edited by:
Shuisen Chen, Guangzhou Institute of Geography, ChinaReviewed by:
Kalev Sepp, Estonian University of Life Sciences, EstoniaMiguel Alfonso Ortega-Huerta, National Autonomous University of Mexico, Mexico
Copyright © 2024 Ahmed, Lightbown, Rutter, Basu, Nicholson, Perry and Dean. This is an open-access article distributed under the terms of the Creative Commons Attribution License (CC BY). The use, distribution or reproduction in other forums is permitted, provided the original author(s) and the copyright owner(s) are credited and that the original publication in this journal is cited, in accordance with accepted academic practice. No use, distribution or reproduction is permitted which does not comply with these terms.
*Correspondence: John R. Dean, John.Dean@northumbria.ac.uk