VELVET: an enclosure vegetation system to measure BVOC emission fingerprints in temperate and tropical climates
 Manon Rocco1,2*†
  Etienne Brugere1
  Olivier Magand3
  Agnes Borbon1
  Aurelie Colomb1 Laetitia Bouvier4 Jean-Luc Baray4 Valentin Duflot2 Mickael Ribeiro1
  David Picard5 Jean-Marc Metzger3 Pierre Stamenoff3 Yoan Benoit3
  Claudine Ah-Peng6
- 1Laboratoire de Météorologie Physique (LaMP), UMR 6016, CNRS, Université Clermont Auvergne, Aubière, France
- 2Laboratoire de l’Atmosphère et des Cyclones, UMR 8105, CNRS, Université de La Réunion, Saint-Denis, France
- 3Observatoire des Sciences de l‘Univers de La Réunion (OSU-Réunion), UAR 3365, Université de La Réunion, CNRS, Météo France, IRD, Saint-Denis, France
- 4Observatoire de Physique du Globe de Clermont, OPGC, CNRS, Aubière, France
- 5Laboratoire de Physique de Clermont Auvergne (LPCA), UMR6533, CNRS, Aubière, France
- 6UMR PVBMT, Université de La Réunion, Saint-Pierre, France
The VELVET chamber, utilizing the vegetation enclosure technique, was used to measure biogenic volatile organic compound (BVOC) emissions from representative plant leaves in temperate and tropical climates. This study demonstrates the instrument’s capability, among the various measurements conducted in other studies using the vegetation enclosure technique, in qualifying and quantifying volatile organic compound (VOC) emissions from different tree species. The measurements were performed using Tenax tubes for sampling and GC/MS analysis. The use of PTR-ToF-MS for temperate species allows us to perform flux measurements in the chamber of Norway spruce (Picea abies), European beech (Fagus sylvatica), and common hazel tree (Corylus avellana) in the Puy de Dôme region (France). We found that all species are monoterpene emitters (on average 1.52 ± 0.29 ng m−2 s−1) and more particularly sesquiterpene emitters for C. avellana (7.49 ± 0.70 ng m−2 s−1). In the tropical region of Réunion Island (France), comprehensive measurements were conducted across three distinct vegetation types, on 10 of the most representative species, native and exotic to the island. The study revealed that emissions from these species were influenced by spatial variability, their environment, and the type of the forest (cloud forest, and high- and low-altitude forests). Notably, the research marked a groundbreaking achievement by capturing emissions from endemic species on the island for the first time. The collected data will be added to the biogenic emission inventory of the island, thereby enhancing model simulations by incorporating these new measurements.
1 Introduction
Volatile organic compounds (VOCs) are at trace levels in the atmosphere, but they significantly contribute to the atmospheric oxidative capacity by the production of secondary pollutants such as tropospheric ozone or secondary organic aerosols (SOAs) (Fehsenfeld et al., 1992). VOCs can be emitted by both anthropogenic and biogenic ways. Global biogenic VOC (BVOC) emission is approximately 760 Tg (C) yr−1, consisting of isoprene (70%), monoterpenes (11%), methanol (6%), acetone (3%), sesquiterpenes (2.5%), and other BVOC species, each contributing less than 2% (Sindelarova et al., 2014; 2022). More than 90% of VOCs are emitted from biogenic areas and called BVOCs (Guenther, 2013), with more than 70% being emitted by tropical forests (Kesselmeier et al., 2000; Greenberg et al., 2004; Hanif et al., 2021). These compounds are crucial in the chemical tropospheric processes and can impact the climate. Indeed, they are leaders in the secondary components such as SOAs or tropospheric ozone. Due to their high reactivity, they have a great impact on hydroxyl radical (OH⋅) (Poisson et al., 2000), tropospheric ozone (Pfister et al., 2008), and on the secondary formation of compounds. This induces a notable impact on the oxidative capacity of the atmosphere at the regional and worldwide scale (Houweling et al., 1998; Taraborrelli et al., 2012). Other studies showed that BVOCs are great producers of SOAs (Fehsenfeld et al., 1992; Laothawornkitkul et al., 2009; Schneider et al., 2019), regarding anthropogenic emissions (Tsigaridis and Kanakidou, 2003). BVOCs show temporal and spatial variations regarding vegetation, plant species, or environmental factors such as temperature, solar radiation, or air pollution (Kesselmeier and Staudt, 1999).
Numerous studies (listed in Ortega and Helmig, 2008; Niinemets et al., 2011 and more recently Zeng et al., 2022) have been completed on BVOC emissions based on measurements using different vegetation enclosure systems such as Teflon bags, leaf cuvette, and glass chamber. These in situ measurements contribute to implement existing emission databases (Sindelarova et al., 2022 and references therein, MEGAN; Guenther et al., 2012), which are used for modeling exercises.
Currently, it is challenging to precisely determine estimates of BVOC emissions through observations, primarily due to the significant temporal and geographic fluctuations in their fluxes and more particularly in tropical regions (Wang et al., 2023). Then, the global estimation of BVOC emissions stays uncertain. In temperate forests, such as those in Europe or France, few studies have been completed since Staudt et al. (2003) and Genard-Zielinski et al. (2015) determined oak (Quercus ilex and Quercus pubescens) BVOC emission measurements and Moukhtar et al. (2005), silver fir (Abies alba) measurements. More details are provided in Gros et al. (2022) who performed a review on BVOC emissions in the Mediterranean Basin from the branch to the canopy level. More recently, Staudt and Visnadi, (2023) showed isoprene and monoterpene emissions of kermes oak (Quercus coccifera L.) in the French Mediterranean Basin. The study found that mean monoterpene (MT) emissions from populations differed significantly in their composition of structural and chiral isomers, suggesting that the chemical fingerprint of the air over the oak populations may vary depending on the prevalence of different chemotypes. For holm oak (Quercus ilex), it was recognized that monoterpene emissions are controlled by light-dependent mechanisms (Tollsten and Müller, 1996; Dindorf et al., 2005), as well as for the European beech (Fagus sylvatica). Van Meeningen et al. (2016) and Van Meeningen et al. (2017) showed BVOC emissions of European beech (F. sylvatica), Norway spruce (Picea abies), and English oak (Quercus robus) and the dependence of light to isoprene, α-pinene, 3-carene, eucalyptol, and sabinene emissions, regarding the species. These compounds showed an increasing emission response with increasing light intensity. They show that English oak contributes between 92% and 97% of the total BVOC emissions, and all tree species emit the compounds α-pinene, camphene, 3-carene, limonene, and eucalyptol. Sabinene and limonene for European beeches ranged from 30.5% to 40.5%. Norway spruce contributes between 25% and 45% of monoterpene emissions in the forests (Ghirardo et al., 2010). These studies highlight that BVOC emissions are dependent on climatic variables such as temperature and light on emission intensities.
Due to high emissions from tropical forests and their importance in the climate (Artaxo et al., 2022), it is crucial to characterize and specify VOCs emitted by the species present in majority in these forests. Similar to the temperate climate species, the VOC emissions from tropical species are light- and temperature-dependent (Zeng et al., 2023). Mu et al. (2022) highlighted that isoprene is the main compound emitted by tropical forests with 76.1% in Brazil, 73.5% in India, 58.3% in China, and 53.8% in the Republic of South Africa. Tropical forests are also monoterpene emitters with fluxes of 1.2 ± 0.1 mg m-2 h−1 measured in the Amazon Basin (Karl et al., 2007). Yáñez-Serrano et al. (2018) showed a speciation of the chemical composition between day and night in the Amazon canopy and reactivity calculation to unravel the role of monoterpenes in the oxidative atmospheric capacity. The reactivity calculations revealed that a greater abundance of a monoterpene species does not necessarily correspond to higher reactivity. This is because the most abundant compounds may not be the most chemically relevant in the atmosphere, and the relative contribution of different monoterpenes may vary over time. Direct emissions of monoterpenes, sesquiterpenes, and green leaf volatiles (GLVs) were studied with species from Brazil and their relationship with ozone stress (Moura et al., 2022), showing that a link exists between the strategies employed by species to protect against oxidative stress and the quality and quantity of emitted BVOCs.
Minimizing uncertainties in estimates of BVOC emissions necessitates further observations (Guenther, 2013). Conducting leaf-level enclosure measurements is essential to enhance our understanding of the processes influencing variations in emissions. Additionally, tower and aircraft-based flux measurements above the canopy are required to quantify BVOC diversity at landscape to regional scales. Furthermore, the recent use of satellite data aims to provide tendencies and variability of BVOC emissions in the atmosphere (Bauwens et al., 2022) and can be useful for flux measurements.
Ortega and Helmig, (2008) presented different approaches and enclosure types to perform and quantify BVOC emissions. Teflon bags, leaf cuvettes, or glass chambers are commonly used in the field due to their cost-effectiveness and ease of transport. We aim, using the same instrument, to understand the BVOC emissions from species located in temperate and tropical climates. To this end, a vegetation enclosure technique was developed and used at two sites to characterize the BVOCs from various species. First, the VELVET (VOC experiments on leaves with the vegetation enclosure technique) chamber was initially employed in trial experiments within the Puy de Dôme forest (France) in the aim to proceed to a technical evaluation of the chamber with the study of the capabilities of the system to qualify and quantify VOCs. Well-known and previously studied species were selected, including Norway spruce (P. abies), European beech (F. sylvatica), and common hazel tree (Corylus avellana). Measurements were performed by PTR-ToF-MS and speciated with sorbent tubes. Then, for the first time, emissions in the tropical forests in Réunion Island have been untangled by the measurement of endemic and exotic species in various tropical forests (Plaine des Fougères, PLF; Maïdo observatory, OPAR-Maïdo, and Mare-Longue Forest, MLF). It is the first time that VOC emissions from species from the Réunion Island are estimated. Using this technique, we conducted measurements under controlled air flow (zero air) and under natural environmental conditions (natural sunlight exposure and laboratory temperature, ∼20°C).
A better estimation of BVOC emissions could improve the already established emission registers to make them more accurate for use in modeling exercises. Furthermore, understanding the chemical processes involved in the SOA and cloud formation could help understand the chemical processes and their role in the oxidative atmospheric capacity. This study offers initial insights into the potential emissions footprint of diverse species and serves as a preliminary step for future field measurements with this enclosure system.
2 Material and methods
2.1 Vegetation enclosure technique and flux and emission rate calculation: VELVET
The chamber is composed of a 25 × 25 × 30-cm glass tank (Figure 1), covered by a Teflon plate. The VELVET chamber performs VOC emission measurements at the branch scale (including leaves). Branch analysis via the enclosure technique allows in increasing the biomass and VOC concentration measured inside the chamber. Leaks were prevented by a Teflon seal. The chamber is equipped with several outlets to allow multiple inlets for instrument samplings. During our measurement, only two inlets were used: one for flushing air and the other for sampling; the other inlets were sealed by a Teflon plug. Zero air was continuously pushed into the chamber at an inlet flow rate of 5 L/min through a 50-cm long PFA tube at laboratory pressure, with temperature and humidity regulated at 25°C and 50%, respectively. The zero air was generated using a filter consisting of Purafil for nitrogen monoxide removal; charcoal scrubber for ozone, nitrogen oxide, and VOC removal; and silica gel or drierite for water removal.
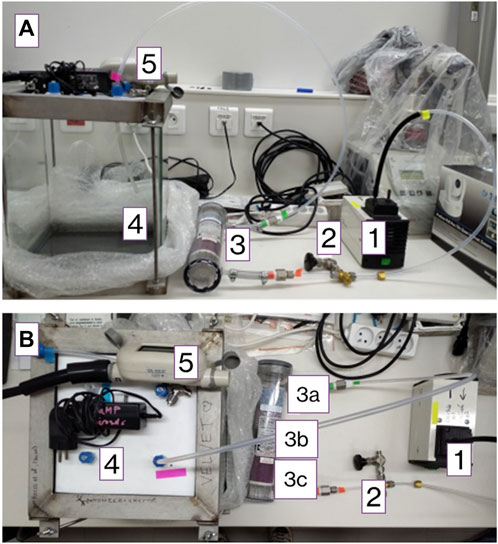
Figure 1. Side view (A) and bottom view (B) of the VELVET chamber. 1. Pump (14 L/min), 2. valve, and 3. filter; a) drierite or silica gel, b) charcoal, c) Purafil; 4. glass chamber, and 5. flowmeter.
Blank measurement was taken before each chamber measurement. Once the spawning was done, selected species were placed in the chamber. The selected species is a part of a tree branchlet, visually chosen without damage/marks (virus, sickness, etc.) or sign of parasites (herbivory, presence of arthropods, etc.) and placed in water and cut back to avoid embolism and plant stress (Fall et al., 1999; Helmig et al., 1999). Plants were placed in a cooler for transport at the laboratory (maximal transport time of 30 min), and their VOC emissions were directly analyzed. Once a steady state was reached (∼15 min, Ortega and Helmig, 2008), air was sampled on cartridges filled by the Tenax adsorbent (Tenax TA 60–80 mesh, 250 mg) for 40 min at 100 mL min−1 and/or by PTR-ToF-MS. The steady state is the time calculated in relation to the chamber dimensions and the inlet flow rate to achieve a well-mixed VOC concentration between the fluxed air and the emissions. After sampling, the branches including leaves were dried at 65°C until a consistent weight is achieved (∼24 h), as suggested in Ortega and Helmig (2008), and weighted (balance Bioblock Scientific, LB-300, precision = 0.01 g).
Emission rates (ERs) for each species are calculated with the following equation Ortega and Helmig (2008):
where Cspecies and Cblank are the VOC concentrations for the species and blank chamber concentrations (in ng/L), respectively; Q is the inlet flow rate inside the chamber (=5 L/min), and mdry is the dry mass of enclosed leaves (gDW). This calculation is used for emission calculation from the leaves using a blank in the sorbent tube.
For measurement at Puy de Dôme in 2021, we used flux calculation as
where CBVOC and Cblank are concentrations in ng/L during the measurement of the species and the blank measurement, respectively; Q is the flow rate inside the chamber (=5 L/min); and A is the area of the bottom of the chamber in m2.
Supplementary Appendix SA presents the percentages of blank samples in comparison with the concentration values.
During PTR-ToF-MS measurements, the VELVET chamber has two outlets used for the VOC measurements: one for online measurements with a PTR-ToF-MS (PTR-ToF 6000 X2, IONICON Analytik GmbH, Innsbruck, Austria), inspired by previous studies like Jordan et al. (2009), which allows a fast acquisition of a high-resolution mass spectrum and one for a posteriori analysis with adsorption tubes (Tenax).
2.2 Analysis with GC/MS and PTR-MS
2.2.1 GC/MS parameters
Sorbent tubes (Tenax TA, 250 mg, 60–80 mesh, O.D. x L. 1/4 in. x 3 1/2 in.) are desorbed using an auto-sampler thermal desorber (TurboMatrix 650 ATD, PerkinElmer, Waltham, MA) and analyzed using a gas chromatography and mass spectrometry instrument (Clarus 600, PerkinElmer, Waltham, MA). The ATD system performed desorption of tubes at 40 mL/min for 15 min at 270°C, followed by a thermal flash from −30°C to 270°C, maintaining the temperature at 270°C for 5 min without split. Two reference solutions are used for monoterpene measurements from the cannabis terpene kit standard (100 μg/mL in methanol provided by SPEX CertiPrep, Rickmansworth, United Kingdom). Forty-one compounds (monoterpenes and sesquiterpenes mixed) are present in the kit. Furthermore, a gas standard composed of isoprene, toluene, benzene, and xylenes is analyzed from the National Physical Laboratory (NPL) standard bottle. The standard concentration limit of detection (LOD) values can be visualized in Supplementary Table S1 and is calculated, as indicated in the supplementary. The analysis method includes the following steps: the column temperature was maintained at 35°C for 5°min, increased at 5°C/min to 160°C, and then increased at 45°C/min to 270°C, where it was maintained for 5 min. Approximately 30 compounds were identified for these measurements and are listed in Supplementary Table S1. Uncertainties of concentrations (in pptv) for a species i were calculated using the following equation:
where u2 (volumei)/volumei2: total absolute uncertainty on the sampled volume in the Tenqx tube; u2 (standardi)/standardi2: total absolute uncertainty on the standards; u2 (Ai sampled)/Ai sampled2: total absolute uncertainty on the area measurement. Detailed calculation is provided in the Supplementary Material.
2.2.2 PTR-ToF-MS parameters
The PTR-MS technique has been used and optimized for VOC measurements for over two decades and described elsewhere (Lindinger and Jordan, 1998; Sekimoto et al., 2017; Yuan et al., 2017). PTR-ToF-MS (IONICON X6000) was operated in the H3O+ mode at 1 Hz with an electric field strength (E/N) of 101.36 ± 0.11 Td (1 Townsend = 10–17 V cm−2 mol−1). To obtain these standard drift tube conditions, the drift tube pressure was maintained at 2.590 ± 0.001 mbar and at a temperature of 119.96°C ± 0.24°C with a drift voltage E of 450.86 V. The extraction time rate of the ions inside the ToF part was fixed at 5.0 µs and the maximum time of flight at 32.0 µs, which allows the measurement of the mass spectrum between m/z 2 and m/z 475. During the experiment, we focused on compounds known to be emitted by plants and, in particular, the ones identified as pathways and catabolite markers (Fitzky et al., 2021). The list of 21 compounds and their respective sensitivities (ncps/ppbv) are listed below in Table 1. The background signal of the instrument was determined before and after each experiment with zero air provided by a HPZAG catalyst device and subtracted to the ambient signal for quantification.
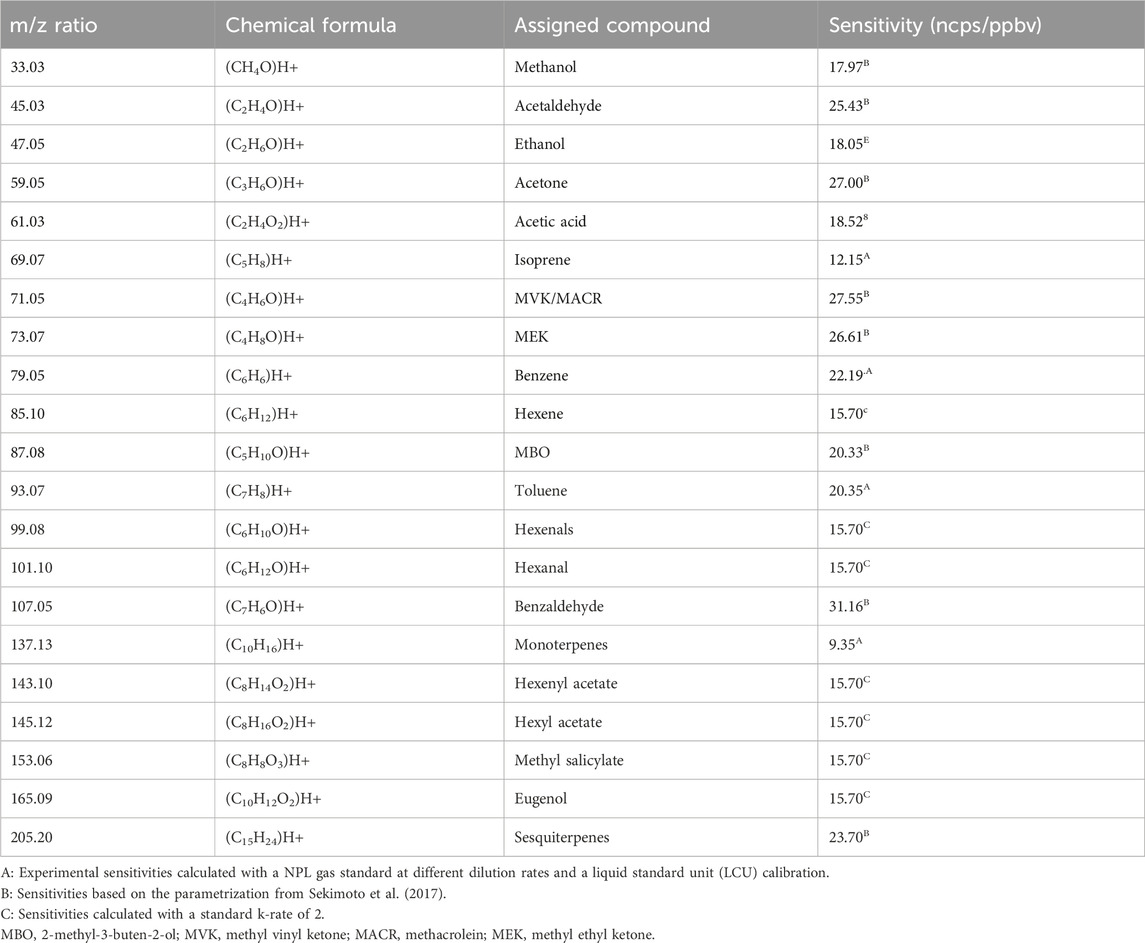
Table 1. Compounds measured via PTR-ToF-MS and their sensitivities in ncps/ppbv.
As mentioned above, a gas standard from the National Physical Laboratory (NPL; 4 ppb ±5%, Supplementary Table S1) was used to determine the experimental sensitivities of the instrument. The gas standard was diluted using a liquid standard unit (LCU) with the HPZAG catalyst device mentioned earlier to perform a multiple point calibration with concentrations between 0.5 and 12 ppb; R2 > 0.99 were determined. However, all the sensitivities cannot be obtained for all the target compounds. Indeed, due to the large number of VOCs that are identified and measured, there are no gaseous standards covering all the VOC spectra. Thus, alternative methods were used for the other VOCs. The one used in this study is based on the work of Sekimoto et al. (2017). A linear relationship between the experimental sensitivities from the gas standard and the ion molecule reaction rate constant (k-rate) of the compounds is obtained (slope of 7.85 with a confidence interval of 95%). For a large number of compounds, the k-rate constant is reported in the literature (Zhao and Zhang, 2004; Cappellin et al., 2012). For other compounds detected with the unknown k-rate, a value of 2 was chosen as a default value. The LOD was also determined for the standard gaseous compounds, following de Gouw and Warneke (2007), based on the ion per second of the background signal and the unnormalized sensitivity. LOD lies from 24 ppt (m/z 133.026) to 670 ppt (m/z 371.102). The range of uncertainties is 11%–16% except for m/z 47.049 (26%). The QA/QC of PTR-MS follows the Aerosol Cloud and Trace Gases Research Infrastructure (ACTRIS) recommendations (WP3, NA3, deliverable 3.20).
The software ioniTOF of IONICON was used for data acquisition and for controlling the different instrumental parameters during the experiment. Different steps are used for data processing. First, we controlled the quality of the peak integration and any drift in the “timebin-masses” relationship. Then, the PTR-MS viewer (IONICON v. 3.4) was used. Finally, the data were quantified using Igor Pro v 6.37 and RStudio.
2.3 Sampling site description and measurement periods
2.3.1 Temperate climate species
The Puy de Dôme station (PUY, 45.77°N, 2.96°E, 1,465 m a.s.l.) is a high-altitude station of the instrumented site CO-PDD (Cézeaux-Aulnat Opme Puy de Dôme, Baray et al., 2020). Regular measurements of atmospheric composition are performed there in the long term for the study and monitoring of the climate and atmospheric composition in the framework of the Global Atmosphere Watch (GAW) network and of the European Research Infrastructure ACTRIS, respectively.
Samples were collected in the forest downstream of the Puy de Dôme station (PUY) during summer (July 2020 and 2021) into the forest (Figure 2). The first sampling was performed at point 1 near the Col de Ceyssat, and the second sampling (2 on the map) was performed near the PUY train station.
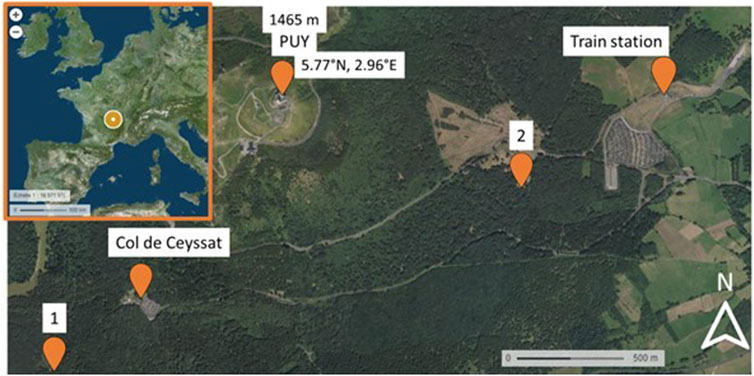
Figure 2. Map of the Puy de Dôme region and localization of the PUY station and the two sampling sites (1 and 2).
Measurements in the vegetation enclosure system were performed on three species of trees: European beech tree (F. sylvatica L., n = 1), common hazel tree (C. avellana L., n = 1), and Norway spruce (P. abies L., n = 1) branches. These species are important components of Puy de Dôme inventory, 2010 vegetation with a frequency of 58%, 75%, and 27%, respectively (Inventaire-forestier-national, 2010); their emissions have been previously investigated in other research endeavors (see Section 3). These species are, therefore, good candidates to evaluate the capacities of VELVET in qualifying and quantifying BVOC emissions and to compare to the literature. The temperature inside the laboratory room was fixed at ∼20°C ± 1°C.
2.3.2 Tropical species in La Réunion Island, VELVET-RUN project
Reunion Island is constituted of almost 40% of tropical forest (managed by the Office National des Forêts, ONF) and has an original flora comprising 835 native vascular plant species, of which 28.0% are strictly endemic to the island and 18.6% are regional endemics (Ah-Peng et al., 2010; Boullet and Picot, 2012). Reunion Island is often considered an open-air laboratory for the atmospheric studies (FARCE, BIO-MAIDO campaign, for example) and favorable for multi-disciplinary projects (ocean–vegetation–atmosphere interactions–geosphere) on the critical zone. During the OCTAVE in 2018 (BR/175/A2/OCTAVE) and BIO-MAIDO in 2019 (ANR-18-CE01-0013) campaigns, first studies of atmospheric composition have been performed in different places on the island: Mare-Longue and Bélouve forests, at the Observatoire de Physique de l’Atmosphère or OPAR-Maïdo (Duflot et al., 2019; Rocco et al., 2020; Rocco et al., 2022; Verreyken et al., 2021). First ambient measures of BVOC were performed during the FARCE campaign in 2015 (Duflot et al., 2019). Measurements and sampling were carried out at the Maïdo observatory, in the native Acacia heterophylla (Lam.) Willd. forest, Cryptomeria japonica (L.f.) D. Don planted forest and primary cloud forest (Bélouve forest), and lowland Mare-Longue Forest on a 10-m mast by sampling with adsorbent cartridges. This study showed high ambient concentrations of emitted isoprene in the Mare-Longue, Bélouve, and A. heterophylla forests (>50 pptv). In 2019, the BIO-MAÏDO campaign enabled transects to be carried out in order to understand the distribution of VOCs on the slopes of OPAR-Maïdo, which presents a diversified subalpine vegetation (Strasberg et al., 2005). These measurements made it possible to acquire an ambient VOC profile for the whole island. However, these studies did not take into account the VOC directly emitted by the plants in each site. In other words, this does not allow the assessment of the specific chemical signature (i.e., speciation of VOCs at emission) for each plant species present on site.
In the continuity of these measurements, with the VELVET-RUN project, we performed the measurement of BVOC emissions from dominant species (endemic and exotic) in the forests of La Réunion in order to characterize their chemical signature and utilize them in emission registries, thereby enabling a better modeling of VOC emissions in the atmosphere. For this purpose, we performed measurements with the VELVET chamber on native and exotic species (Table 2).
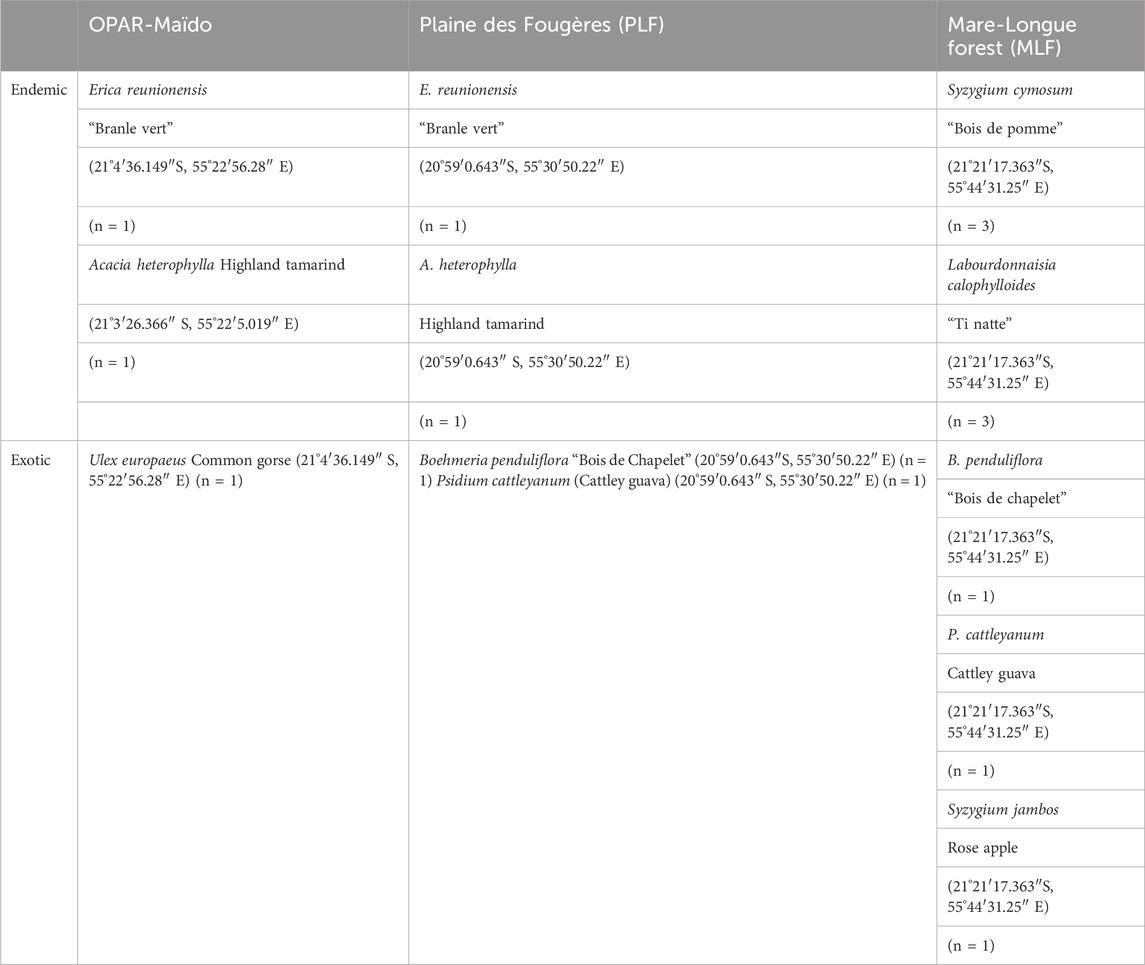
Table 2. List of species sampled and their location during the VELVET-RUN project. n = number of replicates.
At the first stage, we performed the characterization of the signature of plant species for three different habitats (Figure 3) in the lowland forest (Mare-Longue Forest, MLF), cloud forest (Plaine des Fougères, PLF), and subalpine vegetation at the OPAR-Maïdo site in May 2022 (Table 2). Then, we characterized the endemic species of Reunion Island within a single plot in the lowland forest through intra-species comparisons (n = 3 replicates) to validate emission measurements for Labourdonnaisia calophylloides Bojer and Syzygium cymosum Lam. DC.
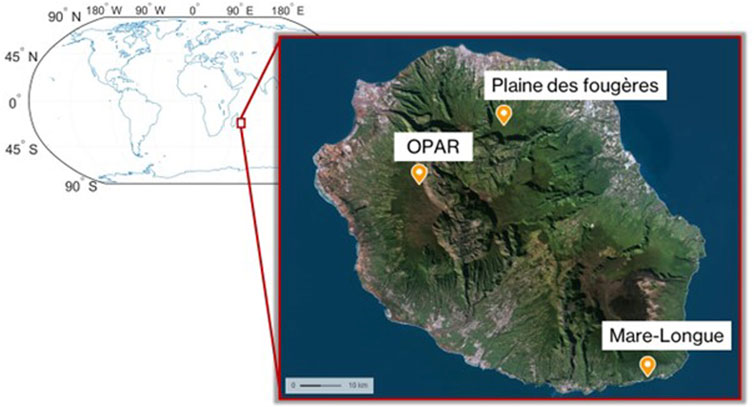
Figure 3. Reunion Island map with the different forest sites.
During chamber measurements, the temperature and humidity (MadgeTech sensors, Warner, United States) varied from 24.3°C to 26.4°C and 66%–86% in the chamber in MLF, 22.1°C–23.4°C and 56%–89% in the chamber in PLF, and 20.8°C to 22.9°C and 63%–83% in the chamber at OPAR-Maïdo.
3 Results and discussion
3.1 Trial experiments on leaf emissions from temperate climate species (Puy de Dôme)
3.1.1 On-line emissions
Figure 4 shows the evolution of the concentration measured with the PTR MS and cartridge sampling for all the species. The average concentration during blank and TENAX tube sampling is presented in Supplementary Table S3. There are three kinds of evolution in the concentration: stabilized, growing, and decreasing concentrations. During measurement, we show that isoprene and monoterpene concentrations are decreasing, indicating that there are no high emissions from plants of these species. During the measurement in the chamber, the isoprene concentrations are stable after 10 min for P. abies and F. sylvatica. The monoterpene concentration decreases with time except for P. abies where a peak is observed at 10 min. This species is not considered monoterpene emitters.
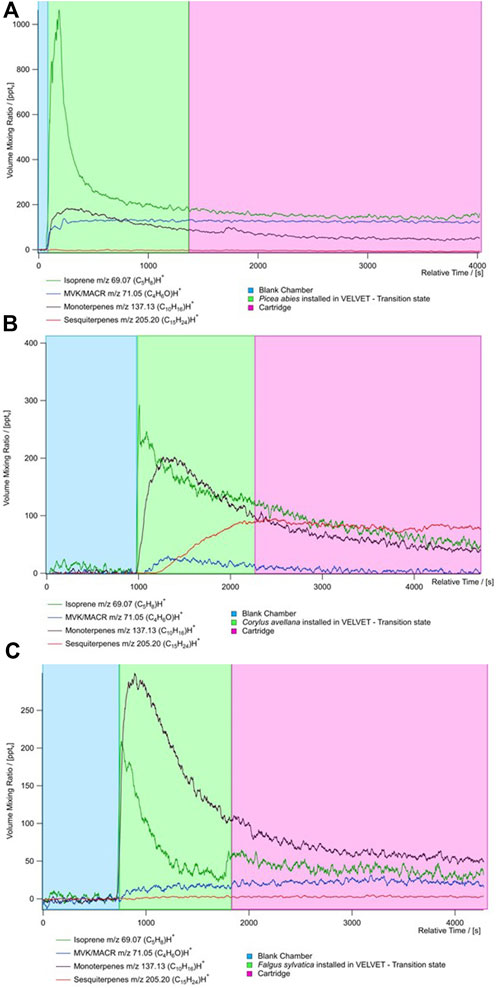
Figure 4. Time series of the concentration of principal BVOCs (isoprene (dark green), MACR + MVK (blue), monoterpenes (black), and sesquiterpenes (red) from PTR-ToF-MS measurements for the three species (A) Picea abies, (B) Corylus avellana, and (C) Fagus sylvatica. The time series is divided by the type of measure realized during the sampling: blue represents the blank chamber, green represents the species put in the chamber, and red represents the measure of the cartridge.
High isoprene concentrations have been recorded for all species with an average 301 ± 36 pptv (Figure 5). Furthermore, high concentrations of MACR + MCK (up to 422 ± 37 pptv) have been measured, showing that oxidation processes occur from isoprene in the chamber. These concentrations could result from the high oxidation of isoprene in the chamber by the OH radical. Higher concentrations of sesquiterpenes are shown for C. avellana (211 ± 24 pptv). High total BVOC concentrations have been measured for the species C. avellana with concentrations up to 400 pptv, 42 pptv, and 100 pptv for isoprene, MACK + MVK, and monoterpenes, respectively. The high proportion of acetaldehyde and methanol (52% and 33%) has been measured for C. avellana (Supplementary Figure S1). The species with a large panel of VOC is F. sylvatica, for which high proportions of methanol and butyl have been recorded (20% and 50%, respectively). Similar to F. sylvatica, P. abies shows great proportions of butyl (74%). Butyl is a GLV and a signature of drought and herbivory stress emissions (Copolovici et al., 2014). Additional GLVs are detected in our measurements, including hexanal and methyl salicylate, but they are present in low concentrations (<2%, see Supplementary Figure S1). This implies that the emission of butyl compounds is likely originated from a different pathway.
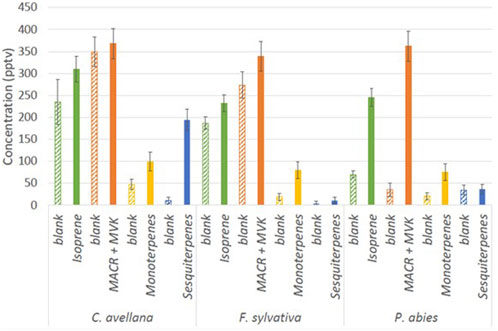
Figure 5. Concentration (pptv) during blank measurements in the chamber (hatched bars) and during the cartridge sampling of isoprene (m69.070), MACR + MVK (m71.049), monoterpenes (m137.132), and sesquiterpenes (m205.195) measured by the PTR-ToF-MS.
Similar proportions are visualized between P. abies and F. sylvatica, except for concentrations that are less important for P. abies than F. sylvatica and acetone proportion higher than F. sylvatica. This result is in concordance with the VOC emission rates (%) of Fitzky et al. (2021) for F. sylvatica with a methanol emission of of 0.061 ± 0.111 nmol m−2 s−1 (or 2.02 ± 0.33 ng m−2 s−1). Fluxes of monoterpenes in Fitzky et al. (2021) have been estimated to be 0.390 ± 0.359 nmol m−2 s−1 (or 53.04 ± 48.82 ng m−2 s−1). Fitzky et al. (2023) showed emissions from F. sylvatica within control and stress conditions. They find fluxes of 0.42 ± 0.27 ng m−2 s−1, 0.07 ± 0.07 ng m−2 s−1, 62.12 ± 50.61 ng m−2 s−1, and 2.46 ± 2.26 ng m−2 s−1 for isoprene, MACR + MVK, monoterpenes, and sesquiterpenes, respectively. Fluxes from PTR-ToF-MS were calculated as Eq. 2 and shown in Table 3. Our fluxes of F. sylvatica are in line with this study for isoprene and sesquiterpene concentrations (0.62 ± 0.07 ng m−2 s−1 and 0.28 ± 0.06 ng m−2 s−1). Our estimation of monoterpene fluxes is less significant with a flux of 1.65 ± 0.31 ng m−2 s−1. Furthermore, higher fluxes have been estimated for MACR + MVK compounds in our study (0.91 ± 0.042 ng m−2 s−1).
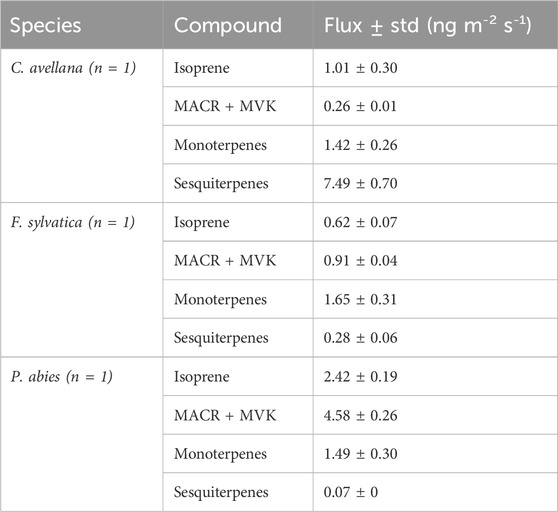
Table 3. Fluxes derived from the PTR-ToF-MS measurements for the species at Puy de Dôme. n = number of replicates.
Our estimation fluxes for P. abies are higher for isoprene flux than the estimation from bark fluxes (Jaakkola et al., 2023). However, they estimate fluxes eight times higher for monoterpene fluxes and ∼3 times for sesquiterpene fluxes (8.06 ± 14.17 ng m−2 s−1 and 0.58 ± 0.89 ng m−2 s−1, respectively). The flux of monoterpenes under stress conditions during infested periods increases by 6,500%–22,400%. Spruce fluxes are important due to their contribution to the SOA formation in the atmosphere (Furnell et al., 2023).
Processes of emissions at the leave or at the bark are different and imply that the emissions are not similar. Furthermore, the measurement conditions are not similar and are individual tree-dependent.
Although our measurements are in line and complement those previously conducted in other studies, they require additional replicates. Moreover, additional measurements without inducing additional stress (such as cut branches) are necessary.
3.1.2 Speciation of BVOC measured by GC/MS
In this section, we will look at the speciation of the VOC according to the tree species studied and their ER. First, Figure 6 shows the distribution of VOCs according to the three species measured in the chamber in 2020. Two rather identical profiles can be seen: P. abies and C. avellana. These two species have a higher proportion of limonene, α-pinene, and camphene. Beech tree (F. sylvatica) has a very different profile. A majority of sabinene and isoprene are measured for this species (920 ± 377 pptv and 115 ± 47 pptv, respectively). These profiles are different from what was measured in the forest environment where the dominant compound was isoprene (Supplementary Figure S2). Some external parameters, such as solar radiation, are not well-reproduced in the chamber as we use normal light inside the laboratory during the experiments (PAR = ∼50 μmol m−2 s−1). This could explain the difference in the proportion between the measurements in the chamber and real conditions. In these cases, the isoprene and monoterpene concentrations are underestimated compared to its real emissions by a ratio of ∼20 (Zeng et al., 2023).
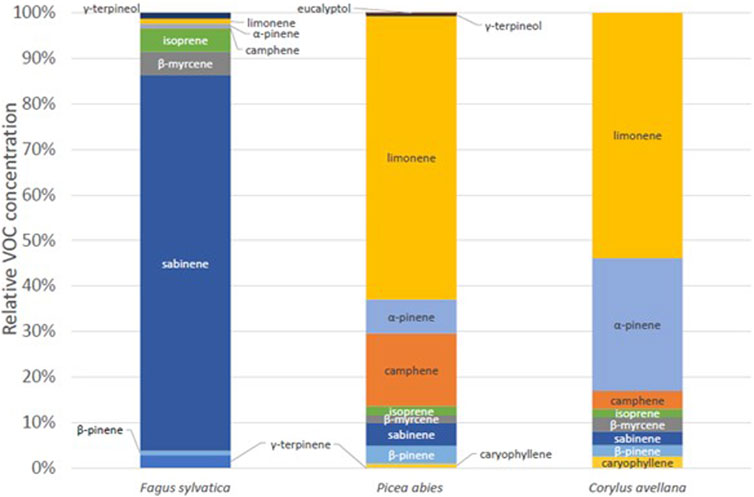
Figure 6. Relative VOC concentration for European beech tree (Fagus sylvatica), spruce tree (P. abies), and common hazel tree (C. avellana), in Puy de Dôme.
Discrepancies in the concentrations of isoprene, total of monoterpenes, and the sum of sesquiterpenes between the 2020 and 2021 measurements are illustrated in Supplementary Figure S3. We can see a range of 74% to 15,000% for isoprene, sum of monoterpenes, and sesquiterpenes. These variations are associated with distinct environmental conditions during the measurements.
Second, Table 4 shows the ER for isoprene and the sum of monoterpenes. The ER for the second series of measurements was calculated only for isoprene, sum of monoterpenes, and sum of sesquiterpenes as we did not perform a sorbent tube blank for individual monoterpenes (Supplementary Appendix SA). All ERs are summarized in Supplementary Table S4. According to our measurements, a higher ER is observed for the sum of terpenes. Isoprene is not the most emitted compound in the chamber. Many terpenes were measured in the speciation principle of BVOCs emitted by the selected species.
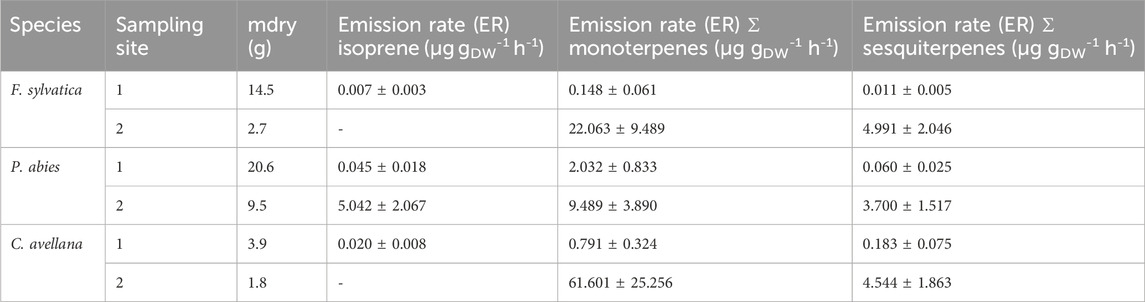
Table 4. Emission rates of isoprene and the sum of monoterpenes in μg gDW-1 h-1 calculated for measurements in 2020 and 2021 (Puy de Dôme).
We would like to remind that the ER calculation results from concentrations measured in the chamber during blank and species measurements. Then, ERs are dependent on the species and can vary significantly and may be attributed, as suggested by previous studies (Niinemets et al., 2010; van Meeningen et al., 2017, and references therein), to differences in the species’ environment, acclimation, or both local climate and genetic diversity that can impact observed emission patterns. This can explain the differences encountered between our measurements and the literature values.
3.1.2.1 Norway spruce (Picea abies) emissions
Supplementary Figure S4 shows the majority concentrations of this species measured in the chamber in 2020. A high concentration of limonene can be seen, reaching up to 96 ± 39 ppb. The second most prevalent species was camphene with a concentration of approximately 25 ± 11 ppb. This compound was not especially emitted in the measurements found in the literature with a contribution of 6.8% ± 1.2% of total monoterpenes (Bourtsoukidis et al., 2014) as they report higher percentages of β-pinene, α-pinene, and limonene. The origin of these compounds is, therefore, either due to emission by the plant or contamination by the cartridge. Measurements of blank samples in the chamber (refer to Supplementary Appendix SA) demonstrate that blank concentrations do not exceed the concentrations measured during the sampling of the species. Then, the measured emissions are from our species and are dependent on the conditions in the chamber that induces various processes of emissions.
We measured isoprene ER for P. abies between 0.045 and 7.226 µg gDW-1 h-1 (Table 5), and monoterpene sum ER was 2.265 ± 0.833 μg gDW-1 h-1 (Table 4). The values found in this measurement are in the range of isoprene ER reported in the literature. Indeed, Kempf et al. (1996), Grabmer et al. (2006), and Kesselmeier and Staudt (1999) measured ER for this species and estimated values between 0.34 and 1.80 μg gDW-1 h-1 for isoprene emissions and between 0.20 and 7.18 μg gDW-1 h-1 for emissions of the sum of the monoterpenes that are in line with our measurements. The two major compounds measured by Kempf et al. (1996) were limonene and α-pinene with ERs of 0.83 and 0.85 μg gDW-1 h-1. The ERs calculated from our chamber measurements for these compounds are 1.405 ± 0.576 μg gDW-1 h-1 and 0.168 ± 0.069 μg gDW-1 h-1, respectively, for 2020. Van Meeningen et al. (2017) reported the ER range between 0 and 1.2 μg gDW-1 h-1 for Norway spruce with the most emitted compound of camphene with no photosynthetical active radiation (PAR) and α-pinene with increased PAR for late spruce. The most recent study (Bourtsoudikis et al., 2014; Thomas et al., 2023) showed that ERs for P. abies are very low with an ER value of 0.1–0.4 × 10⁻³ μg gDW−1 h−1.
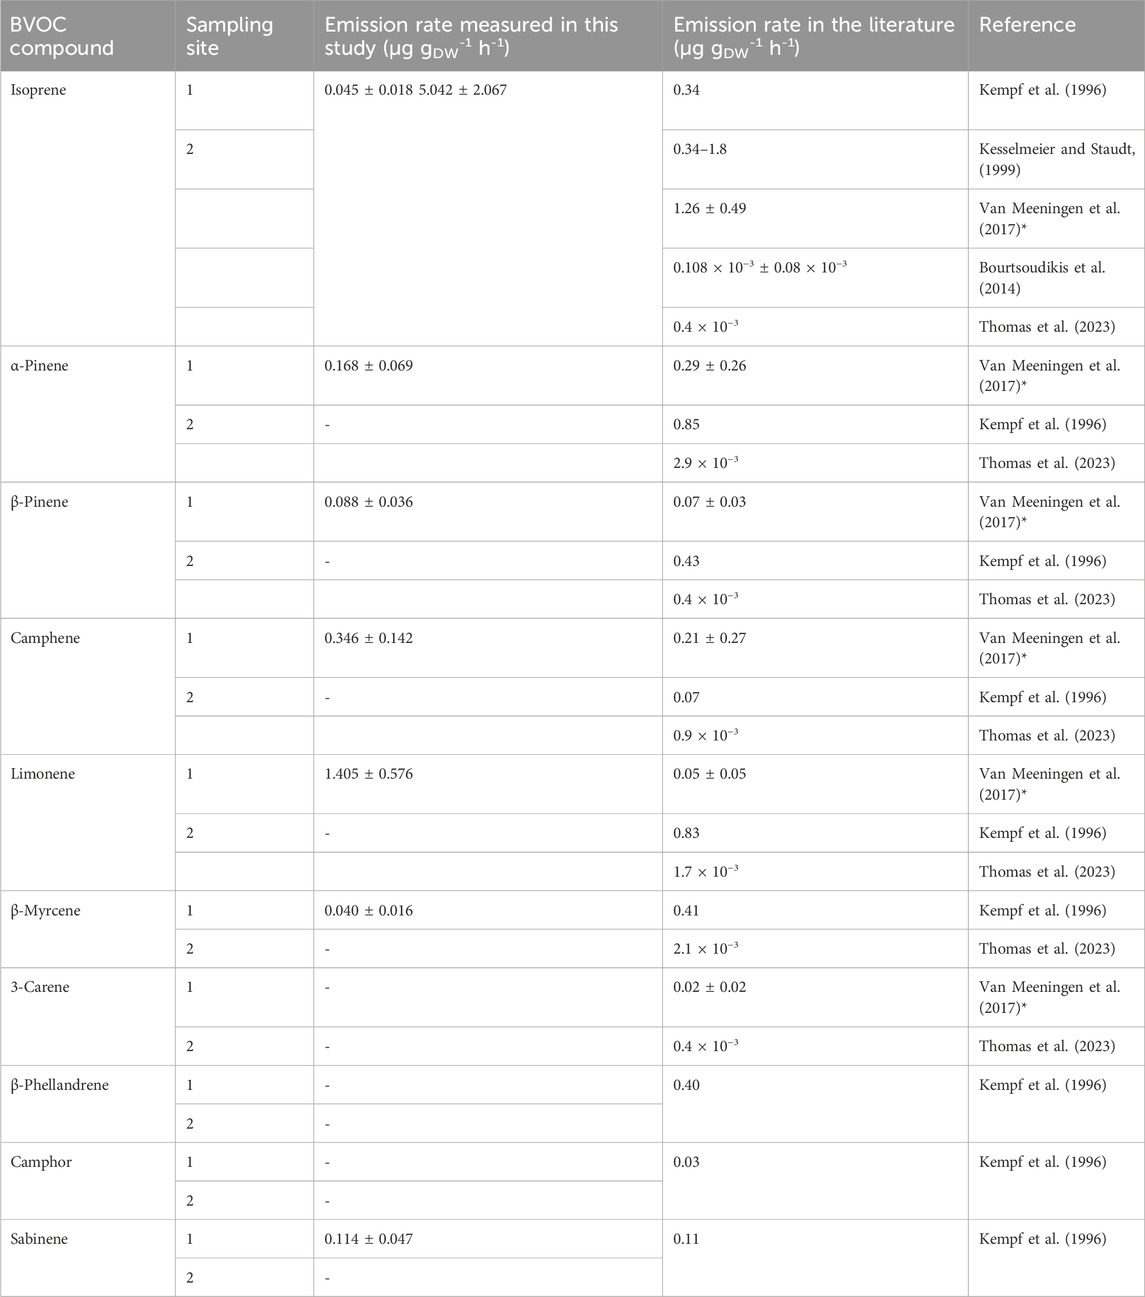
Table 5. Emission rates measured of P. abies in μg gDW-1 h-1 and comparison with the literature * for a PAR of 1,000 μmol m-2 s-1 for a late spruce.
3.1.2.2 European beech (Fagus sylvatica) emissions
European beech is a deciduous tree known to have higher emissions of terpenes than isoprene (Tollsten and Müller, 1996; Evans et al., 2015). A number of publications report concentrations and emissions of monoterpenes and sesquiterpenes (Tollsten and Müller, 1996; Gallagher et al., 2000; Dindorf et al., 2005; Moukhtar et al., 2005; van Meeningen et al., 2016; van Meeningen et al., 2017) in order to better understand the emission processes of this species.
In our measurements, the most emitted compound from beech is sabinene (5,220 ± 2,140 pptv), as already measured by van Meeningen et al. (2016) and van Meeningen et al. (2017). We measured the high concentration of geranyl acetate and menthol (Supplementary Figure S5). A lower number of compounds were measured by this species compared to the other two. This is due to many compounds where the concentration was lower than the blank measurements that we do not take into account. Furthermore, we are reminded that the conditions of measurements (temperature, relative humidity, and solar radiation) were not the same within the experiments.
Figure 7 shows the comparison of the concentrations of various monoterpenes over the 2 years of measurement and refer to the literature. Concentrations measured during the two expriences (2020 and 2021) are compltly different. In 2020, 90% of monoterpenes emissions were sabinene and only 3% was g-terpinene and 1% was α-pinene. On the other hand, 64% of emission was α-pinene in 2021 and 14% was sabinene. The publication by Van Meeningen et al. demonstrates a broader range of VOC with a more evenly distributed emission pattern, yet with a predominance of sabinene.
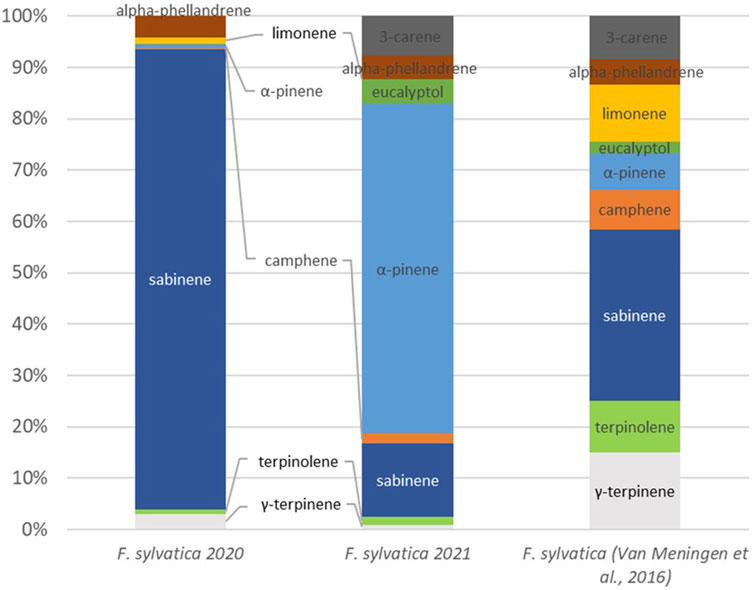
Figure 7. Speciation of monoterpenes for Fagus sylvatica and comparison to the literature (van Meeningen et al., 2016).
Joó et al. (2010) showed high concentrations of linalool for this species with an emission of 1.86 µg gDW−1 h−1 compared to 0.001 µg gDW−1 h−1 in our measurements. This is not the case for van Meeningen et al. (2017), where linalool is also not detected. Joó et al. (2010) reported high ER of sabinene with a maximal ER of 0.75 µg gDW−1 h−1 compared to 0.108 µg gDW−1 h−1 in our study.
Finally, Bourtsoukidis et al. (2014) found very higher ERs of monoterpenes with 335.52 ± 185.76 µg gDW−1 h−1 for total monoterpenes and then 42.48 ± 29.88 µg gDW−1 h−1 for total sesquiterpenes and 23.40 ± 18.72 µg gDW−1 h−1 for isoprene.
3.1.2.3 Hazel tree (Corylus avellana) emissions
We measured majority emissions of limonene and α-pinene for the species C. avellana (7,815 ± 3,204 pptv and 4,231 ± 1734 pptv, Supplementary Figure S6), as previously measured by Acton et al. (2016) (with emissions of 757 μg m−2 h−1 and 13 μg m−2 h−1, respectively). ERs for these species in our study were 0.600 ± 0.246 µg gDW−1 h−1 and 0.325 ± 0.133 µg gDW−1 h−1, respectively.
The fluxes measured in 2020 show higher fluxes for the sum of monoterpenes than for isoprene fluxes (1.292 versus 0.020 µg gDW−1 h−1 for isoprene). On the contrary, for 2021, high emissions of monoterpenes were recorded (6.673 µg gDW−1 h−1 versus 13.51 µg gDW−1 h−1).
Few studies look in detail the emissions of VOCs from C. avellana and their ER (Table 6). According to emission inventories, common hazel trees are recorded as emitting only 0.1 µg gDW−1 h−1 of sesquiterpenes (Karl et al., 2009) but do not emit isoprene or monoterpenes (Karl et al., 2009). Parra et al. (2004) reported emissions from these species but always in very low amounts (0.1 µg gDW−1 h−1).
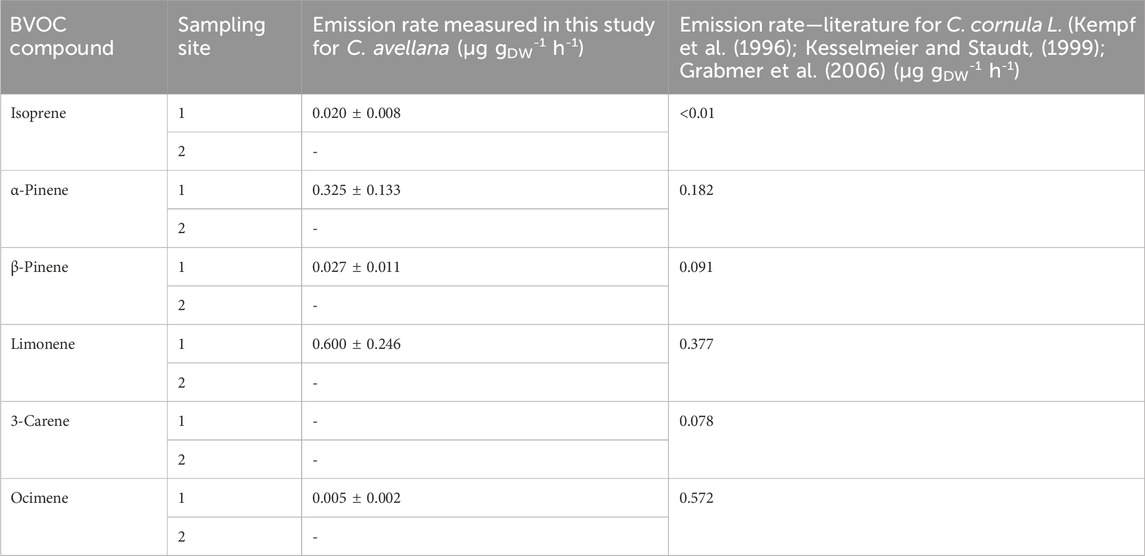
Table 6. Emission rates measured for C. avellana in μg gDW-1 h-1 and comparison with the literature.
A study on an apparent species, Byzantium hazel (Corylus corluna L.), shows the following isoprene and monoterpene ERs: <0.1 μg gDW−1 h−1 and 1.30 μg gDW−1 h−1 for isoprenes and monoterpenes, respectively (Curtis et al., 2014), which are in line with our study.
The majority emitted compound for the species C. cornula is ocimene with an ER of 0.572 μg gDW−1 h−1, where we found only 0.005 µg gDW−1 h−1. The lack of species-specific measurements in the literature does not allow us to conclude on the possible emission patterns of the species C. avellana. Further studies are needed to validate these measurements.
3.2 BVOC from plant leaves in tropical forests (La Réunion Island)
3.2.1 BVOC emission repartition on the island
Isoprene emissions are strongly associated with temperature and light (Zeng et al., 2023). According to Figure 8, predominantly isoprene emitter species are found around Maïdo. This explains the observed concentrations and diurnal variations reported in previous studies at the Maïdo observatory (Rocco et al., 2020; Verreyken et al., 2021; Rocco et al., 2022). The concentrations presented in this figure represent values measured in the chamber after subtracting the chamber blank and are resumed in Supplementary Table S5. Therefore, only two species show isoprene emission (E. reunionensis or Syzygium jambos). The distribution of concentrations at Plaine des Fougères Forest (PLF) for the species A. heterophylla reveals higher sesquiterpene emissions compared to OPAR-Maïdo (242 ± 121 pptv and 62 ± 22 pptv, respectively). The differences observed in emissions from the same species could be explained by the local environment of this species. Indeed, emissions from trees are linked to their environment and could play a great role in the emissions (Staudt et al., 2003; Staudt and Visnadi, 2023). Furthermore, temperature over the measurements ranged between 20°C and 26°C (Section 2.3.2) with high relative humidity inside the chamber (up to 89%). These recorded differences in temperature and relative humidity could influence the measured emissions.
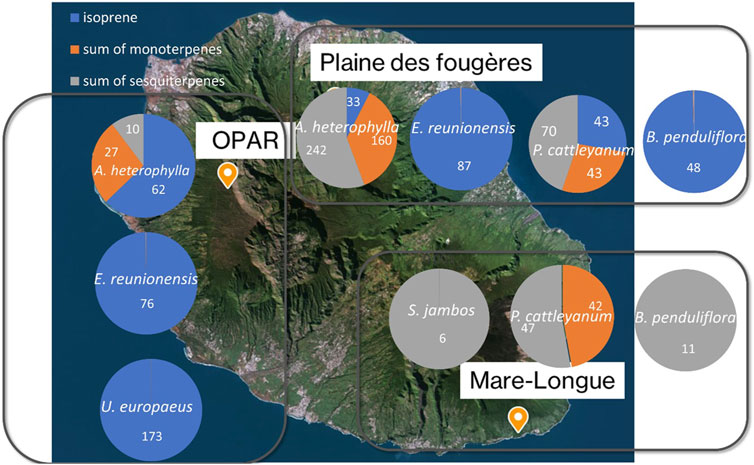
Figure 8. Distribution of isoprene, sum of monoterpenes, and sesquiterpene concentrations (pptv) for the three sites. Numbers inside the circles are concentrations of isoprene (blue), sum of monoterpenes (orange), and sum of sesquiterpenes (gray) in pptv.
Species E. reunionensis is a full isoprene emitter with concentration emitted by this species being 76 ± 14 pptv at OPAR and 87 ± 9 pptv at PLF. No isoprene emission is recorded for B. penduliflora at Mare-Longue forest (MLF) compared to PLF (43 ± 6 pptv). ERs have been estimated and are under the LOD.
The exotic species Ulex europaeus shows a concentration of 173 ± 24 pptv. This species was also measured during the sampling at the Puy de Dôme and showed high isoprene emission (Supplementary Figure S7) but less diversity in emission of monoterpenes at the Puy de Dôme. The emissions for this exotic species are well-documented for its properties of bioherbicide (Pardo-Muras et al., 2018; Pardo-Muras et al., 2019). We calculated ER for tropical species in Supplementary Table S6. ERs are very low for all species. Our result is in line with Boissard et al. (2001) and Owen et al. (2001). They showed high ER of isoprene (range of 0.004–20 µg gDW−1 h−1 compared to 0.004 µg gDW−1 h−1 in our study).
Psidium cattleyanum is a bioindicator species of atmospheric pollutants, notably NOx and SO2 (Kateivas et al., 2018; Kateivas et al., 2022; Agrawal et al., 2023). In plants exposed to NOx and SO2, inhibited growth was observed in terms of both height and size, along with a reduction in the quantity of leaves. Additionally, symptoms of chlorosis and necrosis were evident.
In the literature, no isoprene ERs were found for P. cattleyanum but monoterpenes and sesquiterpenes (Llusià et al., 2010) that are in line with our measurements in MLF. ERs of monoterpenes and sesquiterpenes were, respectively, 0.057 and 0.022 µg gDW−1 h−1 in MLF.
Then, exotic species S. jambos shows only the concentration of sesquiterpenes (6 ± 8 pptv). Despite this measurement, the literature shows the emission of isoprene (0.11–10.81 µg gDW−1 h−1 in Zeng et al., 2023; 199 µg gDW−1 h−1 in Klinger et al., 2002) and monoterpenes (0.29 ± 0.05 µg gDW−1 h−1 in Leung et al., 2010).
3.2.2 Study of BVOC emission from endemic species in the Mare-Longue forest
Average concentrations of monoterpenes for L. calophylloides (n = 3) and S. cymosum (n = 3) are initially depicted in Supplementary Figure S8, prior to the exclusion of blank chamber concentrations. Subsequent to subtracting the measured concentrations of both species by the blank (as illustrated in Figure 9), it was observed that the concentrations of the sum of monoterpenes in the blank exceeded those in the species measurements. Consequently, we have opted not to report these concentrations any further. Higher emission can be shown of sesquiterpenes for both species (19 ± 21 and 14 ± 12 pptv for L. calophylloides and S. cymosum, respectively).
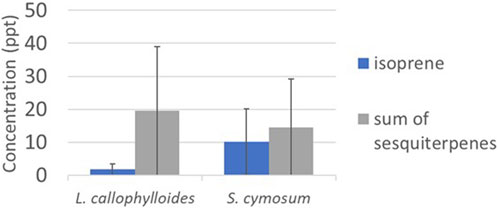
Figure 9. Concentration in pptv (mean ± standard deviation) measured for species Labourdonnaisia calophylloides (n = 3) and Syzygium cymosum (n = 3).
Considering only the positive monoterpene concentrations, we estimated monoterpene ERs of 0.023 ± 0.015 µg gDW−1 h−1 for L. calophylloides and 0.003 ± 0.001 µg gDW−1 h−1 for S. cymosum. Estimated sesquiterpene ERs are 0.003 ± 0.001 µg gDW−1 h−1 for L. calophylloides and 0.004 ± 0.004 µg gDW−1 h−1 for S. cymosum. Finally, isoprene ERs are very low with ER < 0.001 µg gDW−1 h−1 and 0.001 ± 0.001 µg gDW−1 h−1 for L. calophylloides and S. cymosum, respectively.
3.3 Summary and conclusion
We performed trial experiments in a glass chamber called VELVET using the vegetation enclosure technique. We have chosen species in temperate climate (Norway spruce, P. abies; European beech tree, F. sylvatica; and common hazel tree, C. avellana) known for their BVOC emissions and endemic and exotic species in tropical forests (A. heterophylla, L. calophylloides, S. cymosum, P. cattleyanum, S. jambos, E. reunionensis, and B. penduliflora) in La Réunion Island.
High isoprene concentrations averaging 301 ± 36 pptv were recorded for all temperate species, which is not the case for tropical species. C. avellana exhibited elevated concentrations of sesquiterpenes (211 ± 24 pptv) and high total BVOC concentrations, particularly for isoprene (309 ± 29 pptv from PTR-MS measurements) and monoterpenes (99 ± 21 pptv). Flux estimations for F. sylvatica aligned with previous studies, while fluxes for P. abies showed higher isoprene fluxes but lower monoterpene and sesquiterpene fluxes compared to bark flux estimations. Then, we analyzed the VOC speciation based on tree species and ERs. We show distinct VOC profiles in the chamber for P. abies and C. avellana, characterized by higher proportions of limonene, α-pinene, and camphene, while F. sylvatica displays a unique profile with predominant sabinene and isoprene.
For tropical species, the concentrations, after subtracting the chamber blank, are revealing species-specific emissions, such as E. reunionensis and S. jambos being monoterpene and sesquiterpene emitters. In Plaine des Fougères forest (PLF), A. heterophylla exhibits higher sesquiterpene emissions compared to OPAR-Maïdo, possibly influenced by the species’ local environmental context. Exotic species, such as U. europaeus, showed notable isoprene concentrations, aligning with previous findings at the Puy de Dôme.
ERs for tropical species in MLF are low, while isoprene ERs for P. cattleyanum are not found in the literature, monoterpene and sesquiterpene measurements align with existing studies in MLF.
For the first time, we measured ER from two endemic species: L. calophylloides and S. cymosum. We report from these two species emissions of isoprene and sesquiterpenes up to 0.004 ± 0.004 µg gDW−1 h−1.
The importance of these fluxes, especially under stress conditions, is emphasized for their contribution to SOA formation in the atmosphere (Yang et al., 2021). Moreover, the way in which these emissions vary depending on climatic conditions (drought, precipitation, sunlight, etc.) and seasons remains relatively unknown and need to be investigated.
This study serves as groundwork, preparing for future fieldwork with the aim of addressing significant gaps in atmospheric emission inventories and then facilitating the implementation of global climate models. Other compartments, such as litter layer interactions, biotic and abiotic effects, or emissions measured from tree trunks, are underestimated. More in-depth studies are necessary to determine their contribution.
Data availability statement
The original contributions presented in the study are included in the article/Supplementary Material; further inquiries can be directed to the corresponding author.
Author contributions
MaR: conceptualization, data curation, formal analysis, funding acquisition, investigation, methodology, project administration, resources, software, supervision, visualization, writing–original draft, and writing–review and editing. EB: conceptualization, data curation, formal analysis, methodology, resources, software, visualization, writing–original draft, and writing–review and editing. OM: conceptualization, project administration, supervision, visualization, writing–original draft, and writing–review and editing. AB: conceptualization, formal analysis, investigation, validation, and writing–review and editing. AC: data curation, methodology, validation, and writing–review and editing. LB: data curation, methodology, resources, and writing–review and editing. J-LB: funding acquisition, supervision, validation, and writing–review and editing. VD: data curation, funding acquisition, and writing–review and editing. MiR: conceptualization, methodology, resources, and writing–review and editing. DP: conceptualization, funding acquisition, methodology, and writing–review and editing. J-MM: conceptualization, data curation, methodology, resources, and writing–review and editing. PS: investigation, methodology, resources, validation, and writing–review and editing. YB: methodology, resources, and writing–review and editing. CA-P: funding acquisition, investigation, resources, supervision, validation, visualization, and writing–review and editing.
Funding
The author(s) declare that financial support was received for the research, authorship, and/or publication of this article. This research was funded by the OPGC and the OMNCG (X926FEDE-16) through the VELVET-RUN project.
Acknowledgments
The authors acknowledge the OPAR (Observatoire de Physique de l’Atmosphère à La Réunion) and the STAFOR (Forest research station of Mare Longue), funded by CNRS-INSU and Université de La Réunion and managed by OSU-Réunion (Observatoire des Sciences de l’Univers à La Réunion, UAR 3365). They acknowledge the OPGC (Observatoire de Physique du Globe de Clermont) for funding the VELVET chamber. The authors express their gratitude for the support provided by OMNCG federation (University of La Réunion) during the VELVET-RUN project. The authors thank C. Menant for her dedication to data processing during her Master 2 internship. The authors acknowledge also the CO-PDD instrumented site (Cézeaux-Opme Puy de Dome), funded by CNRS-INSU, CNES and Université Clermont Auvergne and managed by OPGC (Observatoire de Physique du Globe de Clermont Ferrand, UAR 833).
Conflict of interest
The authors declare that the research was conducted in the absence of any commercial or financial relationships that could be construed as a potential conflict of interest.
Publisher’s note
All claims expressed in this article are solely those of the authors and do not necessarily represent those of their affiliated organizations, or those of the publisher, the editors, and the reviewers. Any product that may be evaluated in this article, or claim that may be made by its manufacturer, is not guaranteed or endorsed by the publisher.
Supplementary material
The Supplementary Material for this article can be found online at: https://www.frontiersin.org/articles/10.3389/fenvs.2024.1372931/full#supplementary-material
References
Acton, W. J. F., Schallhart, S., Langford, B., Valach, A., Rantala, P., Fares, S., et al. (2016). Canopy-scale flux measurements and bottom-up emission estimates of volatile organic compounds from a mixed oak and hornbeam forest in northern Italy. Atmos. Chem. Phys. 16, 7149–7170. doi:10.5194/acp-16-7149-2016
Ah-Peng, C., Bardat, J., Staménoff, P., Hedderson, T. A. J., and Strasberg, D. (2010). Bryophytes de l’île de La Réunion: diversité, endémicité et conservation. Cryptogam. Bryol. 30, 241–271.
Artaxo, P., Hansson, H. C., Machado, L. A. T., and Rizzo, L. V. (2022). Tropical forests are crucial in regulating the climate on Earth. PLOS Clim. 1, e0000054. doi:10.1371/journal.pclm.0000054
Baray, J.-L., Deguillaume, L., Colomb, A., Sellegri, K., Freney, E., Rose, C., et al. (2020). Cézeaux-Aulnat-Opme-Puy de Dôme: a multi-site for the long-term survey of the tropospheric composition and climate change. Atmos. Meas. Tech. 13, 3413–3445. doi:10.5194/amt-13-3413-2020
Bauwens, M., Verreyken, B., Stavrakou, T., Müller, J.-F., and Smedt, I. D. (2022). Spaceborne evidence for significant anthropogenic VOC trends in Asian cities over 2005–2019. Environ. Res. Lett. 17, 015008. doi:10.1088/1748-9326/ac46eb
Boissard, C., Cao, X. L., Juan, C. Y., Hewitt, C. N., and Gallagher, M. (2001). Seasonal variations in VOC emission rates from gorse (Ulex europaeus). Atmos. Environ. 35 (5), 917–927. doi:10.1016/S1352-2310(00)00362-9
Boullet, P., and Picot, F. (2012). Index de la flore vasculaire de la Réunion (Trachéophytes): statuts, menaces et protections. Conservatoire Botanique National de Mascarin. Available at: https://mascarine.cbnm.org/index.php/flore/index-de-la-flore (Electronical version 2017.1.).
Bourtsoukidis, E., Williams, J., Kesselmeier, J., Jacobi, S., and Bonn, B. (2014). From emissions to ambient mixing ratios: online seasonal field measurements of volatile organic compounds over a Norway spruce-dominated forest in central Germany. Atmos. Chem. Phys. 14, 6495–6510. doi:10.5194/acp-14-6495-2014
Cappellin, L., Karl, T., Probst, M., Ismailova, O., Winkler, P. M., Soukoulis, C., et al. (2012). On quantitative determination of volatile organic compound concentrations using proton transfer reaction time-of-flight mass spectrometry. Environ. Sci. Technol. 46 (4), 2283–2290. doi:10.1021/es203985t
Copolovici, L., Kännaste, A., Remmel, T., and Niinemets, Ü. (2014). Volatile organic compound emissions from Alnus glutinosa under interacting drought and herbivory stresses. Environ. Exp. Bot. 100, 55–63. doi:10.1016/j.envexpbot.2013.12.011
Curtis, A. J., Helmig, D., Baroch, C., Daly, R., and Davis, S. (2014). Biogenic volatile organic compound emissions from nine tree species used in an urban tree-planting program. Atmos. Environ. 95, 634–643. doi:10.1016/J.ATMOSENV.2014.06.035
De Gouw, J., and Warneke, C. (2007). Measurements of volatile organic compounds in the earth’s atmosphere using proton-transfer-reaction mass spectrometry. Mass Spectrom. Rev. 26 (2), 223–257. doi:10.1002/mas.20119
Dindorf, T., Kuhn, U., Ganzeveld, L., Schebeske, G., Ciccioli, P., Holzke, C., et al. (2005). Emission of monoterpenes from European beech (Fagus sylvatica L.) as a function of light and temperature. Biogeosciences Discuss. 2, 137–182. doi:10.5194/bgd-2-137-2005
Duflot, V., Tulet, P., Flores, O., Barthe, C., Colomb, A., Deguillaume, L., et al. (2019). Preliminary results from the FARCE 2015 campaign: multidisciplinary study of the forest-gas-aerosol-cloud system on the tropical island of la Réunion. Atmos. Chem. Phys. 19, 10591–10618. doi:10.5194/acp-19-10591-2019
Evans, R. C., Tingey, D. T., Gumpertz, M. L., and Burns, W. F. (2015). Estimates of isoprene and monoterpene emission rates in plants. Bot. Gaz. 143, 304–310. doi:10.1086/BOTANICALGAZETTE.143.3.2474826
Fall, R., Karl, T., Hansel, A., Jordan, A., and Lindinger, W. (1999). Volatile organic compounds emitted after leaf wounding: On-line analysis by proton-transfer-reaction mass spectrometry. J. Geophys. Res : Atmos. 104 (D13), 15963–15974. doi:10.1029/1999JD900144
Fehsenfeld, F., Calvert, J., Fall, R., Goldan, P., Guenther, A. B., Hewitt, C. N., et al. (1992). Emissions of volatile organic compounds from vegetation and the implications for atmospheric chemistry. Glob. Biogeochem. Cycles 6, 389–430. doi:10.1029/92GB02125
Fitzky, A. C., Kaser, L., Peron, A., Karl, T., Graus, M., Tholen, D., et al. (2023). Same, same, but different: drought and salinity affect BVOC emission rate and alter blend composition of urban trees. Urban For. Urban Green. 80, 127842. doi:10.1016/j.ufug.2023.127842
Fitzky, A. C., Peron, A., Kaser, L., Karl, T., Graus, M., Tholen, D., et al. (2021). Diversity and interrelations among the constitutive VOC emission blends of four broad-leaved tree species at seedling stage. Front. Plant Sci. 12, 708711. doi:10.3389/fpls.2021.708711
Furnell, H., Kammer, J., Wingler, A., Kilcawley, K., Mannion, D., and Wenger, J. (2023). Formation of secondary organic aerosol from sitka spruce emissions. Copernic. Meet. doi:10.5194/egusphere-egu23-14075
Gallagher, M. W., Clayborough, R., Beswick, K. M., Hewitt, C. N., Owen, S., Moncrieff, J., et al. (2000). Assessment of a relaxed eddy accumulation for measurements of fluxes of biogenic volatile organic compounds: study over arable crops and a mature beech forest. Atmos. Environ. 34, 2887–2899. doi:10.1016/S1352-2310(00)00066-2
Genard-Zielinski, A.-C., Boissard, C., Fernandez, C., Kalogridis, C., Lathière, J., Gros, V., et al. (2015). Variability of BVOC emissions from a Mediterranean mixed forest in southern France with a focus on <i&gt;Quercus pubescens&lt;/i&gt;. Atmos. Chem. Phys. 15, 431–446. doi:10.5194/acp-15-431-2015
Ghirardo, A., Koch, K., Taipale, R., Zimmer, I., Schnitzler, J.-P., and Rinne, J. (2010). Determination of de novo and pool emissions of terpenes from four common boreal/alpine trees by 13CO2 labelling and PTR-MS analysis. Plant Cell Environ. 33, 781–792. doi:10.1111/j.1365-3040.2009.02104.x
Grabmer, W., Kreuzwieser, J., Wisthaler, A., Cojocariu, C., Graus, M., Rennenberg, H., et al. (2006). VOC emissions from Norway spruce (Picea abies L. [Karst]) twigs in the field-Results of a dynamic enclosure study. Atmos. Environ. 40, 128–137. doi:10.1016/j.atmosenv.2006.03.043
Greenberg, J. P., Guenther, A. B., Pétron, G., Wiedinmyer, C., Vega, O., Gatti, L. V., et al. (2004). Biogenic VOC emissions from forested Amazonian landscapes. Glob. Change Biol. 10, 651–662. doi:10.1111/j.1365-2486.2004.00758.x
Gros, V., Lathière, J., Boissard, C., Jambert, C., Delon, C., Staudt, M., et al. (2022). “Emissions from the mediterranean vegetation,” in Atmospheric chemistry in the mediterranean region: volume 2 - from air pollutant sources to impacts. Editors F. Dulac, S. Sauvage, and E. Hamonou (Cham: Springer International Publishing), 25–49. doi:10.1007/978-3-030-82385-6_3
Guenther, A. (2013). Biological and chemical diversity of biogenic volatile organic emissions into the atmosphere. ISRN Atmos. Sci. 2013, 1–27. doi:10.1155/2013/786290
Guenther, A. B., Jiang, X., Heald, C. L., Sakulyanontvittaya, T., Duhl, T., Emmons, L. K., et al. (2012). The Model of Emissions of Gases and Aerosols from Nature version 2.1 (MEGAN2.1): an extended and updated framework for modeling biogenic emissions. Geosci. Model Dev. 5, 1471–1492. doi:10.5194/gmd-5-1471-2012
Hanif, N. M., Hawari, N. S. S. L., Othman, M., Hamid, H. H. A., Ahamad, F., Uning, R., et al. (2021). Ambient volatile organic compounds in tropical environments: potential sources, composition and impacts – a review. Chemosphere 285, 131355. doi:10.1016/j.chemosphere.2021.131355
Helmig, D., Klinger, L. F., Guenther, A., Vierling, L., Geron, C., and Zimmerman, P. (1999). Biogenic volatile organic compound emissions (BVOCs) I. Identifications from three continental sites in the US. Chemosphere 38 (9), 2163–2187. doi:10.1016/S0045-6535(98)00425-1
Houweling, S., Dentener, F., and Lelieveld, J. (1998). The impact of nonmethane hydrocarbon compounds on tropospheric photochemistry. J. Geophys. Res. Atmos. 103, 10673–10696. doi:10.1029/97JD03582
Inventaire-forestier-national (2010). La Forêt française, les résultats pour la région Auvergne. (France: Puy de Dôme Department), 184–213. Available at: https://inventaire-forestier.ign.fr/IMG/pdf/IFN_Publi_2010_Auvergne.pdf (Accessed March 25, 2024).
Jaakkola, E., Gärtner, A., Jönsson, A. M., Ljung, K., Olsson, P.-O., and Holst, T. (2023). Spruce bark beetles (Ips typographus) cause up to 700 times higher bark BVOC emission rates compared to healthy Norway spruce (Picea abies). Biogeosciences 20, 803–826. doi:10.5194/bg-20-803-2023
Joó, É., Dewulf, J., Demarcke, M., Amelynck, C., Schoon, N., Müller, J.-F., et al. (2010). Quantification of interferences in PTR-MS measurements of monoterpene emissions from Fagus sylvatica L. using simultaneous TD-GC-MS measurements. Int. J. Mass Spectrom. 291, 90–95. doi:10.1016/j.ijms.2010.01.018
Jordan, A., Haidacher, S., Hanel, G., Hartungen, E., Märk, L., Seehauser, H., et al. (2009). A high resolution and high sensitivity proton-transfer-reaction time-of-flight mass spectrometer (PTR-TOF-MS). Int. J. Mass Spectrom. 286, 122–128. doi:10.1016/j.ijms.2009.07.005
Karl, M., Guenther, A., Köble, R., Leip, A., and Seufert, G. (2009). A new European plant-specific emission inventory of biogenic volatile organic compounds for use in atmospheric transport models. Biogeosciences 6, 1059–1087. doi:10.5194/bg-6-1059-2009
Karl, T., Guenther, A., Yokelson, R. J., Greenberg, J., Potosnak, M., Blake, D. R., et al. (2007). The tropical forest and fire emissions experiment: emission, chemistry, and transport of biogenic volatile organic compounds in the lower atmosphere over Amazonia. J. Geophys. Res. Atmos. 112. doi:10.1029/2007JD008539
Kateivas, K. S. B., Cairo, P. A. R., Neves, P. H. S., Ribeiro, R. S. S., Leitão, C. A. E., and Machado, L. M. (2018). Morphophysiological changes in Psidium cattleianum caused by air emissions from a mining industry in Brumado, Bahia, Brazil. Rev. Bras. Ciênc. Agrár. 13, 1–8. doi:10.5039/agraria.v13i4a5579
Kateivas, K. S. B., Cairo, P. A. R., Neves, P. H. S., Ribeiro, R. S. S., Machado, L. M., and Leitão, C. A. E. (2022). The impact of NOx and SO2 emissions from a magnesite processing industry on morphophysiological and anatomical features of plant bioindicators. Acta Physiol. Plant. 44, 77. doi:10.1007/s11738-022-03411-9
Kempf, K., Allwine, E., Westberg, H., Claiborn, C., and Lamb, B. (1996). Hydrocarbon emissions from spruce species using environmental chamber and branch enclosure methods. Atmos. Environ. 30, 1381–1389. doi:10.1016/1352-2310(95)00462-9
Kesselmeier, J., Kuhn, U., Wolf, A., Andreae, M. O., Ciccioli, P., Brancaleoni, E., et al. (2000). Atmospheric volatile organic compounds (VOC) at a remote tropical forest site in central Amazonia. Atmos. Environ. 34, 4063–4072. doi:10.1016/s1352-2310(00)00186-2
Kesselmeier, J., and Staudt, M. (1999). An overview on emission, physiology and Ecology.pdf. J. Atmos. Chem. 33, 23–88. doi:10.1023/A:1006127516791
Klinger, L. F., Li, Q.-J., Guenther, A. B., Greenberg, J. P., Baker, B., and Bai, J.-H. (2002). Assessment of volatile organic compound emissions from ecosystems of China. J. Geophys. Res. Atmos. 107. doi:10.1029/2001JD001076
Laothawornkitkul, J., Taylor, J. E., Paul, N. D., and Hewitt, C. N. (2009). Biogenic volatile organic compounds in the Earth system: tansley review. New Phytol. 183, 27–51. doi:10.1111/j.1469-8137.2009.02859.x
Leung, D. Y. C., Wong, P., Cheung, B. K. H., and Guenther, A. (2010). Improved land cover and emission factors for modeling biogenic volatile organic compounds emissions from Hong Kong. Atmos. Environ. 44, 1456–1468. doi:10.1016/j.atmosenv.2010.01.012
Lindinger, W., and Jordan, A. (1998). Proton-transfer-reaction mass spectrometry (PTR–MS): on-line monitoring of volatile organic compounds at pptv levels. Chem. Soc. Rev. 27, 347–375. doi:10.1039/A827347Z
Llusià, J., Peñuelas, J., Sardans, J., Owen, S. M., and Niinemets, Ü. (2010). Measurement of volatile terpene emissions in 70 dominant vascular plant species in Hawaii: aliens emit more than natives. Glob. Ecol. Biogeogr. 19, 863–874. doi:10.1111/j.1466-8238.2010.00557.x
Moukhtar, S., Bessagnet, B., Rouil, L., and Simon, V. (2005). Monoterpene emissions from Beech (Fagus sylvatica) in a French forest and impact on secondary pollutants formation at regional scale. Atmos. Environ. 39, 3535–3547. doi:10.1016/j.atmosenv.2005.02.031
Moura, B. B., Bolsoni, V. P., de Paula, M. D., Dias, G. M., and de Souza, S. R. (2022). Ozone impact on emission of biogenic volatile organic compounds in three tropical tree species from the atlantic forest remnants in southeast Brazil. Front. Plant Sci. 13, 879039. doi:10.3389/fpls.2022.879039
Mu, Z., Llusià, J., Zeng, J., Zhang, Y., Asensio, D., Yang, K., et al. (2022). An overview of the isoprenoid emissions from tropical plant species. Front. Plant Sci. 13, 833030. doi:10.3389/fpls.2022.833030
Niinemets, Ü., Arneth, A., Kuhn, U., Monson, R. K., Peñuelas, J., and Staudt, M. (2010). The emission factor of volatile isoprenoids: stress, acclimation, and developmental responses. Biogeosciences 7 (7), 2203–2223. doi:10.5194/bg-7-2203-2010
Niinemets, U., Kuhn, U., Harley, P. C., Staudt, M., Arneth, A., Cescatti, A., et al. (2011). Estimations of isoprenoid emission capacity from enclosure studies: measurements, data processing, quality and standardized measurement protocols. Biogeosciences 8, 2209–2246. doi:10.5194/bg-8-2209-2011
Ortega, J., and Helmig, D. (2008). Approaches for quantifying reactive and low-volatility biogenic organic compound emissions by vegetation enclosure techniques – Part A. Chemosphere 72, 343–364. doi:10.1016/j.chemosphere.2007.11.020
Owen, S. M., Boissard, C., and Hewitt, C. N. (2001). Volatile organic compounds (VOCs) emitted from 40 Mediterranean plant species: VOC speciation and extrapolation to habitat scale. Atmos. Environ. 35, 5393–5409. doi:10.1016/S1352-2310(01)00302-8
Pardo-Muras, M., Puig, C. G., López-Nogueira, A., Cavaleiro, C., and Pedrol, N. (2018). On the bioherbicide potential of Ulex europaeus and Cytisus scoparius: profiles of volatile organic compounds and their phytotoxic effects. PLOS ONE 13, e0205997. doi:10.1371/journal.pone.0205997
Pardo-Muras, M., Puig, G., and Pedrol, N. (2019). Cytisus scoparius and ulex europaeus produce volatile organic compounds with powerful synergistic herbicidal effects. Molecules 24, 4539. doi:10.3390/molecules24244539
Parra, R., Gassó, S., and Baldasano, J. M. (2004). Estimating the biogenic emissions of non-methane volatile organic compounds from the North Western Mediterranean vegetation of Catalonia, Spain. Sci. Total Environ. 329, 241–259. doi:10.1016/j.scitotenv.2004.03.005
Pfister, G. G., Emmons, L. K., Hess, P. G., Lamarque, J.-F., Thompson, A. M., and Yorks, J. E. (2008). Analysis of the summer 2004 ozone budget over the United States using intercontinental transport experiment ozonesonde network study (IONS) observations and model of ozone and related tracers (MOZART-4) simulations. J. Geophys. Res. Atmos. 113, 23306. doi:10.1029/2008JD010190
Poisson, N., Kanakidou, M., and Crutzen, P. J. (2000). Impact of non-methane hydrocarbons on tropospheric chemistry and the oxidizing power of the global troposphere: 3-dimensional modelling results. J. Atmos. Chem. 362, 157–230. doi:10.1023/A:1006300616544
Rocco, M., Baray, J.-L., Colomb, A., Borbon, A., Dominutti, P., Tulet, P., et al. (2022). High resolution dynamical analysis of volatile organic compounds (VOC) measurements during the BIO-maïdo field campaign (réunion island, Indian ocean). J. Geophys. Res. Atmos. 127, e2021JD035570. doi:10.1029/2021JD035570
Rocco, M., Colomb, A., Baray, J.-L., Amelynck, C., Verreyken, B., Borbon, A., et al. (2020). Analysis of volatile organic compounds during the OCTAVE campaign: sources and distributions of formaldehyde on reunion island. Atmosphere 11, 140. doi:10.3390/atmos11020140
Schneider, S. R., Collins, D. B., Lim, C. Y., Zhu, L., and Abbatt, J. P. D. (2019). Formation of secondary organic aerosol from the heterogeneous oxidation by ozone of a phytoplankton culture. ACS Earth Space Chem. 10, 298–2306. doi:10.1021/acsearthspacechem.9b00201
Sekimoto, K., Li, S.-M., Yuan, B., Koss, A., Coggon, M., Warneke, C., et al. (2017). Calculation of the sensitivity of proton-transfer-reaction mass spectrometry (PTR-MS) for organic trace gases using molecular properties. Int. J. Mass Spectrom. 421, 71–94. doi:10.1016/j.ijms.2017.04.006
Sindelarova, K., Granier, C., Bouarar, I., Guenther, A., Tilmes, S., Stavrakou, T., et al. (2014). Global data set of biogenic VOC emissions calculated by the MEGAN model over the last 30 years. Atmos. Chem. Phys. 14, 9317–9341. doi:10.5194/acp-14-9317-2014
Sindelarova, K., Markova, J., Simpson, D., Huszar, P., Karlicky, J., Darras, S., et al. (2022). High-resolution biogenic global emission inventory for the time period 2000–2019 for air quality modelling. Earth Syst. Sci. Data 14, 251–270. doi:10.5194/essd-14-251-2022
Singh, P., Prakash, J., Singh, H., Agrawal, S. B., and Agrawal, M. (2024). “Impacts of air pollutants on the ecophysiology of tropical plants,” in Ecophysiology of Tropical Plants (Taylor and Francis Group, United Kingdom: CRC Press), 37–56.
Staudt, M., Joffre, R., and Rambal, S. (2003). How growth conditions affect the capacity of Quercus ilex leaves to emit monoterpenes. New Phytol. 158, 61–73. doi:10.1046/j.1469-8137.2003.00722.x
Staudt, M., and Visnadi, I. (2023). High chemodiversity in the structural and enantiomeric composition of volatiles emitted by Kermes oak populations in Southern France. Elem. Sci. Anth 11, 00043. doi:10.1525/elementa.2023.00043
Strasberg, D., Rouget, M., Richardson, D. M., Baret, S., Dupont, J., and Cowling, R. M. (2005). An assessment of habitat diversity and transformation on La réunion island (mascarene islands, Indian ocean) as a basis for identifying broad-scale conservation priorities. Biodivers. Conserv. 14, 3015–3032. doi:10.1007/s10531-004-0258-2
Taraborrelli, D., Lawrence, M. G., Crowley, J. N., Dillon, T. J., Gromov, S., Groß, C. B. M., et al. (2012). Hydroxyl radical buffered by isoprene oxidation over tropical forests. Nat. Geosci. 53 (5), 190–193. doi:10.1038/ngeo1405
Thomas, S. J., Tykkä, T., Hellén, H., Bianchi, F., and Praplan, A. P. (2023). Undetected biogenic volatile organic compounds from Norway spruce drive total ozone reactivity measurements. Atmos. Chem. Phys. 23 (22), 14627–14642. doi:10.5194/acp-23-14627-2023
Tollsten, L., and Müller, P. M. (1996). Volatile organic compounds emitted from beech leaves. Phytochemistry 43, 759–762. doi:10.1016/0031-9422(96)00272-5
Tsigaridis, K., and Kanakidou, M. (2003). Global modelling of secondary organic aerosol in the troposphere: a sensitivity analysis. Atmos. Chem. Phys. 3, 1849–1869. doi:10.5194/acp-3-1849-2003
van Meeningen, Y., Schurgers, G., Rinnan, R., and Holst, T. (2016). BVOC emissions from English oak (Quercus robur) and European beech (Fagus sylvatica) along a latitudinal gradient. Biogeosciences 13, 6067–6080. doi:10.5194/bg-13-6067-2016
van Meeningen, Y., Schurgers, G., Rinnan, R., and Holst, T. (2017). Isoprenoid emission response to changing light conditions of English oak, European beech and Norway spruce. Biogeosciences 14, 4045–4060. doi:10.5194/bg-14-4045-2017
Verreyken, B., Amelynck, C., Schoon, N., Müller, J.-F., Brioude, J., Kumps, N., et al. (2021). Measurement report: source apportionment of volatile organic compounds at the remote high-altitude Maïdo observatory. Atmos. Chem. Phys. Discuss., 1–37. doi:10.5194/acp-2021-124
Wang, H., Liu, X., Wu, C., Lin, G., Jin, Y., Hu, H., et al. (2023). Controllable synthesis, formation mechanism, and photocatalytic activity of tellurium with various nanostructures. EGUsphere 15, 1–34. doi:10.3390/mi15010001
Yáñez-Serrano, A. M., Nölscher, A. C., Bourtsoukidis, E., Gomes Alves, E., Ganzeveld, L., Bonn, B., et al. (2018). Monoterpene chemical speciation in a tropical rainforest:variation with season, height, and time of dayat the Amazon Tall Tower Observatory (ATTO). Atmos. Chem. Phys. 18, 3403–3418. doi:10.5194/acp-18-3403-2018
Yang, W., Cao, J., Wu, Y., Kong, F., and Li, L. (2021). Review on plant terpenoid emissions worldwide and in China. Sci. Total Environ. 787, 147454. doi:10.1016/j.scitotenv.2021.147454
Yuan, B., Koss, A. R., Warneke, C., Coggon, M., Sekimoto, K., and de Gouw, J. A. (2017). Proton-Transfer-reaction mass spectrometry: applications in atmospheric Sciences. Chem. Rev. 117, 13187–13229. doi:10.1021/acs.chemrev.7b00325
Zeng, J., Zhang, Y., Mu, Z., Pang, W., Zhang, H., Wu, Z., et al. (2023). Temperature and light dependency of isoprene and monoterpene emissions from tropical and subtropical trees: field observations in south China. Appl. Geochem. 155, 105727. doi:10.1016/j.apgeochem.2023.105727
Zeng, J., Zhang, Y., Zhang, H., Song, W., Wu, Z., and Wang, X. (2022). Design and characterization of a semi-open dynamic chamber for measuring biogenic volatile organic compound (BVOC) emissions from plants. Atmos. Meas. Tech. 15, 79–93. doi:10.5194/amt-15-79-2022
Keywords: emission rates, tropical and temperate species, vegetation enclosure technique, biogenic volatile organic compounds, atmosphere
Citation: Rocco M, Brugere E, Magand O, Borbon A, Colomb A, Bouvier L, Baray J-L, Duflot V, Ribeiro M, Picard D, Metzger J-M, Stamenoff P, Benoit Y and Ah-Peng C (2024) VELVET: an enclosure vegetation system to measure BVOC emission fingerprints in temperate and tropical climates. Front. Environ. Sci. 12:1372931. doi: 10.3389/fenvs.2024.1372931
Received: 18 January 2024; Accepted: 13 March 2024;
Published: 30 April 2024.
Edited by:
Junwen Liu, Jinan University, ChinaCopyright © 2024 Rocco, Brugere, Magand, Borbon, Colomb, Bouvier, Baray, Duflot, Ribeiro, Picard, Metzger, Stamenoff, Benoit and Ah-Peng. This is an open-access article distributed under the terms of the Creative Commons Attribution License (CC BY). The use, distribution or reproduction in other forums is permitted, provided the original author(s) and the copyright owner(s) are credited and that the original publication in this journal is cited, in accordance with accepted academic practice. No use, distribution or reproduction is permitted which does not comply with these terms.
*Correspondence: Manon Rocco, manon.rocco@univ-amu.fr
†Present address: Manon Rocco, Aix Marseille University, CNRS, LCE, Marseille, France and IMBE, CNRS, Aix Marseille University, IRD, Avignon University, Marseille, France