Microwave plasma atomic emission spectroscopy (MP-AES)—A useful tool for the determination of silicon contents in plant samples?
 Daniel Puppe
 Christian Buhtz1
  Danuta Kaczorek
 Jörg Schaller
 Mathias Stein
- 1Leibniz Centre for Agricultural Landscape Research (ZALF), Müncheberg, Germany
- 2Warsaw University of Life Sciences (SGGW), Department of Soil Science, Warsaw, Poland
The accurate quantification of silicon (Si) contents in plant materials represents a fundamental prerequisite for agricultural plant-soil system or terrestrial ecosystem studies. Si contents in plants are usually calculated from Si concentrations determined spectroscopically in corresponding plant extracts. Inductively coupled plasma optical emission spectrometry (ICP-OES) is widely used in environmental sciences for Si measurements, because this technique is characterized by relatively high sensitivity and low expenditure of human labor. However, as an ICP-OES instrument is also characterized by relatively high acquisition and running costs, it is not readily available to most laboratories. Microwave plasma atomic emission spectroscopy (MP-AES) might represent a cost-effective alternative to ICP-OES. In our study we compared the results obtained from ICP-OES and MP-AES measurements of Si concentrations in Tiron extracts of husk and straw samples of winter wheat (Triticum aestivum) to evaluate the capability of the MP-AES technique for the determination of Si contents in plant materials. Moreover, we correlated these results with data on plant available Si concentrations in corresponding soil samples as well as phytolith contents in the husk and straw samples to evaluate the performance of MP-AES in biogeochemical Si plant-soil studies. Based on our results we found MP-AES to represent a suitable technique for the reliable determination of Si concentrations in Tiron extracts with negligible matrix effects. Our results clearly indicate that MP-AES represents a promising alternative for all researchers with a focus on biogeochemical Si cycling in general.
Introduction
Silicon (Si) accumulation in plants increases plant resistance against abiotic and biotic stress with consequences for plant performance and ecosystem functioning (Cooke et al., 2016; Katz et al., 2021). Siliceous structures in plants consist of hydrated amorphous silica (SiO2 · nH2O), also known as phytogenic silica. In plants phytogenic silica can be found i) within cells (i.e., in the cell wall and the cell lumen) forming relatively stable, recognizable phytoliths, that can also be found in soils as plant microfossils or ii) in intercellular spaces and extracellular (cuticular) layers forming relatively fragile silica structures that are not preserved in soils (Hodson, 2016; Sangster et al., 2001). In agricultural soil-plant systems an accurate quantification of Si contents in plant materials is crucial for assessing crops’ need for Si supply and Si fertilization efficacy, because soil Si availability is often deduced from plant Si contents in agronomic studies (Korndörfer et al., 2001; Miles et al., 2014; Wu et al., 2020). In this context, a reliable, fast, and cost-effective method for the quantification of Si in soil amendments/fertilizers like, e.g., biochar or slags (Eltohamy et al., 2023; Haynes, 2017; Li et al., 2019) would be greatly appreciated by agricultural scientists as well as practitioners.
For the determination of Si contents in plants, Si is commonly extracted from plant materials using alkaline extractants like sodium carbonate (Na2CO3) or Tiron (disodium 4,5-dihydroxy-1,3-benzenedisulfonate, C6H4Na2O8S2) and subsequently Si concentrations in the extracts are determined spectroscopically (Guntzer et al., 2010; Puppe et al., 2023; Schaller et al., 2022). Traditionally Si concentrations have been measured using molybdenum blue colorimetry (Isaacs, 1924; Nakamura et al., 2020; Volk & Weintraub, 1958). However, this method “only” measures the concentration of monomeric silicic acid (i.e., the plant available Si fraction) in samples as this is the only molybdate reactive form of silicic acid (polysilicic acid does not form a Si-molybdate blue complex, see our Discussion). Nowadays inductively coupled plasma optical emission spectrometry (ICP-OES) is widely used in environmental sciences for a fast routine determination of Si, because this technique is characterized by relatively high sensitivity and low expenditure of human labor (Delvigne et al., 2021). However, as an ICP-OES instrument is relatively expensive (including running costs), it is not readily available to most laboratories. Microwave plasma atomic emission spectroscopy (MP-AES) might represent a promising alternative to ICP-OES, because MP-AES generally has lower running costs. This is because MP-AES uses smaller torches and needs less gas compared to ICP-OES. Furthermore, MP-AES uses nitrogen, which is a comparably inexpensive gas. Nitrogen can even be obtained directly from the air by a nitrogen generator coupled to the MP-AES instrument, and thus no gas connection or supply is required. Since its commercial introduction in 2011, MP-AES has been successfully used as analytical tool in various research fields (Balaram, 2020). However, to the best of our knowledge no study of the aptitude of MP-AES for the determination of Si concentrations in alkaline plant extracts has been published until now.
To evaluate the capability of the MP-AES technique regarding the determination of Si contents in plant materials, we conducted a laboratory study using a relatively large sample set (n = 42) of retained husk and straw samples of winter wheat (Triticum aestivum) from a long-term field experiment (Puppe et al., 2021). Si was extracted from husk and straw samples using Tiron as recommended by Guntzer et al. (2010), who showed the general suitability of Tiron for the extraction of total Si from plant materials of different plant species (i.e., Triticum durum, Equisetum arvense, Dicksonia squarrosa, Ulmus laevis, and Larix gmelinii), and Puppe et al. (2023), who found Tiron to be more efficient in Si extraction compared to Na2CO3 using hydrofluoric acid digestion as a reference. Subsequently, Si concentrations in the Tiron extracts were measured via ICP-OES as well as MP-AES, corresponding Si contents were calculated (details in Material and Methods), and finally the results were compared. To evaluate the performance of MP-AES in biogeochemical Si plant-soil studies, we also correlated the results obtained from MP-AES measurements with data on plant available Si concentrations in corresponding soil samples as well as phytolith contents in the husk and straw samples (data from Puppe et al. (2021)) and compared these results to the ones obtained from ICP-OES analyses.
Results
Si contents in plant materials obtained from MP-AES measurements were generally very similar to the ones obtained from ICP-OES. Regarding all tested samples (n = 42) we found a coefficient of determination (R2) of about 0.98 in the diagram of MP-AES results plotted against corresponding ICP-OES results (Figure 1A). The coefficients of determination for husk (n = 21, Figure 1B) and straw (n = 21, Figure 1C) samples were slightly lower (R2 = 0.96 and 0.88, respectively). Our correlation analyses indicated a strong linear relationship between the results of MP-AES and ICP-OES measurements as Pearson’s correlation coefficients were generally higher than Spearman’s correlation coefficients (Table 1).
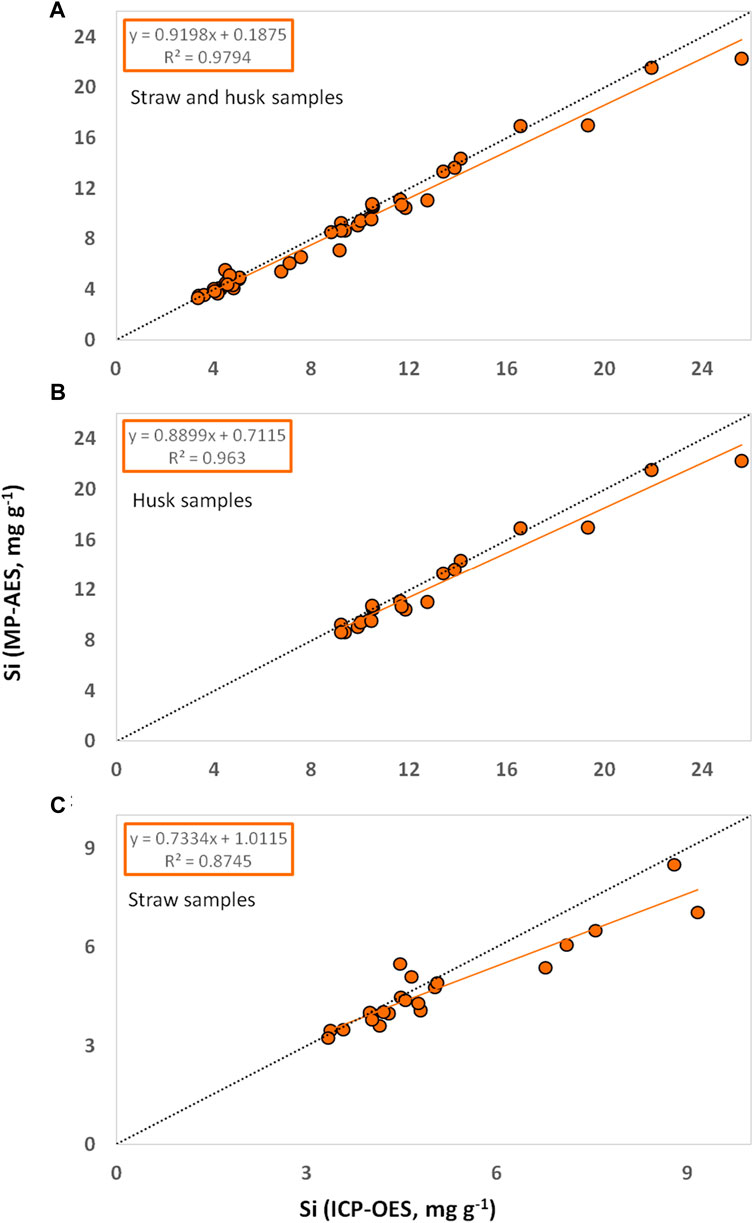
Figure 1. Si contents in plant materials ((A) straw and husk, (B) husk, and (C) straw samples of winter wheat) determined by MP-AES plotted against corresponding Si contents determined by ICP-OES. Linear trendlines are given in orange and corresponding equations and coefficients of determination are stated in orange boxes. Lines of equality (y = x) are given in dotted black.
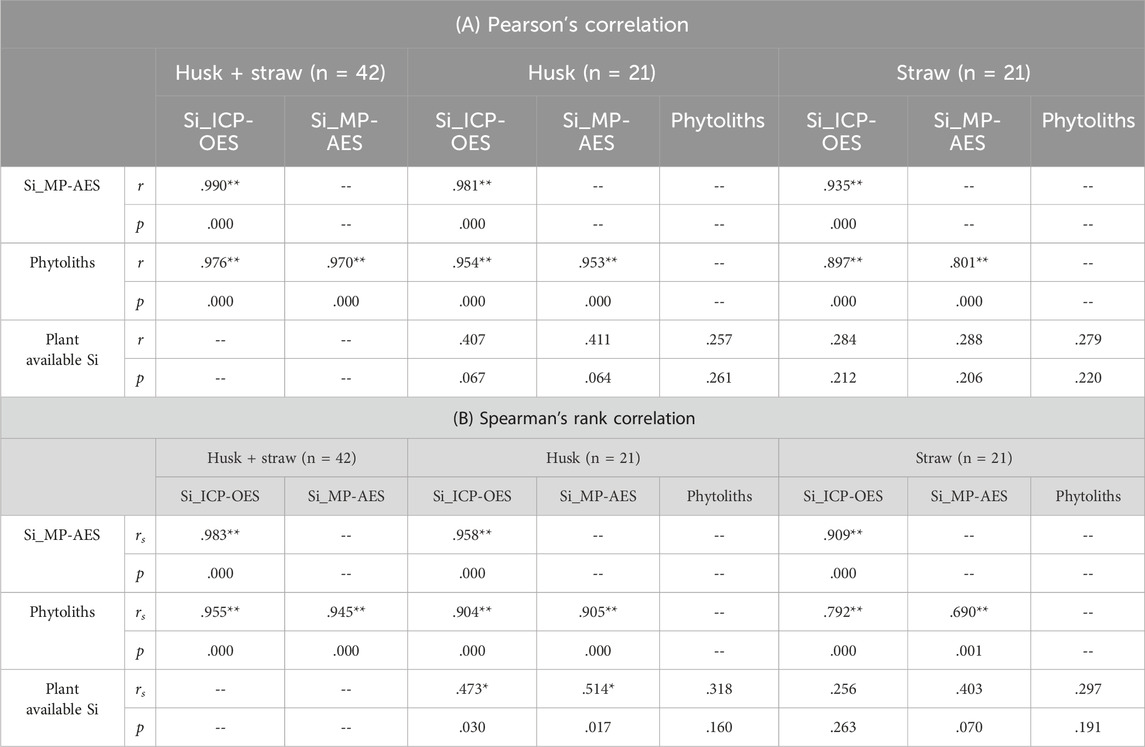
Table 1. Correlations between Si contents in husk and straw samples (determined by ICP-OES and MP-AES), phytolith contents in these plant samples, and plant available Si concentrations in corresponding soil samples. Significant correlations are marked with asterisks (* indicates p < 0.05, ** indicates p < 0.01).
The differences (δSi) between Si contents in husk and straw samples determined by ICP-OES and MP-AES (δSi = Si (ICP-OES)—Si (MP-AES)) were more pronounced in husk samples ranging between −0.3 and 3.4 mg g−1 (Figure 2). In straw samples δSi ranged from −1–2.1 mg g−1. While in 6 out of 42 plant samples MP-AES results were slightly higher (indicated by negative δSi values) than ICP-OES results, in 36 out of 42 samples ICP-OES results were slightly higher compared to MP-AES results (δSi values positive). The mean level of achievement (in %, calculated as: Si (MP-AES)/ Si (ICP-OES) x 100%) was 95% for all tested samples (n = 42) as well as for husk (n = 21) and straw (n = 21) samples alone (Figure 2).
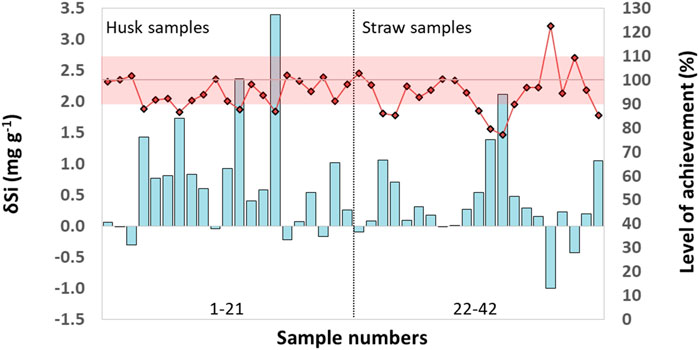
Figure 2. Differences (δSi) between Si contents in husk and straw samples of winter wheat determined by ICP-OES and MP-AES (δSi = Si (ICP-OES)—Si (MP-AES), cyan columns). The level of achievement (in %, calculated as: Si (MP-AES)/ Si (ICP-OES) x 100%, black-rimmed red rhombi) is plotted along the secondary Y-axis. The reddish shaded range includes samples with a corresponding maximal deviation of 10% (i.e., a level of achievement between 90% and 110%). Sample numbering follows the one in Supplementary Table S1, where all underlying data can be found.
Si contents in husk samples were generally higher than in straw samples (Figure 3). While ICP-OES measurements revealed Si contents ranging from 8.5 to 19.5 mg g−1 and 3.2–7.8 mg g−1 (excluding outliers) for husk and straw samples, respectively, MP-AES measurements showed ranges of 8.2–19.9 mg Si g−1 and 3.0–7.5 mg Si g−1 for these husk and straw samples, respectively.
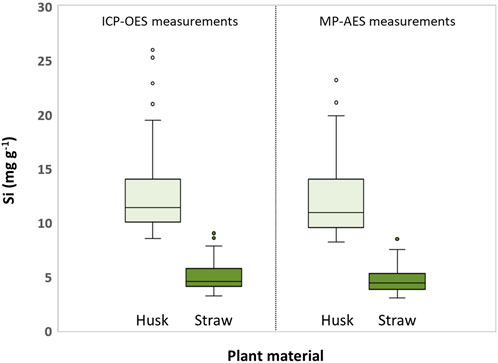
Figure 3. Boxplots of Si contents in husk and straw samples of winter wheat obtained from ICP-OES and MP-AES measurements. Circles indicate outliers.
This was also reflected by phytolith contents, which were strongly correlated (p ≤ 0.001) to Si contents in husk and straw samples (Table 1). Phytolith contents in husk and straw samples ranged from 19.1 to 48.2 mg g−1 and 6.0–17.9 mg g−1 (excluding outliers), respectively (Figure 4). Plant available Si concentrations in corresponding soil samples ranged from 6.6 to 11.6 mg kg−1 (Figure 4). While we found no correlations between plant available Si in soils and Si contents in straw samples at all, weak monotonic correlations (p ≤ 0.03) between plant available Si in soils and husk samples were revealed (Table 1).
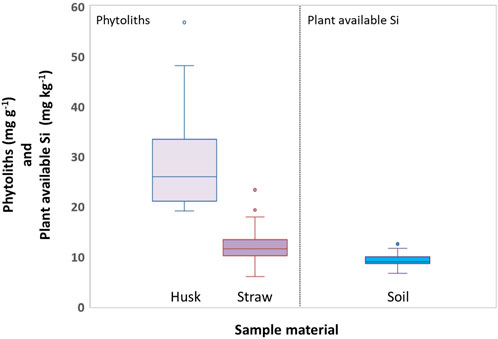
Figure 4. Boxplots of phytolith contents in husk and straw samples of winter wheat (left) and concentrations of plant available Si in corresponding soil samples (right). Circles indicate outliers.
Discussion
In general, our results proved MP-AES to reliably measure Si concentrations in plant extracts. Regarding variations of MP-AES and ICP-OES results between husk and straw samples two potential causes can be discussed: i) sample-specific and ii) instrument-specific differences.
Sample-specific differences refer to potential Si fluctuations in husk and straw samples (i.e., Si content heterogeneity) and differences in the Si extraction efficacy between these samples caused by differences in phytolith compositions. Based on our results we can exclude a statistically significant Si content heterogeneity in husk and straw samples. In fact, MP-AES and ICP-OES results matched considerably better for husk than straw samples, with husk samples generally showing more pronounced fluctuations (indicated by a bigger range) in Si contents than straw samples. This is underlined by the fact that the ranges in Si contents of husk and straw samples measured by ICP-OES and MP-AES were almost identical. In a previous study Puppe et al. (2023) found differences in the Si extraction efficacy between husk and straw samples of winter wheat, which were also ascribed to differences in the proportion of cell wall and lumen phytoliths in these samples (Puppe et al., 2022). While cell wall phytoliths are associated with a carbohydrate matrix, lumen phytoliths seem to contain more proteins and glycoproteins than cell wall phytoliths making cell wall phytoliths more stable than lumen phytoliths (Hodson, 2016; 2019). As sample-specific differences in the Si extraction efficacy would have led to a stochastic distribution of δSi values, i.e., a roughly balanced relation of positive and negative δSi values, we exclude sample-specific differences as drivers of the observed phenomenon. However, our data rather indicated a general trend in δSi values, which were positive (i.e., ICP-OES results were slightly higher) in about 86% and negative (i.e., MP-AES results were slightly higher) in only about 14% of the plant samples. This general trend clearly indicates an instrument-specific cause for the obtained results.
In general, in emission spectroscopy atoms/molecules are excited in a high-temperature flame or plasma and photons emitted during transition from an excited state to a lower energy state are measured by use of an electronic detector, whereby emission intensity is directly proportional to the analyte concentration in the sample. An inductively-coupled plasma (ICP) is generated from argon gas reaching temperatures of about 10,000 K, which is hotter than the surface of the sun, providing a powerful source for atomizing, ionizing, and exciting analytes (Wilschefski & Baxter, 2019). In contrast, a microwave plasma (MP) is generally lower in temperature than an ICP making MP-AES measurements potentially more prone to matrix effects, which can distort the signal of the analyte. Matrix effects are caused by concomitant chemical species like easily ionizable elements (e.g., sodium (Na)) or highly concentrated inorganic acids (Santos et al., 2020; Todolí et al., 2002; Zhang & Wagatsuma, 2002). Thus, we ascribe the observed differences between ICP-OES and MP-AES measurements to matrix effects caused by the disodium salt Tiron (C6H4Na2O8S2), which was used as extractant in our study. Some researchers used hydrogen peroxide (H2O2) to reduce potential matrix effects in ICP-induced emission spectroscopy measurements (Guntzer et al., 2010). However, Kodama and Ross (1991) found that the destruction of Tiron prior to spectroscopic analyses is not necessary to obtain reliable results, a finding that is underpinned by our long-term laboratory experience with Tiron extractions and corresponding results (Puppe et al., 2023). In fact, the adjustable device settings (e.g., the nebulizer flow rate adjustment or the analytical wavelength selection, see Fontoura et al. (2022)) allowed us an improved MP-AES performance with negligible interferences, which is well-reflected in our results showing a mean level of achievement of 95% (cf. Figure 2).
Our correlation analyses showed that phytolith contents in plant samples were highly, linearly correlated to corresponding total Si contents in these samples determined by MP-AES (cf. Table 1). In this context, it should be noted that the detection of relationships between phytolith contents in plant samples and corresponding total Si contents is hampered by the fact that Si in plants is not only represented by extractable phytoliths, but also by fragile silica structures (Meunier et al., 2017; Puppe et al., 2017), which are not covered by phytolith extraction techniques. As the majority of phytogenic silica might be stored in these fragile structures, current phytolith extraction techniques (ashing, acid digestion) thus might strongly underestimate the ‘real’ Si content of plants, which in turn hampers the proper interpretation of the role of phytoliths in plant-soil systems (Kaczorek et al., 2019; Puppe et al., 2017). In this context, the simultaneous quantification of total Si contents and extraction of phytoliths can be used to quantify both the fragile silica and the extractable phytolith fractions in plant samples. For the grasses Calamagrostis epigejos and Phragmites australis, for example, Puppe et al. (2017) showed that 16.4% and 15.9% of total Si were stored in extractable phytoliths >5 μm, respectively. For American beech (Fagus grandifolia) Wilding and Drees (1971) reported that about 72% of extractable leaf phytoliths were smaller than 5 μm. We clearly need more research on fragile silica structures and extractable phytoliths to understand their roles in biogeochemical Si cycling. However, in this context it should be kept in mind that there are also silica structures on a nanometer scale in plants that might be relatively stable in soils (Watteau & Villemin, 2001).
The difficulty in interpreting phytogenic silica contents and corresponding relationships with soil Si fractions is also indicated by the weak and insignificant correlations between phytoliths extracted from plant samples and plant available Si concentrations in corresponding soil samples in our study. Indeed, the correlation was stronger when plant available Si concentrations in soils were correlated to (total) Si contents determined spectroscopically, even if the correlations were statistically significant only for husk samples (Table 1). For straw samples, which showed lower Si contents than husk samples, no statistically significant correlations were detectable at all in our study. In general, relationships between plant available Si concentrations in soils and Si contents in plants are quite complex, because plant-specific Si uptake rates and plant available Si concentrations in soils can be highly variable as they are controlled by several factors. While plant Si uptake rates are related to phylogeny, growth stage, and Si availability in soils (Hodson et al., 2005; Ma et al., 1989; Schaller et al., 2022), Si concentrations in soils are controlled by physicochemical soil properties (e.g., soil pH, texture, or adsorption capacity) and biological factors like vegetation and biogenic silica contents in soils (Cornelis & Delvaux, 2016; Haynes, 2014; Schaller et al., 2021). Due to this complexity, studies of soil-Si-plant-Si relationships often show inconsistent results. Generally, studies that cover several study sites with different soil types and widely varying physicochemical soil properties report close relationships between plant Si contents and plant available Si concentrations in soils (Korndörfer et al., 2001; Miles et al., 2014). In contrast, studies limited on few or only one study site often show ambiguous results (Keeping, 2017; Klotzbücher et al., 2017; Puppe et al., 2023).
Moreover, the method of determination of plant available Si concentrations in soils can affect the interpretation of corresponding results. In fact, plant available Si (i.e., monosilicic acid, H4SiO4) has been traditionally determined by molybdenum blue colorimetry (Babu et al., 2016; Jones & Handreck, 1965; Winslow et al., 1997), which is based on the observation that only monosilicic acid reacts immediately (in contrast to polysilicic acids) with molybdic acid forming a blue Si-molybdate complex (Govett, 1961). Contrary, emission spectroscopy like ICP-OES or MP-AES might overestimate plant available Si concentrations in soils, because this technique also measures polysilicic acid. However, such an overestimation seems to be negligible in most extractants indicating that emission spectroscopy is generally well-suited for the determination of plant available Si concentrations in soils (Wang et al., 2004; Zellner et al., 2015).
In summary, we conclude that MP-AES is a suitable atomic emission spectrometry technique for the reliable determination of Si concentrations in Tiron extracts. Since ICP-OES and MP-AES results in our study showed only slight, statistically insignificant differences, we found matrix effects in MP-AES measurements caused by Tiron to be generally negligible. As MP-AES is more cost-effective compared to the de facto standard technique ICP-OES regarding investment and running costs, MP-AES represents a promising alternative for all researchers with a focus on biogeochemical Si cycling in general. However, as our study was limited to plant materials with Si contents of about 0.3%–2%, future research should confirm the suitability of MP-AES for Si determinations of plant materials with Si contents beyond this range.
Materials and methods
Plant and soil sampling
In total we used 42 retained winter wheat (T. aestivum, cultivar JB Asano, comprising 21 husk and 21 corresponding straw samples) and corresponding 21 soil samples for the current study. Winter wheat samples were taken in 2018 from an ongoing long-term field experiment in NE Germany (Puppe et al., 2021). Plant samples were washed to remove adhering soil minerals, oven-dried at 45°C for 48 h, and subsequently separated into straw, grain, and husk. The different plant materials of winter wheat were separately homogenized using a knife mill (Grindomix GM 200, Retsch) in two steps: i) for 1 min at 4,000 rpm and ii) for 3 min at 10,000 rpm. Soil samples were also taken in 2018 at the identical plots of plant sampling (see Puppe et al. (2021) for details) and were air dried and sieved (2 mm) previous to the extraction of plant available Si.
Phytolith extraction
Phytoliths were extracted from husk and straw samples by ashing following a protocol modified from Puppe and Leue (2018): i) 2.5 g of dry plant material was weighed, ii) to combust organic matter the plant samples were heated in a muffle furnace for 6 h at 450°C, iii) residual organic matter was oxidized using H2O2 (30%) and HNO3 (65%) at 80°C until the reaction subsided, iv) hot HCl (10%, 30 min, 80°C) was used to dissolve carbonates, and v) the obtained phytoliths were washed with distilled water, dried at 105°C, and weighed.
Extractions of Si from plant and soil samples
To avoid any potential Si contamination only plastic equipment was used during the entire laboratory work. Tiron extraction followed the method developed by Biermans and Baert (1977) and modified by Kodama and Ross (1991). It has been used to quantify amorphous biogenic and pedogenic Si (Kendrick & Graham, 2004), although a partial dissolution of primary minerals is well known (Kodama & Ross, 1991; Sauer et al., 2006). The extraction solution was produced by dilution of 31.42 g Tiron with 800 mL of distilled water, followed by addition of 100 mL sodium carbonate solution (5.3 g Na2CO3 plus 100 mL distilled water) under constant stirring. The final pH of 10.5 was reached by adding small volumes of a 4 M NaOH solution. For the extraction, 30 mg of plant samples were weighed into 50 mL centrifuge tubes and a 30 mL aliquot of the Tiron solution was added. The tubes were then heated at 85°C in a water bath for 1 h. The samples were gently shaken by hand twice, one time directly before heating and one time after 30 min in the heated water bath. Finally, the extracted solutions were centrifuged at 4,000 rpm for 30 min and filtrated (0.45 μm polyamide membrane filters, Whatman NL 17) before ICP-OES and MP-AES measurements.
Plant available Si in soil samples was extracted in the course of the study of Puppe et al. (2021) following the procedures described by Haysom and Chapman (1975) and de Lima Rodrigues et al. (2003). Two-gram samples of soil were placed in 50 mL plastic centrifuge tubes, mixed with 20 mL of a 0.01 M calcium chloride (CaCl2) solution, and agitated continuously on a swivel roller mixer for 16 h. Finally, the extracted solutions were centrifuged at 4,000 rpm for 30 min and filtrated using 0.45 μm polyamide membrane filters (Whatman NL 17) before ICP-OES measurements.
ICP-OES and MP-AES measurements
ICP-OES measurements of Si concentrations in Tiron and CaCl2 extracts were performed at the ZALF Central Laboratory using an ICP-iCAP 6300 Duo spectrometer (Thermo Fisher Scientific Inc.) and internal calibration standards made from a certified reference material (i.e., Certipur Si ICP Standard, Merck). Accuracy and long-term repeatability of Si concentration measurements via ICP-OES were systematically monitored. The ICP-OES detection limit was 2.3 μg L−1, the analytical measurement precision was ±1.3% (Table 2). All analyses were performed in two lab replicates and three single ICP-OES measurements were performed per replicate resulting in six single values (n = 6) for every tested sample. Blank samples (one blank sample per 20 plant/soil samples) were used to analyze Si concentrations in the extraction/digestion chemicals. Blank sample Si concentrations were subtracted from corresponding plant/soil sample Si concentrations before further calculations. Si contents in plant samples were calculated considering the weighed portion (30 mg), the extractant volume (30 mL), and the degree of dilution (1:10).
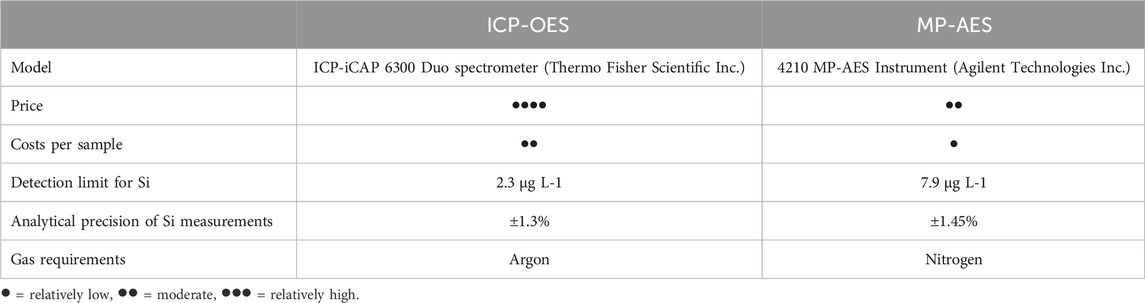
Table 2. Comparison between selected specifications of the ICP-OES and MP-AES instruments used for Si measurements in this study.
MP-AES Si measurements in the extracts were performed using a 4210 MP-AES instrument (Agilent Technologies Inc., Waldbronn, Germany) with internal calibration standards. Calibration standards for MP-AES measurements were prepared using Certipur Si ICP Standard solution (Merck) with a degree of dilution of 1:10 to avoid matrix effects. Si in solution was measured using its most sensitive atomic line with negligible spectral interferences at 288.158 nm, because atomic lines are generally less susceptible to matrix effects than ionic lines (Karlsson et al., 2015). All extracts were diluted 1:10 with deionized water to reduce the total dissolved solids in solution. As for ICP-OES measurements, all analyses were performed in two lab replicates and three single MP-AES measurements per replicate (n = 6). Blank sample Si concentrations were subtracted from sample Si concentrations and Si contents in plant samples were calculated as described for ICP-OES measurements. MP-AES Si measurement precision was 1.45% and the instrument detection limit was 7.9 μg L-1 (Table 2).
Statistical analyses
Linear and monotonic relationships in the data set were analyzed via Pearson’s (r) and Spearman’s rank (rs) correlations (α level of 0.05), respectively, using the software package SPSS Statistics (version 22.0.0.0, IBM Corp.).
Data availability statement
The original contributions presented in the study are included in the article/Supplementary Material, further inquiries can be directed to the corresponding author.
Author contributions
DP: Conceptualization, Formal analysis, Writing–original draft, Writing–review and editing. CB: Investigation, Writing–review and editing. DK: Investigation, Writing–review and editing. JS: Writing–review and editing. MS: Investigation, Writing–original draft, Writing–review and editing.
Funding
The author(s) declare that no financial support was received for the research, authorship, and/or publication of this article.
Acknowledgments
We would like to thank Kristina Holz (head of the ZALF Central Laboratory) and her team, especially Ellen Janiszewski, for ICP-OES analyses.
Conflict of interest
The authors declare that the research was conducted in the absence of any commercial or financial relationships that could be construed as a potential conflict of interest.
Publisher’s note
All claims expressed in this article are solely those of the authors and do not necessarily represent those of their affiliated organizations, or those of the publisher, the editors and the reviewers. Any product that may be evaluated in this article, or claim that may be made by its manufacturer, is not guaranteed or endorsed by the publisher.
Supplementary material
The Supplementary Material for this article can be found online at: https://www.frontiersin.org/articles/10.3389/fenvs.2024.1378922/full#supplementary-material
References
Babu, T., Tubana, B., Datnoff, L., Yzenas, J., and Maiti, K. (2016). Release and sorption pattern of monosilicic acid from silicon fertilizers in different soils of Louisiana: a laboratory incubation study. Communications in Soil Science and Plant Analysis 47 (12), 1559–1577. doi:10.1080/00103624.2016.1194995
Balaram, V. (2020). Microwave plasma atomic emission spectrometry (MP-AES) and its applications–A critical review. Microchemical journal 159, 105483. doi:10.1016/j.microc.2020.105483
Biermans, V., and Baert, L. (1977). Selective extraction of the amorphous Al, Fe and Si oxides using an alkaline Tiron solution. Clay Minerals 12, 127–135. doi:10.1180/claymin.1977.012.02.03
Cooke, J., DeGabriel, J. L., and Hartley, S. E. (2016). The functional ecology of plant silicon: geoscience to genes. Functional Ecology 30 (8), 1270–1276. doi:10.1111/1365-2435.12711
Cornelis, J. T., and Delvaux, B. (2016). Soil processes drive the biological silicon feedback loop. Functional Ecology 30 (8), 1298–1310. doi:10.1111/1365-2435.12704
de Lima Rodrigues, L., Daroub, S. H., Rice, R. W., and Snyder, G. H. (2003). Comparison of three soil test methods for estimating plant-available silicon. Communications in Soil Science and Plant Analysis 34 (15-16), 2059–2071. doi:10.1081/css-120024048
Delvigne, C., Guihou, A., Schuessler, J. A., Savage, P., Poitrasson, F., Fischer, S., Hatton, J. E., Hendry, K. R., Bayon, G., Ponzevera, E., et al. (2021). Silicon isotope analyses of soil and plant reference materials: an inter-comparison of seven laboratories. Geostandards and Geoanalytical Research 45 (3), 525–538. doi:10.1111/ggr.12378
Eltohamy, K. M., Milham, P. J., Gouda, M., Menezes-Blackburn, D., Khan, S., Liu, B., Jin, J., Ye, Y., and Liang, X. (2023). Size and composition of colloidal phosphorus across agricultural soils amended with biochar, manure and biogas slurry. Carbon Research 2 (1), 16. doi:10.1007/s44246-023-00048-2
Fontoura, B. M., Jofré, F. C., Williams, T., Savio, M., Donati, G. L., and Nóbrega, J. A. (2022). Is MIP-OES a suitable alternative to ICP-OES for trace element analysis?. Journal of Analytical Atomic Spectrometry 37 (5), 966–984. doi:10.1039/d1ja00375e
Govett, G. (1961). Critical factors in the colorimetric determination of silica. Analytica Chimica Acta 25 (1), 69–80. doi:10.1016/s0003-2670(01)81519-1
Guntzer, F., Keller, C., and Meunier, J. D. (2010). Determination of the silicon concentration in plant material using Tiron extraction. New Phytol 188 (3), 902–906. doi:10.1111/j.1469-8137.2010.03416.x
Haynes, R. J. (2014). A contemporary overview of silicon availability in agricultural soils. Journal of Plant Nutrition and Soil Science 177 (6), 831–844. doi:10.1002/jpln.201400202
Haynes, R. J. (2017). Significance and Role of Si in Crop Production. Advances in Agronomy 146, 83–166. doi:10.1016/bs.agron.2017.06.001
Haysom, M. B. C., and Chapman, L. S. (1975). Some aspects of the calcium silicate trials at Mackay. Proc. Aust. Soc. Sugar Cane Technol. 42, 117–122.
Hodson, M. J. (2016). The development of phytoliths in plants and its influence on their chemistry and isotopic composition. Implications for palaeoecology and archaeology. Journal of Archaeological Science 68, 62–69. doi:10.1016/j.jas.2015.09.002
Hodson, M. J. (2019). The Relative Importance of Cell Wall and Lumen Phytoliths in Carbon Sequestration in Soil: A Hypothesis. Frontiers in Earth Science 7. doi:10.3389/feart.2019.00167
Hodson, M. J., White, P. J., Mead, A., and Broadley, M. R. (2005). Phylogenetic variation in the silicon composition of plants. Ann Bot 96 (6), 1027–1046. doi:10.1093/aob/mci255
Isaacs, L. (1924). Presence of silicon in tissues. A micro-method for the determination of silicon. Bull. Soc. chim. biol 6, 157–168.
Jones, L., and Handreck, K. (1965). Studies of silica in the oat plant: III. Uptake of silica from soils by the plant. Plant and Soil 23, 79–96. doi:10.1007/bf01349120
Kaczorek, D., Puppe, D., Busse, J., and Sommer, M. (2019). Effects of phytolith distribution and characteristics on extractable silicon fractions in soils under different vegetation – An exploratory study on loess. Geoderma 356, 113917. doi:10.1016/j.geoderma.2019.113917
Karlsson, S., Sjöberg, V., and Ogar, A. (2015). Comparison of MP AES and ICP-MS for analysis of principal and selected trace elements in nitric acid digests of sunflower (Helianthus annuus). Talanta 135, 124–132. doi:10.1016/j.talanta.2014.12.015
Katz, O., Puppe, D., Kaczorek, D., Prakash, N. B., and Schaller, J. (2021). Silicon in the Soil-Plant Continuum: Intricate Feedback Mechanisms within Ecosystems. Plants (Basel) 10 (4), 652. doi:10.3390/plants10040652
Keeping, M. G. (2017). Uptake of Silicon by Sugarcane from Applied Sources May Not Reflect Plant-Available Soil Silicon and Total Silicon Content of Sources. Front Plant Sci 8, 760. doi:10.3389/fpls.2017.00760
Kendrick, K. J., and Graham, R. C. (2004). Pedogenic silica accumulation in chronosequence soils, Southern California. Soil Sci. Soc. Am. J. 68, 1295–1303. doi:10.2136/sssaj2004.1295
Klotzbücher, A., Klotzbücher, T., Jahn, R., Xuan, L. D., Cuong, L. Q., Van Chien, H., Hinrichs, M., Sann, C., and Vetterlein, D. (2017). Effects of Si fertilization on Si in soil solution, Si uptake by rice, and resistance of rice to biotic stresses in Southern Vietnam. Paddy and Water Environment 16 (2), 243–252. doi:10.1007/s10333-017-0610-2
Kodama, H., and Ross, G. J. (1991). Tiron dissolution method used to remove and characterize inorganic components in soils. Soil Sci. Soc. Am. J. 55, 1180–1187. doi:10.2136/sssaj1991.03615995005500040047x
Korndörfer, G. H., Snyder, G. H., Ulloa, M., Powell, G., and Datnoff, L. E. (2001). Calibration of Soil and Plant Silicon Analysis for Rice Production. Journal of Plant Nutrition 24 (7), 1071–1084. doi:10.1081/pln-100103804
Li, Z., Unzué-Belmonte, D., Cornelis, J.-T., Linden, C. V., Struyf, E., Ronsse, F., and Delvaux, B. (2019). Effects of phytolithic rice-straw biochar, soil buffering capacity and pH on silicon bioavailability. Plant and Soil 438 (1-2), 187–203. doi:10.1007/s11104-019-04013-0
Ma, J., Nishimura, K., and Takahashi, E. (1989). Effect of silicon on the growth of rice plant at different growth stages. Soil Science and Plant Nutrition 35 (3), 347–356. doi:10.1080/00380768.1989.10434768
Meunier, J. D., Barboni, D., Anwar-Ul-Haq, M., Levard, C., Chaurand, P., Vidal, V., Grauby, O., Huc, R., Laffont-Schwob, I., Rabier, J., and Keller, C. (2017). Effect of phytoliths for mitigating water stress in durum wheat. New Phytol 215 (1), 229–239. doi:10.1111/nph.14554
Miles, N., Manson, A. D., Rhodes, R., van Antwerpen, R., and Weigel, A. (2014). Extractable Silicon in Soils of the South African Sugar Industry and Relationships with Crop Uptake. Communications in Soil Science and Plant Analysis 45 (22), 2949–2958. doi:10.1080/00103624.2014.956881
Nakamura, R., Cornelis, J.-T., de Tombeur, F., Nakagawa, M., and Kitajima, K. (2020). Comparative analysis of borate fusion versus sodium carbonate extraction for quantification of silicon contents in plants. Journal of Plant Research 133 (2), 271–277. doi:10.1007/s10265-019-01162-2
Puppe, D., Höhn, A., Kaczorek, D., Wanner, M., Wehrhan, M., and Sommer, M. (2017). How big is the influence of biogenic silicon pools on short-term changes in water-soluble silicon in soils? Implications from a study of a 10-year-old soil–plant system. Biogeosciences 14 (22), 5239–5252. doi:10.5194/bg-14-5239-2017
Puppe, D., Kaczorek, D., Buhtz, C., and Schaller, J. (2023). The potential of sodium carbonate and Tiron extractions for the determination of silicon contents in plant samples—A method comparison using hydrofluoric acid digestion as reference. Frontiers in Environmental Science 11, 1145604. doi:10.3389/fenvs.2023.1145604
Puppe, D., Kaczorek, D., Schaller, J., Barkusky, D., and Sommer, M. (2021). Crop straw recycling prevents anthropogenic desilication of agricultural soil–plant systems in the temperate zone – Results from a long-term field experiment in NE Germany. Geoderma 403, 115187. doi:10.1016/j.geoderma.2021.115187
Puppe, D., and Leue, M. (2018). Physicochemical surface properties of different biogenic silicon structures: Results from spectroscopic and microscopic analyses of protistic and phytogenic silica. Geoderma 330, 212–220. doi:10.1016/j.geoderma.2018.06.001
Puppe, D., Leue, M., Sommer, M., Schaller, J., and Kaczorek, D. (2022). Auto-Fluorescence in Phytoliths—A Mechanistic Understanding Derived From Microscopic and Spectroscopic Analyses. Frontiers in Environmental Science 10. doi:10.3389/fenvs.2022.915947
Sangster, A., Hodson, M., and Tubb, H. (2001). Silicon deposition in higher plants. Studies in plant science 8, 85–113.
Santos, M. A., Silva, A. B. S., Machado, R. C., Dias, E. A., Barros, J. A., and Nogueira, A. R. A. (2020). Silicon determination by microwave-induced plasma optical emission spectrometry: Considerations and strategies for the use of tetrafluorboric acid and sodium hydroxide in sample preparation procedures. Spectrochimica Acta Part B: Atomic Spectroscopy 167, 105842. doi:10.1016/j.sab.2020.105842
Sauer, D., Saccone, L., Conley, D. J., Herrmann, L., and Sommer, M. (2006). Review of methodologies for extracting plant-available and amorphous Si from soils and aquatic sediments. Biogeochemistry 80 (1), 89–108. doi:10.1007/s10533-005-5879-3
Schaller, J., Puppe, D., Busse, J., Paasch, S., Katz, O., Brunner, E., Kaczoreck, D., and Sommer, M. (2022). Silicification patterns in wheat leaves related to ontogeny and soil silicon availability under field conditions. Plant and Soil 477 (1-2), 9–23. doi:10.1007/s11104-022-05385-6
Schaller, J., Puppe, D., Kaczorek, D., Ellerbrock, R., and Sommer, M. (2021). Silicon Cycling in Soils Revisited. Plants (Basel) 10 (2), 295. doi:10.3390/plants10020295
Todolí, J. L., Gras, L., Hernandis, V., and Mora, J. (2002). Elemental matrix effects in ICP-AES. Journal of analytical atomic spectrometry 17 (2), 142–169. doi:10.1039/b009570m
Volk, R. J., and Weintraub, R. L. (1958). Microdetermination of silicon in plants. Analytical Chemistry 30 (5), 1011–1014. doi:10.1021/ac60137a042
Wang, J. J., Dodla, S. K., and Henderson, R. E. (2004). Soil silicon extractability with seven selected extractants in relation to colorimetric and ICP determination. Soil Science 169 (12), 861–870. doi:10.1097/00010694-200412000-00005
Watteau, F., and Villemin, G. (2001). Ultrastructural study of the biogeochemical cycle of silicon in the soil and litter of a temperate forest. European Journal of Soil Science 52 (3), 385–396. doi:10.1046/j.1365-2389.2001.00391.x
Wilding, L. P., and Drees, L. R. (1971). Biogenic opal in Ohio soils. Soil Science Society of America Journal 35 (6), 1004–1010. doi:10.2136/sssaj1971.03615995003500060041x
Wilschefski, S. C., and Baxter, M. R. (2019). Inductively coupled plasma mass spectrometry: introduction to analytical aspects. The Clinical Biochemist Reviews 40 (3), 115–133. doi:10.33176/aacb-19-00024
Winslow, M. D., Okada, K., and Correa-Victoria, F. (1997). Silicon deficiency and the adaptation of tropical rice ecotypes. Plant and Soil 188, 239–248. doi:10.1023/a:1004298817861
Wu, W., Limmer, M. A., and Seyfferth, A. L. (2020). Quantitative assessment of plant-available silicon extraction methods in rice paddy soils under different management. Soil Science Society of America Journal 84 (2), 618–626. doi:10.1002/saj2.20013
Zellner, W., Friedrich, R. L., Kim, S., Sturtz, D., Frantz, J., Altland, J., and Krause, C. (2015). Continuing assessment of the 5-day sodium carbonate-ammonium nitrate extraction assay as an indicator test for silicon fertilizers. Journal of AOAC International 98 (4), 890–895. doi:10.5740/jaoacint.14-205
Keywords: silicon concentration, Si extraction, Tiron, plant available Si, ICP-OES, winter wheat (Triticum aestivum), phytoliths, biogeochemistry
Citation: Puppe D, Buhtz C, Kaczorek D, Schaller J and Stein M (2024) Microwave plasma atomic emission spectroscopy (MP-AES)—A useful tool for the determination of silicon contents in plant samples?. Front. Environ. Sci. 12:1378922. doi: 10.3389/fenvs.2024.1378922
Received: 30 January 2024; Accepted: 28 March 2024;
Published: 16 April 2024.
Edited by:
Martin John Hodson, Oxford Brookes University, United KingdomReviewed by:
Lúcia Barão, University of Lisbon, PortugalSong Fanhao, Chinese Research Academy of Environmental Sciences, China
Copyright © 2024 Puppe, Buhtz, Kaczorek, Schaller and Stein. This is an open-access article distributed under the terms of the Creative Commons Attribution License (CC BY). The use, distribution or reproduction in other forums is permitted, provided the original author(s) and the copyright owner(s) are credited and that the original publication in this journal is cited, in accordance with accepted academic practice. No use, distribution or reproduction is permitted which does not comply with these terms.
*Correspondence: Daniel Puppe, daniel.puppe@zalf.de
†ORCID: Daniel Puppe, orcid.org/0000-0003-3140-0528