Exploring a path of vegetation restoration best suited for a photovoltaic plant in the Hobq desert
 Jiale Cai1*
  Zhongju Meng1*
  Ruibing Meng1 Haonian Li1 Xiaoyan Chen2 Xiaomeng Ren3 Lijun Guo4 Meijun Hao4
- 1College of Desert Control Science and Engineering, Inner Mongolia Agricultural University, Hohhot, China
- 2Inner Mongolia Autonomous Region Academy of Social Science, Hohhot, China
- 3Inner Mongolia Institute of Meteorological Sciences, Hohhot, China
- 4Hangjin Banner Forestry and Grassland Business Development Center, Inner Mongolia, China
To investigate the soil improvement effects of different vegetation restoration measures during the operation and maintenance of photovoltaic power plants in the Hobq Desert. This study determined the soil grain size composition and soil nutrient content of 0–5 cm under four vegetation restoration measures and within the mechanical sand barriers by laser diffraction techniques and chemical experiments. The results showed that: (1) Soil particle size composition in the study area is predominantly sandy, with 1.02%, 6.63%, 5.34% and 2.61% less sand in Leymus chinensis (YC), Glycyrrhiza uralensis (GC), Artemisia ordosica Krasch (YH) and Hedysarum scoparium (HB), respectively, compared to mechanical sand barriers (CK). Soil particle distributions of YC, GC, and HB showed better sorting and more concentrated patterns, and all four vegetation restoration measures had higher fractal dimensions than CK. (2) AN (Alkali-hydrolyzable Nitrogen) content performance: The content of YC, GC, and HB was significantly higher than that of YH and CK, AP (Available Phosphorus) content did not differ significantly between measures, AK (Available Potassium) content was higher than that of CK in all measures, with YC content being the highest and SOM content being the highest for GC. (3) Soil total nutrient is unstable across vegetation restoration measures. Overall, the performance showed that the three vegetation restoration measures, YC, GC, and HB, were more evident in the soil total nutrient content improvement. Each particle size characteristic parameter and soil nutrient response vegetation restoration measures ameliorate sandy soil in PV power plants during operation and maintenance. YC and GC have the most apparent effect on soil amelioration.
Introduction
With global fossil energy consumption increasing and greenhouse gas (CO2) emissions rising every year A global warming worsens, the transition from traditional energy to new energy has become inevitable (Sinke, 2019). Faced with market demand, photovoltaics, a cleaner form of energy that is expected to occupy a significant place in energy development over the next decade, has made impressive progress in terms of scale of deployment, cost reductions, and performance improvements after several generations of updates, PV power generation technology is becoming more and more mature (El Chaar and El Zein, 2011; Lupangu and Bansal, 2017).
As one of the eight significant deserts in China, the Hobq Desert, with its vast area, low vegetation cover, and frequent and strong wind and sand activities, is the primary source of wind and sand sources in Beijing and Tianjin (Du et al., 2014; Ren et al., 2022). Therefore, it is necessary to adopt effective desert control and sand fixation methods in the Hobq Desert region according to local conditions. The construction of photovoltaic power plant in the desert not only effectively use the land but also can achieve the purpose of desert control, two birds with one stone. Yuan et al. (2022) found through their research that the erection of photovoltaic panels is conducive to transforming and consuming the power source of sandstorms and wind-sand flow in desert areas, reducing the occurrence of sandstorms. Photovoltaic development in desert areas changes the environment in which vegetation grows and increases surface roughness, providing new ideas for combating desertification. Chang et al. (2020) found that constructing photovoltaic panels in the desert can effectively reduce the role of high winds in the sand flow, prevent wind, and fix sand. Its effect is three times the effect of mechanical sand barriers. Photovoltaic panels of the rain effect can promote the growth of vegetation in the desert. Yue et al. (2021) found that the shaded portion of PV panels helped to reduce soil temperature and increase soil moisture. Wang et al. (2021) found that the erosion intensity without any restoration measures under the PV panels is significantly higher than with restoration measures and outside the PV plant. However, most scholars have found through research that the construction of photovoltaic power plants in desertified areas will accelerate the development of desertification if corresponding restoration measures are not constructed (Yue et al., 2021). Tang et al. (2021) found that large-scale photovoltaic power plants will accelerate the process of surface erosion in the power plant after the completion of the surface erosion process caused by the geomorphological changes seriously affect the production, operation, and maintenance of solar energy.
It is urgent to carry out vegetation ecological restoration and reconstruction measures in response to the destruction of the ecological environment in the sandy area during the construction of photovoltaic power plant projects and the prevention and control of sand damage in photovoltaic power plants. Previous studies have concluded that the construction of photovoltaic power plants is prone to erosion of the lower part of the panels. However, in desert areas where evaporation is more significant than rainfall, the rain-collecting effect of photovoltaic panels is precious. The reasonable tilt angle of the photovoltaic panels behind the panels can form a wind-blocking effect, which is more conducive to constructing measures to restore the vegetation in desert areas (Chang et al., 2020; Yue et al., 2021). Revegetation measures reduce the intensity of wind and sand activity, increase soil erosion resistance, and improve soil fertility (Huang, 2020). Soil properties directly influence the processes of vegetation growth, development and succession, and conversely, the processes of vegetation growth, development, and succession closely influence the physical and chemical properties of soils (Hong et al., 2006). Plant roots are intertwined in a network that improves soil structure and consolidates the soil; the biological crust makes the soil more stable and enhances the soil’s resistance to erosion (Zhang et al., 2006).
Therefore, adopting vegetation measures during the operation and maintenance of desert photovoltaic power plants is very effective, and the planting of vegetation in desertified areas is beneficial to desertification control efforts and can also bring local side income. Liu X. et al. (2020) found that the ecosystem service function provided by composite system land is 24 times higher than that of naturally restored land (Rodriguez-Pastor et al., 2023). Planting plants under photovoltaic panels during the hot season helps to reduce the module temperature and thus increases the power generation rate.
The above studies as well as the previous studies are mostly on the impact of PV panels on the environment and the impact of the environment on PV panels, etc., while there are relatively few studies on vegetation restoration measures and traditional sand fixation measures during the operation and maintenance period of desert PV power plants. Based on this study, this study takes several vegetation restoration measures such as planting Leymus chinensis (from now on referred to as YC), Glycyrrhiza uralensis (from now on referred to as GC), Artemisia ordosica Krasch (from now on referred to as YH), Hedysarum scoparium (from now on referred to as HB) under the PV panels in Yili 200 MP PV plant in Hobq Desert, and setting up local commonly used mechanical sand barriers (from now on referred to as CK) as a control group, YC, GC, YH, and HB are widely distributed in the Hobq Desert, and all are locally dominant species that play a significant role in fixing local mobile sands, and analyses different restoration techniques in terms of their physicochemical properties (Soil particle size characteristics, and soil nutrients), and combines them with the different vegetation’s growth habit, economic value, adaptability, and survival rate. The purpose of this study is to analyze different aspects and perspectives of different vegetation restoration techniques, such as growth habit, economic value, adaptability, and survival rate, in order to explore the most suitable path of vegetation restoration measures in the Hobq Desert PV power station and also to provide a theoretical basis for the restoration of other photovoltaic power stations, and contribute to the construction of the ecological environment.
Methods
Study area and patch characteristics
The study area is located in Yili Photovoltaic Ecological Park (40°26′7″N, 108°50′8″E), Duguitara Town, Hangjin Banner, Ordos City, Inner Mongolia Autonomous Region, with an altitude of 1103 m. It is in the northwestern part of Ordos City, spanning the Ordos Plateau and the Hetao Plain, and is situated in the transition zone of temperate arid steppe and desert steppe, and has the typical temperate continental climate, with the average annual temperature of 5°C–8°C; arid and little rain, spring drought every year, the average rainfall is 245mm, 60% of rainfall is concentrated in July - September, the average evaporation is 2720mm; the average annual wind speed is 3.0 m/s, generally seen in the spring, the maximum wind speed reaches 28.7 m/s, and accompanied by sandstorms, and the wind direction is dominated by the north-west wind. The study area was mostly flowing sandy land before restoration measures were taken; very rarely were Phragmites australis, Ammopiptanthus mongolicus, Agriophyllum squarrosum, and Tamarix chinensis Lour An overview map of the study area is shown in Figure 1 below.
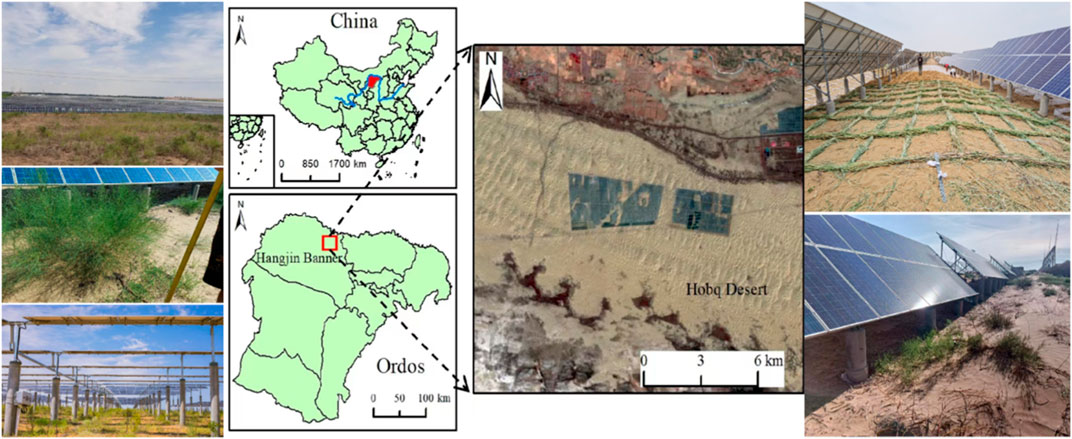
Figure 1. Overview map of the study area.
The angle of the photovoltaic panels to the ground is 36°, and a single set of photovoltaic panels consists of two rows and 18 columns of 1950 mm × 990 mm. The specification of the whole photovoltaic panel is 4 m × 18 m, and the height of the back edge of the panel from the ground is 2700 mm. The height of the front edge of the panel from the ground is 300 mm. The panels face south and run east-west, and the spacing between two neighbouring PV panels is 8 m. A schematic diagram of the PV plant is shown in Figure 2.
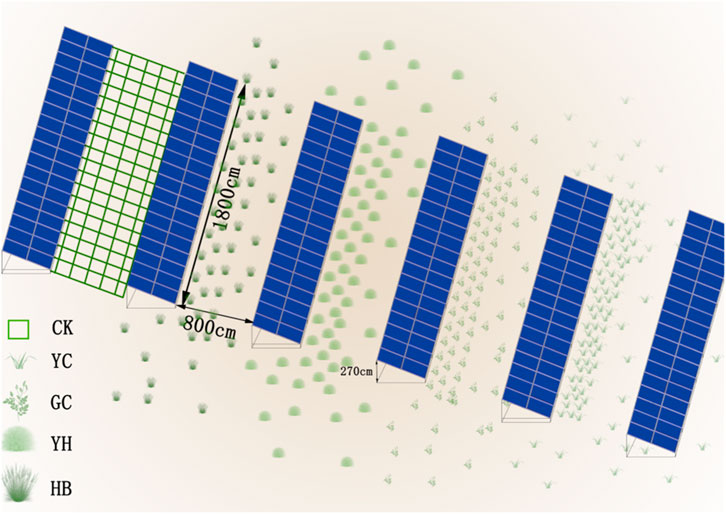
Figure 2. Schematic diagram of restoration measures within a photovoltaic power plant.
Research methodology
Experimental design and sample collection
Sample collection was carried out in June 2022. YC, GC, YH, HB, and CK, which are typical restoration measures in the sample area, were selected as the collection sites for the experimental samples, and five 1 m × 1 m sample squares were randomly selected from each sample area. Five points were selected from each sample square according to the five-point method. The soil sampling was carried out in the 0–5 cm soil layer after removing the dead debris and humus from the ground surface. Five samples obtained from each sample square were mixed equally, and the quadratic method selected enough soil samples. After removing surface litter and humus, soil samples were taken from the 0–5 cm soil layer; the five samples obtained from each sample square were mixed equally, and then enough soil samples were selected by the quadratic method and sealed in self-sealing bags and then put into ice boxes to be brought back to the laboratory. The soil inside the plastic bags was placed in a cool and dry place to be naturally air-dried and then sieved after drying. After removing the impurities, it was divided into two parts: characterizing the soil particle size and determining the soil nutrient content.
Measurement methods
Determination of soil mechanical composition: An Analysette 22 Micro-Tec Plus model laser particle sizer determined soil particle size composition. The classification was based on the grain size composition of the US-made soil: clayey (<2 μm), chalky (2–50 μm), very fine (50–100 μm), alumina (100–250 μm), medium (250–500 μm), coarse (500–1,000 μm), very coarse (1,000–2000 μm), and gravelly (>2000 μm). Screening outputs particle diameters corresponding to cumulative volume fractions of soil particles of 5 percent, 10 percent, 16 percent, 25 percent, 50 percent, 75 percent, 84 percent, 90 percent, and 95 percent for later calculations.
Using the Udden-Wenworth grain size criterion, a logarithmic transformation was performed according to Kumdein’s algorithm, which converted the previously output particle diameters corresponding to the cumulative volume fraction of each soil particle into Φ-values (Blair and McPherson, 1999), respectively, to facilitate subsequent calculations, the conversion equation is: where D is the diameter of soil particles.
The soil particle size parameters such as mean particle size (d0), standard deviation (σ0), skewness (SK) and kurtosis (Kg) were calculated based on the graphical method of Folk and Ward (1957). Determination of the volume content of different soil particle sizes using a laser particle sizer and characterization of the soil fractal model using the particle size volume distribution to calculate the fractal dimension (Armstrong, 1986; Ahmadi et al., 2011); the formula is:
Where: D is the fractal dimension; Ri denotes the measured soil particle size; Rmax is the diameter of the largest particle; V (r < Ri) is expressed as the volume percentage of soil grain size smaller than the measured grain size (Ri); Vt is expressed as the total volume percentage of the volume of each grain size of the soil.
Soil organic matter (SOM) content was determined using the potassium dichromate volumetric method with external heating (Nelson and Sommers, 1983); Quick-acting potassium (AK) by NH4OAc leaching-flame photometric method (Zheng and Zheng, 2022); Quick-acting phosphorus (AP) was determined by leaching with 0.5 mol-L-1NaHCO3, followed by spectrophotometric determination of the test solution (Munhoz et al., 2011); Alkaline nitrogen (AN) is determined by the alkaline diffusion method (Chen et al., 2016); Total Nitrogen (TN) was determined using the semi-micro Kjeldahl method (Kirk, 1950); Total phosphorus (TP) was determined by NaOH melting-molybdenum antimony colorimetric method (Bremner and Mulvaney, 1983); Total potassium (TK) was determined by NaOH melting and flame photometric method (Gao et al., 2018).
Processing and analysing data
Excel 2021 and Origin 2023 software were used to collate and analyze the data, as well as graphical work. SPSS 25 software was used to perform one-way ANOVA and principal component analysis on the data.
Results
Mechanical composition of soil particles under different vegetation restoration measures in a photovoltaic power plant
As can be seen from Table 1, the soil grain size composition of the five restoration measures in this study, YC, GC, YH, HB and CK, all showed a predominance of sand grains, were all above 90%, with CK having a significantly higher sand content than the other four restoration measures (p < 0.05); The content of sticky meal grains increased by 1.02%, 6.63%, 5.34% and 2.61% for the four restoration measures compared to CK, respectively; further analysis of the sand particles reveals that the YC wonderful sand is significantly lower than the other three restoration measures (p < 0.05), the acceptable sand content of YH was significantly lower than the other measures (p < 0.05), and the performance of the medium sand content did not differ significantly among the restoration measures (p > 0.05), the overall content of coarse and very coarse sand also showed higher (p < 0.05) for the YH restoration measure than for the other restoration measures. The sticky grain content of each restoration measure did not exceed 1%, except for GC, and showed a non-significant difference in sticky grain content under each restoration measure.
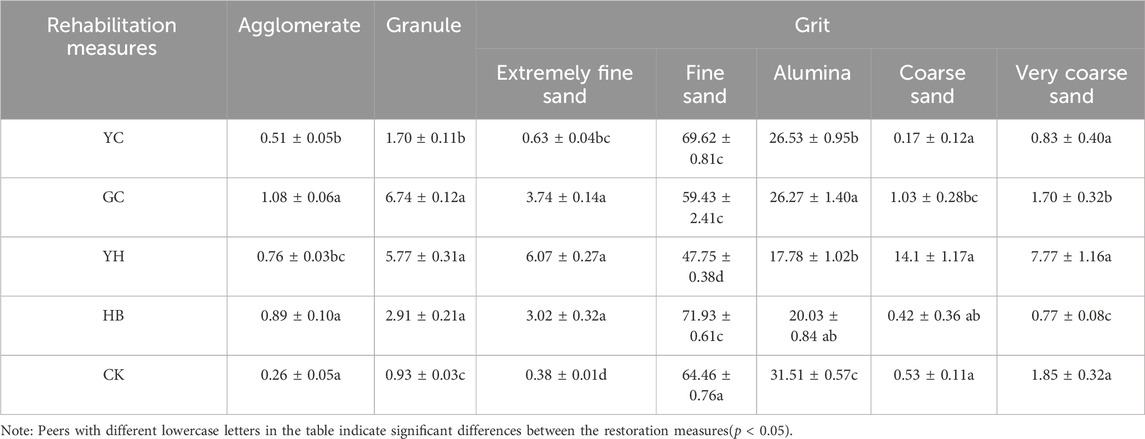
Table 1. Soil particle size content under different restoration measures.
Soil particle size parameters of different vegetation restoration measures in photovoltaic power plants
From Table 2, it can be seen that the mean particle size of all five restoration modes showed significant differences (p < 0.05), the YH recovery mode has the smallest average grain size, the HB recovery mode has the largest average grain size, and the HB recovery mode has the largest average grain size; According to the Folk Ward diagrammatic classification criteria, they belonged to chalk, fine sand, medium sand and coarse sand, respectively, and differed significantly (p < 0.05) from each other; The standard deviations were significantly different from each other (p < 0.05), with better sorting for YC and moderate sorting for GC and HB, YH and CK were poorly sorted; Significant differences (p < 0.05) were found between restoration measures for bias; Only YH was negatively biased for the five recovery measures, indicating that the grain size of YH was moving towards finer grains; In terms of peak state performance, GC was significantly higher than the other four measures (p < 0.05), and the difference between the other four was not significant (p > 0.05); The fractal dimension of CK was significantly lower (p < 0.05) than the other four vegetation restoration measures, indicating that the content of fine-grained material within CK was significantly lower than the other four restoration measures.
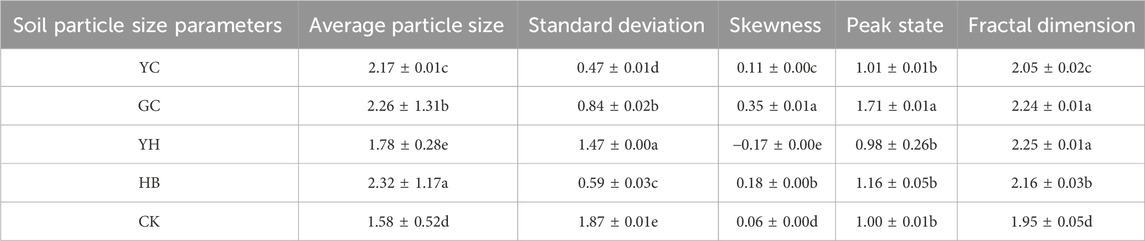
Table 2. Soil particle size parameters for different restoration models.
Scatter plots were produced with the soil particle size parameters of the four vegetation restoration measures and CK, respectively, which allowed direct observation of the distribution of soil particle size parameters in the five sample plots. From Figure 3., it can be seen that there are apparent boundaries between the two restoration measures of GC and YH and the restoration measures of YC and HB, which can be clearly distinguished by the scatter plots of each granularity parameter, and the difference between the two restoration measures of YC and HB is not significant, and the performance site is evident on d0-Kg and d0-D, and the rest of the plots can be clearly identified. From the scatter plot of particle size parameters, it can be seen that CK recovery measures have the most extensive distribution range of each particle size parameter, YC has the most concentrated distribution range, followed by GC, and YH and HB are worse.
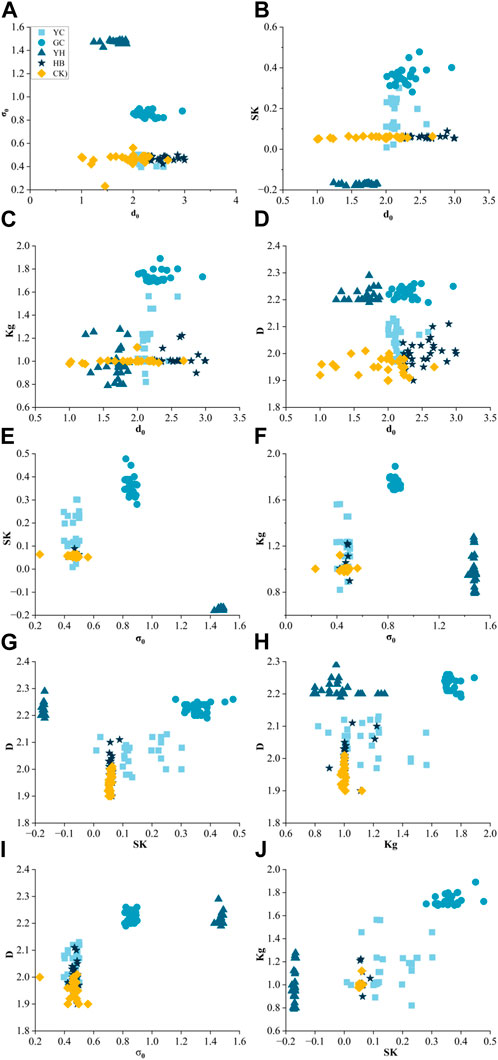
Figure 3. Scatter plot of particle size parameters. d0-σ0 (A), d0-SK (B), d0-Kg (C), d0-D (D), σ0-SK (E), σ0-Kg (F), σ0-D (G), SK-Kg (H), SK-D (I), Kg-D (J).
Soil particle frequency distribution curves for different vegetation restoration measures in photovoltaic power plants
Soil particle frequency distribution curves are often used to analyze the size distribution of particles, not only to obtain the skewness, kurtosis, and other information qualitatively but also to determine the deposition dynamics of the particles and the source of the material from the peak properties of the curve. Particle distribution curves were made with the mean surface soil particle size of the four vegetation restoration measures and the control group (CK), respectively. It can be seen that there are differences between the samples, among which there are apparent differences between the YH restoration measure and the other samples, with the YH restoration measure showing a bimodal state and the remaining four samples showing an unimodal state. Soil particle size was concentrated near 200–300 μm in the single peak state, and the first part of the double peak state was concentrated near 200–300 μm. It appeared in the second peak state near 1,000 μm, and before 100 μm, several restoration measures, YC, GC, HB, and CK, were slightly lower than YH restoration measures. It can be found that the content of clayey silt and wonderful sand of YH is higher than that of other measures, and the content of coarse sand and very coarse sand of other measures is significantly lower than that of YH, which is also more resistant to wind erosion, it can also be seen that YH is less concentrated in particle size than the other three measures. The cumulative frequency distribution curve can reflect the distribution of soil particles; generally, the steeper the curve, the more uniform the distribution of particles; at the same time, it can characterise the proportion of soil particles. As can be seen from Figure 4, the soil particle uniformity of YC, GC, and HB in the sample plot was higher than that of YH, and the curve suddenly became steeper at 100 μm and smoother at 500 μm, indicating that the soil particle size characteristics were concentrated in the range of 100–500 μm. Moreover, near 400 μm, the YH restoration measure became flat and less steep than the remaining four measures, indicating that YH is less sortable and homogeneous than the other four vegetation restoration measures. The cumulative frequency curve of soil particles also showed that coarse and very coarse sand content was significantly higher in YH than in CK, YC, GC and HB.
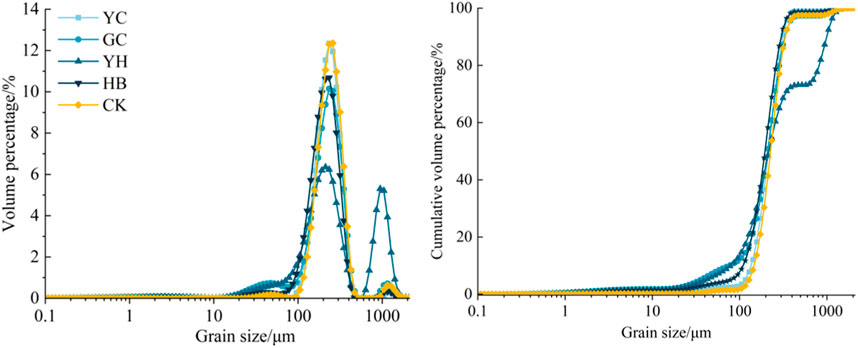
Figure 4. Scatter plot of particle size parameters.
Soil available nutrient content under different vegetation restoration measures in photovoltaic power stations
Figure 5 shows that the content of available nutrients between the PV array panels of all four vegetation restoration measures has been improved to different degrees compared with the traditional sand fixation measures. Specifically, the AK content of the four vegetation restoration measures as a whole was significantly higher than that of CK, and the AK content of YC was the highest, and the AK content of YC was the highest; several other restoration measures had significantly lower AK levels than YC. In terms of AP content performance, only the HB restoration measure was comparable to the other three restoration measures and CK; there were individual groups of CK that had higher AP content than the HB recovery measure, and YC and GC were stable in AP content and did not differ significantly from each other; The content of AN was shown to be significantly higher than that of CK for all four vegetation restoration measures, with YC, GC, and HB showing the most significant. Figure 3 shows that the combined quick nutrient content YH of the four vegetation restoration measures was not significantly different from each other. However, each of them was not high, while the other three restoration measures all showed significant differences among the three available nutrient contents.
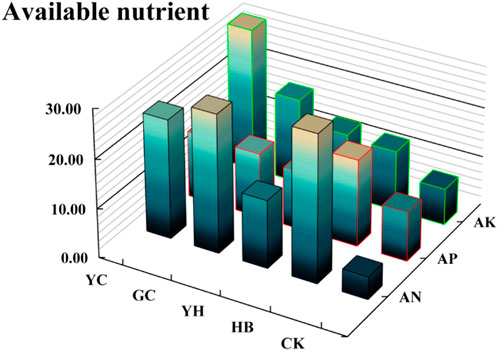
Figure 5. Soil available nutrient content of different restoration measures.
Soil total nutrient and organic matter content under different restoration measures in a photovoltaic power plant
From Figure 6, it can be found that the SOM content of GC > HB > YC>CK > YH, only the SOM content of YH was reduced by 34.51% compared with that of CK. The remaining three types of vegetation restoration measures were enhanced by 45.49%, 365.49%, and 148.63%, respectively, compared with that of CK. There were apparent differences between the vegetation restoration measures and CK, most evident in GC. TN content of GC and HB was significantly higher than that of the other two vegetation restoration measures and CK, the minimum content of YC and YH was even lower than that of CK, the median was also lower than that of CK, and the spacing between the upper edge and the lower edge was lower than that of CK, the unique values of the four vegetation restoration measures and CK were within the confidence interval, the figure showed the TN content of soil of the four vegetation restoration measures, and the TN content of soil of the three restoration measures increased by 45.49%, 365.49% and 148.63% respectively compared with CK. The soil TN content of the four vegetation restoration measures was stable, as shown in the figure TP content was higher than that of CK in YC and HB, as shown in the box plot, in which the content of YC was higher than CK’s; although HB’s content was higher than CK’s, the difference was not noticeable. The soil TP content of GC and YH was significantly lower than that of CK, and the confidence interval of GC and YH was more significant than that of CK, which indicated that the distribution of the TP content of GC and YH was not as concentrated as that of CK. TK content was not as concentrated as that of CK. The TK contents of YC and CK were significantly higher than those of the other three vegetation restoration measures, with the lowest content in YH, and the total potash contents of GC and HB were in the range of 35–43 g/kg. The TK contents of GC, YH, and HB were 55.09%, 112.17%, and 74.42% less than those of CK.
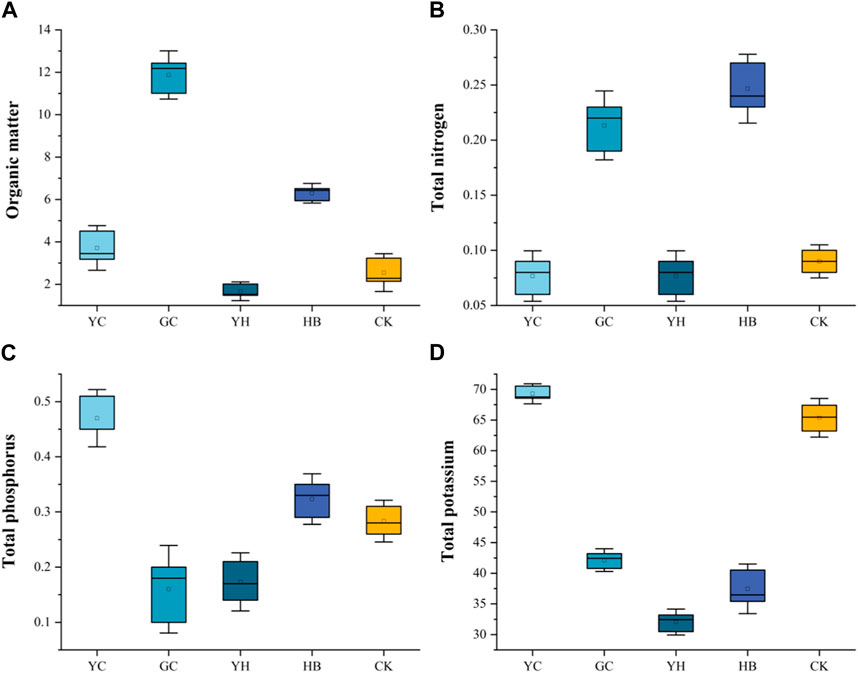
Figure 6. Organic matter (A), Total nitrogen (B), Total phosphorus (C), Total potassium (D).
Discussion
Effects of different restoration measures on soil particle size characteristics between photovoltaic panels
The PV power stations in the study area are subjected to severe wind erosion during operation and maintenance, and the desert area is windy and sandy, with frequent and intense wind and sand activities; during the wind and sand movement, the surface fine-grained material is lost, which leads to an increase in the content of coarse-grained material in the mechanical composition of the soil material, and the surface is coarsened significantly. Pan et al. (2020) found that vegetation can effectively improve the fine-grained tendency of soil and can increase the roughness of the ground surface. Similarly, in this study, the content of sticky and powdery particles in the mechanical sand barriers of the control group differed significantly from the remaining four vegetation restoration measures, and the content of the mechanical sand barriers was significantly lower than that of the four vegetation restoration measures. The higher the content of fine-grained matter, the more microporosity of the soil, the higher the complexity of the soil, and the greater the fractal dimension of the soil, indicating a decrease in the degree of sanding of the soil. Some scholars (Liu Y. et al., 2020) found that the content of fine-grained matter in soil particle size parameters under vegetation with high vegetation cover and lush foliage was significantly higher than that under vegetation with low vegetation cover and depression. Qi et al. (2018) found that the value of soil fractal dimension was significantly positively correlated with the content of clay and powder particles and significantly negatively correlated with the content of sand particles, indicating that the less clay and powder particles or the higher the proportion of sand particles in the soil, the higher the roughness and inhomogeneity of the soil particle composition. The results of this study found similar patterns to the above results, we found that the content of sticky and powdery particles in GC and YH was significantly higher than that of the other two restoration measures and CK. The fractal dimension was also higher than that of the other two vegetation restoration measures because the vegetation cover of GC and YH was higher than that of the other two vegetation restoration measures, and the branching and foliage of Chengdu were also higher. From the above findings, it was found that GC and YH were the most obviously fine-grained in terms of particle size characteristics and particle size parameter performance, and the trend of fine-graining was also more apparent.
Effect of different restoration measures on soil nutrients between PV panels
Different vegetation restoration measures mainly influenced the differences in soil nutrients between locations between photovoltaic panels. This study showed that with the restoration of soil vegetation, the degree of change of soil fast-acting soil nutrients was higher than that of full-acting nutrients, especially AN and AK, which indicated that soil fast-acting nutrients were more sensitive than full-acting nutrients to the changes in the restoration of the plant community, which was in line with the results of the previous study. As the number of years of vegetation restoration increased, more plant litter was returned to the soil due to vegetation restoration, which increased the organic matter content of the soil. Figure 3, 4 show that the quick-acting nutrient content of each vegetation restoration measure was higher than that of CK except for a few locations. However, each vegetation restoration measure’s full-acting nutrient and organic matter content was lower than CK’s. Huang et al. (2020) found that the content of soil nutrients increased significantly with the increase of restoration time. However, Weltzin and Coughenour (1990) found higher concentrations of nitrogen and organic carbon in shallow soils near tree trunks, suggesting a negative effect of nutrient inputs from tree trunks and shading on soil nutrient loss. It showed that vegetation can sometimes hurt the soil and that most of the surface soil nutrients under vegetation come from deadfall; therefore, it can be explained that the nutrient content of some of the vegetation restoration measures in this study was lower than that of CK, which may be due to the short years of vegetation restoration in this study or the loss of soil nutrients due to the shading effect of vegetation., Some scholars (Wu et al., 2020) found that vegetation degradation leads to a significant decrease in soil nutrients, and conversely, an increase in vegetation richness leads to an increase in soil nutrients. Combining the present study with the above studies, it can be seen that the adoption of vegetation restoration measures in PV power plants can effectively improve the soil nutrient content and play a positive role in the improvement of soil quality in PV power plants.
An investigation of the combined value of four vegetation measures within a photovoltaic power plant in the hobq desert
In this study, four types of local sandy vegetation were selected as restoration measures, aiming to find a green and long-lasting vegetation restoration measure during the operation and maintenance of PV power stations in the Hobq Desert. In order to prevent and control secondary sand damage during the operation of the PV plant, if it can be done to increase local income, it is just like the icing on the cake, and it can be done on the basis of green management to restore the vegetation and increase income. Leymus chinensis is rich in diversity and ecological adaptations, widely distributed in the inland areas of China, and is not only able to provide genetic material for forage improvement but also a potential contributor of genes for resistance to harsh environments (Wu et al., 2020). Glycyrrhiza uralensis it is an excellent medicinal herb, and in addition to its medicinal uses, Glycyrrhiza uralensis is a drought-tolerant and deep-rooted plant that is important for windbreaks, sand fixation, and soil formation in semi-arid ecosystems (Weltzin and Coughenour, 1990). Artemisia ordosica Krasch is a dry, deciduous, multi-stemmed shrub (Sha et al., 2014), and is a typical sandy half-shrub of the Maowusu Sand. It has dry, linear-lobed leaves that form scrubby sand mounds of about 0.5–1 m. Its primary roots reach up to 3 m below the surface, and it is endemic to Ordos in northern China, where it is absolutely dominant (Liu et al., 2007). Although its sand-fixing capacity is strong, and it was once fly-seeded over large areas in northwestern China, the pollen of Artemisia oleifera causes allergic rhinitis in residents (Li et al., 2021). Hedysarum scoparium has the characteristics of sand burial, wind erosion resistance, and strong sprouting capsule force, which is widely used for windbreak and sand fixation, and it is one of the excellent pioneer tree species in creating windbreak and sand fixation forests in desert areas (Kobayashi et al., 1995). It is a perennial shrub, which is the main tree species for windbreak and water retention. It is resistant to wind erosion and sand burial, and after sand burial, it can rapidly sprout adventitious roots with substantial windbreak and sand fixation. its horizontal root system is well developed, so it is suitable for flowing sand areas (Xiao et al., 2020). Although the Hedysarum scoparium is suitable for flowing sand if planted in the photovoltaic power station, with the growth of the recovery years, the plant height and crown width of the flower stick will increase, which will be involved in the later stage will be shading photovoltaic panels and the later flat stubble maintenance and so on.
In this study area, the four vegetation restoration measures and the control group (mechanical sand barriers) were planted individually, and no mixed planting was used. From this study, combined with the correlation of hot map (Figure 7), it was found that most of the soil physicochemical properties in this study area showed a positive correlation, with a positive correlation accounting for 72.2% of the total, which indicated that the soil physicochemical properties were in a certain degree in mutual constraints; A few showed negative correlations and only AN and TN stood out in terms of very positive correlations. The results of this study showed that none of the restoration measures were outstanding in terms of physical and chemical properties but only in one or more of the indicators. Based on the above studies, we can infer that planting vegetation under the inter-slabs of photovoltaic panels with a mixed vegetation planting method will be superior to planting a single species (Li, 2022). Rodríguez-Loinaz et al. (2008) found that soil physicochemical properties showed a positive correlation with biodiversity through her research, and the species richness of herbaceous plants showed a significant positive correlation with the functional diversity of soil. Some scholars (Chandra et al., 2016) the results of the study showed that in oak marriages located in the temperate zone, the soil carbon, nitrogen, and phosphorus contents were relatively high, as well as the microbial activity.
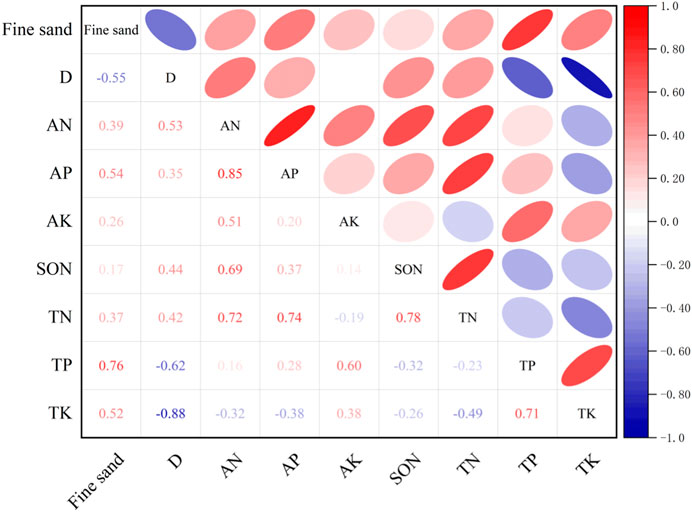
Figure 7. Heat map of soil physical and chemical properties.
Conclusion
(1) The following conclusions were reached by analyzing the soil particle size characteristics and soil nutrients within the four vegetation restoration measures and the control group (grass square sand barriers) during the operation and maintenance of the Hobq Desert PV plant:
(2) The soil particle size distribution in the study area was concentrated, with sand grains dominating. The percentage of sand grains of the four vegetation restoration measures was reduced compared with CK by 1.02%, 6.63%, 5.34%, and 2.61%, respectively. YC, GC, and HB were better sorted, and their distribution was more concentrated; the fractal dimension of the four vegetation restoration measures was higher than that of CK.
(3) The AP content of each vegetation restoration measure was slightly higher than that of HB, and the difference in content between several other restoration measures was not apparent; the AN content of YC, GC, and HB was significantly higher than that of YH and CK; and the AK content of the four vegetation restoration measures was higher than that of CK, of which YC had the highest content. Regarding the performance of SOM content, the content of GC was the highest, the content of YC and HB was also higher than that of CK, and only YH was lower than that of CK.
In terms of allosteric nutrient performance, the TN content of GC and HB was higher than that of CK, and the remaining two restoration measures were more minor than or close to CK; the TN content was significantly higher only for YC than that of CK, and the remaining three restoration measures were lower than CK, with some individual contents close to CK. The content of TP was higher only for goatgrass than that of CK, and the remaining three measures were significantly lower than that of CK. Combined with the soil particle size composition, particle size parameters, and soil nutrient content, the development of fine-grained soil and the accumulation of soil nutrients indicate that YC and GC are more suitable for the PV plant in the study area. Vegetation restoration measures in the study area have begun to have an effect, and the unique habitat characteristics formed by the PV power plant, which are different from the local environmental background, are essential for the development of local production.
Data availability statement
The original contributions presented in the study are included in the article/Supplementary material, further inquiries can be directed to the corresponding authors.
Author contributions
JC: Conceptualization, Data curation, Formal Analysis, Methodology, Writing–original draft, Writing–review and editing. ZM: Conceptualization, Methodology, Supervision, Writing–review and editing, Writing–original draft. RM: Data curation, Investigation, Methodology, Writing–review and editing. HL: Conceptualization, Supervision, Validation, Writing–review and editing. XC: Conceptualization, Formal Analysis, Resources, Writing–review and editing. XR: Conceptualization, Formal Analysis, Investigation, Resources, Validation, Writing–review and editing. LG: Project administration, Funding acquisition, Writing–review and editing. MH: Supervision, Investigation, Writing–review and editing.
Funding
The author(s) declare that financial support was received for the research, authorship, and/or publication of this article. This research was funded by Desert Ecosystem Conservation and Restoration Innovation Team (BR22-13-03) Research on integrated technology for sand control in photovoltaic power plants (2022EEDSKJZDZX020-4). Commercialization of Scientific and Technological Achievements in Inner Mongolia Autonomous Region (2020CG0066).
Conflict of interest
The authors declare that the research was conducted in the absence of any commercial or financial relationships that could be construed as a potential conflict of interest.
Publisher’s note
All claims expressed in this article are solely those of the authors and do not necessarily represent those of their affiliated organizations, or those of the publisher, the editors and the reviewers. Any product that may be evaluated in this article, or claim that may be made by its manufacturer, is not guaranteed or endorsed by the publisher.
References
Ahmadi, A., Neyshabouri, M. R., Rouhipour, H., and Asadi, H. (2011). Fractal dimension of soil aggregates as an index of soil erodibility. J. Hydrology 400 (3-4), 305–311. doi:10.1016/j.jhydrol.2011.01.045
Armstrong, A. C. (1986). On the fractal dimensions of some transient soil properties. J. soil Sci. 37 (4), 641–652. doi:10.1111/j.1365-2389.1986.tb00393.x
Blair, T. C., and McPherson, J. G. (1999). Grain-size and textural classification of coarse sedimentary particles. J. Sediment. Res. 69 (1), 6–19. doi:10.1306/d426894b-2b26-11d7-8648000102c1865d
Bremner, J. M., and Mulvaney, C. S. (1983). Nitrogen—total. Methods of soil analysis: part 2 chemical and microbiological properties 9, 595–624.
Chandra, L. R., Gupta, S., Pande, V., and Singh, N. (2016). Impact of forest vegetation on soil characteristics: a correlation between soil biological and physico-chemical properties. 3 Biotech. 6 (2), article188. doi:10.1007/s13205-016-0510-y
Chang, Z., Liu, S., Fu, J., Wang, Q., Wang, F., Sun, T., et al. (2020). Effect of desert photovoltaic on sand prevention and control—taking Gansu Gulang Zhenfa photovoltaic DC field as an example. IOP Conf. Ser. Earth Environ. Sci. 601 (1), 012032. doi:10.1088/1755-1315/601/1/012032
Chen, B., Yang, H., Song, W., Liu, C., Xu, J., Zhao, W., et al. (2016). Effect of N fertilization rate on soil alkali-hydrolyzable N, subtending leaf N concentration, fiber yield, and quality of cotton. Crop J. 4 (4), 323–330. doi:10.1016/j.cj.2016.03.006
Du, H., Xue, X., and Wang, T. (2014). Estimation of saltation emission in the kubuqi desert, north China. Sci. Total Environ. 479, 77–92. doi:10.1016/j.scitotenv.2014.01.095
El Chaar, L., and El Zein, N. (2011). Review of photovoltaic technologies. Renew. Sustain. energy Rev. 15 (5), 2165–2175. doi:10.1016/j.rser.2011.01.004
Folk, R. L., and Ward, W. C. (1957). Brazos river bar: a study in the significance of grain size parameters. J. Sediment. Petrology 27 (1), 3–26. doi:10.1306/74d70646-2b21-11d7-8648000102c1865d
Gao, T., Gao, M., Peng, J., and Li, N. (2018). Effects of different amount of biochar on nitrogen, phosphorus and potassium nutrients in soil. IOP Conf. Ser. Mater. Sci. Eng. 394 (2), 022043. doi:10.1088/1757-899x/394/2/022043
Hong, C., Tao, X., and Chun, T. (2006). Overview of mechanism of plant roots improving soil reinforcement and slope stabilization. Bull. Soil Water Conservation 26 (1), 97–102.
Huang, B. (2020). Analysis of soil physical and chemical properties undertypical plant communities in the southeast margin of the MuUs Sandy land. Xi’an: Xi’an University of Science and Technology.
Huang, C., Zeng, Y., Wang, L., and Wang, S. (2020). Responses of soil nutrients to vegetation restoration in China. Reg. Environ. Change 20, 82–12. doi:10.1007/s10113-020-01679-6
Kirk, P. L. (1950). Kjeldahl method for total nitrogen. Anal. Chem. 22 (2), 354–358. doi:10.1021/ac60038a038
Kobayashi, T., Liao, R. T., and Li, S. Q. (1995). Ecophysiological behavior of Artemisia ordosica on the process of sand dune fixation. Ecol. Res. 10, 339–349. doi:10.1007/bf02347860
Li, Q. (2022). Stumping for rejuvenation of hedysarum scoparium plantationin minqin desert area. Shaanxi For. Sci. Technol. 50 (06), 12–16.
Li, X., Yu, M. H., Ding, G. D., He, Y., Liu, W., and Wang, C. Y. (2021). Soil biocrusts reduce seed germination and contribute to the decline in Artemisia ordosica Krasch. shrub populations in the Mu Us Sandy Land of North China. Glob. Ecol. Conservation 26, e01467. doi:10.1016/j.gecco.2021.e01467
Liu, J., Wu, L., Wei, S., Xiao, X., Su, C., Jiang, P., et al. (2007). Effects of arbuscular mycorrhizal fungi on the growth, nutrient uptake and glycyrrhizin production of licorice (Glycyrrhiza uralensis Fisch). Plant Growth Regul. 52, 29–39. doi:10.1007/s10725-007-9174-2
Liu, X., Xie, Y., Zhou, D., Li, X., Ding, J., Wu, X., et al. (2020a). Soil grain-size characteristics of nitraria tangutorum nebkhas with different degrees of vegetation coverage in a desert-oasis ecotone. Pol. J. Environ. Stud. 29 (5), 3703–3714. doi:10.15244/pjoes/115866
Liu, Y., Zhang, R. Q., Ma, X. R., and Wu, G. L. (2020b). Combined ecological and economic benefits of the solar photovoltaic industry in arid sandy ecosystems. J. Clean. Prod. 262, 121376. doi:10.1016/j.jclepro.2020.121376
Lupangu, C., and Bansal, R. C. (2017). A review of technical issues on the development of solar photovoltaic systems. Renew. Sustain. Energy Rev. 73, 950–965. doi:10.1016/j.rser.2017.02.003
Munhoz, R. O., and Bertonde Camargo, R. S. O. A. (2011). Phosphorus sorption and redistribution on soil solid phase in a Brazilian haplorthox amended with biosolids. Appl. Environ. Soil Sci. 2011, 283061–283067. doi:10.1155/2011/283061
Nelson, D. W., and Sommers, L. E. (1983). Total carbon, organic carbon, and organic matter. Methods of soil analysis: Part 2 chemical and microbiological properties 9, 539–579.
Pan, X., Wang, Z., and Gao, Y. (2020). Effects of compound sand barrier for habitat restoration on sediment grain-size distribution in ulan buh desert. Sci. Rep. 10 (1), 2566. doi:10.1038/s41598-020-59538-7
Qi, F., Zhang, R., Liu, X., Niu, Y., Zhang, H., Li, H., et al. (2018). Soil particle size distribution characteristics of different land-use types in the Funiu mountainous region. Soil Tillage Res. 184, 45–51. doi:10.1016/j.still.2018.06.011
Ren, M., Chen, W., and Wang, H. (2022). Ecological policies dominated the ecological restoration over the core regions of kubuqi desert in recent decades. Remote Sens. 14 (20), 5243. doi:10.3390/rs14205243
Rodríguez-Loinaz, G., Onaindia, M., Amezaga, I., Mijangos, I., and Garbisu, C. (2008). Relationship between vegetation diversity and soil functional diversity in native mixed-oak forests. Soil Biol. Biochem. 40 (1), 49–60. doi:10.1016/j.soilbio.2007.04.015
Rodriguez-Pastor, D. A., Ildefonso-Sanchez, A. F., Soltero, V. M., Peralta, M., and Chacartegui, R. (2023). A new predictive model for the design and evaluation of bifacial photovoltaic plants under the influence of vegetation soils. J. Clean. Prod. 385, 135701. doi:10.1016/j.jclepro.2022.135701
Sha, L. N., Fan, X., Zhang, H. Q., Kang, H., Wang, Y., Wang, X., et al. (2014). Phylogenetic relationships in Leymus (Triticeae; Poaceae): evidence from chloroplast trnH-psbA and mitochondrial coxII intron sequences. J. Syst. Evol. 52 (6), 722–734. doi:10.1111/jse.12097
Sinke, W. C. (2019). Development of photovoltaic technologies for global impact. Renew. Energy 138, 911–914. doi:10.1016/j.renene.2019.02.030
Tang, G., Meng, Z., Gao, Y., and Dang, X. (2021). Impact of utility-scale solar photovoltaic array on the aeolian sediment transport in Hobq Desert, China. J. Arid Land 13, 274–289. doi:10.1007/s40333-021-0096-y
Wang, C., Hill, R. L., Bu, C., Li, B., Yuan, F., Yang, Y., et al. (2021). Evaluation of wind erosion control practices at a photovoltaic power station within a sandy area of northwest, China. Land Degrad. Dev. 32 (4), 1854–1872. doi:10.1002/ldr.3839
Weltzin, J. F., and Coughenour, M. B. (1990). Savanna tree influence on understory vegetation and soil nutrients in northwestern Kenya. J. Veg. Sci. 1 (3), 325–334. doi:10.2307/3235707
Wu, J., Wang, H., Li, G., Ma, W., and Gong, Y. (2020). Vegetation degradation impacts soil nutrients and enzyme activities in wet meadow on the Qinghai-Tibet Plateau. Sci. Rep. 10 (1), 21271. doi:10.1038/s41598-020-78182-9
Xiao, B., Wang, J. H., Zhou, C. Y., Chen, J. M., Zhang, N., Zhao, N., et al. (2020). Ethno-medicinal study of Artemisia ordosica Krasch.(traditional Chinese/Mongolian medicine) extracts for the treatment of allergic rhinitis and nasosinusitis. J. Ethnopharmacol. 248, 112262. doi:10.1016/j.jep.2019.112262
Yuan, B., Wu, W., Yue, S., Zou, P., Yang, R., and Zhou, X. (2022). Multi-scale impact of large-scale photovoltaic power station construction on wind field in the desert area. Int. Conf. Sustain. Technol. Manag. 12299, 35–40. doi:10.1117/12.2646619
Yue, S., Guo, M., Zou, P., Wu, W., and Zhou, X. (2021). Effects of photovoltaic panels on soil temperature and moisture in desert areas. Environ. Sci. Pollut. Res. 28, 17506–17518. doi:10.1007/s11356-020-11742-8
Zhang, Y. M., Wang, H. L., Wang, X. Q., Yang, W., and Zhang, D. (2006). The microstructure of microbiotic crust and its influence on wind erosion for a sandy soil surface in the Gurbantunggut Desert of Northwestern China. Geoderma 132 (3-4), 441–449. doi:10.1016/j.geoderma.2005.06.008
Keywords: photovoltaic vegetation restoration Hobq desert, solor, photovoltaic, rehabilitation of vegetation, particle size characteristics, soil nutrients
Citation: Cai J, Meng Z, Meng R, Li H, Chen X, Ren X, Guo L and Hao M (2024) Exploring a path of vegetation restoration best suited for a photovoltaic plant in the Hobq desert. Front. Environ. Sci. 12:1380421. doi: 10.3389/fenvs.2024.1380421
Received: 05 February 2024; Accepted: 19 March 2024;
Published: 05 April 2024.
Edited by:
Zhiming Han, Northwest A&F University, ChinaReviewed by:
Xiaoyu Meng, Henan University, ChinaChenfeng Wang, Chinese Academy of Sciences (CAS), China
Copyright © 2024 Cai, Meng, Meng, Li, Chen, Ren, Guo and Hao. This is an open-access article distributed under the terms of the Creative Commons Attribution License (CC BY). The use, distribution or reproduction in other forums is permitted, provided the original author(s) and the copyright owner(s) are credited and that the original publication in this journal is cited, in accordance with accepted academic practice. No use, distribution or reproduction is permitted which does not comply with these terms.
*Correspondence: Jiale Cai, caijiale191@126.com; Zhongju Meng, mengzhongju@126.com