Spatial network structure and influencing factors of carbon emission intensity in Guangdong-Hong Kong-Macao greater bay area
 Heng Wei1
  Chaohui Zheng2*
- 1College of Urban and Rural Construction, Zhong Kai University of Agriculture and Engineering, Guangzhou, China
- 2Faculty of Science and Engineering, University of Nottingham Ningbo China, Ningbo, China
Introduction: In response to China’s ambitious dual-carbon goals, this study investigates the spatial correlation and influencing factors of carbon emission intensity within the Guangdong-Hong Kong-Macao Great Bay Area (GBA), a region pivotal for the nation’s energy conservation and emission reduction efforts. Through a comprehensive analysis encompassing the period from 2000 to 2020, this research aims to delineate the spatial dynamics of carbon emissions and identify actionable insights for regional low-carbon development.
Methods: Utilizing an integrated methodology comprising spatial autocorrelation analysis, Social Network Analysis (SNA), and the Quadratic Assignment Procedure (QAP), the study analyzes carbon emission data alongside socio-economic variables. These methodologies allow for a nuanced exploration of the spatial correlation structure and the determination of factors influencing carbon emission intensity across the GBA.
Results: Findings reveal a cyclical fluctuation in the spatial network of carbon emissions from 2000 to 2020, characterized by varying degrees of cohesion among cities, indicating significant opportunities for spatial optimization. A “core-periphery” pattern emerges, with economically robust cities such as Hong Kong and Macao at the core, and less developed cities like Huizhou and Jiangmen on the periphery. Cities like Guangzhou and Shenzhen play crucial mediator roles. The QAP analysis further identifies six major influencing factors: geographic spatial proximity, economic development level, urbanization rate, industrial configuration, level of technological innovation, and environmental protection efforts, with the latter four having a markedly positive impact on spatial relevance.
Discussion: The study’s insights underscore the importance of understanding the spatial dynamics of carbon emissions and the role of socioeconomic factors in shaping these patterns. For policymakers and stakeholders in the GBA, these findings highlight the necessity of targeted intervention strategies that consider both the unique position of cities within the spatial network and the broader socio-economic context. This approach can significantly contribute to achieving China’s dual-carbon objectives, promoting energy conservation, and facilitating the transition to a low-carbon economy.
1 Introduction
The International Energy Agency (IEA) reports that in 2022, the worldwide emissions of carbon dioxide related to energy surged by 0.9% from the previous year, resulting in an added 321 million tonnes of carbon dioxide. This increase pushed the total emissions to approximately 36.8 billion tonnes, marking an unprecedented peak (IEA, 2023). Notably, the rise in CO2 emissions in North America and Asia (excluding China) surpassed the escalation observed in Europe and China. Urban areas, being hubs of human activity and habitation, play a critical role in energy consumption and the release of carbon dioxide (Zhou et al., 2018; Wang et al., 2020; Yu and Zhang, 2021). The swift pace of urbanization has led to significant energy needs and related emission challenges, thereby posing a substantial threat to efforts against global climate change and the pursuit of environmental sustainability (Franco et al., 2017). More than 70% of global CO2 emissions and two-thirds of the world’s energy use are attributed to urban centers (IEA, 2008). These urban agglomeration, which are the focal points of regional economic growth and population density, are instrumental in combating climate change and advancing low-carbon initiatives (Jia et al., 2018; Zhao et al., 2020; Wang and Xin, 2022). They achieve this by centralizing resources, enhancing energy management efficiency, and nurturing the growth of eco-friendly technologies and innovations. Additionally, carbon emissions are a widely perceived cause of global warming (Fang et al., 2011), a pressing environmental challenge that the entire planet faces (Wu et al., 2021).The international community broadly agrees on the necessity to slow down global warming by managing carbon dioxide emissions (Luo et al., 2023). In this context, the GBA, encircling a bay, stands out with its urban centers that are known for their sophisticated service industries, status as vital global financial centers, and extensive transportation networks. The GBA benefits from the collective impact of urban clustering, engaging in diverse innovative efforts including technology, institutional frameworks, industry, and finance. This strategic positioning strengthens the GBA’s role as a significant player in worldwide economic advancement. Recognized for its crucial contribution to the transition towards a sustainable energy model and mitigating the swift changes brought by climate change, the importance of the GBA is increasingly acknowledged (Geng et al., 2022). Therefore, it is essential to intensify efforts in utilizing the leadership potential of urban conglomerations in reducing CO2 emissions. In line with this, China has put forward the “Dual Carbon Plan,” which sets the ambitious objectives to “strive to achieve peak carbon emissions by 2030 and carbon neutrality before 2060” (Jia et al., 2022). Concurrently, China is executing various regional spatial development strategies, progressively strengthening the spatial correlations and fostering more complex and far-reaching relationships among cities in these urban agglomeration. This approach is evolving into a complex, multi-threaded network structure.
The GBA, a critical element of China’s current national economic advancement strategy, was first emphasized in the 13th Five-Year Plan (2016–2020) in 2016. This initiative represents an evolution of earlier regional development efforts, notably the Pearl River Delta and the Pan-Pearl River Delta (Weng et al., 2020). The GBA comprises a cluster of “9 + 2”cities, consisting of nine cities in Guangdong Province (namely Guangzhou, Shenzhen, Zhuhai, Dongguan, Huizhou, Zhongshan, Foshan, Zhaoqing, and Jiangmen from the Pearl River Delta) and the two Special Administrative Regions of Hong Kong and Macao. In a bid to foster low-carbon, sustainable urban development in the Bay Area, local authorities have enacted a range of policies tailored to the unique characteristics of each city. These cities each have specific development objectives as part of the overarching GBA plan (Xinhua Finance Agency, 2018). Since its establishment, the GBA has exhibited considerable economic clout. Spanning an area of 56,000 square kilometers, it covers less than 1% of China’s total landmass.
In 2022, the GDP of the GBA surpassed 13 trillion CNY, contributing to 10.79% of China’s total GDP. This is a significant achievement considering that the GBA’s population of 86.2904 million only constitutes 6.95% of the national total (NBS, 2022). According to the “World Bay Area Development Index Report (2022),” the GBA’s growth trend suggests that by 2026, its GDP might exceed that of the Tokyo Bay Area, positioning it at the forefront of the world’s four major bay areas (Chen and Fan, 2022). The GBA holds a critical strategic role in China’s broader developmental agenda. Its aim is to amplify the overall strength significantly and foster deeper and more expansive cooperation among Guangdong, Hong Kong, and Macau, thereby boosting the region’s developmental dynamics. Presently, the GBA is leading in low-carbon development, with many of its cities transitioning from industrial to service-oriented economies (Zhou et al., 2018). The Greater Bay Area’s planning strategy not only focuses on economic and social advancement but also prioritizes environmental enhancement and living condition improvements in the face of urbanization. The GBA plays a crucial role in advocating for global low-carbon, sustainable, and coordinated development. Currently, research on the GBA largely concentrates on regional planning, economic growth, and ecological safety, while less attention is given to the design of carbon emissions and urban carbon emission patterns (Hui et al., 2020; Gao et al., 2022; Jia et al., 2022).
To address the existing knowledge gap, this paper employs the “Gravity Model & Social Network Analysis” approach to study the spatial network of carbon emissions among 11 prefecture-level cities in the GBA. The timeframe from 2000 to 2020 has been chosen as the observational interval for this network. This analysis quantifies the statistical attributes of the GBA’s carbon emission spatial network. Utilizing social network analysis, the study delves into the spatial correlations and structural features of carbon emissions. The QAP regression analysis is applied to explore the interrelations in this network. Moreover, the research analyzes characteristics and formation mechanism of carbon emissions, laying a groundwork for the development of harmonized carbon emission strategies in the GBA.
The structure of the paper is as follows: Section 2 introduces the relevant literature review. Section 3 describes the research area and sources of data. Section 4 discusses the Materials and Methods. Section 5 presents the findings and discussions. Finally, Section 6 offers the conclusion and targeted recommendations.
2 Literature review
2.1 Spatial correlation of carbon emissions
In early studies focusing on the spatial correlation attributes of carbon emissions, numerous academics analyzed the spatial network properties of carbon emissions through the lens of spatial analysis and spatial econometrics. They identified significant spatial autocorrelation (Sun et al., 2020; Lin et al., 2021; Chen et al., 2023) and spatial non-uniformity (Chen et al., 2021) in carbon emission networks. Presently, researchers frequently employ spatial autocorrelation tests (Lv et al., 2022; Zeng et al., 2022) and stochastic frontier analysis (Ondrich and Ruggiero, 2001), forming dynamic spatial Durbin models (Li and Li, 2020; Song et al., 2020)to conclude significant spatial autocorrelation in the inter-provincial carbon emissions in China. Academics also utilize spatial econometric approaches such as ESDA, LMDI, and spatial convergence models to investigate the spatial distribution trends of China’s carbon emissions (Cheng et al., 2014; Zhu et al., 2021; Cui et al., 2022; Liu et al., 2022; Zhao et al., 2022; Duman et al., 2023). Based on the approaches of earlier studies, it is a standard practice to start with spatial statistical analysis, typically using Moran’s I, a spatial autocorrelation metric, to assess whether carbon emissions demonstrate positive, negative, or random spatial correlations.
Shaojian Wang et al. evaluated the spatiotemporal changes and influencing elements of carbon dioxide emissions using dynamic distribution and panel data methodologies. Their discoveries highlighted significant regional imbalances and self-enhancing clustering traits of CO2 emissions, with regional differences progressively reducing and spatial clustering augmenting (Wang and Liu, 2017). Haider Mahmood et al., 2020 applying the Environmental Kuznets Curve (EKC) theory in spatial econometric models, demonstrated the spatial reliance of carbon emissions on non-agricultural income, trade, energy use, and FDI in North Africa. Kaifang Shi et al., 2019 explored the spatiotemporal changes and impacting factors of CO2 emissions at various administrative layers in China, analyzing nighttime light images and socioeconomic data through spatial autocorrelation and spatial economic models. Tiangui Lv and his group used the STIRPAT model and the Spatial Durbin Model (SDM) to assess the effect of diverse driving forces on carbon emissions. Their study indicated that carbon emissions exhibit a fluctuating growth pattern and have a significant positive spatial correlation (Lv et al., 2022).
Currently, numerous studies have focused on carbon dioxide emissions in national scale. Junsong Jia et al., 2023 conducted a comprehensive analysis of CO2 emissions from various sectors and stages in China since 1980, employing the extended logarithmic mean Divisia index to decompose CO2 emissions across multiple industries and stages. In their research on the low-carbon development of China’s tourism industry, Junsong Jia et al., 2023 introduced a novel framework for analyzing the sustainability of carbon reduction in the Chinese tourism sector under the guidance of the United Nations Sustainable Development Goals. This study also utilized social network analysis and the logarithmic mean Divisia index. As many researchers typically consider China as a unified subject of study, it's crucial not to overlook that the Greater Bay Area, being one of the most economically vibrant and open regions, significantly influences China’s carbon emission trends, meriting targeted research.
And a small number of researchers have used social network analysis models to study differences in carbon emissions between provinces in China. From the perspective of social network analysis, Hanzhi Huang et al. explored the evolution of the spatial network structure of land use carbon emissions and carbon balance zoning in Jiangxi Province. Utilizing social network analysis (SNA) methods, they provided feasible suggestions for low-carbon development and collaborative carbon reduction in developing regions (Huang et al., 2024). Yuling Sun et al., 2022 studied the spatiotemporal evolution characteristics of direct carbon emissions in China’s residential consumption sector using Social Network Analysis (SNA) and Geographically Weighted Regression (GWR) methods. They also proposed policy recommendations for regional energy transition. The application of Social Network Analysis (SNA) models in carbon emissions research primarily focuses on exploring the socio-economic driving factors of carbon emissions, identifying key sources of carbon emissions and their diffusion paths, and assessing the social network impact of carbon reduction policies. By constructing network relationships between socio-economic activities, energy consumption, and carbon emissions, researchers can reveal the interdependencies and mechanisms of influence among different economic entities, providing theoretical basis and practical guidance for formulating more precise and effective carbon reduction strategies.
In advanced research stages, experts realized that the spatial network of carbon emissions forms a complex system that intertwines with societal interactions. Concurrently, the SNA gained recognition for its effectiveness in mapping complex social connections. In this period, SNA became a popular tool among researchers to explore both national and regional carbon emission spatial networks (Bai et al., 2020; He et al., 2020; Shao and Wang, 2021; Feng et al., 2023). These studies revealed a significant spatial correlation and spillover effects in the national and inter-regional networks of carbon emissions.
Feng Wang et al. conducted a detailed analysis of the spatial correlation of carbon emissions among Chinese provinces from 2008 to 2014. They constructed and analyzed the network’s structure and dynamics utilizing SNA and the QAP. Their research highlighted the roles of energy usage, economic status, and geographic positioning in the spatial correlation of carbon emissions (Wang et al., 2018). Jia Dong and Cunbin Li adopted an enhanced gravity model along with SNA to delve into the spatial correlations and interactive dynamics of carbon emissions in and between city agglomeration (Dong and Li, 2022) Tengfei Huo et al. employed SNA and QAP to probe the critical regions and crucial connections in the building carbon emission network, analyzing the effects of geographical closeness, economic growth, energy concentration, and industrial makeup on the spatial correlations of carbon emissions (Huo et al., 2022).
Social network analysis has been widely used in the study of urban agglomeration. Chuanglin Fang et al. used a Web Crawler to gather 500,000 sets of Weibo data from 13 cities within the Beijing urban agglomeration. They developed a quantitative evaluation index system and model for the spatial network strength of the Beijing city cluster, utilizing three standards and nine indicators (Fang et al., 2020). Yubo Zhao et al., 2021 improved upon the traditional spatial gravity model by incorporating considerations of urban core functional strength and population movement trends, focusing on enhancements to city quality, the gravitation coefficient, and city distance. Based on this refined model, they analyzed the network structures of the Jingjinji Urban agglomeration and Yangtze River Delta urban agglomeration. Chang Gan et al., 2021 employed a tourism economic gravity model and Social Network Analysis (SNA) to investigate the characteristics of the tourism economic spatial network structure within the Yangtze River Delta urban agglomeration.
The predominant academic community frequently utilize social network analysis to analyze the attributes of China’s carbon emission spatial networks. Researches reveal that these networks not only possess robust correlation but also demonstrate a year-over-year increase. Nevertheless, the academic focus has predominantly been at the provincial scale, with lesser attention given to the urban dimension and inadequate exploration into the inherent and generative mechanisms behind the variations in the spatial correlation networks of carbon emissions. This oversight presents a critical gap in understanding the dynamics of carbon emissions at a more granular level, where urban agglomeration play a pivotal role in both the generation and reduction of carbon footprints. Recognizing this, some scholars advocate for a shift towards a more nuanced analysis that incorporates the urban scale structure, arguing that cities agglomeration are not only significant contributors to national carbon emissions but also key arenas for implementing carbon reduction strategies. This urban-focused approach could reveal unique patterns of carbon emission and mitigation strategies that are not apparent at broader geographical scales.
2.2 Influencing factors of spatial correlation of carbon emission
Academics frequently employ analytical frameworks such as the STIRPAT model, the EKC hypothesis, and the threshold panel model to appraise the factors influencing the geographic distribution of carbon emissions, as noted in references (Zhang and Tan, 2016; Yang et al., 2021). Research focused on the spatial spillover and determinants of carbon emissions (Sun et al., 2016; Wang et al., 2019; Wang et al., 2024) suggests that the QAP is an effective tool for assessing the underlying causes of regional disparities in carbon emissions. These studies highlight that variables such as geographical location, economic status, urban development level, population size, and the nature of industrial activities significantly influence these spatial differences in carbon emissions.
In their research, Wei et al., 2021 devised an enhanced model for estimating carbon emissions, incorporating data on nighttime lighting, land usage, and population statistics. Their analysis of 356 cities across mainland China revealed significant regional patterns in carbon emissions. Larger cities demonstrated a “W"-shaped distribution, whereas smaller cities followed a power-law trend, as detailed in reference. Xingping Zhang and Xiaomei Cheng employed the Dynamic Panel Autoregressive Distributed Lag Model (ARDL) to evaluate the connections between economic progression, energy utilization, and carbon emissions. Their results pointed to a unidirectional cause-and-effect link between GDP and energy use, and between energy use and carbon emissions. Conversely, they found no evidence of a causal link from carbon emissions and energy use to economic advancement. This suggests that increases in carbon emissions and energy consumption are not drivers of economic growth, as indicated in reference (Zhang and Cheng, 2009). Wei-Zheng Wang et al., 2021 applied the Dynamic ARDL in their detailed analysis of the varied and complex long-term equilibrium relationships, short-term dynamics, influencing mechanisms, and delayed effects linking urbanization to three aspects of carbon emissions: per capita carbon emissions, total carbon emissions, and carbon emission intensity. Their findings suggest that in developed countries, urbanization tends to reduce carbon emissions. In China’s context, there is an inverse relationship between the rate of urbanization and carbon emissions. The concentrated energy use in urban areas can lead to energy conservation and a decrease in emissions. Qin Zhu and Xizhe Peng also utilized the Dynamic ARDL to explore how population size, demographic structure, and consumption levels impact carbon emissions. They concluded that shifts in consumption patterns and population structure are primary influencers of carbon emissions (Zhu and Peng, 2012). Biying Dong et al., 2020 employed a combination of the STIRPAT decomposition model, Tapio decoupling index, and grey relational analysis for a thorough analysis of the interplay between carbon emissions and economic growth in China’s six key industrial sectors: agriculture, industry, construction, transportation, retail and accommodation, and other industries. Their analysis indicates a negative correlation between the proportion of value added in the agriculture, industry, and transportation sectors and carbon emissions. Conversely, the proportion of value added in construction, retail, and accommodation sectors exhibits a positive correlation with carbon emissions.
According to the STIRPAT model and the EKC hypothesis, research indicates a negative correlation between economic agglomeration and carbon emissions. This implies that a rise in economic concentration might lead to a decrease in carbon emissions. There appears a “U”-shaped relationship observed between income levels and carbon emission intensity. Regions with lower income tend to prioritize economic growth over environmental concerns, and as income gaps grow, government priorities regarding environmental conservation may shift. In summary, many scholars concur that factors such as geographical location, economic, population, and industrial structures play a crucial role in influencing urban carbon dioxide emissions. These elements are particularly significant in terms of the spatial variations in carbon emissions.
3 Study area and materials
3.1 Study area
The GBA in China, one of the world’s four major bay areas (National Development and Reform Commission et al., 2015), comprises nine cities in the Pearl River Delta—Guangzhou, Shenzhen, Zhuhai, Foshan, Huizhou, Dongguan, Zhongshan, Jiangmen, Zhaoqing—and two special administrative regions, Hong Kong and Macao (Figure 1). This urban agglomeration, highly urbanized and economically vibrant, is noted for its openness and economic dynamism. The topography of the Greater Bay Area features higher elevations in the north and lower ones in the south, with plains predominantly in the center. It enjoys a stable average annual temperature of around 22°C and receives an annual rainfall of approximately 1930 mm. The economic and industrial interactions among these cities have been strengthening, thanks to their initial development advantages and increasingly interconnected networks. This study focuses on five specific years—2000, 2005, 2010, 2015, and 2020—to appraise the evolution and contributing factors of the spatial correlation network of carbon emission intensity in this region.
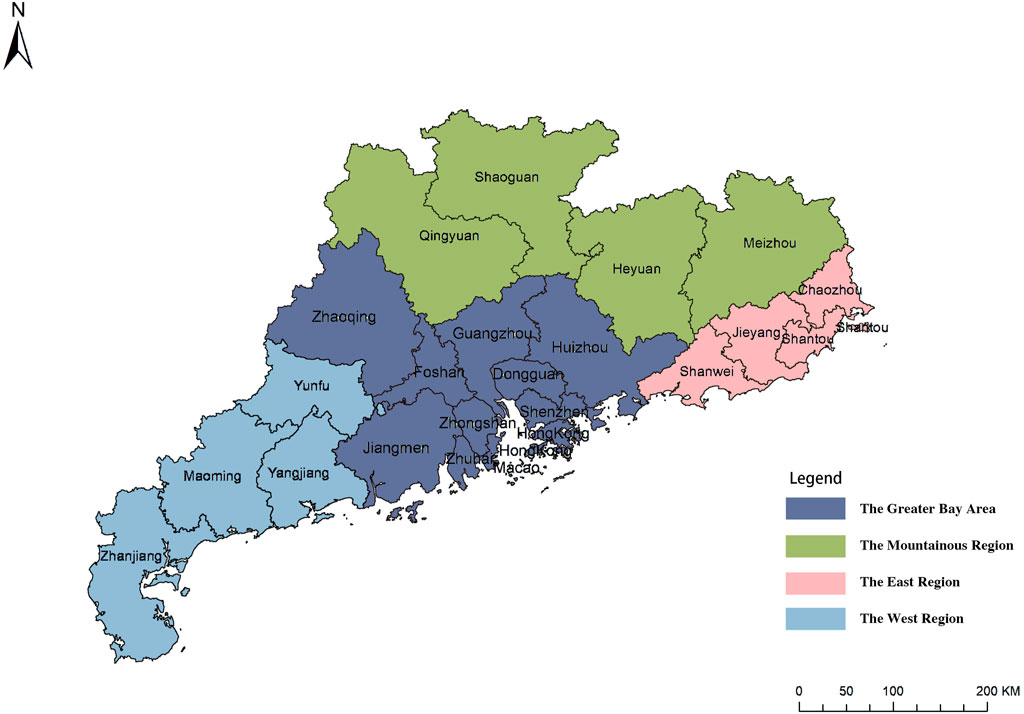
Figure 1. Cities of and around GBA.
3.2 Data sources
The population and economic statistics presented in this paper are extracted from the statistical offices of various district (county) administrations, the city’s annual statistical yearbooks (2000–2020), and the National Economic and Social Development Statistical Bulletin. For this research, the carbon emissions data are sourced from the China Emission Accounts and Datasets (CEADs), while the carbon emissions figures for Hong Kong and Macau are collected from the Hong Kong Environmental Protection Department and the Macau Environmental Protection Bureau (DSPA), respectively. To ensure consistency in the data, this study utilizes district (county) level divisions as they were in 2010 for statistical analysis.
4 Materials and methods
4.1 Spatial autocorrelation
In analyzing the changes over time and the dynamic shifts in the intensity of urban carbon emissions, researchers typically employ global and local spatial autocorrelation methods for spatial correlation assessment. Global spatial autocorrelation is utilized to assess the similarities and differences (both positive and negative spatial correlations) among neighboring areas across a broader region (Boots and Tiefelsdorf, 2000). The method is outlined as follows:
In the formula,
Global spatial autocorrelation is insufficient to capture the unique spatial characteristics of local urban carbon emission intensity. This gap is resolved by local spatial autocorrelation testing. In this area, many scholars opt for the local Moran’s I index to analyze these phenomena, which evaluates the spatial correlation among cities from a detailed perspective. The formula is as follows:
The local
4.2 Gravity model
The gravity model is extensively employed in the fields of economics and finance to analyze spatial interactions. As noted in the literature, the gravity model is especially effective for comprehensive data sets, allowing for a thorough consideration of both economic and geographic elements (Khadaroo and Seetanah, 2008; Golovko and Sahin, 2021). Therefore, this study integrates variables such as carbon emission intensity into the gravity model to enhance its applicability. This modified gravity model effectively quantifies the “carbon emission gravity” between cities, with its specific formula presented below:
In the formula,
4.3 Social network analysis
Social network analysis, also known as structural analysis, employs both graph theory and mathematical modeling to explore relationships between social actors or the flow of various tangible and intangible elements such as information and resources through these relationships (Tabassum et al., 2018).This methodology’s most significant accomplishment is the accurate quantification of relationships between nodes, which might otherwise appear elusive. By integrating points and lines, it systematically structures the social network, bridging macro (social) and micro (individual) levels. This approach facilitates visual analysis, grounding both theoretical and empirical research in social sciences.
4.3.1 Permission to reuse and copyright
Graph Density is commonly used to measure the completeness of all relationships in a network. This term refers to the level of connection among different nodes in the network. In simple terms, a network with higher density typically has a more significant effect on the participants in it. To calculate network density, one divides the total existing relationships by the maximal possible number of relationships. The value of network density lies between [0, 1]. In a scenario where the network is fully interconnected, i.e., a complete network, the Graph Density (GD) is 1. Conversely, when the network has no connections, the GD is 0.
Graph Hierarchy serves as a effective tool to measure the levels of hierarchy in a network. The calculation of Graph Hierarchy (GH) is based on the following formula:
Wherein
Graph Efficiency is a measure of the presence of redundant connections in a known network. The formula to determine Graph Efficiency (GE) is:
Wherein
4.3.2 Individual network characteristic index
Degree Centrality is defined by the number of direct connections to a node. Its calculation is given by the following formula:
Closeness Centrality is determined by the cumulative distances from a given node to all other nodes in the network. The smaller this cumulative distance, the shorter the overall path from this specific node to the others, signifying its proximity to all other nodes. The method to compute this is as follows:
Betweenness Centrality is identified by the count of the shortest paths traversing a particular node. An increased count indicates a higher level of betweenness centrality for the node, reflecting its role as an intermediary. The process for its calculation is expressed as follows:
4.3.3 Clustering network characteristic index
Analyzing the clustering structural characteristics in spatial correlation networks involves using spatial clustering. This approach helps to illustrate the network’s internal configuration along with the roles and statuses of its constituents. A key method in this context is block modeling (Tabassum et al., 2018). This method focuses on the analysis of social roles and statuses. Here, a status represents a group of actors sharing similar social behaviors, connections, or interactions. Utilizing Wasserman’s approach for categorizing roles and statuses into blocks, the criteria for dividing blocks are listed in Table 1: 1) Net Beneficiary Block, where members gain more spillovers relative to their interactions with other blocks, implying that “benefits” outweigh “spillovers”; 2) Net Spillover Block, where members experience significantly fewer spillovers compared to those they distribute to other blocks, indicating a higher prevalence of “spillovers” over “benefits”; 3) Bidirectional Spillover Block, marked by a higher frequency of spillover interactions among its members and with external blocks; 4) Intermediary Block, acting as a connector among various blocks. Members of this block engage in limited internal interactions but maintain extensive external connections, involving both dispensing and receiving spillovers from outside the block.
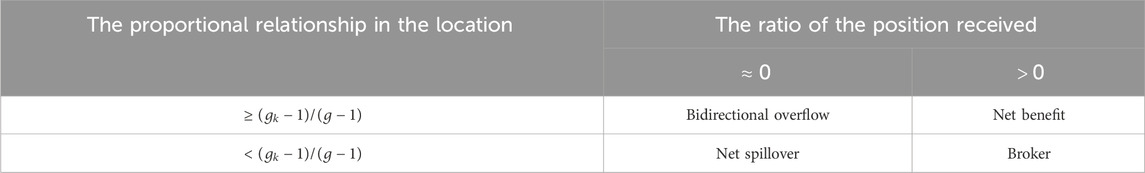
Table 1. Block model plate division.
Wherein:
4.4 QAP analysis
The QAP regression analysis is a method that utilizes permutations of matrix data to compare the similarity between two square matrices. It employs a non-parametric test for the coefficients, which is predicated on the correlation coefficient connecting the two matrices (Simpson, 2001). A significant feature of QAP, setting it apart from conventional statistical methods, is the dependency of values in the matrix. This attribute notably reduces errors that might be introduced by relationship data in the findings. The fundamental version of the prevalent QAP regression model is described as follows:
Where: Y is the explained variable; X is the explanatory variable.
This study focuses on the spatial spillover and determinants of carbon emissions. Factors such as a city’s geographical position, economic growth, urbanization rate, industrial composition, technological innovation level, and environmental protection efforts play a critical role in shaping the spatial correlation of a city’s overall carbon dioxide emissions. This paper, therefore, opts for corresponding evaluative indicators: 1) Geographical spatial proximity (D), exemplified by a matrix formed on the geographic distance between cities; 2) Economic development level (E), indicated by per capita GDP; 3) Urbanization level (U), denoted by the ratio of urban population to total population; 4) Industrial structure (P), shown by the share of secondary industry GDP in regional GDP; 5) Technological innovation level (T), represented by the count of three types of patents (as classified by the National Bureau of Statistics, comprising utility model patents, design patents, and invention patents); 6) Environmental protection intensity (R), illustrated by the per unit GDP carbon emissions of cities. Thus, the comprehensive evaluative indicators chosen in this study are the spatial correlation matrix Y, geographical spatial proximity D, per capita GDP (E), urbanization level (U), proportion of secondary industry in GDP (P), number of approved patents (T), and per unit GDP carbon emissions (R). Considering the varied units of each indicator, this paper standardizes these indicators to mitigate the influence of dimensioned data on the results, establishing the following model:
5 Results
5.1 Spatial-temporal evolution of carbon emission intensity in GBA
During the period of study from 2000 to 2020, the temporal changes in urban carbon emission intensity in the GBA can be categorized into three stages, with the years 2003 and 2013 serving as critical moments (Figure 2). Between 2000 and 2003, the average carbon emission intensity in the GBA witnessed a decline from 1.83 tonnes per ten thousand CNY to 1.63 tonnes per ten thousand CNY, marking an annual average decrease of 3.78%. Following a minor uptick in 2003, there was a marked reduction in overall carbon emission intensity from 2003 to 2013. This period saw a decrease from 1.63 tonnes per ten thousand CNY in 2003 to 0.72 tonnes per ten thousand CNY in 2013, accompanied by an annual average reduction rate of 7.85%. This stage was influenced by the global economic crisis, during which governments at various levels executed extensive industrial revival strategies. The period was characterized by a rapid expansion of traditional high-pollution, high-emission manufacturing sectors and widespread, intensive energy utilization, leading to a modest decrease in carbon emission intensity. Concurrently, cities in the GBA actively engaged with the national ecological civilization strategy, advocating for and implementing policies aimed at reducing emissions and promoting decarbonization. Post-2013, the carbon emission intensity in cities across the GBA continued to decline steadily. While this decrease was less pronounced than in the previous period, it still represented a consistent downward trend.
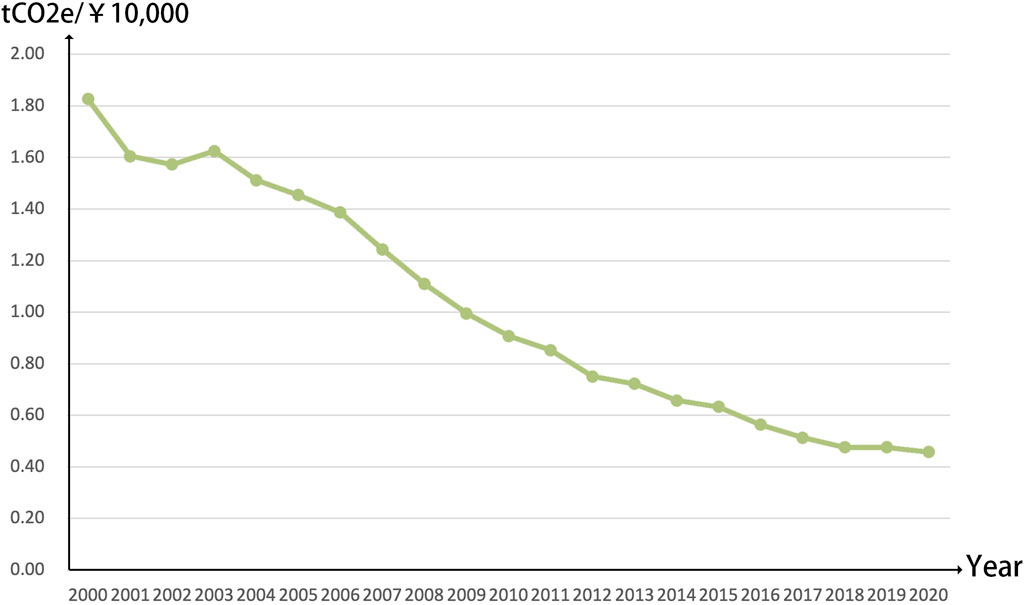
Figure 2. Average carbon emission intensity in GBA 2000 to 2020.
Additionally, from the perspective of urban carbon emission intensity (Figure 3), regions such as Hong Kong, Macau, Shenzhen, and Guangzhou have consistently exhibited lower carbon emission intensities. This trend can be attributed to these cities’ progressive economic structures, which emphasize service and high-tech industries known for lower carbon emissions compared to traditional manufacturing and heavy industries. Additionally, these economically advanced cities feature higher efficiency in energy utilization, favoring the use of cleaner energy sources and implementing energy-saving practices. In contrast, cities such as Zhongshan, Jiangmen, and Huizhou, which display higher carbon emission intensities, tend to be economically less developed and have industrial sectors that are predominantly occupied by industrial industries.

Figure 3. Carbon emission intensity of cities in GBA, 2000 to 2020.
To enhance the understanding of the spatial progression trends in urban carbon emission intensity, we employed Arc GIS 10.7 software. This facilitated the spatial representation of urban carbon emission intensity for critical years such as 2000, 2005, 2010, 2015, and 2020 (Figure 4). Observing from a spatial standpoint, a majority of cities in the GBA (Guangdong-Hong Kong-Macao Greater Bay Area) witnessed varying extents of reduction in carbon emission intensity over the duration of this study. In 2000, cities exhibiting higher levels of carbon emission intensity were predominantly situated in the central region, notably Zhongshan. By 2005, regions with higher carbon emission intensity were primarily found on the western side, including Zhaoqing and Jiangmen, as well as on the eastern side, including Huizhou. In 2010, the zones of high carbon emission intensity mirrored those observed in 2005. However, by 2015, Zhaoqing experienced a decline in carbon emission intensity, leaving Jiangmen and Huizhou as the only areas with increased levels of carbon emission intensity. In 2020, the regions with increased carbon emission intensity remained consistent with those identified in 2015. Overall, throughout the study period, there was a progressive year-on-year decrease in carbon emission intensity across cities in the GBA, with a significant reduction observed in the western regions.

Figure 4. Spatial distribution pattern of urban carbon emission intensity in GBA.
5.2 Spatial correlation test of urban carbon emission intensity
The global Moran’s I values for urban carbon emission intensity in the GBA from 2000 to 2020 are detailed in the Table 2. Throughout the duration of the study, the global Moran’s I figures were below 0 in eight of those years, while in the other years, the values exceeded 0. However, these did not meet the threshold for statistical significance at the 0.01 level, suggesting an absence of spatial correlation in urban carbon emission intensity. Cities with high (or low) carbon emission intensity emission intensities may exhibit a random spatial distribution, which could be either clustered or dispersed. Simultaneously, considering that most Z-values surpass 0.5, the existence of local spatial correlations is a possibility. Moreover, the time-based difference of global Moran’s I, as depicted in the figure, demonstrates an “N” shaped fluctuation pattern. This pattern suggests that the spatial correlation of urban carbon emission intensity in the GBA is experiencing a gradual weakening, interspersed with fluctuations (Figure 5).
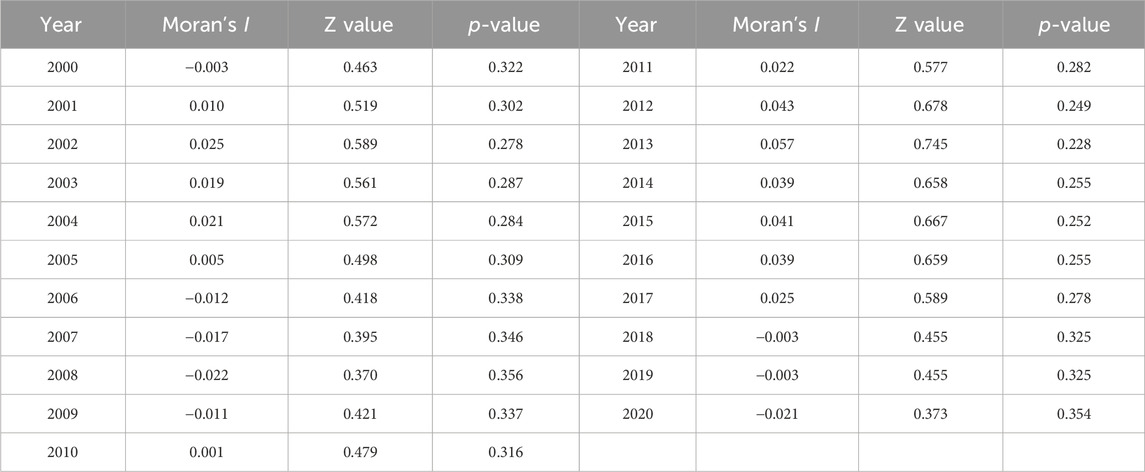
Table 2. Global Moran’s I for urban carbon emission intensity in GBA.
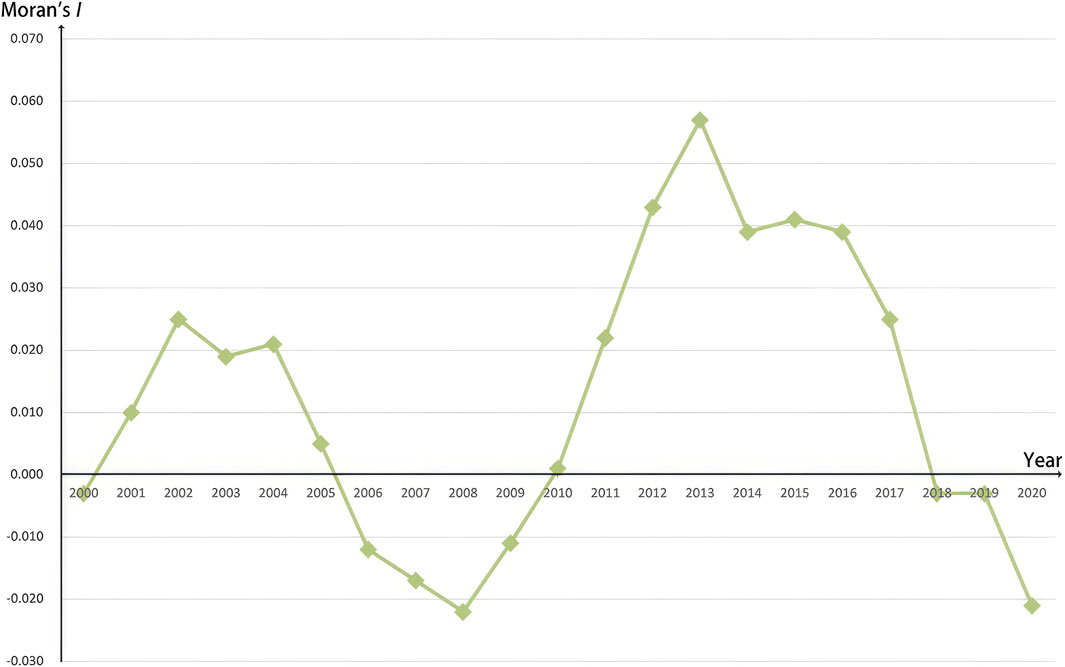
Figure 5. 2000 to 2020 global Moran’s I.
The analysis of local spatial autocorrelation for urban carbon emissions in the GBA for the years 2000, 2005, 2010, 2015, and 2020 yielded the following results (Figure 6). In 2000, the cities of Foshan, Zhuhai, Zhaoqing, and Huizhou were characterized by “H-H” clustering patterns, while Zhongshan, Dongguan, and Huizhou demonstrated “H-L” clustering patterns. By 2005, Zhuhai, Zhongshan, Jiangmen, and Zhaoqing transitioned to “H-H” clustering. This pattern persisted into 2010, with the addition of Macau, Guangzhou, and Foshan exhibiting “L-H” clustering. In 2015, Zhuhai, Zhongshan, and Zhaoqing continued to demonstrate “H-H” clustering. By 2020, the “H-H” clustering was prominent in Zhaoqing, Zhongshan, and Jiangmen.
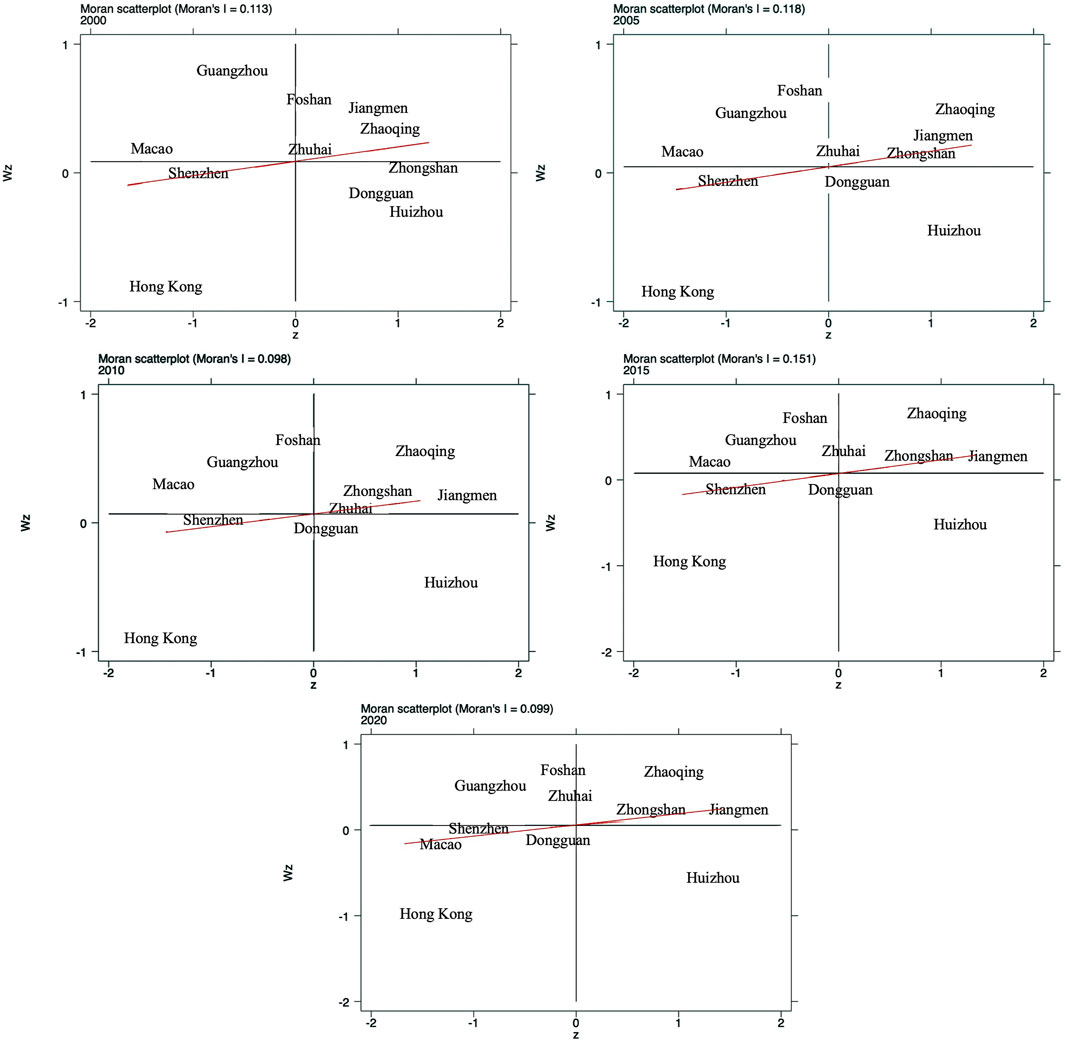
Figure 6. Local Moran’s I results.
5.3 Analysis of the overall structure of the carbon emission spatial network in GBA
Figure 7 in the study illustrates the adjacency matrix
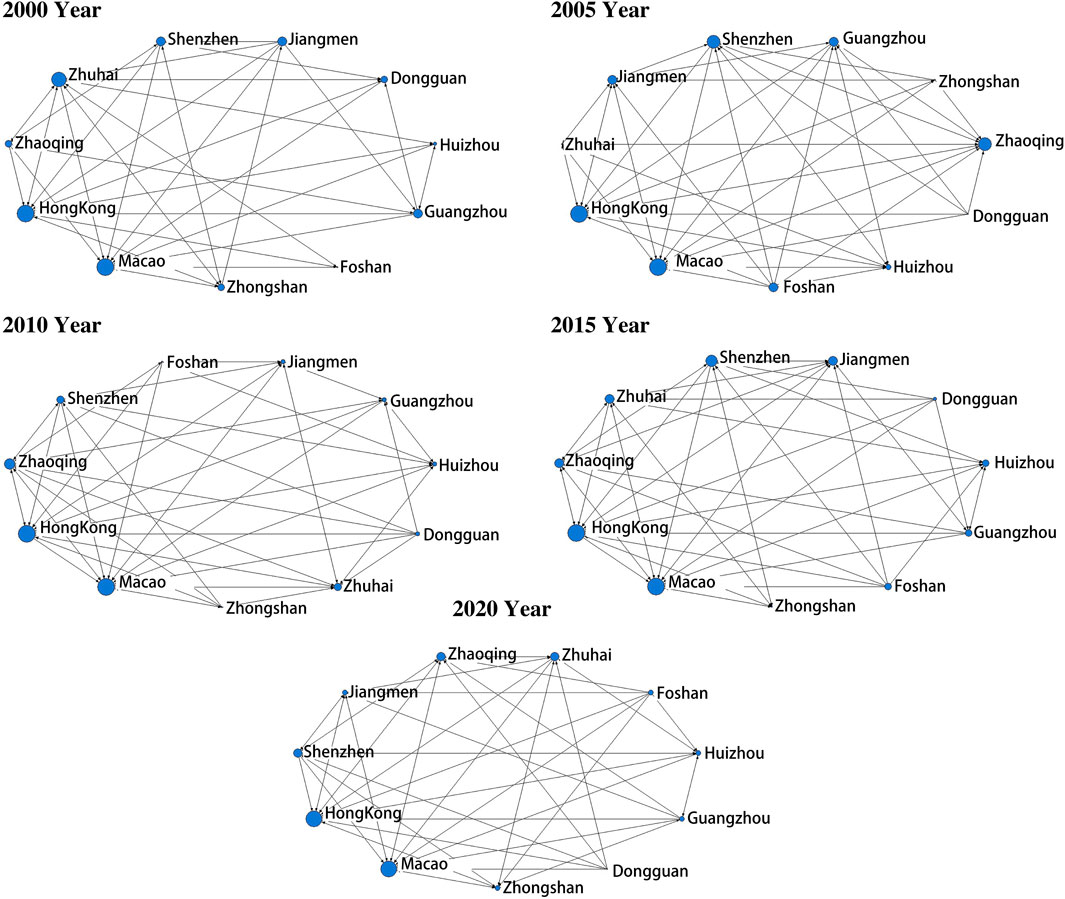
Figure 7. Carbon emission intensity spatial correlation network Network topology.
The overall characteristic indicators of the GBA’s carbon emission spatial correlation network were also analyzed using UCINET6 software, as depicted in the figure. This analysis indicates an enhancement in network connectivity and an improvement in network stability over the studied period.
First, the network of carbon emission associations in the GBA has presented overall improvement in connectivity. Between 2000 and 2020, the number of network connections varied from 49 to 54, and the network’s density increased from 0.445 to 0.491. This can be described as a trend of “rise-rise-fall-fall,” yet both metrics indicate an upward trend. This suggests that the inter-city interactions regarding carbon emissions have become more intense. Nevertheless, the average number of connections, standing at 55, is significantly lower than the potential maximum of 110 (calculated as 11*10), indicating that the spatial correlation of carbon emissions is not at a high level and has considerable room for spatial optimization. The fluctuation in these metrics, particularly the slight decrease from 2010 to 2020, can be attributed to rapid advancements in infrastructure and technology, which expanded the range of carbon emission factors. In addition, the deepening development in the Greater Bay Area prompted some exchanges of factors to move beyond provincial boundaries, with certain industries relocating to Hunan, Jiangxi, and other regions. This shift led to a downward trend in the indicators. Second, the stability of the carbon emission spatial correlation network in the GBA has also seen an improvement. Throughout the analyzed years, the degree of network connectivity consistently remained at one, signifying a tight and stable connection in carbon emissions among the cities, marked by significant reception and spillover effects. Third, there has been a decline in the network hierarchy level, from 0.331 in 2005 to 0.182 in 2010, and a minor decrease from 0.339 in 2015 to 0.335 in 2020. This change reflects a loosening in the hierarchical structure of the spatial correlation network and an increase in stability. The network efficiency experienced fluctuations, moving from 0.489 in 2000 to 0.4 in 2020, which points to a growth in internal connections, i.e., increased city interactions.
5.4 Individual structure analysis of carbon emission space in GBA
Utilizing UCINET6 software, the specific indicators reflecting the structural characteristics of the GBA’s carbon emission spatial correlation network were determined (Figure 8). This network exhibits a “core-periphery” structure, with prominent cities such as Guangzhou, Shenzhen, Hong Kong, and Macau forming the core, while other cities are positioned on the periphery. In the era following the pandemic, the significance of other cities in the Bay Area in this network has been increasingly significant. Figure 9 shows the detailed results and Table 3 shows the degree centrality results, Closeness centrality results and Betweenness centrality results for different years.
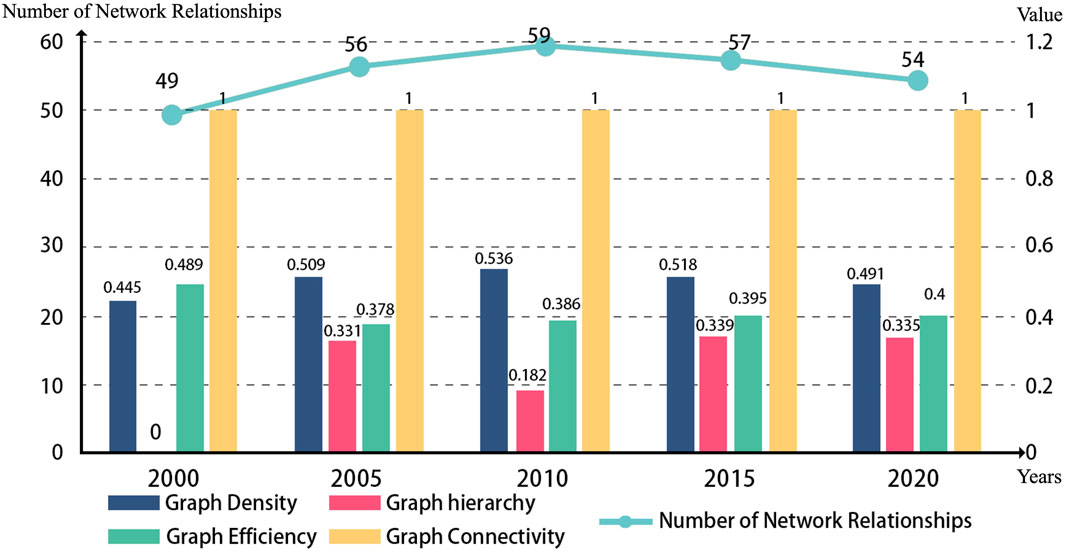
Figure 8. Spatial correlation network overall characteristics.
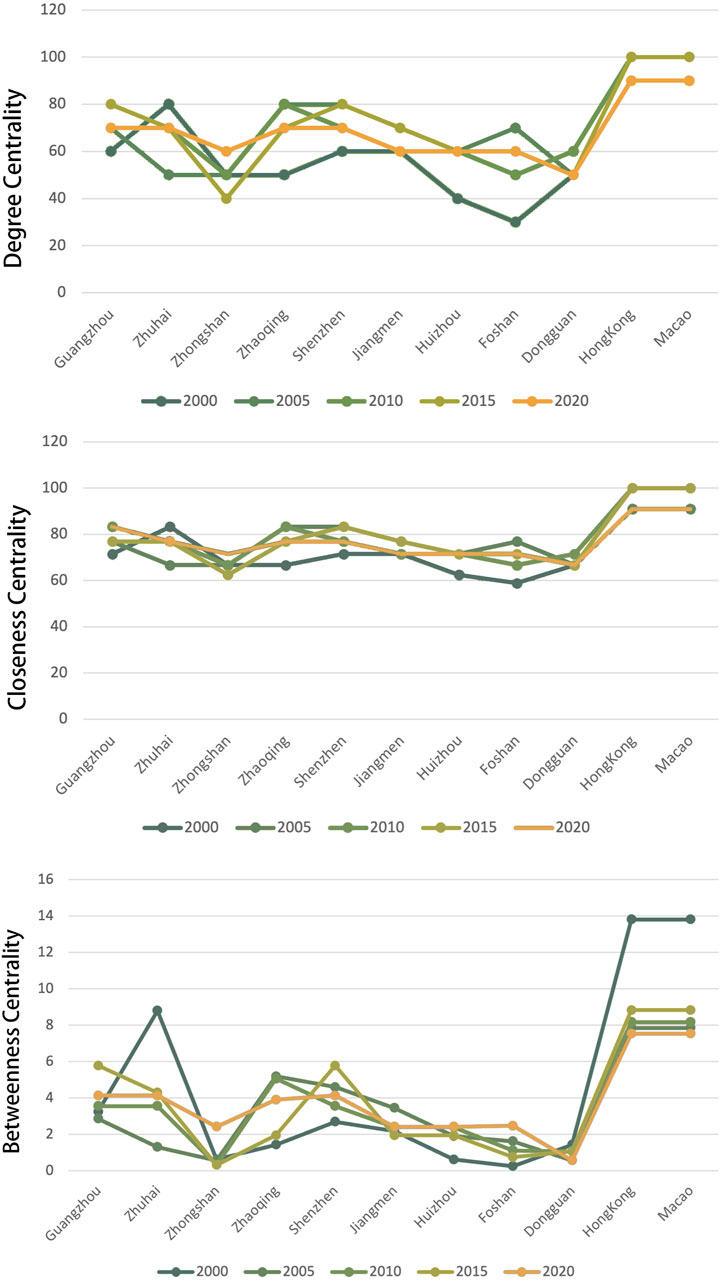
Figure 9. 2000, 2005, 2010, 2015, and 2020 centrality results.
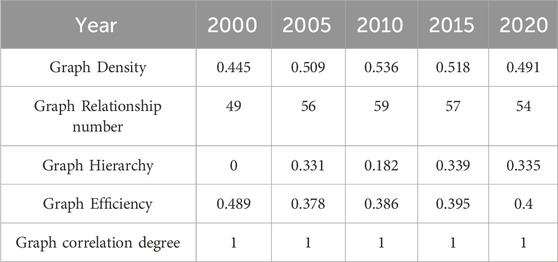
Table 3. Overall index of spatial correlation network of carbon emissions in GBA in 2000, 2005, 2010, and 2020.
5.4.1 Degree centrality result
A comprehensive analysis between 2000 and 2020 demonstrates that in the GBA’s carbon emission spatial correlation network, Hong Kong and Macau have consistently maintained a high level of centrality. This is followed by Guangzhou, Shenzhen, Zhuhai, and Zhaoqing. Over time, Foshan and Jiangmen have demonstrated a trend towards the network’s center, whereas Dongguan, Huizhou, and Zhongshan have remained on the periphery. The mean degree of centrality for the years 2000, 2005, 2010, 2015, and 2020 were recorded as 53.33, 64.44, 64.44, 64.44, and 63.33, respectively. Cities such as Hong Kong, Macau, Guangzhou, Shenzhen, and Zhuhai, strategically located at the Bay Area’s geometric center and featuring robust economies, have fostered rapid shifts in industrial structures through their superior platform, informational, and technological advantages. This explains why their centrality is typically above the average in most years. Cities such as Jiangmen and Zhaoqing, which have actively pursued green and low-carbon initiatives through collaborative efforts between government and enterprises, have registered over 300 green and low-carbon achievements in the past 5 years. These cities are emerging as examples of green development, with their centrality surpassing the average in certain years. Conversely, Dongguan, Foshan, Huizhou, and Zhongshan, with a centrality below the average in most years, are situated in peripheral roles in the GBA’s carbon emission spatial correlation network.
5.4.2 Closeness centrality result
A comprehensive analysis between 2000 and 2020 reveals that cities exhibiting a closeness centrality generally above the average include Hong Kong, Macau, Guangzhou, Shenzhen, Zhuhai, and Zhaoqing. In contrast, those falling below the average are Zhongshan, Jiangmen, Huizhou, Foshan, and Dongguan. Geographical factors, which inherently restrict closeness centrality, only permit it to display structural variations over time. The average closeness centrality for the years 2000, 2005, 2010, 2015, and 2020 were recorded at 68.78, 74.32, 74.24, 73.67, and 74.05, respectively. Cities such as Hong Kong, Macau, Guangzhou, Shenzhen, and Zhuhai are adept at rapidly integrating population inflows from other cities or exporting technology and capital through shorter routes. This capability fosters carbon emission connections, positioning them as “central actors” in the spatial correlation network. Zhaoqing, through the export of labor and land resources and the import of low-carbon technology and investments, also forms carbon emission relationship with other cities in the Bay Area, thus reflecting its higher closeness centrality. Cities such as Zhongshan, Jiangmen, Huizhou, Foshan, and Dongguan, with their lower closeness centrality, are influenced predominantly by their economic status, geographical location, and urban role, serving as “peripheral actors” in the network.
5.4.3 Betweenness centrality result
The comprehensive analysis between 2000 and 2020 also indicates that the betweenness centrality in the Bay Area generally maintains high levels, whereas regions outside the Bay Area demonstrate high betweenness centrality in specific years. The average betweenness centrality values for 2000, 2005, 2010, 2015, and 2020 are 2.36, 2.45, 2.56, 2.65, and 2.95, respectively. Cities such as Hong Kong, Macau, Guangzhou, Shenzhen, and Zhuhai have consistently exhibited high betweenness centrality over these years, signifying their significant role in influencing the carbon emissions of other cities in the spatial correlation network. Hong Kong and Macau notably contribute to the low-carbon green evolution of mainland cities, while Guangzhou, Shenzhen, and Zhuhai, due to their strategic geographic positions, serve as critical centers for information, talent, and low-carbon decision-making. These cities hold a commanding influence in the carbon emission spatial correlation network. Zhaoqing displays higher than average betweenness centrality in certain years. Conversely, Zhongshan, Jiangmen, Huizhou, Foshan, and Dongguan consistently demonstrate lower levels, thus occupying a “dominant” role in the spatial correlation network.
5.5 Spatial group structure of carbon emission in GBA
Utilizing the CONCOR block model analysis in the UCINET6 software, applying a depth of 2 and a concentration threshold of 0.2 for evaluation, and considering the previously mentioned divisions, we identify four blocks, as outlined in Table 4 according to the data in Table 4, the spatial correlations among these blocks are more pronounced than those in each individual block. Moreover, Hong Kong and Macau exhibit a predominant pattern of more inbound relationships compared to outbound ones, in contrast to other mainland cities where outbound relationships surpass inbound ones. This trend can be attributed to the configuration of blocks in the spatial correlation network, which is shaped by variables such as geographical location and economic factors. The regions of Hong Kong and Macau, characterized by their economic advancement, efficient transportation systems, and earlier development, attract a significant influx of elements from other cities.
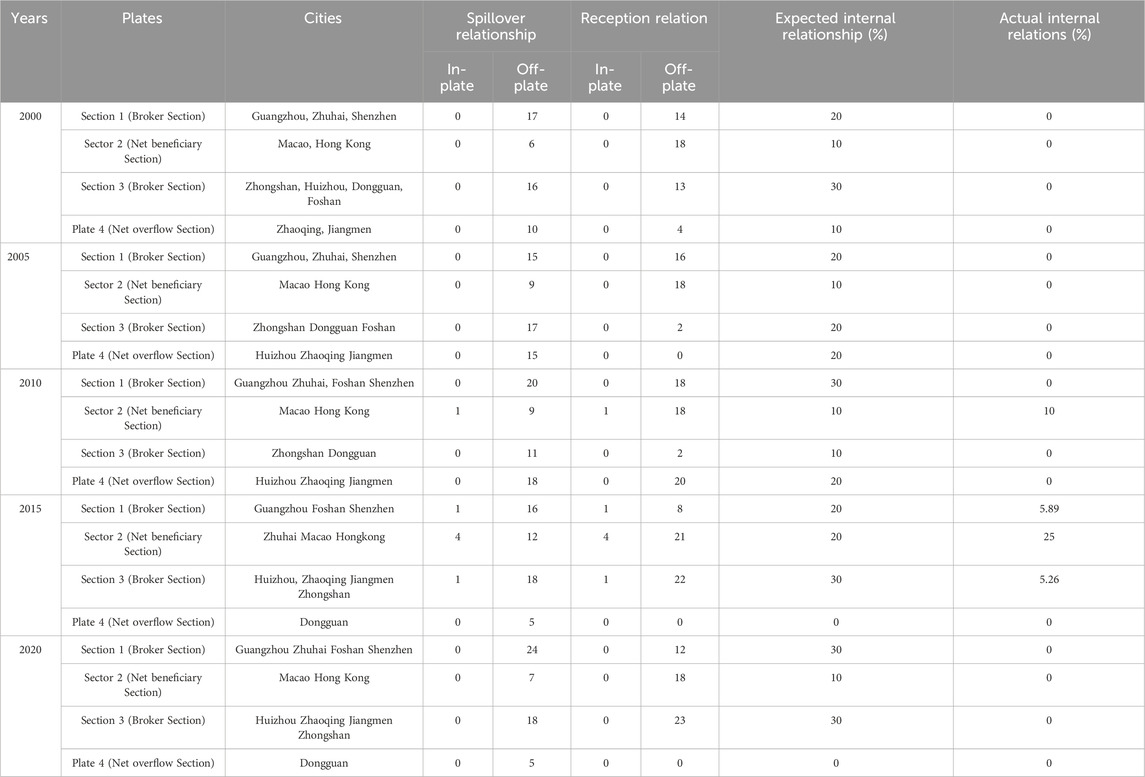
Table 4. Spatial correlation of carbon emission intensity in GBA.
Analyzing data from selected years: In the year 2000, the Hong Kong and Macau region emerged as a significant beneficiary area, while cities such as Jiangmen and Zhaoqing were net spillover blocks. Central cities in the Bay Area, including Guangzhou, Shenzhen, and Zhuhai, functioned as intermediary zones. This indicates that carbon emission factors were predominantly clustered in Hong Kong, Macau, and their neighboring cities during this period. Moving to 2005, Hong Kong and Macau continued to be the main recipient region, with an increasing number of mainland cities contributing elements. Guangzhou, Shenzhen, and Zhuhai sustained their roles as intermediary zones, witnessing a steady rise in the magnitude and frequency of element exchanges. By 2010, the role of Hong Kong and Macau remained consistent, with Zhongshan and Dongguan emerging as net spillover blocks, and cities such as Foshan, Zhaoqing, Jiangmen, and Huizhou transitioning into intermediary roles. In 2015, Guangzhou, Shenzhen, and Foshan evolved into bidirectional spillover blocks; Hong Kong and Macau continued as the primary beneficiary region. Zhaoqing, Jiangmen, Huizhou, and Zhongshan transformed into intermediary areas, and Dongguan became a net spillover block. In 2020, Guangzhou, Shenzhen, Zhuhai, and Foshan joined as net spillover blocks, with Hong Kong and Macau steadfast as the central beneficiary region. Zhaoqing, Jiangmen, Huizhou, and Zhongshan persisted as intermediary zones, and Dongguan remained a net spillover block. The yearly shifts in these blocks reveal that Hong Kong and Macau consistently benefit the most. Nonetheless, the overall trend of the carbon emission spatial correlation network is gravitating towards mainland cities such as Guangzhou and Shenzhen, influenced variably by external factors such as economic conditions and policies.
Evaluating the changes during the specified years, we see significant shifts. In 2005, relative to the year 2000, the cities of Zhongshan, Dongguan, Foshan, and Huizhou evolved into spillover blocks. This change contrasts with the stability observed in other cities’ blocks, which predominantly reflects an amplified flow of elements from the mainland cities in the Bay Area towards Hong Kong and Macau. This phenomenon can be attributed to the advanced economic state of Hong Kong and Macau. These areas exert a powerful attraction, drawing in the internal exchange elements of the Bay Area. This, in turn, leads to a decrease in the number of interlock relationships. Guangzhou, Shenzhen, and Zhuhai, recognized as the Bay Area’s central nodes for politics, economy, and technology, function as critical connections to Hong Kong and Macau. They consistently play a crucial intermediary role in this block. Concurrently, the secondary cities in the Bay Area, such as Zhongshan, Dongguan, Foshan, Huizhou, Zhaoqing, and Jiangmen, experience a significant inflow of related elements into the Hong Kong and Macau area. This surge is facilitated by the expanding spatial correlation network between Hong Kong, Macau, and the mainland, a phenomenon augmented under the Matthew effect. Upon comparing the years 2010 and 2005, we observe a bolstered hub function of the mainland cities in the Bay Area. This enhancement is a critical factor in the transition of Huizhou, Zhaoqing, and Jiangmen from net spillover blocks to intermediary blocks. Additionally, Foshan’s proximity to Guangzhou facilitated its transformation into an intermediary block. Fast forwarding to 2015, the Hong Kong and Macau area sustained its role in receiving elements from mainland cities. During this period, Zhuhai capitalized on its geographical position to become a net beneficiary block, witnessing an influx of elements in the carbon emission spatial correlation network. Cities such as Guangzhou, Shenzhen, and Foshan further solidified their central hub roles in the Bay Area. This consolidation also included Huizhou, Zhaoqing, Jiangmen, and Zhongshan in the intermediary block, all contributing to a clustering effect in the network, spurred by rapid and sustained economic and social growth. Dongguan emerged as the sole city primarily exporting elements. By 2020, the dynamics changed significantly due to the influence by the pandemic. The Hong Kong and Macau area reverted to being the sole net beneficiary blocks. Cities such as Guangzhou, Shenzhen, Foshan, and Zhuhai experienced a considerable outflow of elements, becoming net spillover blocks. This outflow was characterized by activities such as technology diffusion, industrial transfer, and investment. Meanwhile, Huizhou, Zhaoqing, Jiangmen, and Zhongshan persisted as intermediary blocks, with Dongguan continuing its role as a net spillover block.
5.6 Factors influencing the spatial correlation of carbon emissions in GBA
5.6.1 QAP correlation analysis
The information presented in Table 5 reveals that the four categories of differential factors—which include the level of economic development, urbanization rate, industrial composition, and intensity of environmental conservation—all successfully passed the significance test at the 10% level. This finding implies that these four elements are significantly interconnected with the spatial correlation pattern of carbon emission intensity in the Greater Bay Area. Among these, the level of economic development stands out as particularly crucial, signifying its dominant role in influencing this pattern. However, the coefficients related to geographical spatial proximity and differences in technological innovation did not exhibit significant results, suggesting that the effect of these two factor categories is not significantly noticeable.
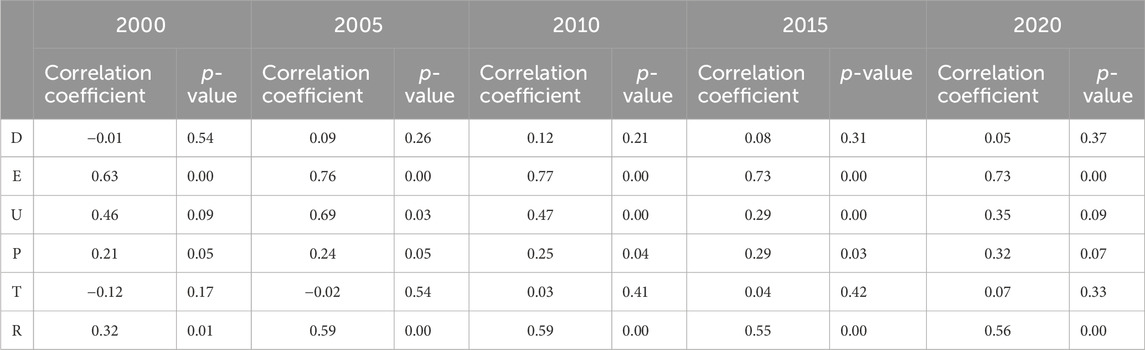
Table 5. QAP correlation analysis results from 2000 to 2020.
5.6.2 QAP regression analysis
An analysis of regression was performed focusing on the elements that shape the structure of the spatial correlation network for carbon emission intensity during the years 2000, 2005, 2010, 2015, and 2020. The results, as depicted in Table 6, reveal that the adjusted R2 values, determined after conducting 10,000 random permutations, are 40%, 64%, 64.2%, 54.3%, and 56.5% respectively. Importantly, each of these values cleared the 1% significance test threshold. This finding indicates that the six categories of differential factors—which consist of geographical spatial proximity, level of economic development, urbanization rate, industrial composition, the degree of technological innovation, and intensity of environmental conservation—collectively account for approximately 50% of the spatial correlation pattern. As indicated by Table 5, the coefficient concerning the difference in the level of economic development is positive and notably significant. This implies that an increased discrepancy in economic development levels among regions tends to result in a more closely-knit spatial correlation network of carbon emission intensity. This phenomenon typically occurs as regions with more advanced economic development often have more stringent environmental regulations. Therefore, this leads to a “carbon transfer” towards regions with comparatively lower levels of economic development, thereby establishing carbon connections between the two regions. The coefficient representing the difference in environmental conservation intensity is notably positive, with its peak significance occurring in 2010. This suggests that during that year, a larger gap in environmental conservation efforts between regions corresponded to a stronger spatial correlation in carbon emission intensity. The varying degrees of environmental regulation pressure across regions could prompt some businesses to move to areas with less stringent environmental policies, an action more favorable for their operation. Additionally, the coefficient linked to differences in industrial structure is positive, demonstrating significant importance up to the year 2015. This indicates that a greater difference in industrial structure between regions is associated with a tighter spatial correlation in carbon emission intensity. Such a difference in industrial structure tends to enhance the exchange of economic elements, thereby fostering economic interactions and mutual attraction among regions. In addition, the coefficient related to differences in urbanization levels was most significant in 2005 and is positively correlated. This implies that in 2005, regions with larger differences in urbanization levels were more likely to have a stronger spatial correlation in terms of carbon emission intensity. The variances in urbanization levels, which often lead to population movements, also progressively intensify the carbon emission association between cities.
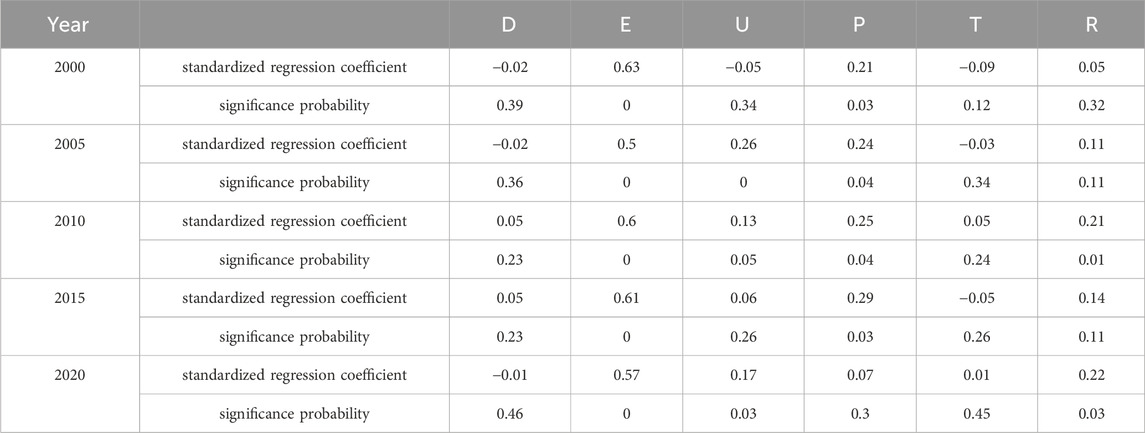
Table 6. QAP regression analysis results from 2000 to 2020.
6 Conclusion and discussion
From the year 2000–2020, the overall spatial network depicting carbon emissions in the GBA exhibited a trend of periodic fluctuations. The average number of connections and the network density stood at 55 and 0.5, respectively. This suggests a rather loose structural network among the cities, coupled with a considerable opportunity for spatial optimization. This fluctuation is influenced by city policies and socio-economic developmental stages. A network connectivity value of 1 implies a significant degree of inter-city correlation. The reducing trend in network hierarchy signals a declining reliance on certain central cities, thereby bolstering the overall network’s stability. This also reveals the carbon emission dynamics of the Bay Area in a comprehensive manner. Network efficiency, which decreased from 0.489 to 0.4, indicates a shift towards less rigid hierarchical structures and more robust interactions, and it reflects a positive development trend in the carbon emission marketplace.
The individual network structure indicators and the block model analysis highlight a prominent “core-periphery” pattern in the carbon emission spatial network. Economically advanced cities such as Hong Kong, Macau, Guangzhou, and Shenzhen form the network’s core, whereas less developed cities such as Huizhou and Jiangmen are situated on the periphery. In addition, central cities such as Guangzhou and Shenzhen maintain extensive spatial correlations with other cities and function as intermediary hubs. As the economy and society develop further, the roles and statuses of mainland cities in the Bay Area are on the rise. Even cities with lesser economic development, such as Zhaoqing, are managing to attract a significant inflow of elements in the network, thanks to the collaborative efforts of governments and enterprises.
The analysis derived from the QAP method reveals that six categories of differential factors—proximity in terms of geography, levels of economic advancement, urban development, the makeup of industries, innovation in technology, and the vigor of environmental conservation efforts—collectively account for roughly half of the patterns observed in spatial correlations. Notably, variances in economic and urban development, industry composition, and the vigor of environmental conservation efforts have a significant and positive effect on these spatial correlations.
It is crucial for planners to understand the complex network and spatial correlations of carbon emissions, and to pioneer collaborative strategies for reducing emissions across regions. This involves, on one side, leveraging macroeconomic controls and market dynamics to foster conditions conducive to interregional collaboration and spatially optimized carbon reduction. On the other side, it necessitates a focus on the interconnected spatial effect of carbon emissions. This would involve a shift towards a strategy that is driven by both “quantity and structure,” shifting reduction policies from “local” to “holistic” and from “point” to “area.” The GBA must continuously optimize and enhance the structure of its spatial network relating to carbon emission intensity. This involves setting region-specific objectives and boosting the spatial distribution efficiency of resources aimed at low-carbon initiatives. Significantly, central cities must utilize their roles as critical “intermediaries” and “bridges” in the network of carbon emission spatial correlations. By harnessing their influential position, these core cities can lead and inspire surrounding cities in their carbon reduction efforts, thereby fostering a coordinated approach to energy conservation and emission reduction. It is essential to consider the block structure traits of the carbon emission spatial network to tailor region-specific reduction policies. Moreover, cities should leverage their unique resource endowments and environmental capacities to encourage the strategic movement and effective clustering of various elements, thereby achieving a spatially nuanced management of low-carbon resources. In addition, cities should capitalize on the positive effect of economic growth, urban development, industrial composition, and environmental protection in shaping these spatial correlation ties. This involves focusing on the exchange of resources and the mobility of technical expertise between cities, particularly those with significant differences in their economic and industrial landscapes. Such an approach will promote a coordinated progression in carbon reduction initiatives.
This research contributes significantly to the understanding of the spatial network structure and the factors influencing carbon emission intensity in the Guangdong-Hong Kong-Macao Greater Bay Area (GBA). Utilizing spatial autocorrelation analysis, Social Network Analysis (SNA), and Quadratic Assignment Procedure (QAP) methodologies, the study explores the spatial correlation structure and identifies critical factors impacting carbon emission intensity across this economically vibrant region. These insights are instrumental for cities within the GBA to delineate their specific roles in emission reduction and to set targets for low-carbon development. Furthermore, the findings assist in formulating more equitable and focused coordinated emission reduction strategies for urban agglomeration. However, there are still some shortcomings in this study. However, there are still some deficiencies in this paper. 1) By offering a comprehensive analysis of the spatial and social network characteristics of carbon emissions within the GBA, this research significantly enriches the existing body of knowledge, providing valuable guidance for policymakers, urban planners, and stakeholders in their efforts to achieve sustainable urban development and meet China’s ambitious dual-carbon objectives. 2) Whether these carbon emission strategies are universally applicable to other regions requires further discussion and validation. 3) Future research could incorporate a variety of analytical methods, including machine learning algorithms, to identify complex patterns of carbon emissions or to predict future trends in carbon emission intensity. This would provide valuable support for potential carbon reduction strategies. This paper has already demonstrated the feasibility and scientific validity of the theoretical approach using data available up to 2020. Future work could further refine this approach by utilizing data from after 2020.
Data availability statement
Publicly available datasets were analyzed in this study. This data can be found here: https://www.ceads.net https://www.stats.gov.cn/english/.
Author contributions
HW: Writing–original draft, Writing–review and editing. CZ: Conceptualization, Data curation, Formal Analysis, Funding acquisition, Investigation, Methodology, Project administration, Resources, Software, Supervision, Validation, Visualization, Writing–original draft, Writing–review and editing.
Funding
The author(s) declare that no financial support was received for the research, authorship, and/or publication of this article.
Conflict of interest
The authors declare that the research was conducted in the absence of any commercial or financial relationships that could be construed as a potential conflict of interest.
Publisher’s note
All claims expressed in this article are solely those of the authors and do not necessarily represent those of their affiliated organizations, or those of the publisher, the editors and the reviewers. Any product that may be evaluated in this article, or claim that may be made by its manufacturer, is not guaranteed or endorsed by the publisher.
References
Bai, C., Zhou, L., Xia, M., and Feng, C. (2020). Analysis of the spatial association network structure of China's transportation carbon emissions and its driving factors. J. Environ. Manage. 253, 109765. doi:10.1016/j.jenvman.2019.109765
Boots, B., and Tiefelsdorf, M. (2000). Global and local spatial autocorrelation in bounded regular tessellations. J. Geogr. Syst. 2 (4), 319–348. doi:10.1007/pl00011461
Chen, H., Du, Q., Huo, T., Liu, P., Cai, W., and Liu, B. (2023). Spatiotemporal patterns and driving mechanism of carbon emissions in China's urban residential building sector. Energy (Oxf.) 263, 126102. doi:10.1016/j.energy.2022.126102
Chen, L., Xu, L., Cai, Y., and Yang, Z. (2021). Spatiotemporal patterns of industrial carbon emissions at the city level. Resour. Conserv. Recycl. 169, 105499. doi:10.1016/j.resconrec.2021.105499
Cheng, Y., Wang, Z., Ye, X., and Wei, Y. D. (2014). Spatiotemporal dynamics of carbon intensity from energy consumption in China. J. Geogr. Sci. 24 (4), 631–650. doi:10.1007/s11442-014-1110-6
Cui, Y., Khan, S. U., Deng, Y., and Zhao, M. (2022). Spatiotemporal heterogeneity, convergence and its impact factors: perspective of carbon emission intensity and carbon emission per capita considering carbon sink effect. Environ. Impact Assess. Rev. 92, 106699. doi:10.1016/j.eiar.2021.106699
Dong, B., Ma, X., Zhang, Z., Zhang, H., Chen, R., Song, Y., et al. (2020). Carbon emissions, the industrial structure and economic growth: evidence from heterogeneous industries in China. Environ. Pollut. 262, 114322. doi:10.1016/j.envpol.2020.114322
Dong, J., and Li, C. (2022). Structure characteristics and influencing factors of China's carbon emission spatial correlation network: a study based on the dimension of urban agglomerations. Sci. Total Environ. 853, 158613. doi:10.1016/j.scitotenv.2022.158613
Duman, Z., Mao, X., Cai, B., Zhang, Q., Chen, Y., Gao, Y., et al. (2023). Exploring the spatiotemporal pattern evolution of carbon emissions and air pollution in Chinese cities. J. Environ. Manage. 345, 118870. doi:10.1016/j.jenvman.2023.118870
Fang, C., Yu, X., Zhang, X., Fang, J., and Liu, H. (2020). Big data analysis on the spatial networks of urban agglomeration. Cities 102, 102735. doi:10.1016/j.cities.2020.102735
Fang, J., Zhu, J., Wang, S., Yue, C., and Shen, H. (2011). Global warming, human-induced carbon emissions, and their uncertainties. Sci. China Earth Sci. 54 (10), 1458–1468. doi:10.1007/s11430-011-4292-0
Feng, X., Lin, X., Li, Y., Yang, J., Yu, E., and Lei, K. (2023). Spatial association network of carbon emission performance: formation mechanism and structural characteristics. Socio-Econ. Plan. Sci. 91, 101792. doi:10.1016/j.seps.2023.101792
Franco, S., Mandla, V. R., and Ram Mohan Rao, K. (2017). Urbanization, energy consumption and emissions in the Indian context A review. Renew. Sustain. Energy Rev. 71, 898–907. doi:10.1016/j.rser.2016.12.117
Gan, C., Voda, M., Wang, K., Chen, L., and Ye, J. (2021). Spatial network structure of the tourism economy in urban agglomeration: a social network analysis. J. Hosp. Tour. Manag. 47, 124–133. doi:10.1016/j.jhtm.2021.03.009
Gao, L.-H., Ning, J., Bao, W.-L.-T.-Y., Yan, A., and Yin, Q.-R. (2022). A study on the marine ecological security assessment of Guangdong-Hong Kong-Macao Great Bay Area. Mar. Pollut. Bull. 176, 113416. doi:10.1016/j.marpolbul.2022.113416
Geng, J., Wang, J., Huang, J., Zhou, D., Bai, J., Wang, J., et al. (2022). Quantification of the carbon emission of urban residential buildings: the case of the Greater Bay Area cities in China. Environ. Impact Assess. Rev. 95, 106775. doi:10.1016/j.eiar.2022.106775
Golovko, A., and Sahin, H. (2021). Analysis of international trade integration of Eurasian countries: gravity model approach. Eurasian Econ. Rev. 11 (3), 519–548. doi:10.1007/s40822-021-00168-3
He, Y.-Y., Wei, Z.-X., Liu, G.-Q., and Zhou, P. (2020). Spatial network analysis of carbon emissions from the electricity sector in China. J. Clean. Prod. 262, 121193. doi:10.1016/j.jclepro.2020.121193
Huang, H., Jia, J., Chen, D., and Liu, S. (2024). Evolution of spatial network structure for land-use carbon emissions and carbon balance zoning in Jiangxi Province: a social network analysis perspective. Ecol. Indic. 158, 111508. doi:10.1016/j.ecolind.2023.111508
Hui, E. C. M., Li, X., Chen, T., and Lang, W. (2020). Deciphering the spatial structure of China's megacity region: a new bay area—the Guangdong-Hong Kong-Macao Greater Bay Area in the making. Cities 105, 102168. doi:10.1016/j.cities.2018.10.011
Huo, T., Cao, R., Xia, N., Hu, X., Cai, W., and Liu, B. (2022). Spatial correlation network structure of China's building carbon emissions and its driving factors: a social network analysis method. J. Environ. Manage. 320, 115808. doi:10.1016/j.jenvman.2022.115808
Jia, J., Chen, D., Ju, M., Lu, C., and Zhong, C. (2023). China's CO2 emissions: an innovative framework for analyzing carbon reduction in sustainable tourism under the guidance of the United Nations' sustainable development goals. J. Clean. Prod. 430, 139752. doi:10.1016/j.jclepro.2023.139752
Jia, P., Li, K., and Shao, S. (2018). Choice of technological change for China's low-carbon development: evidence from three urban agglomerations. J. Environ. Manage. 206, 1308–1319. doi:10.1016/j.jenvman.2017.08.052
Jia, X., Zhang, Y., Tan, R. R., Li, Z., Wang, S., Wang, F., et al. (2022). Multi-objective energy planning for China's dual carbon goals. Sustain. Prod. Consum. 34, 552–564. doi:10.1016/j.spc.2022.10.009
Khadaroo, J., and Seetanah, B. (2008). The role of transport infrastructure in international tourism development: a gravity model approach. Tour. Manag. 29 (5), 831–840. doi:10.1016/j.tourman.2007.09.005
Li, J., and Li, S. (2020). Energy investment, economic growth and carbon emissions in China—empirical analysis based on spatial Durbin model. Energy Policy 140, 111425. doi:10.1016/j.enpol.2020.111425
Lin, Q., Zhang, L., Qiu, B., Zhao, Y., and Wei, C. (2021). Spatiotemporal analysis of land use patterns on carbon emissions in China. Land 10 (2), 141. doi:10.3390/land10020141
Liu, Q., Song, J., Dai, T., Shi, A., Xu, J., and Wang, E. (2022). Spatio-temporal dynamic evolution of carbon emission intensity and the effectiveness of carbon emission reduction at county level based on nighttime light data. J. Clean. Prod. 362, 132301. doi:10.1016/j.jclepro.2022.132301
Luo, X., Liu, C., and Zhao, H. (2023). Driving factors and emission reduction scenarios analysis of CO2 emissions in Guangdong-Hong Kong-Macao Greater Bay Area and surrounding cities based on LMDI and system dynamics. Sci. Total Environ. 870, 161966. doi:10.1016/j.scitotenv.2023.161966
Lv, T., Hu, H., Zhang, X., Xie, H., Fu, S., and Wang, L. (2022). Spatiotemporal pattern of regional carbon emissions and its influencing factors in the Yangtze River Delta urban agglomeration of China. Environ. Monit. Assess. 194 (7), 515. doi:10.1007/s10661-022-10085-w
Mahmood, H., Alkhateeb, T. T. Y., and Furqan, M. (2020). Exports, imports, foreign direct investment and CO2 emissions in North Africa: spatial analysis. Energy Rep. 6, 2403–2409. doi:10.1016/j.egyr.2020.08.038
National Development and Reform Commission, Ministry of Foreign Affairs and Ministry of Commerce of the People's Republic of China, and with State Council authorization (2015). Vision and actions on jointly building the Silk Road Economic Belt and the 21st-century maritime silk road.
Ondrich, J., and Ruggiero, J. (2001). Efficiency measurement in the stochastic frontier model. Eur. J. Oper. Res. 129 (2), 434–442. doi:10.1016/s0377-2217(99)00429-4
Shao, H., and Wang, Z. (2021). Spatial network structure of transportation carbon emission efficiency in China and its influencing factors. China Popul. Resour. Environ. 19 (4), 295–303. doi:10.1016/j.cjpre.2022.01.002
Shi, K., Yu, B., Zhou, Y., Chen, Y., Yang, C., Chen, Z., et al. (2019). Spatiotemporal variations of CO2 emissions and their impact factors in China: a comparative analysis between the provincial and prefectural levels. Appl. Energy 233-234, 170–181. doi:10.1016/j.apenergy.2018.10.050
Simpson, W. (2001). The quadratic assignment procedure. North Am. STATA users’ group Meet. 1 (2), 12–13.
Song, M., Wu, J., Song, M., Zhang, L., and Zhu, Y. (2020). Spatiotemporal regularity and spillover effects of carbon emission intensity in China's Bohai Economic Rim. Sci. Total Environ. 740, 140184. doi:10.1016/j.scitotenv.2020.140184
Sun, L., Wang, Q., Zhou, P., and Cheng, F. (2016). Effects of carbon emission transfer on economic spillover and carbon emission reduction in China. J. Clean. Prod. 112, 1432–1442. doi:10.1016/j.jclepro.2014.12.083
Sun, Y., Jia, J., Ju, M., and Chen, C. (2022). Spatiotemporal dynamics of direct carbon emission and policy implication of energy transition for China’s residential consumption sector by the methods of social network analysis and geographically weighted regression. Land 11 (7), 1039. doi:10.3390/land11071039
Sun, Y., Zheng, S., Wu, Y., Schlink, U., and Singh, R. P. (2020). Spatiotemporal variations of city-level carbon emissions in China during 2000–2017 using nighttime light data. Remote Sens. 12 (18), 2916. doi:10.3390/rs12182916
Tabassum, S., Pereira, F. S. F., Fernandes, S., and Gama, J. (2018). Social network analysis: an overview. Wiley Interdiscip. Rev. Data Min. Knowl. Discov. 8 (5), e1256. doi:10.1002/widm.1256
Wang, F., Gao, M., Liu, J., and Fan, W. (2018). The spatial network structure of China’s regional carbon emissions and its network effect. Energies 11 (10), 2706. doi:10.3390/en11102706
Wang, G., Han, Q., and de Vries, B. (2020). A geographic carbon emission estimating framework on the city scale. J. Clean. Prod. 244, 118793. doi:10.1016/j.jclepro.2019.118793
Wang, S., Huang, Y., and Zhou, Y. (2019). Spatial spillover effect and driving forces of carbon emission intensity at the city level in China. J. Geogr. Sci. 29 (2), 231–252. doi:10.1007/s11442-019-1594-1
Wang, S., and Liu, X. (2017). China’s city-level energy-related CO2 emissions: spatiotemporal patterns and driving forces. Appl. Energy 200, 204–214. doi:10.1016/j.apenergy.2017.05.085
Wang, W.-Z., Liu, L.-C., Liao, H., and Wei, Y.-M. (2021). Impacts of urbanization on carbon emissions: an empirical analysis from OECD countries. Energy Policy 151, 112171. doi:10.1016/j.enpol.2021.112171
Wang, X., Long, R., Sun, Q., Chen, H., Jiang, S., Wang, Y., et al. (2024). Spatial spillover effects and driving mechanisms of carbon emission reduction in new energy demonstration cities. Appl. Energy 357, 122457. doi:10.1016/j.apenergy.2023.122457
Wang, Y.-J., and Xin, L. (2022). A review of climate change and its impact and adaptation in Beijing-Tianjin-Hebei urban agglomeration. Adv. Clim. Change Res. 18 (6), 743. doi:10.12006/j.issn.1673-1719.2022.019
Wei, W., Zhang, X., Zhou, L., Xie, B., Zhou, J., and Li, C. (2021). How does spatiotemporal variations and impact factors in CO2 emissions differ across cities in China? Investigation on grid scale and geographic detection method. J. Clean. Prod. 321, 128933. doi:10.1016/j.jclepro.2021.128933
Weng, H., Kou, J., and Shao, Q. (2020). Evaluation of urban comprehensive carrying capacity in the Guangdong-Hong Kong-Macao Greater Bay Area based on regional collaboration. Environ. Sci. Pollut. Res. Int. 27 (16), 20025–20036. doi:10.1007/s11356-020-08517-6
Wu, M., Wu, J., and Zang, C. (2021). A comprehensive evaluation of the eco-carrying capacity and green economy in the Guangdong-Hong Kong-Macao Greater Bay Area, China. J. Clean. Prod. 281, 124945. doi:10.1016/j.jclepro.2020.124945
Xinhua Finance Agency (2018). What Guangdong-Hong Kong-Macao greater bay area will bring for in? Vectors? Beijing: Xinhua Finance Agency.
Yang, X., Jia, Z., Yang, Z., and Yuan, X. (2021). The effects of technological factors on carbon emissions from various sectors in China—a spatial perspective. J. Clean. Prod. 301, 126949. doi:10.1016/j.jclepro.2021.126949
Yu, Y., and Zhang, N. (2021). Low-carbon city pilot and carbon emission efficiency: quasi-experimental evidence from China. Energy Econ. 96, 105125. doi:10.1016/j.eneco.2021.105125
Zeng, L., Li, C., Liang, Z., Zhao, X., Hu, H., Wang, X., et al. (2022). The carbon emission intensity of industrial land in China: spatiotemporal characteristics and driving factors. Land (Basel) 11 (8), 1156. doi:10.3390/land11081156
Zhang, C., and Tan, Z. (2016). The relationships between population factors and China's carbon emissions: does population aging matter? Renew. Sustain. Energy Rev. 65, 1018–1025. doi:10.1016/j.rser.2016.06.083
Zhang, X.-P., and Cheng, X.-M. (2009). Energy consumption, carbon emissions, and economic growth in China. Ecol. Econ. 68 (10), 2706–2712. doi:10.1016/j.ecolecon.2009.05.011
Zhao, C., Chen, J., Su, G., and Yuan, H. (2020). Assessment of the climate change adaptation capacity of urban agglomerations in China. Mitig. Adapt. Strateg. Glob. Chang. 25 (2), 221–236. doi:10.1007/s11027-019-09874-5
Zhao, Y., Chen, R., Zang, P., Huang, L., Ma, S., and Wang, S. (2022). Spatiotemporal patterns of global carbon intensities and their driving forces. Sci. Total Environ. 818, 151690. doi:10.1016/j.scitotenv.2021.151690
Zhao, Y., Zhang, G., and Zhao, H. (2021). Spatial network structures of urban agglomeration based on the improved gravity model: a case study in China’s two urban agglomerations. Complexity 2021, 1–17. doi:10.1155/2021/6651444
Zhou, Y., Shan, Y., Liu, G., and Guan, D. (2018a). Emissions and low-carbon development in Guangdong-Hong Kong-Macao Greater Bay Area cities and their surroundings. Appl. Energy 228, 1683–1692. doi:10.1016/j.apenergy.2018.07.038
Zhou, Z., Liu, C., Zeng, X., Jiang, Y., and Liu, W. (2018b). Carbon emission performance evaluation and allocation in Chinese cities. J. Clean. Prod. 172, 1254–1272. doi:10.1016/j.jclepro.2017.10.208
Zhu, Q., and Peng, X. (2012). The impacts of population change on carbon emissions in China during 1978–2008. Environ. Impact Assess. Rev. 36, 1–8. doi:10.1016/j.eiar.2012.03.003
Keywords: carbon emission intensity, spatial correlation, social network analysis, QAP analysis, carbon reduction policy
Citation: Wei H and Zheng C (2024) Spatial network structure and influencing factors of carbon emission intensity in Guangdong-Hong Kong-Macao greater bay area. Front. Environ. Sci. 12:1380831. doi: 10.3389/fenvs.2024.1380831
Received: 02 February 2024; Accepted: 25 March 2024;
Published: 16 April 2024.
Edited by:
Xiong Zhou, Beijing Normal University, ChinaReviewed by:
Yang Wang, Yunnan Normal University, ChinaJunsong Jia, Jiangxi Normal University, China
Copyright © 2024 Wei and Zheng. This is an open-access article distributed under the terms of the Creative Commons Attribution License (CC BY). The use, distribution or reproduction in other forums is permitted, provided the original author(s) and the copyright owner(s) are credited and that the original publication in this journal is cited, in accordance with accepted academic practice. No use, distribution or reproduction is permitted which does not comply with these terms.
*Correspondence: Chaohui Zheng, saxcz2@nottingham.edu.cn