Applying colloidal silica suspensions injection and sequential gelation to block vertical water flow in well annulus: laboratory testing on rheology, gelation, and injection
 Lirong Zhong
 Rob Mackley
  Fred Day-Lewis
 Sarah Saslow
- Energy and Environment Directorate, Pacific Northwest National Laboratory, Richland, WA, United States
We evaluated the application of silica suspension injection and sequential gelation to block vertical water flow in the annuli of long-screened wells. First, we studied the viscosity, rheological behavior, and gelation performance of colloidal silica suspensions in batch tests. Then, we tested the injection of silica suspensions and the water flow blocking efficiency of the later formed silica gel in column and bench-scale sandbox experiments. Micron-sized fumed powder silica suspensions and nanosized silica suspensions recovered from geothermal fluids were tested in this work. Fumed silica suspensions showed shear thinning, while nanosized silica suspensions exhibited Newtonian flow behavior. During the gelation process, the nanosized silica suspension changed from a Newtonian fluid to a shear thinning fluid while increasing its overall viscosity. At comparable concentrations, the nanosized silica suspensions have much lower viscosity than that of the fumed silica suspensions. Increases in the Na+ concentration and silica particle concentration in these suspensions shortened the gelation time. Silica suspension gelation in sand columns completely blocked the water flow and sustained the injection pressure up to 50 psig (344.7 kPa). A silica suspension was successfully injected into the target zone in the annulus of a bench-scale sandbox mimicking long-screened wells in the field. The silica gel formed in the annulus effectively blocked chemical transport through the gelled zone. Our research reveals that a process using silica suspension injection and sequential gelation technology is promising for blocking the vertical water flow and chemical transport through the filter pack in targeted zones within the annulus of long-screened well systems.
1 Introduction
Gelling colloidal silica (CS) in aqueous suspensions have low viscosity when freshly prepared, then undergo an increase in viscosity over time, and may eventually form gels when the formulations of the suspensions are desirable (Yang et al., 2016; Katoueizaheh et al., 2020). The suspensions also exhibit shear thinning behavior (Chen et al., 2005; Amiri et al., 2009; Zhong et al., 2018). Low viscosity and shear thinning property of fresh silica suspensions promote easy injection of the suspensions into the subsurface. Gelation enables the suspension to remain in a target location in the subsurface to perform its desired functions such as plugging leaks, blocking flows, and grouting contaminants.
Attributed to the good injectability and minimal environmental impact of colloidal silica suspensions and the sequential gelation after injection of the suspensions, CS suspensions have found a wide range of subsurface applications. They were tested and applied to block formation flows, plug leaks (Ezzedine et al., 2012; Hunt et al., 2013; Fleury et al., 2017; Ngo et al., 2021), and subsurface barrier applications (Durmusoglu and Corapcioglu, 2000; Kim and Corapcioglu, 2002). The CS suspensions were also studied for subsurface grouting for the purpose of contaminant immobilization (Truex et al., 2011) and applied to hard rock grouting during tunneling (Funehag and Fransson, 2006; Funehag and Gustafson, 2008; Sögaard et al., 2018a; Sögaard et al., 2018). Remedial amendments can be added to silica suspensions and injected into the subsurface for gelation and thus form a slow-release source for amendments to maintain long-lasting remediation (Yang et al., 2016; Zhong et al., 2018). The field-scale application of CS gel includes oilfield water-production control and well casing-leak treatment (Jurinak and Summers, 1991). At the laboratory scale, the potential of using silica grout to seal cement fractures under elevated temperature and pressure conditions was also demonstrated (Pagano et al., 2022).
The viscosity and flow behavior of CS suspensions are critical knowledge for subsurface injections of these fluids for engineering purposes such as the design of injection systems and injection rates. The study of the rheological properties of silica suspensions is also essential for the strategic preparation and handling of silica suspensions before injection. The gelation and rheological properties of the silica gel after injection are also important for the evaluation of silica gel applications.
Because of the versatile industrial applications of aqueous CS suspensions and the gels formed from these suspensions, many studies on the rheological behavior of aqueous CS suspensions and the gelation process have been reported. Amiri et al. (2009) and Chen et al. (2005) looked at how the silica particle mass fraction, the suspension pH, and the salinity of these fluids changed the viscosity and gelling properties of silica suspensions. Sögaard et al. (2021) and Simonsson et al. (2018) studied the ion specific effects on gelling of silica nanoparticle suspensions in salt mixtures. Katoueizadeh et al. (2020) divided the gelation process into three stages of induction, gelation, and overcuring. Sun et al. (2016) concluded that larger silica particle sizes in the suspension led to a relatively stronger gel. Kawaguchi et al. (1995) discovered that when present in the aqueous silica suspension, organic polymer molecules are adsorbed onto the surfaces of particles and increase the shear viscosity of the suspension.
The Derjaguin–Landau–Verwey–Overbeek (DLVO) theory is applied to describe the stability of colloidal suspensions. It was reported that the magnitude of zeta potential as a function of salt concentration of the silica particle suspensions could be predicted by the classical DLVO theory (Yotsumoto and Yoon, 1993; Amiri et al., 2009). However, some stability behavior of aqueous silica suspensions could not be described by the DLVO theory (Yotsumoto and Yoon, 1993; Binks and Lumsdon, 1999). One example is that the presence of short-range repulsive forces between the particles cannot be predicted by the DLVO theory (Yotsumoto and Yoon, 1993). Although progress has been made, knowledge of the rheological behavior of the CS suspension and gel system during the gelation process is sporadic, which is critical to predict the behavior of the suspension and gel during injection and gelation.
The focus of the rheological study in this work is on gelation of silica suspensions. When a silica suspension is gelled, it first increases viscosity, and then the particles connected to each other and develop rigidity. The gel fills the whole volume originally occupied by the suspension with one phase. In comparison, when the suspension is destabilized and resulted in coagulation or flocculation, precipitation of solids occurred, and phase separation occurs.
Many long-screened wells have been constructed for monitoring purposes, such as those at the US Department of Energy (DOE) Hanford site located in southeast Washington State (Vermeul et al., 2011; Day-Lewis et al., 2023). In long-screened wells, ambient vertical flows in the wellbore can reach liters per minute, even with a minimal water head difference in the well-connected aquifer layers (Vermeul et al., 2011; Poulsen et al., 2019). Wellbore mixing due to ambient vertical flows during groundwater sampling from long-screen wells may produce biased results (Vermeul et al., 2011; Huang et al., 2022; Day-Lewis et al., 2023). Attempts to isolate the unwanted groundwater flow to the sampler using a packer system inside the wellbore are effective to some extent in reducing the biases in the sample concentrations. However, groundwater can still flow around the packer system within the annulus, as illustrated in Figure 1. Besides causing challenges in groundwater sampling, the unwanted vertical water flow in these wells also induces interchanges of contaminant plumes at different depths. These plumes flow into and mix in the wellbore of long-screened wells, causing vertical redistribution of the contaminant mass among the formation layers within the aquifer.
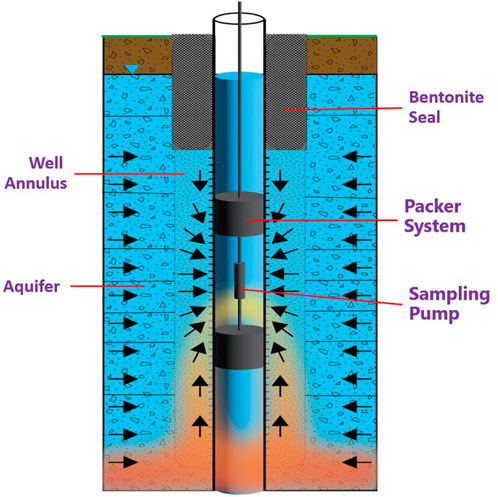
Figure 1. Illustration of the vertical water flow around the packer system in a long-screened well annulus that causes biased groundwater sampling results.
Therefore, blocking the vertical water flow in the long-screened well annulus and sealing the groundwater flow from the target aquifer layers into wells are needed to obtain accurate concentrations of contaminants from sampling. Attributed to the flow and gelation characteristics of CS suspensions and their environmental benignity, these suspensions are auspicious candidates for this specific application of blocking the vertical water flow in well annuli. To successfully block vertical water in the well annulus, the injection and placement of the fluid before gelation into the annulus at the target location is critical. CS suspensions have much lower viscosity compared to other grouting materials, which facilitates injections into discrete target zones in the annulus. Only salt such as NaCl is added to the CS suspension to initiate gelation. Therefore, the silica-gel has much less environment impact compared to other grouting materials, including cement. The gelation time of the CS suspension can be easily controlled by adjusting the salt concentration of the fluid according to the operation needs, ensuring an easier handle compared to other grouting materials. Thus, CS suspensions can potentially be injected into the filter pack in the annulus of long-screened wells at desired depths to form impermeable silica gel to block an unwanted vertical water flow. The application of CS suspension injection and the sequential gelation at target locations in the well annulus to block water flow has not been reported in the literature. This is a novel engineering approach for water flow controll in the well sampling systems.
In this work, we conducted rheological testing and a gelation batch study of CS suspensions of two forms of CS: micron-sized fumed silica (FS) powder and nanosized CS recovered from geothermal fluids. The rheological properties of the CS suspensions and their gelation behavior provide bases for the handling and injection of the suspensions. Column and preliminary sandbox tests were performed to study the vertical water-flow-blocking performance of the silica gel in the annuli of long-screened wells and, therefore, to evaluate the feasibility of applying this CS suspension injection and gelation technology to block unwanted water flows in long-screened well systems. The electrical conductivities of the suspensions were measured and compared with those of Hanford site simulated groundwater (SGW) to show whether the electrical resistivity tomography (ERT) geophysical method can be used to monitor the distribution of the injected CS suspensions.
2 Materials and methods
Batch, column, and sandbox experiments were performed in this work. The materials used and testing procedures applied are presented below.
2.1 Materials
Two silica suspensions were tested. One was prepared from dry FS powder. This powder was purchased from Aldrich Chemical (Milwaukee, WI, USA). It has a mean particle size of 0.2–0.3 µm (aggregate) and a Brunauer–Emmett–Teller (BET) surface area of 220 m2/g. This powder was dispersed into ultrapure water (Millipore Milli-Q system, resistivity = 18.2 MΩ cm) to prepare the suspension. The other CS suspension, GEO-40 Sol-1030Na, was obtained from GEO40.com (Auckland, New Zealand) in suspension form. This CS was recovered from geothermal fluids. GEO-40 was selected for water-flow-blocking column tests and sandbox tests because the CS recovered from geothermal fluids has a comparatively low carbon footprint. This suspension contains 30.6 wt% silica particles. Based on the technical data provided by the vendor, the measured particle size is 7.0–10.0 nm with average of 8.0 nm. The surface area ranged from 272 to 388 m2/g with the areage at 341 m2/g. The pH of the suspension is 9.8.
Sodium chloride (NaCl) was used as the destabilizer for the silica suspensions to initiate the gelation process. Amaranth dye was applied to color the silica suspension for the purpose of visually tracking the distribution of the suspension in a porous medium after injection. Potassium bromide (KBr) was selected as the chemical tracer in the sandbox tests.
Accusand (Covia Corp, Ottawa, MN) with 99.8% SiO2 was the porous medium used in the batch, column, and sandbox experiments. Hanford Site SGW (Emerson et al., 2017) was prepared to saturate the porous media in the batch, column, and sandbox tests.
2.2 Experimental setup and test procedures
2.2.1 Rheology tests
Rheology measurements were conducted using an Anton Paar Physica MCR101 rotational rheometer (Anton Paar Inc., Ashland, VA, USA). A cup-and-spindle measuring system, CC27, was used for the steady shear viscosity measurements. A built-in temperature control chamber allowed the selection of the desired temperature (20°C ± 0.1°C). The rheology flow curves were measured for suspensions with shear rates between 0.1 s−1 and 150 s−1. Measurements at a steady shear rate of 100 s−1 were also performed to test the change in the suspension viscosity over time during the gelation process.
The storage modulus (G′), loss modulus (G″), and complex viscosity (η*) of the silica suspension and gel were measured using an MCR 101 rheometer with a plate–plate (PP25/TG) measuring system. The PP25/TG system has a diameter of 2.5 cm with the measuring gap set at 0.7 mm. The measuring temperature was 20°C, at which the zero gap was set for each measurement. The following steps were followed for the rheology studies on the silica suspensions during gelation: (1) Perform an oscillatory amplitude sweep for each sample to define the linear viscoelastic (LVE) region. (2) Conduct a frequency sweep with the shear strain within the LVE region to determine η*, G′, and G″ for the sample; the frequency ranged from 700 to 0.1 rad/s. (3) Repeat steps (1) and (2) on the sample at each time interval until gel is formed. An inner gas flow was applied through the measuring hood during measurements.
2.2.2 Batch gelation tests
In each test, grade 20/30 Accusand was first packed into a 50 mL vial to fill the vial to the 30 mL level. The sand pack was saturated with Hanford site SGW. Then, 7 mL of a silica suspension with the desired Na+ concentration and 200 mg/L Amaranth red dye were injected into the bottom of the sand pack with a syringe-needle unit. The SGW displaced to the top of the sand pack by injecting the silica suspension was removed from the vial while keeping the sand pack saturated. The sand pack with the bottom section saturated by the silica suspension was kept in the vial undisturbed for a desired length of time for gelation after the vial was sealed with a cap. The vial was then inverted upside down to check the gelation of the silica suspension in the sand pack. In this inversion step, the sand pack with the gelled silica suspension was grouted and stuck to the bottom end of the vial, while the un-gelled loose sand would drop to the cap end of the vial.
2.2.3 Column tests
A polyvinyl chloride (PVC) column with a 2.54 cm (1.0 inch) inner diameter (ID) and 30.0 cm length was used to pack 20/30 Accusand. The column was first saturated with Hanford SGW. Water was pumped through the column at a 1.5 mL/min flow rate to determine the injection pressure. A silica suspension with 20 wt% CS particles, 10,000 mg/L Na+, and 200 mg/L Amaranth dye was then injected through the column to replace the SGW for gelation. After a gelling time of 24 h, water was injected into the column at a flow rate of 1.5 mL/min, and the injection pressure was recorded.
To test the strength of the silica gel for sustaining the injection pressure and to test the influence of gel aging on this performance, water injection tests were conducted at aging times of 1, 2, 3, 4, and 15 days after gelation. Water injection was stopped when the pressure reached 20, 25, 35, 45, and 50 psig (137.88, 172.55, 241.29, 310.23, 344.7 kPa) during injection on day 1, 2, 3, 4, and 15, respectively. The pressure rating of the column testing system is 50 psig (344.7 kPa). After day 15, an injection pressure of 45 psig (310.23 kPa) was maintained at the column influent end with a Teledyne ISCO pump using the constant pressure mode for 120 days while the column effluent flow was monitored.
To evaluate the feasibility of using ERT to monitor the distribution of the injected silica suspension during field applications, electrodes were installed on this column setup to measure the electrical resistivity (ER). A portable lab spectral induced polarization (SIP) measurement system (Ontash & Ermac Inc. River Edge, NJ) was used for the tests with the silica suspensions and silica gel contained in a PVC column. The frequency range of the alternate current used for the measurements was from 0.1 Hz to 1,000 Hz. A set of tests was conducted with the following systems:
• The baseline of sediment column saturated with deionized water (DIW).
• Sediment column saturated with Hanford Site SGW.
• Sediment column saturated with 20 wt% silica and 10,000 mg/L Na+.
• Sediment column filled with fresh and aged silica gel.
2.2.4 Sandbox tests
A benchtop-scale sandbox simulating a field long-screened well system was constructed. The components and dimensions of the sandbox are illustrated in Figure 2. In order to observe the distribution of the injected CS suspension with dye, the system was built with transparent PVC pipes.
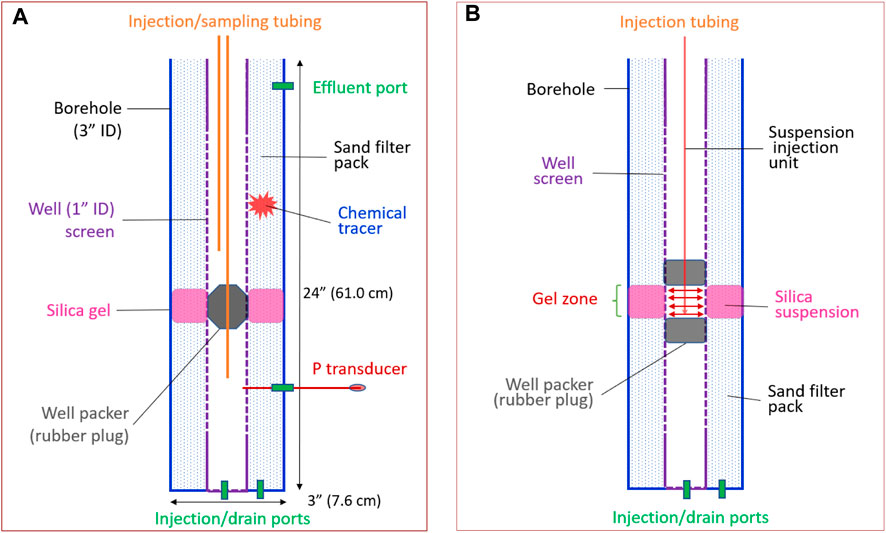
Figure 2. Cross sections of the sandbox. The sandbox was built with transparent PVC plastic pipes. The well and borehole have 2.54 cm (1.0 in.) and 7.62 cm (3.0 in.) IDs, respectively. (A) Sandbox setup after silica gel forms in the well annulus. (B) Test setup for injecting a silica suspension into the well annulus. The base area of the annulus is 39.50 cm2, the estimated pore volume of the “Gel zone” with a height of 7.0 cm is 82.9 cm3 using a porosity of 30%. The dimensions (B) are the same as (A)
A set of preliminary sandbox experiments were conducted following this procedure:
1. Pack the annulus of the sandbox with Accusand; saturate the annular sand pack with Hanford Site SGW.
2. Insert a rubber plug into the well to the location indicated in Figure 2A. Inject water from the port at the bottom of the well at a flow rate of 5.0 mL/min and measure the injection pressure with the effluent port of the sandbox open to the air and allow free water flow.
3. Conduct a tracer test by injecting 15 mL of the chemical tracer KBr at a concentration of 5,000 mg/L into the annulus sediment above the rubber plug. After injecting the tracer, take liquid samples from the well at locations above and below the plug, as shown in Figure 2A. Each tracer test lasts for 10 h with sampling intervals of 0.5 h, and each sample volume is 1.5 mL. Tracer concentrations were determined using a Br electrode (Accumet Materials Co. LLC).
4. Replace the rubber plug with a unit built for the injection of a CS suspension into the annulus, as shown in Figure 2B. Inject 140 mL of a CS suspension with dye. Monitor the distribution of the CS suspension.
5. After gelation, replace the injection unit with the rubber plug and conduct a tracer test following the same procedure described above.
6. Conduct a water injection test, as described in Step 2.
3 Results and discussion
Batch and rheological studies revealed that (1) the fumed silica suspensions showed shear thinning, while nanosized silica suspensions exhibited Newtonian flow behavior; (2) the GEO-40 silica suspension changed from a Newtonian fluid to a shear thinning fluid while increasing its overall viscosity during the gelling process; (3) at comparable concentrations, the GEO-40 silica suspensions had much lower viscosity than that of the fumed silica suspensions; (4) increases in Na+ concentration and silica particle concentration in suspensions shortened the gelation time. Column and sandbox tests showed that (1) silica suspension gelation in sand columns completely blocked the water flow and sustained the injection pressure up to 50 psig (344.7 kPa); (2) silica suspension could be successfully injected into the target zone in the annulus of a bench-scale sandbox mimicking long-screened wells in the field; (3) silica gel formed in the annulus effectively blocked chemical transport through the gelled zone.
3.1 Silica suspension viscosity versus silica concentration
The viscosities of both FS and Geo-40 silica suspensions increased when the silica concentrations were increased. The FS suspension has a much higher viscosity compared to that of the Geo-40 suspension at comparable concentrations. As illustrated in Figure 3, the viscosities of FS at a concentration of 8 wt% were 506.0, 264.0, and 78.8 mPa·s at shear rates of 10, 22, and 100 s−1, respectively (Figure 3A). In contrast, the viscosity of the Geo-40 suspension at 10 wt% was 2.2 mPa·s at all tested shear rates (Figure 3B). Because the viscosity increases with the silica concentration, it is certain that if the Geo-40 concentration was 8 wt%, the viscosity would be lower than 2.2 mPa·s, which is only about 4.3% of the FS suspension viscosity at a shear rate of 100 s−1, implying that the Geo-40 suspension favors subsurface injection.
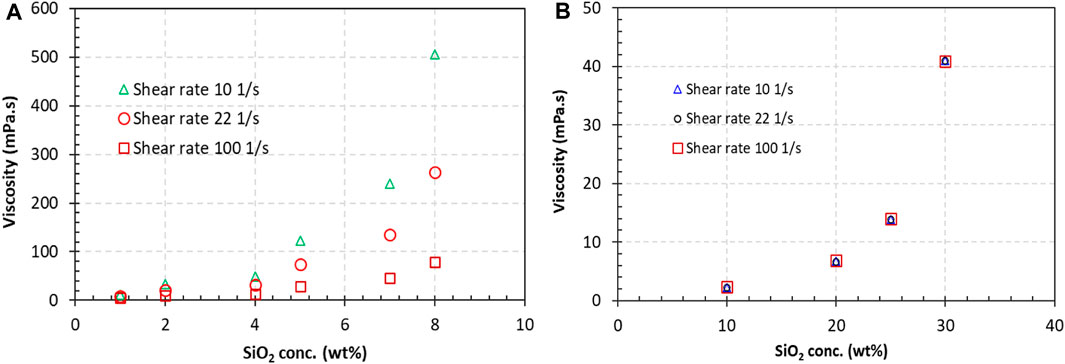
Figure 3. Viscosities of (A) FS and (B) Geo-40 silica suspensions. FS concentrations ranged from 1 wt% to 8 wt%, suspension with DIW; Geo-40 at concentrations of 10%, 15%, 20%, 25%, 30%, also in DIW.
The FS suspension showed shear thinning even at a 1 wt% concentration, while the Geo-40 nanosized silica suspension did not exhibit shear thinning. Further discussion of shear thinning is presented in the next section.
3.2 Silica suspension viscosity versus shear rate
The FS suspension shows shear thinning at the tested concentrations (one to eight wt%), while the Geo-40 nanosized silica suspensions did not show a shear-dependent viscosity, even at 30 wt% (Figure 4). Similar shear thinning behavior was reported by Amiri et al. (2009), Yang et al. (2016, 2017), and Zhong et al. (2018) for FS suspensions when the concentration was at and higher than 0.7 wt%. This shear thinning characteristic reveals that the aggregates formed by particle interactions are broken when the shear rate increases (Amiri et al., 2009). For the nanosized silica suspension, such particle–particle interaction does not exist, as indicated by its Newtonian fluid viscosity behavior. It was reported that the nanosized silica particle suspensions showed Newtonian viscosity behavior for particle concentrations up to 41 wt% with shear rates ranging from 1 to 200 s−1 (Metin et al., 2011).
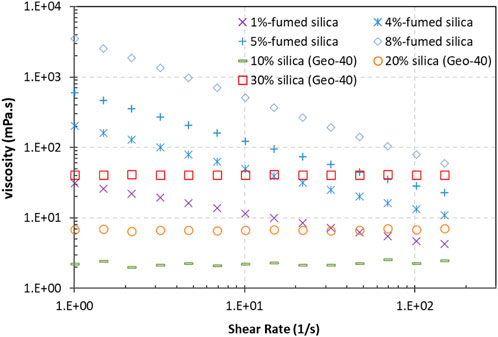
Figure 4. Viscosity as a function of the shear rate of micron-sized FS and nanosized Geo-40 silica suspensions.
Even though the Geo-40 CS suspensions do not show shear thinning, the viscosity is lower compared to the FS CS at the same concentrations at all tested shear rates (Figure 4). Therefore, Geo-40 has better injectability and a higher penetration potential. Further, because Geo-40 CS is recovered from geothermal fluids, it has a consequently lower carbon footprint than the FS CS. Thus, Geo-40 CS was selected for the gelation and water-flow-blocking study in the column and sandbox tests of this study.
The viscosity of the Geo-40 sol with 1,500 mg/L Na+ increased with time (Figure 5). As the gelation process proceeded, the viscosity of the suspension increased. When the viscosity reached a certain value, the suspension showed shear thinning behavior, revealing that the SiO2 particle clusters must reach a certain dimension during the gelation process for the shear thinning behavior to occur.
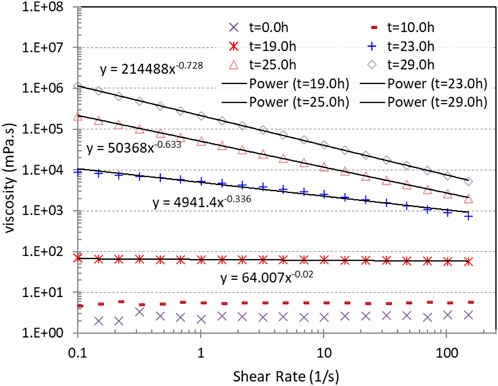
Figure 5. Viscosity and shear thinning property of Geo-40 nanosized silica suspensions with 1,500 mg/L Na+ during the gelation process, with power-law data fittings.
The shear thinning non-Newtonian flow curves can be fitted with a power-law equation (Zhong et al., 2013):
where
Cross-linking among the silica particles, e.g., the formation of siloxane bonds, gives rise to the viscosity of the suspensions (Iler, 1979; Brinker, 1994; Yossapol, 2002; Sögaard, et al., 2018; Pagano et al., 2022). The cross-linking formed particle clusters that grow with time (Iler, 1979). As the clusters become larger, they do not move randomly anymore in the suspension but will form agglomerates, thus increasing the viscosity of the suspension. This agglomerate microstructure will break when the shear rate is increased in the flow, and the viscosity decreases as the particles are free to flow, resulting in shear thinning.
3.3 Gelation time and influence of the Na+ concentration
Adding more Na+ ions to the CS system shortens the gelation time. When the CS concentration was high (e.g., 30.0%), the gelation time could be as short as a few minutes when the added Na+ concentration was 10,000 mg/L (Figure 6). As the Na+ concentration was reduced to 1,000 mg/L, the gelation time increased to 40 h. The time would be even longer when the Na+ concentration was further reduced (Figure 6).
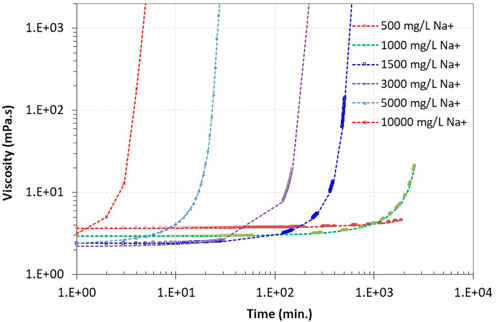
Figure 6. Influence of the Na+ concentration on the gelation time of the Geo-40 nanosized silica (30 wt%) suspension, as indicated by the quick increases in viscosity.
Higher Na ion concentration induced shorter gelation time for nano silica particle suspensions was also reported by Ghaffari et al. (2022). For the water-borne CS suspension, there is a “double layer” of water and electrolytes, which suspend the particles, with a thickness of about 2 nm surrounding the silica particles (Roberts and Bergna, 2006). This “layering structure” around the particles is also referred as electrical double layer (Amiri et al., 2009). Increasing the Na+ concentration in the silica suspensions diminishes the thickness of the double layer, thus allowing the silica particles to approach more closely to each other. At a closer distance, the van der Waals attractions force exceeds the electrostatic repulsion between particles which induces connections among the particles. Formation of siloxane bonds (Si–O–Si) between silica particles occur in the system and eventually resulting in gelation (Iler, 1979; Brinker, 1994; Yossapol, 2002; Sögaard, et al., 2018; Pagano et al., 2022). Controlling the gelation time of the silica suspensions is an important step in the subsurface applications of silica suspension gelation to provide sufficient time for the handling and injection of the silica suspension before gelation.
3.4 Influence of the Na+ concentration and silica concentration on the rheology of the suspensions
Oscillatory measurements reveal the microstructures of the CS suspensions. Figure 7 presents the loss and storage moduli, G″ and G’, of the suspensions over time. The measurements were started once the suspension was prepared and continued until the gelation time was passed. Figures 7A–C compare the influence of the Na+ concentration, and Figures 7C–F show the impact of the silica particle concentration.
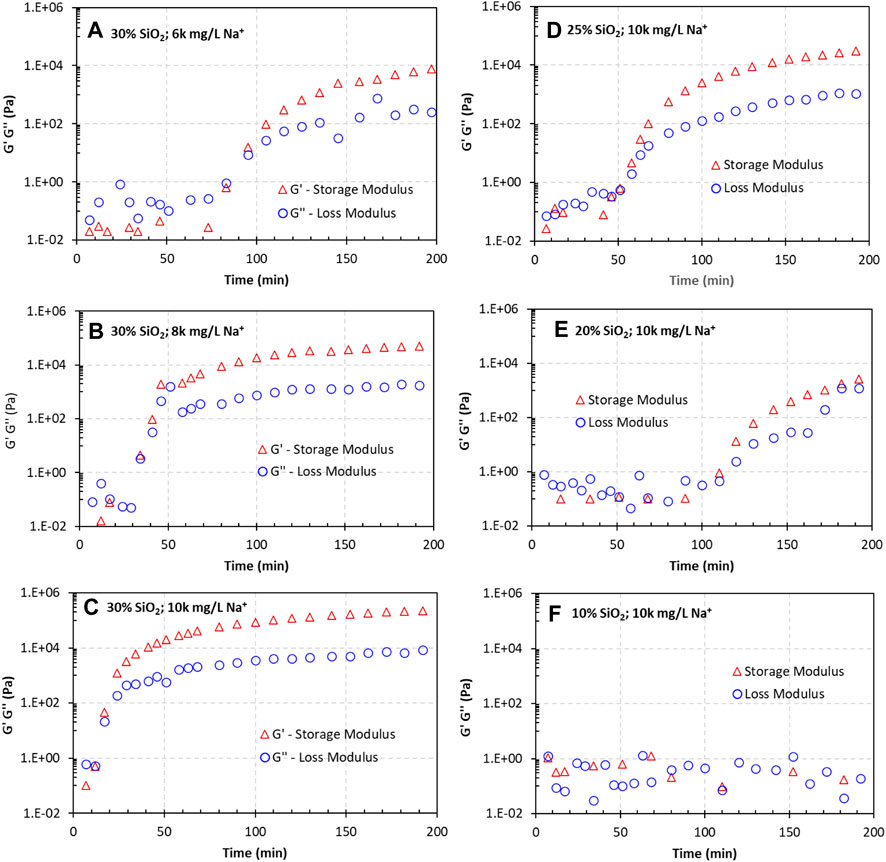
Figure 7. Influence of the Na+ concentration and silica concentration on the gelation of Geo-40 nanosized silica suspensions, as indicated by the storage and loss moduli. (A–C) are results for a CS concentration of 30%; (C–F) are for a 10,000 mg/L Na+ concentration. All measurements were acquired at a 1 rad/s oscillatory frequency.
For suspensions with 30% CS (Figures 7A–C), G″ was greater than G′ in the beginning stage, indicating that the suspensions were viscoelastic liquids. In this stage, the fluid behaved more liquid-like. As time increased, both G″ and G′ increased and eventually reached a point at which G′ was greater than G″, indicating that the material was more solid-like. When the Na+ concentration was higher, the rate of increase in G′ was faster, and the time needed for the G′ curve to cross the G″ curve was shorter.
When the CS concentration was reduced from 30% to 10% (Figures 7C–F), the rate of increase in G′ gradually reduced when the Na+ concentration remained constant at 10,000 mg/L. For the suspension with 10% CS and 10,000 mg/L Na+, G′ and G″ did not increase within the tested time (Figure 7F).
The changes in G′ and G″ over time indicate a phase transformation inside a viscoelastic material. When G’ = G″, the viscoelastic material is at a phase transition point, often called the sol–gel transition point. This is the gel point of the material. The observed gel point times were 80, 34, and 14 min for the suspensions with 30 wt% Geo-40 and 6,000, 8,000, and 10,000 mg/L Na+, respectively. In addition, the gel point times were >200, 105, 50, and 14 min for suspensions with 10,000 mg/L Na+ at 10%, 20%, 25%, and 30% silica concentrations, respectively. It is clearly demonstrated that the increases in both the Na+ concentration and silica concentration shortened the gelation time.
3.5 Influence of the Na+ concentration and silica concentration on the complex viscosity
The complex viscosities of the 20, 25, and 30 wt% suspensions quickly increased after gelation started, while the 10 wt% suspension did not show gelation (Figure 8A). The viscosity increased with the increase in the SiO2 concentration. A higher silica concentration led to a stronger gel. The viscosity of the gel continuously increased with time, up to 300 min when the tests were terminated, revealing that the silica network in the gel was becoming stronger over time.
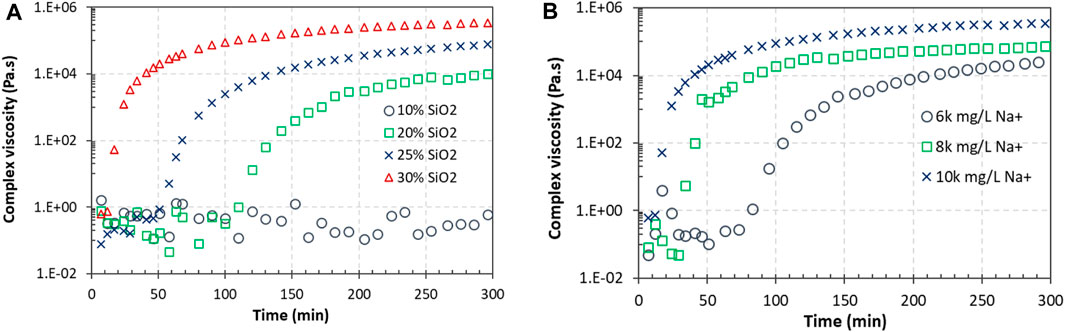
Figure 8. Complex viscosities of Geo-40 suspensions and gels over time. (A) Influence of the CS concentration; all suspensions have a Na+ concentration of 10,000 mg/L. (B) Influence of the Na+ concentration; all suspensions have a 30% CS concentration.
The Na+ concentration not only influenced the gelation time but also changed the final strength of the gel, as indicated by the complex viscosity at test completion (300 min) (Figure 8B). The gel strength was also still increasing at 300 min. The rate of increase in the viscosity was higher at the beginning of gelation when the silica concentration was higher and when the Na+ concentration was higher. After the initial gelation stage, the rate of increase in the viscosity was lower when the silica concentration was higher and when the Na+ concentration was higher, as indicated by the slopes of the curves.
Amiri et al. (2009, 2011) reported that increases in the salinity and silica particle concentration in the suspension resulted in a silica network with greater strength, producing a stronger gel. The changes in the salinity and silica concentration can be used to achieve a desirable gel strength for specific applications.
3.6 Dynamic gelation process of silica suspensions
The changes in the storage and loss moduli (G′, G″) of the silica suspensions over time revealed dynamic gelation processes. The results clearly showed that the gelation process started earlier with a higher Na+ concentration (Figures S–1). When the silica suspension and Na+ mixtures were freshly prepared, all mixtures behaved more like liquids, as indicated by the larger G″ compared to G’ (Figures S–1A). After aging for 65 and 100 min (Figures S–1B,C), the mixture with 6,000 mg/L Na+ still behaved more like a liquid, while suspensions with 8,000 and 10,000 mg/L Na+ behaved more like solids with G’ > G”. At 165 min (Figures S–1D), all mixtures showed a higher G′ compared to G”, behaving more like a solid. With further aging to 240 min (Figures S–1E), G′ for the suspensions with 6,000 and 8,000 mg/L Na+ further increased, while G′ for the 10,000 mg/L Na+ suspension did not show a further increase. This observation is consistent with the change in the rate of increase in G’ in Figure 6.
The complex viscosities of the silica suspensions and Na+ mixtures clearly increased with time, especially at low frequencies, indicating a gelling process (Figures S–2). At aging times of 65 and 100 min, the complex viscosity was higher for the gel with a higher Na+ concentration (Figures S–2B,C); thus, the gel is more rigid. However, at an aging time of 165 min, there were small differences in the complex viscosities for all three gels (Figures S–2D), indicating that they had similar stiffnesses.
3.7 Gelation in the sand pack
When the silica suspension was injected into the pore spaces in packed sand, it also gelled and grouted the sand pack, as indicated by the sand pack remaining at the bottom end of the vial when the vial was turned upside down (Figure 9). When a silica suspension was injected into a dry sand pack, the whole sand pack was grouted (Figure 9, Vial A). When the silica suspension was injected into the bottom section of an SGW-saturated sand pack, only the bottom section was grouted, where the silica suspension had displaced the SGW and the upper-section sand pack was still loose and separated from the grouted sand pack (Figure 9, Vial B).
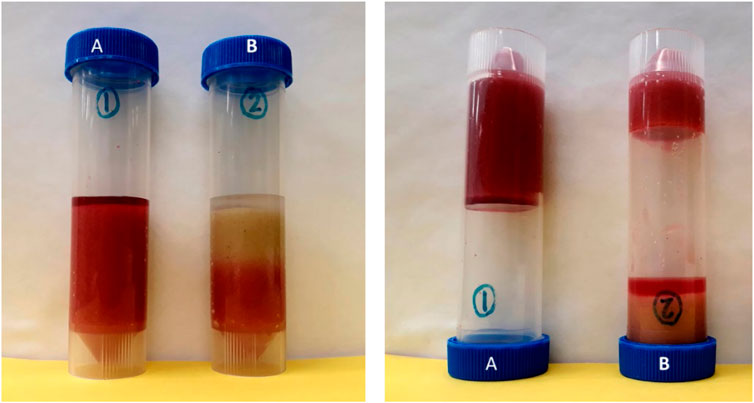
Figure 9. Gelation of silica suspensions to grout sand packs. Left photograph: Before the gelation of silica suspensions. Right photograph: Vials were flipped upside down after the gelation of silica suspensions. The silica gel grouted the sand pack and held it to the bottom of the vial when the vial was flipped upside down. Vial (A) Silica suspension in dry sediment; Vial (B) Silica suspension injected into the bottom of sediment saturated with SGW.
With the same amount of CS suspension injected into a set of sand packs saturated with SGW and different gelling times applied to each sand pack, the influence of the gelling time on the grouted sand pack volume was revealed (Figure 10). With a longer time allowed for gelation, a larger volume of the sand pack was grouted. In these gelation tests, a silica suspension was injected into the bottom of the sand pack to displace SGW. At the interface between the silica suspension and the SGW, the silica concentration and Na+ concentration decreased. These decreases would increase the time needed for the gelation of the silica suspension at the interface. Therefore, a longer gelation time resulted in a larger grouted sand pack volume (Figure 10). Qualitatively, by touching the grouted sand packs, it is obvious that these sand packs became more rigid over time.
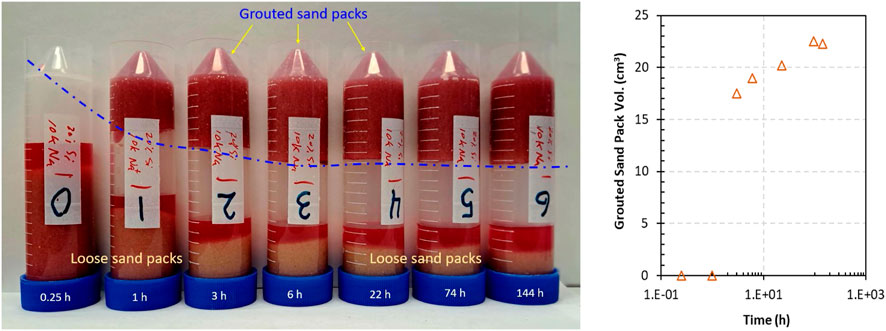
Figure 10. Gelation of silica suspensions in sand packs saturated with SGW. Left: Photographs of vials with grouted and/or loose sediments for a range of gelation times. Silica gel grouted a sand pack and held it to the bottom of the vial when the vial was turned upside down. The dot–dash blue line traces the height of the grouted sand pack, indicating an increase in the volume over time. Right: Plot of the grouted sand pack volume versus the gelation time.
When a silica suspension is injected into a sand pack for gelation, the gelation time and gel strength may be affected by the sand since the sand grains have similar functional group as the silica particles in the suspension. The gelation times of a silica suspensions in systems with and without sand were compared and no significant differences were observed, revealing that the presence of sand did not significantly affect the gelation time. The strength of the silica gel form in conditions with and without sand was not compared as it was not in the scope of this study.
3.8 Water flow blocking by silica gel in a column
The pressure drops over the sand-packed and SGW-saturated column during water injection and flow through the column are presented in Figure 11. Before the injection of a silica suspension, the pressure drop during water injection at a flow rate of 1.5 mL/min was stabilized at 0.1 psig (0.69 kPa) (Figure 11). After injection of the CS suspension and gelation in the column, the water injection pressure increased quickly once water was injected into the column inflow end at a rate of 1.5 mL/min. No effluent flow was measured. It was certain that the silica gel completely blocked the water flow through the column.
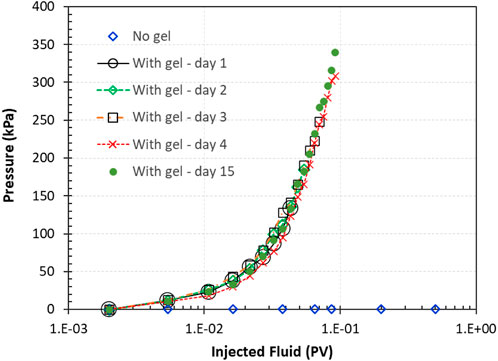
Figure 11. Pressure across the column during water injection through the column before and after the gelation of the silica suspension in pore spaces. Injections were performed at day 1, 2, 3, 4, and 15 after gelation.
Water pumping was stopped when the pressure reached 20, 25, 35, 45, and 50 psig (137.88, 172.55, 241.29, 310.23, 344.7 kPa) for the injections performed at times of 1, 2, 3, 4, and 15 days after gelation, respectively (Figure 11). The final injection pressure was held constant for at least 15 min for each of these injections, and no column effluent was observed.
After day 15, 45 psig (310.23 kPa) injection pressure was maintained at the column inflow end for 120 days. At this pressure, no water breakthrough was observed at the column effluent, revealing that the gel in the sand pack could sustain the tested pressure within the testing duration.
During all the injecitons for these pressure tests, no effluent was observed, indicating that the silica gel was able to sustain a injection pressure up to 45 psig (310.23 kPa) and the gel is not permeable to water, resulted in a complete water flow blocking.
3.9 Chemical transport and water flow blocking by silica gel in a sandbox annulus
Prior to the gelation of the pore space with silica gel, the chemical tracer KBr injected into the sandbox annulus above the “Gel zone” (Figure 2) was transported through the zone to the annulus section below the gel zone, as indicated by the increasing Br− concentration over time (Figure 12A). However, transport of the tracer through this zone was completely blocked when silica gel formed and filled up the pore spaces of the gel zone in the annulus, as no Br− was detected below the treated zone (Figure 12B).
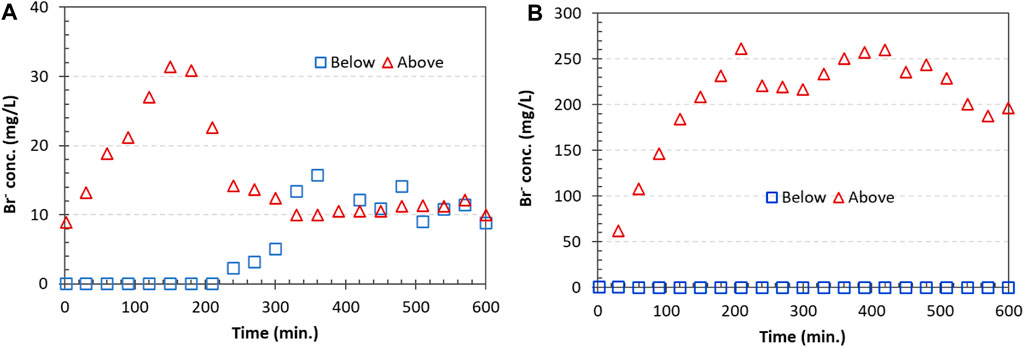
Figure 12. Tracer concentrations at locations above and below the “Gel zone.” (A) No silica suspension was injected; tracer transported from above the gel zone, through the gel zone, and to the section below the zone. (B) A silica suspension was injected, and a gel formed. Transport of the tracer from the above zone to the below zone was not detected.
The pressure drop through the sandbox annulus during water injection at 5.0 mL/min was 0.1 psig (0.69 kPa) prior to the silica gel treatment. With an 11 cm thick section of silica gel formed in the annulus, the injection pressure increased to 7.7 psig (53.08 kPa) at the same flow rate. When water pumping stopped, the pressure decreased slowly, indicating that water was slowly leaking through the gel zone. Based on the results from a separate column pressure test (30 cm thick silica gel), which showed no water flow (or pressure leaking) at 50 psig (344.70 kPa), the observed pressure leakage through the sandbox annulus likely indicates that there was incomplete annular sealing between the outside of the well due to the roughness and irregularities in the screen material used in the test setup.
3.10 Electrical conductivity of the silica suspension and gel
The electrical conductivity measured for sand saturated with SGW was 2.12 mS/m. In comparison, the value for a sand pack saturated with DIW was 0.73 mS/m (Figure 13). The conductivity for the sand pack with the silica suspension containing 10,000 mg/L Na+ was 369.50 mS/m, more than two orders of magnitude higher than that of the sand pack with SGW. After gelation and with the aging of the gel, the electrical conductivity showed minimal changes (Figure 13). The significant difference in conductivity between the sand pack with SGW and the silica suspension and gel suggests that there is a sufficient electrical response to image the distribution of the injected silica suspension with the ERT geophysical approach, which could be evaluated in future testing.
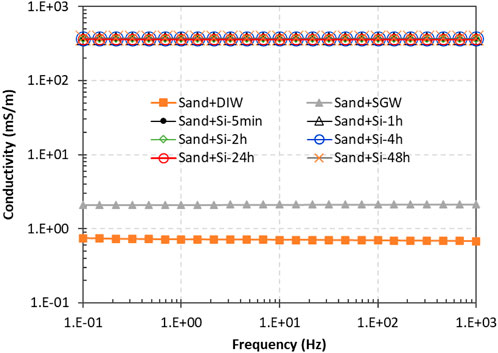
Figure 13. Electrical conductivity of sand columns with DIW, SGW, a silica suspension, and a silica gel with aging. The injected silica suspension contained 20 wt% silica particles and 10,000 mg/L Na+.
4 Conclusion
CS suspension injection and gelation can be used for many subsurface applications. This technology shows promise for blocking the vertical water flow in the annulus of long-screened well systems. In this work, we studied the rheological and gelation behaviors of silica suspensions to provide an initial bench-scale evaluation of silica suspension formulations.
Shear thinning was observed for the fumed powder silica suspensions, while the nanosized silica suspensions produced from geothermal fluids exhibited Newtonian flow behavior. The nanosized silica suspensions have a lower viscosity compared to that of FS suspensions when the silica particle concentrations are similar, thus favoring injection into porous media. In the gelation process, however, the nanosized silica suspensions changed from Newtonian fluids to shear thinning fluids when the viscosity increased to a certain level. When the Na+ concentration increased in a CS suspension, the gelation time shortened.
When silica gel is formed in packed sand column, water flow was completely blocked for injection pressures up to 50 psig (344.70 kPa). In the preliminary laboratory bench-scale sandbox tests, a silica suspension was successfully injected into the target zone in the annulus of a long-screened well, and a silica gel formed in the zone, effectively blocking chemical transport through the gelled zone and restricting vertical water flow through the zone.
This work has shown that the silica suspension injection and gelation technology is promising to successfully block vertical water flow and chemical transport through the target zones in the annuli of long-screened well systems. Follow-on bench-scale tests are planned to further evaluate this technology under site-specific hydraulic and geochemical conditions for the Hanford Site, and results will determine the basis and design for subsequent field evaluations.
Data availability statement
The raw data supporting the conclusion of this article will be made available by the authors, without undue reservation.
Author contributions
LZ: Conceptualization, Methodology, Resources, Writing–original draft. LL: Methodology, Writing–review and editing. JT: Methodology, Writing–review and editing. FD-L: Methodology, Resources, Writing–review and editing. SS: Methodology, Writing–review and editing. RM: Conceptualization, Funding acquisition, Methodology, Resources, Writing–review and editing.
Funding
The author(s) declare that financial support was received for the research, authorship, and/or publication of this article. This work was funded by the Deep Vadose Zone–Applied Field Research Initiative at Pacific Northwest National Laboratory (PNNL) project and by the PNNL QuickStarter. PNNL is operated by Battelle for the U.S. Department of Energy under contract DE-AC06-76RLO 1830. The work described was performed in accordance with the PNNL Nuclear Quality Assurance Program (NQAP). The NQAP complies with U.S. Department of Energy Order 414.1D, Quality Assurance. The NQAP uses NQA 1 2012, Quality Assurance Requirements for Nuclear Facility Applications as its consensus standard and NQA 1 2012 Subpart 4.2.1 as the basis for its graded approach to quality.
Conflict of interest
The authors declare that the research was conducted in the absence of any commercial or financial relationships that could be construed as a potential conflict of interest.
Publisher’s note
All claims expressed in this article are solely those of the authors and do not necessarily represent those of their affiliated organizations, or those of the publisher, the editors and the reviewers. Any product that may be evaluated in this article, or claim that may be made by its manufacturer, is not guaranteed or endorsed by the publisher.
Supplementary material
The Supplementary Material for this article can be found online at: https://www.frontiersin.org/articles/10.3389/fenvs.2024.1381577/full#supplementary-material
References
Amiri, A., Øye, G., and Sjöblom, J. (2009). Influence of pH, high salinity and particle concentration on stability and rheological properties of aqueous suspensions of fumed silica. Colloids Surf. A Physicochem. Eng. Asp. 349 (1–3), 43–54. doi:10.1016/j.colsurfa.2009.07.050
Amiri, A., Øye, G., and Sjöblom, J. (2011). Temperature and pressure effects on stability and gelation properties of silica suspensions. Colloids Surf. Physicochem. Eng. Asp. 378 (1–3), 14–21. doi:10.1016/j.colsurfa.2011.01.048
Binks, B. P., and Lumsdon, S. O. (1999). Stability of oil-in-water emulsions stabilised by silica particles. Phys. Chem. Chem. Phys. 1, 3007–3016. doi:10.1039/a902209k
Brinker, C. J. (1994). “Sol—gel processing of silica,” in The colloid chemistry of silica (Washington, DC: ACS), 361–401. doi:10.1021/ba-1994-0234.ch018
Chen, S., Øye, G., and Sjöblom, J. (2005). Rheological properties of aqueous silica particle suspensions. J. Dispers. Sci. Technol. 26 (4), 495–501. doi:10.1081/DIS-200054608
Day-Lewis, F. D., Mackley, R. D., and Thompson, J. (2023). Interpreting concentrations sampled in long-screened wells with borehole flow: an inverse modeling approach. Groundwater 61, 834–845. doi:10.1111/gwat.13300
Durmusoglu, E., and Corapcioglu, M. Y. (2000). Experimental study of horizontal barrier formation by colloidal silica. J. Environ. Eng. 126 (9), 833–841. doi:10.1061/(ASCE)0733-9372(2000)126:9(833)
Emerson, H. P., Di Pietro, S., Katsenovich, Y., and Szecsody, J. (2017). Effects of ammonium on uranium partitioning and kaolinite mineral dissolution. J. Environ. Radioact. 167, 150–159. doi:10.1016/j.jenvrad.2016.11.029
Ezzedine, S., Hunt, J., Bourcier, W., Robert, S., and Roberts, J. (2012). “Impact of silica gel development on subsurface flow and heat extraction from enhanced geothermal systems,” in Proceedings of the thirty-seventh workshop on geothermal reservoir engineering (Stanford, CA: Stanford University). January 30–February 1, 2012.
Fleury, M., Sissmann, O., Brosse, E., and Chardin, M. (2017). A silicate-based process for plugging the near well bore formation. Energy Procedia 114, 4172–4187. doi:10.1016/j.egypro.2017.03.1558
Funehag, J., and Fransson, Å. (2006). Sealing narrow fractures with a Newtonian fluid model prediction for grouting verified by field study. Tunn. Undergr. Space Technol. 21, 492–498. doi:10.1016/j.tust.2005.08.010
Funehag, J., and Gustafson, G. (2008). Design of grouting with silica sol in hard rock—new design criteria tested in the field, Part II. Tunn. Undergr. Space Technol. 23, 9–17. doi:10.1016/j.tust.2006.12.004
Ghaffari, Z., Rezvani, H., Khalilnezhad, A., Farid, B., and Rizai, M., 2022. Experimental characterization of colloidal silica gel for water conformance control in oil reservoirs. Sci. Rep. 12, 9628. doi:10.1038/s41598-022-13035-1
Huang, Y., Li, Y., Knappett, P. S. K., Montiel, D., Wang, J., Aviles, M., et al. (2022). Water quality assessment bias associated with long-screened wells screened across aquifers with high nitrate and arsenic concentrations. Int. J. Environ. Res. Public Health 19 (16), 9907. doi:10.3390/ijerph19169907
Hunt, J., Ezzedine, S., Bourcier, W., and Roberts, S. (2013) Applications of geothermally-produced colloidal silica in reservoir management – smart gels. New York: Lawrence Livermore National Laboratory. Report LLNL-TR-639692.
Iler, R. K. (1979) The chemistry of silica: solubility, polymerization, colloid and surface properties, and biochemistry. Hoboken, NJ: John Wiley & Sons.
Jurinak, J., and Summers, L. (1991). Oilfield applications of colloidal silica gel. SPE Prod. Eng. 6 (04), 406–412. doi:10.2118/18505-PA
Katoueizadeh, E., Rasouli, M., and Zebarjad, S. M. (2020). A comprehensive study on the gelation process of silica gels from sodium silicate. J. Mat. Res. Technol. 9 (5), 10157–10165. doi:10.1016/j.jmrt.2020.07.020
Kawaguchi, M., Kimura, Y., Tanahashi, T., Takeoka, J., Suzuki, J., Kato, T., et al. (1995). Polymer adsorption effects on structures and rheological properties of silica suspensions. Langmuir 11 (2), 563–567. doi:10.1021/la00002a034
Kim, M., and Corapcioglu, Y. (2002). Gel barrier formation in unsaturated porous media. J. Contam. Hydrol. 56, 75–98. doi:10.1016/S0169-7722(01)00204-2
Metin, C., Bonnecaze, R., and Nguyen, Q. (2011). Shear rheology of silica nanoparticle dispersions. Appl. Rheol. 21 (1), 13146. doi:10.3933/applrheol-21-13146
Ngo, I., Ma, L. Q., Zhai, J. T., and Wang, Y. Y. (2021). “Feasibility of CO2 as a curing agent for silicate-based grouting gel in fractures after coal mining,” in 2nd Geoscience & Engineering in Energy Transition Conference, USA, November 23-25, 2021 (IEEE).
Pagano, A. G., Mountassir, G. E., and Lunn, R. J. (2022). Performance of colloidal silica grout at elevated temperatures and pressures for cement fracture sealing at depth. J. Pet. Sci. Eng. 208 (Part E), 109782. doi:10.1016/j.petrol.2021.109782
Poulsen, D. L., Cook, P. G., Simmons, C. T., Solomon, D. K., and Dogramaci, S. (2019). Depth-resolved groundwater chemistry by longitudinal sampling of ambient and pumped flows within long-screened and open borehole wells. Water Resour. Res. 55, 9417–9435. doi:10.1029/2019WR025713
Robert, W. O. (2006). “Manufacturing and applications of water-borne colloidal silica,” in Colloidal silica. Editors H. E. Bergna, and W. O. Roberts (China: Taylor & Francis), 131–176. Ch. 12.
Simonsson, I., Sögaard, C., Rambaran, M., and Abbas, Z. (2018). The Specific co-ion effect on gelling and surface charging of silica nanoparticles: speculation or reality? Colloids surfaces A 559, 334–341. doi:10.1016/j.colsurfa.2018.09.057
Sögaard, C., Funehag, J., and Abbas, Z. (2018a). Silica sol as grouting material: a physio-chemical analysis. Nano Converg. 5, 6. doi:10.1186/s40580-018-0138-1
Sögaard, C., Funehag, J., Gergonic, M., and Abbas, Z. (2018). Long term stability of silica gels in waters of different ionic composition and pH values. 2018b. Colloids surfaces A 544, 127–136. doi:10.1016/j.colsurfa.2018.02.020
Sögaard, C., Kolman, K., Abbas, Z., and Otyakmaz, A. B. (2021). Hofmeister effects in the gelling of silica nanoparticles in mixed salt solutions. Colloids surfaces A 611, 125872–125881. doi:10.1016/j.colsurfa.2020.125872
Sun, X., Zhao, J., Chen, T., and Liu, X. (2016). Colloidal particle size of fumed silica dispersed in solution and the particle size effect on silica gelation and some electrochemical behaviour in gelled electrolyte. J. Solid State Electrochem. 20, 657–664. doi:10.1007/s10008-015-3090-6
Truex, M. J., Pierce, E. M., Nimmons, M. J., and Mattigod, S. V. (2011). Evaluation of in situ grouting as a potential remediation method for the Hanford Central Plateau deep vadose zone. Pac. Northwest Natl. Lab. Rep. PNNL-20051. doi:10.2172/1004503
Vermeul, V. R., McKinley, J. P., Newcomer, D. R., Mackley, R. D., and Zachara, J. M. (2011). River-induced flow dynamics in long-screen wells and impact on aqueous samples. Groundwater 49, 515–524. doi:10.1111/j.1745-6584.2010.00769.x
Yang, S., Oostrom, M., and Li, G. (2017). Rheological properties of aqueous colloidal silica suspensions related to amendment delivery for subsurface remediation. Environ. Eng. Sci. 35, 121–131. doi:10.1089/ees.2017.0040
Yang, S., Oostrom, M., Truex, M. J., Li, G., and Zhong, L. (2016). Injectable silica–permanganate gel as a slow-release MnO4− source for groundwater remediation: rheological properties and release dynamics. Environ. Sci. Process. Impacts. 18 (2), 256–264. doi:10.1039/c5em00559k
Yossapol, N. (2002) Remediation of chromium contaminated soils with colloidal silica. New Jersey Institute of Technology: PhD dissertation.
Yotsumoto, H., and Yoon, R. H., 1993. Application of extended DLVO theory. J. Colloid Inter Sci., 157 (2434–441. doi:10.1006/jcis.1993.1206
Zhong, L., Lee, B., and Yang, S. (2018). Establishing vadose zone slow-release carbon sources for enhanced bioremediation using silica suspension. Vadose Zone J. 17 (1), 1–10. doi:10.2136/vzj2017.09.0175
Keywords: colloidal silica suspensions, silica gel, gellation, long screen well, well annulus, groundwater sampling, water flow blocking
Citation: Zhong L, Mackley R, Li L, Thomle J, Day-Lewis F and Saslow S (2024) Applying colloidal silica suspensions injection and sequential gelation to block vertical water flow in well annulus: laboratory testing on rheology, gelation, and injection. Front. Environ. Sci. 12:1381577. doi: 10.3389/fenvs.2024.1381577
Received: 04 February 2024; Accepted: 08 May 2024;
Published: 23 May 2024.
Edited by:
Dongmin Sun, University of Houston–Clear Lake, United StatesReviewed by:
Shuo Yang, Beijing Municipal Research Institute of Environmental Protection, ChinaSuhaib Umer Ilyas, Jeddah University, Saudi Arabia
Copyright © 2024 Zhong, Mackley, Li, Thomle, Day-Lewis and Saslow. This is an open-access article distributed under the terms of the Creative Commons Attribution License (CC BY). The use, distribution or reproduction in other forums is permitted, provided the original author(s) and the copyright owner(s) are credited and that the original publication in this journal is cited, in accordance with accepted academic practice. No use, distribution or reproduction is permitted which does not comply with these terms.
*Correspondence: Lirong Zhong, lirong.zhong@pnnl.gov