Research on the impact of digital economy on green total factor productivity: theoretical mechanism and multidimensional empirical analysis
 Wanwan Liu
 N. A. M. Naseem1*
 - 1School of Business and Economics, Universiti Putra Malaysia, Selangor, Malaysia
- 2School of Management, Zhengzhou University of Technology, Zhengzhou, China
The digital economy (DE) is emerging as a crucial driver of economic growth and an effective tool for alleviating resource and environmental pressures, thereby evolving into a significant force in facilitating green transformation. This study elaborates on the theoretical mechanism of the impact of DE on green total factor productivity (GTFP), and conducts multidimensional empirical tests using panel data from 284 cities in China. The main findings are as follows: (1) DE exerts significant positive direct, indirect, and spatial spillover effects on GTFP, signifying its growing role as a robust driver of GTFP. Notably, technological innovation emerges as a key mediator of DE’s impact on GTFP. (2) The impact of DE on GTFP exhibits a distinct pattern: initially pronounced, gradually diminishing, and then rebounding as DE progresses. (3) DE tends to exacerbate, rather than alleviate, the development divide and resource curse, especially in underdeveloped and resource-rich cities where its benefits are constrained. (4) Government behavior is pivotal in influencing DE’s impact on GTFP. Supportive policies and strict environmental regulations are critical in harnessing DE’s positive contributions to GTFP. This study lays a scientific foundation for leveraging the “green attributes” of DE and offers insights into bridging the developmental disparities among cities.
1 Introduction
Urbanization and industrialization are key driving forces behind the rapid global economic growth, but they are also major sources of energy waste and environmental pollution, making this economic growth model unsustainable (Wu et al., 2020; Huang et al., 2023; Li et al., 2023). However, China’s urbanization and industrialization are still accelerating, and its resource and environmental carrying capacity have reached close to their limits (Xu and Tan, 2020). To address environmental pollution issues, China has adopted various measures and shown initial effectiveness (Zhang et al., 2021). World Bank data revealed a noteworthy reduction in China’s primary energy intensity from 8.75 to 6.31 between 2011 and 2019, indicating a substantial enhancement in energy efficiency. Nevertheless, it is crucial to note that China’s current environmental performance index in 2022 is still relatively low, standing at 28.4 and ranking 160th globally. Furthermore, China’s primary energy intensity was still 89.5% higher than that of Japan and 39.9% higher than that of the United States, which have posed challenges to China’s green and sustainable development (Tang and Qin, 2022). Achieving harmony be-tween ecological environmental concerns and economic development remains an enduring challenge for China (Zheng et al., 2022; Wang et al., 2024).
Meanwhile, given the rapid advancement of information technology and its penetration and integration into economic operations, the world has transitioned into the digital economy (DE) era. DE, transforms modes of production, reorganizes worldwide factors and resources, reshapes the global economic structure, and changes the pattern of global competition, providing crucial support for global economic green growth (Dexeus, 2018; Liu et al., 2024). Especially, in the post-COVID-19 era, DE has emerged as a crucial driver to mitigate the pandemic’s impact and facilitate economic recovery (Irfan et al., 2022). According to the report released by the China Academy of Information and Communication Technology (CAICT), the global value addition of DE in 51 countries reached US$ 41.4 trillion in 2022, contributing 46.1% to GDP. As one of the fastest-growing countries, China has consistently ranked second in terms of DE scale, with US$ 7.5 trillion, contributing 41.0% to China’s GDP in 2022.
To further address the environmental challenges arising from economic development, China released the “Guiding Opinions on Accelerating the Establishment of a Sound Green, Low-Carbon, and Circular Development Economic System” in February 2021. This guideline mandates that the economic development must be grounded in the efficient use of resources, the strict protection of the ecological environment, and the effective control of greenhouse gas emissions. Different from the traditional economy, DE, with data as the emerging critical factor of production and digital technology as its mainstay, reduces energy consumption, enhances energy efficiency, and promotes the growth of new industries, enabling a shift in economic growth from energy-intensive and polluting sectors to cleaner alternatives. This transition effectively mitigates the negative environmental impacts of economic growth. Green total factor productivity (GTFP), integrating environmental factors and assesses the input-output efficiency of energy consumption and pollutant emissions, is commonly used to evaluate the alignment of economic growth with environmental concerns.
The role of DE in GTFP has concerned scholars while remaining inconclusive. Theoretically, DE possesses intrinsic characteristics such as a low marginal cost of data (Murthy et al., 2021), reduced resource consumption, and decreased environmental pollution, potentially enhancing GTFP. However, empirical research has yielded contradictory conclusions. Existing studies suggest that DE can contribute to GTFP by promoting economic growth, technological innovation (TI), energy efficiency, and optimizing resource allocation (Winskel and Kattirtzi, 2020; Song et al., 2021; Wu and Yu, 2022; Lyu et al., 2024; Wang and Cheng, 2024). Nevertheless, the production and operation of digital products require a significant amount of electricity, and large-scale data centers are also major sources of energy consumption in the digital world (Danish et al., 2018; Coyne and Denny, 2021). Some scholars argue that there exists a non-linear relationship between DE and GTFP. The impact of DE on GTFP is characterized by a “U” shaped curve, initially declining and then rising (Lyu et al., 2023). DE can significantly promote GTFP (Meng and Zhao, 2022; Hao et al., 2023), or the impact of DE on GTFP shifts from strong to weak (Ma and Zhu, 2022) when certain thresholds are met. Additionally, these research mainly concentrates on the provincial-level, which may not fully account for disparities among cities. To maximize the green value of DE in the development and close the gap among regions, further in-depth investigations are needed to better understand the link between DE and GTFP.
The additional contribution of this study can be summarized as the following. First, it develops a comprehensive theoretical framework to explore the impact mechanism of DE on GTFP in a multidimensional way, and empirically analyses the direct impact, transmission mechanism, threshold effect and spatial effect of DE on GTFP at the city level. Second, based on natural endowments and policy differences, it further investigates the impact heterogeneity of DE on GTFP, aiming to explore the “resource curse” and “digital divide”, to further explore the potential green value of DE. Finally, it employs local government digital attention as the instrumental variable of DE to address potential endogeneity issues that may arise in DE and GTFP, making the empirical results more accurate.
The subsequent sections of this study are structured as outlined (shown in Figure 1). “Related literature review” offers a brief review of the relevant literature concerning DE and GTFP. “Mechanism analysis” presents a detailed analysis of the underlying mechanisms. “Methodology and data” describes the methodology and data used in the study. “Empirical results” presents and comprehensively discusses all empirical findings. Finally, in “Conclusions and policy implications”, conclusions and suggestions are drawn.
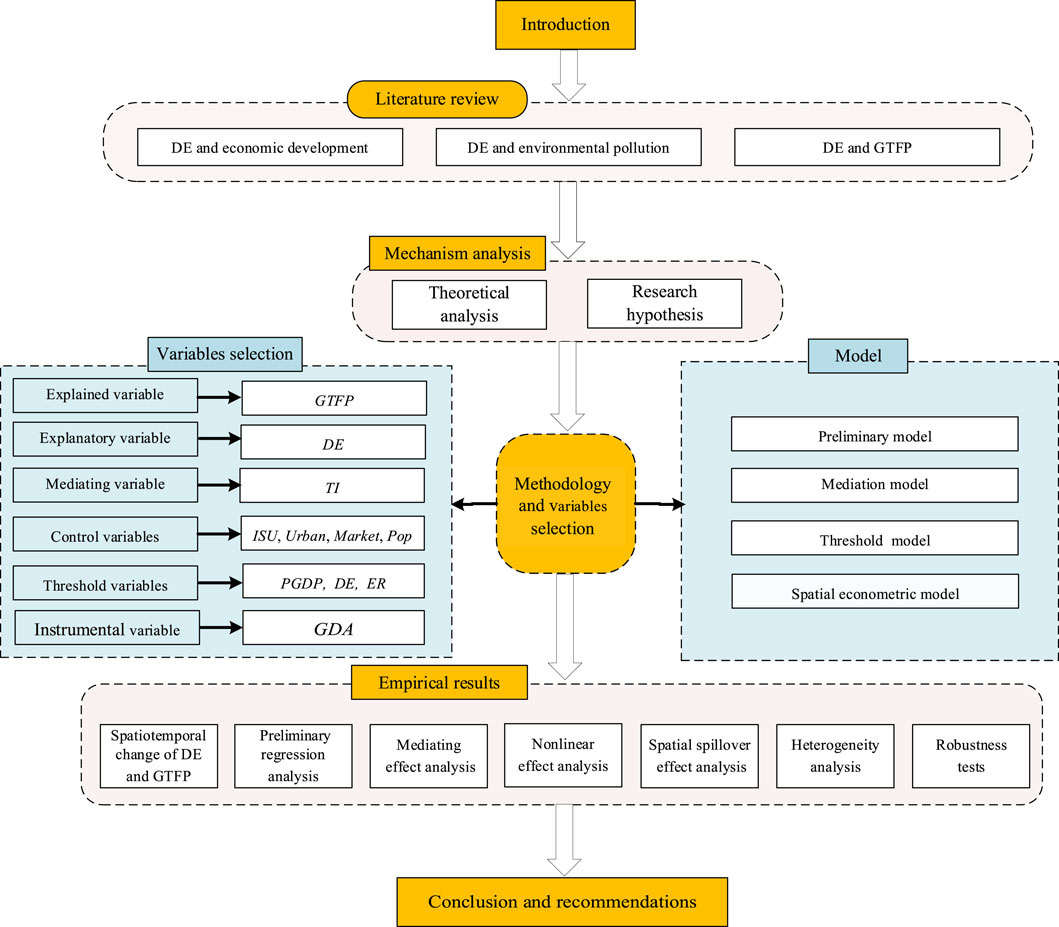
Figure 1. Research framework. Notes: GTFP: Green total factor productivity; DE: Digital economy; TI: Technological innovation; ISU: Industrial structure upgrading; Urban: Urbanization; Market: Market size; Pop: Population density; PGDP: GDP per capita; ER: Environmental regulation; GDA: Government digital attention.
2 Related literature review
2.1 DE and economic development
With the rapid advancement and widespread use of next-generation digital technologies, DE is gaining profound recognition as a pivotal catalyst for economic development (Sergushina et al., 2021; Chen et al., 2023). Nevertheless, existing research has not yet reached a unified consensus regarding the precise impact of DE on the national economy.
On one hand, many studies have substantiated the favorable influence of DE on economic growth. Scholars have demonstrated that DE holds the potential to enhance the efficiency of capital, labor, and various other factors (Lincaru et al., 2018), facilitate industrial structure upgrading (Zhang et al., 2022c; Tan et al., 2024), reduce economic operation costs (Goldfarb et al., 2019), and foster TI (Ding et al., 2022), thereby promoting economic development. Niebel (2018) argue that irrespective of a country’s level of development, DE is a key contributor in driving economic prosperity. This conclusion has been validated in different countries, including the United States (Jorgenson et al., 2011), China (Wu et al., 2022), India (Erumban et al., 2016), Australia (Shahiduzzaman et al., 2014), Singapore (Vu, 2013), Sweden (Edquist et al., 2017), and Kazakhstan (Gaziz et al., 2020).
Digital technology can foster economic growth, but its impact may vary depending on the developmental stage of a country (Mgadmi et al., 2021). However, compared to developed countries, digital technology exerts a more significant influence on the economic growth of underdeveloped countries, which is beneficial for them to achieve leapfrog development and narrow the digital divide with developed countries (Thompson, 2011; Appiah-Otoo and Song, 2021). Another set of scholars takes the opposite view. Due to the limited absorption capacity, insufficient human capital, and lack of competitive environment of underdeveloped countries, the promoting impact of digital technology on economic growth may take longer to manifest (Samimi et al., 2015).
On the other hand, some literature indicates a non-promoting effect of DE on economic growth. Aghion and Howitt (1998) argued that the rapid advancement of DE may hinder economic growth by affecting the structure of the labor market. Additionally, Yousefi (2011), Ma et al. (2022b), Ishida (2015), and Lazović et al. (2022) found no causal relationship between DE and economic performance. They suggested that infrastructure investment may exacerbate rather than alleviate inequality, and investment in DE might not necessarily contribute to the development of less developed countries.
2.2 DE and environmental pollution
Comprehensive research has studied the connection between DE and environmental pollution, revealing varying and even contradictory findings.
DE can reduce environmental pollution through optimal resource allocation, improved energy efficiency, and the adoption of cleaner production methods (Li G. et al., 2022; Ma et al., 2022a). Additionally, it has the potential to decrease environmental pollution in nearby regions by breaking down spatial and information barriers (Xu et al., 2022; Yi et al., 2022). The impact of DE on environmental pollution exhibits regional heterogeneity, with a less inhibitory effect observed in non-resource-based cities, western cities, and small cities (Bai et al., 2022; Che and Wang, 2022; Huang et al., 2023). However, the exponential growth of DE has resulted in a substantial rise in energy usage associated with digital infrastructure and the overall ICT industry. Additionally, the rapid advancement of urban digitalization has driven urban industries transformation, subsequently leading to the relocation of low-end industries to neighboring regions and exacerbating environmental pollution in the surrounding areas (Dong et al., 2022; Wang et al., 2022).
Furthermore, a non-linear relationship between DE and environmental pollution may exist. Li and Wang (2022) have suggested an inverted U-shaped association between DE and both local and surrounding carbon emissions, characterized by initial promotion followed by inhibition. Moreover, various researchers have identified a threshold effect in the impact of DE on environmental pollution. For instance, Zhang et al. (2022a) have observed a notable dual-threshold effect and an N-shaped trend in the relationship between DE and carbon emissions under the consideration of energy efficiency. Conversely, Yu et al. (2022) contend that DE leads to increased carbon emissions only at low levels of green energy efficiency. Additionally, Hao et al. (2022) have uncovered an inverted N-shaped connection between DE and environmental pollution. Furthermore, Li et al. (2021) have proposed that DE can substantially reduce PM2.5 levels only when the rate of urbanization and the density of population exceed certain thresholds, while it can significantly increase PM2.5 levels only when GDP per capita surpasses a certain threshold.
2.3 DE and GTFP
Studies investigating the relationship between DE and GTFP are still at a nascent stage and no consensus has been reached. Three main points can be made as follows.
DE can promote GTFP by improving rapid economic growth, boosting people’s living standards, optimizing resource allocation, and enhancing environmental preservation (Li J. et al., 2022). Han and Liu (2022) argue that DE effectively promotes green development at the provincial level. Similar conclusions have been reached by scholars using city-level data (Liu et al., 2022; An et al., 2024). It is also emphasized that the TI and industrial structure upgrading serve as pivotal mechanisms through which DE facilitates the promotion of sustainable and environmentally friendly development (Zhang et al., 2022b; Dian et al., 2024; Liu et al., 2024). Building upon this, Li J. et al. (2022) incorporates spatial effects into their model and concluded that DE positively influences both local and adjacent GTFP. Furthermore, Deng et al. (2022) analyze the impact of DE on GTFP from an industry-specific perspective and find that DE enhances manufacturing GTFP.
Zhao et al. (2023) observe a noteworthy adverse direct effect of DE on GTFP. The reasons can be attributed to two aspects. Firstly, the establishment of digital infrastructure has led to increased investments in traditional industries like steel and optical fiber, consequently driving up energy consumption. Secondly, in the initial phases of industrial digitalization, the adoption of Internet of Things has contributed to increased electricity consumption. While the combination of digital technology and the energy revolution holds the potential to transform energy technologies and management systems, it is a long-term and challenging process. Although there is an improvement in the potential efficiency of resources and energy, the actual optimization effect is yet to be demonstrated. Therefore, during the phase of digital investments, it remains difficult to mitigate the growing energy and power consumption in traditional industries.
There exists a non-linear relationship between DE and GTFP. Lyu et al. (2023) suggest a noticeable U-shaped tendency between DE and GTFP, indicating an initial rise followed by a subsequent drop. This is because in the early stage of the digital economic development, the enhancement of GTFP is impeded by the pollutant emissions associated with extensive infrastructure improvement. Nevertheless, as the number of digital users increase, DE stimulates innovation in green technologies and improves energy efficiency, resulting in reduced pollutant emissions and an overall enhancement of GTFP. Other studies have identified three different threshold effects in the DE-GTFP relationship. First, when the digital economic development level is low, its impact on GTFP is either insignificant or inhibitory. Only after surpassing a certain threshold does DE significantly promote GTFP (Meng and Zhao, 2022; Hao et al., 2023). Second, there is a tipping point in the marginal impact of DE on GTFP. Once the threshold is exceeded, the impact of DE on GTFP shifts from strong to weak (Ma and Zhu, 2022). Last, the impact of DE on GTFP initially increases and then decreases (Zhang et al., 2021).
In conclusion, while the role of DE in economic development, particularly in fostering green development among regions, has garnered significant scholarly attention, these studies are predominantly conducted at the national or provincial level, and do not have a unified consensus. In addition, the related literature still lacks a comprehensive and in-depth analysis of the underlying theoretical mechanisms on the impact of DE on GTFP. Finally, the existing literature often overlooks threshold effects, spatial effects, or mediating effects when empirically testing the impact of DE on GTFP, leading to incomplete empirical results. Therefore, this study constructs a comprehensive theoretical framework to understand the impact of DE on GTFP and rigorously tests it using multidimensional panel models. Furthermore, the analysis is conducted using city-level data, allowing for a more precise examination of the disparities and development characteristics among regions and a more accurate investigation of the relationship between DE and GTFP. The findings provide valuable insights for DE promoting green sustainable development in China and other developing countries.
3 Mechanism analysis
This study elaborates on the theoretical analysis framework of the impact of DE on GTFP from four aspects as follows as shown in Figure 2. Additionally, research hypotheses are proposed.
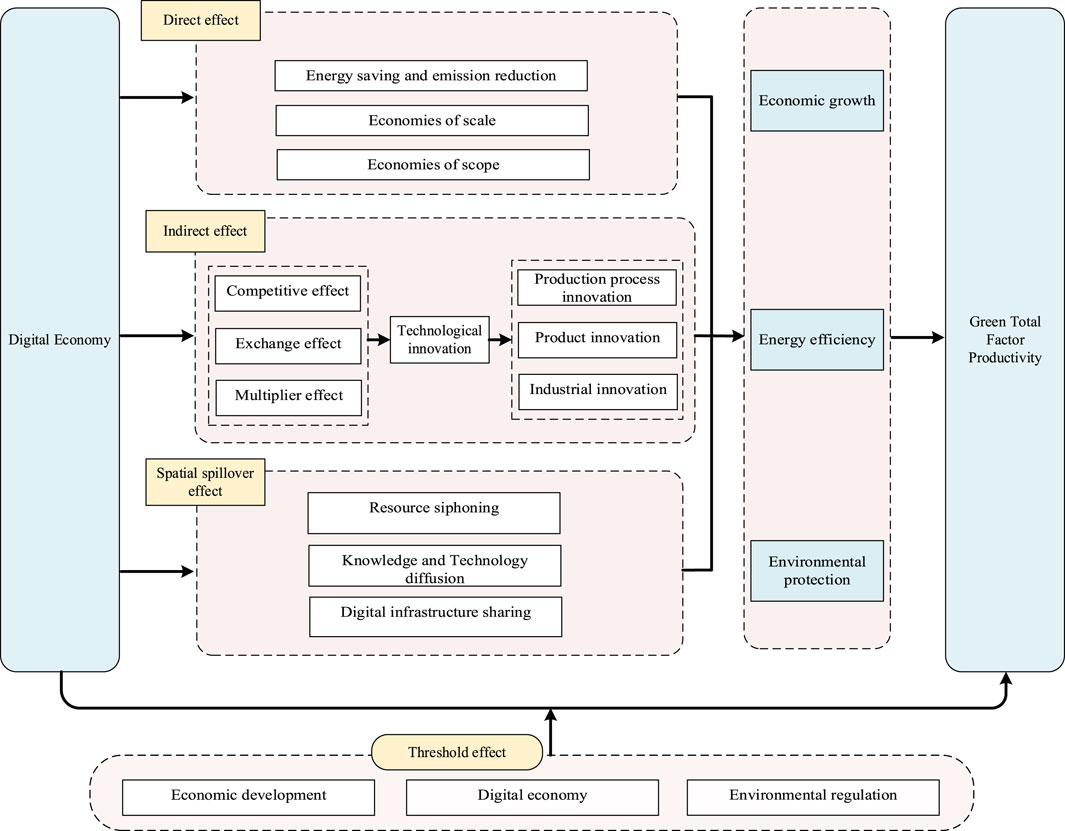
Figure 2. Mechanism analysis of DE on GTFP.
3.1 Direct effect
Considering the diminishing energy resources and escalating environmental degradation, the conventional economic development model characterized by intensive energy consumption and detrimental pollution has become unsustainable (Choi et al., 2012). Conversely, DE has the potential to influence GTFP through various mechanisms, including energy-saving and emission-reducing effects, economies of scale, and economies of scope. First, DE with data as its central production factor primarily achieves energy conservation and emission reduction through four key dimensions. From the perspective of production, the substitution of data factor inputs for traditional factor inputs, characterized by features such as reusability and zero marginal cost, has yielded a decline in energy consumption and pollution emissions (Kinelski, 2020). For instance, in traditional product research and development, extensive prototyping, physical testing, and adjustments consume significant amounts of materials and energy. However, digital twin technology allows these processes to be conducted in a virtual environment, significantly lowering energy usage and physical waste. From the standpoint of consumers, the cross-space-time spread of DE can reduce road congestion, fuel consumption and exhaust emissions by changing the transaction methods between buyers and sellers.
In terms of work, DE has facilitated the growth of remote work, telemedicine, and online education. This shift has resulted in reduced commuting and workplace infrastructure, leading to decreased energy consumption and a subsequent decline in automobile exhaust emissions (Ren et al., 2021). From the perspective of government governance, the utilization of information technologies enables the timely transmission of environmental pollution information to government decision-makers, businesses, and the general public. This facilitates a reduction in information asymmetry, improving the management of environmental concerns, enhancing the green economy development (Hampton et al., 2013; Levaschova et al., 2020). Furthermore, as a novel form of production factor, data possesses inherent qualities such as replicability and shareability, which contribute to the formation of a vast network effect within DE. This network effect arises from the presence of external users, and when their numbers reach a critical threshold, the positive feedback mechanism of DE triggers the Matthew effect. Consequently, enterprises witness a rise in marginal revenue and a decline in marginal cost, thereby generating economies of scale and subsequently augmenting GTFP (Cui et al., 2021). Additionally, DE is predominantly exemplified by the platform economy. By harnessing the digital platforms, enterprises can extend their reach into wider markets, thereby catalyzing the emergence of scope economies. Moreover, through the utilization of digital platforms and sophisticated data analytics technologies, enterprises can deliver increasingly personalized products to cater to the unique needs of different regions and markets, thereby further propelling the growth of scope economies (Li G. et al., 2022). Therefore, hypothesis 1 is proposed:
Hypothesis 1. DE has a positive impact on GTFP improvement.
3.2 Indirect effect
DE can also indirectly impact GTFP through TI. Specifically, DE enhances TI through competitive effects, exchange effects, and multiplier effects. This innovation leads to advancements in production processes, product innovation, and industrial innovation, thereby increasing production efficiency, reducing energy consumption, and improving energy efficiency, thus enhancing GTFP (Liu J. et al., 2020).
Regarding the impact of DE on TI, in micro contexts, the extensive adoption of digital information technology fosters market transparency, mitigates information asymmetry, thereby intensifying market competition, and compelling enterprises to continuously engage in technological innovation (Yang et al., 2021). On the mesoscopic level, digital technology with high permeability and strong externalities is conducive to the rapid dissemination, intersection, penetration and integration of knowledge among industries, thus fostering technological innovation (Zhang et al., 2021). At the macro level, DE can trigger the multiplier effect of network connections, facilitate the restructuring of innovation elements, reshape regional economic structures, establish a “positive feedback cycle” innovation model, and enhance collaborative innovation across different regions (Liu Y. et al., 2020).
In addition, TI plays a crucial role in reconciling the trade-off between economic growth and environmental sustainability, serving as a pivotal tool for attaining sustainable development (Hasan and Tucci, 2010). First, TI can trigger innovations in production processes. By incorporating automation, robotics, artificial intelligence, and IoT technologies, traditional production methods and processes are transformed, making manufacturing more efficient, precise, and flexible. This leads to an increase in desirable output (economic growth) while simultaneously reducing undesirable output (energy consumption) (Jung et al., 2017). Furthermore, TI drives the development of new products and enhances the performance of existing ones, thereby fostering product innovation. These innovations include the use of new materials, new design methods, and the integration of innovative features, not only optimizing user experience but also reducing energy consumption (Liu et al., 2024). Lastly, TI has also spurred industry transformation and the emergence of new industries, promoting industrial innovation. With the widespread application of new technologies, some traditional industries have been upgraded, while emerging sectors such as data analysis, sustainable energy solutions, and digital healthcare have rapidly developed. These emerging industries are reshaping the economic structure and reducing the overall economy’s dependence on traditional energy sources (An et al., 2024). Hence, hypothesis 2 is posited:
Hypothesis 2. DE indirectly promotes GTFP by influencing TI.
3.3 Threshold effect
Drawing upon the preceding analysis, DE has the potential to enhance GTFP. However, there might be a threshold for the influence of DE on GTFP. In situations where the development level of DE remains low, the positive externalities associated with DE may not effectively counterbalance the strain exerted on raw materials and supply equipment resulting from its expansion. This, in turn, may impose greater pressure on local resources and the economy, potentially impeding the improvement of GTFP (Wang et al., 2022). Nevertheless, as DE progresses to a particular stage, it can not only facilitate its own expansion but also promote collaborative development and the sharing of network infrastructure. Consequently, this transformation towards intelligent methods substantially reduces transaction costs and improves efficiency in optimizing and allocating resources, contributing to the enhancement of GTFP.
The influence of DE on GTFP is also affected by economic development. At lower levels of economic development, DE might encounter various limitations, thereby creating obstacles in achieving its environment-friendly production advantages. For instance, a dearth of digital infrastructure (e.g., data centers and cloud platforms), a scarcity of skills and talent, insufficient funding and investment, and inadequate regulatory systems can restrain the diffusion and adoption of digital technologies. Resultantly, DE may concentrate more on catering to basic requirements instead of investing in eco-friendly innovation and sustainable growth. However, once economic development surpasses a particular threshold, limitations in resources and technology start to diminish. Digital technologies become widespread across the economy. By incorporating digital technologies, improving production processes, enhancing labor productivity, and facilitating resource management, industries can boost energy efficiency and lower energy consumption, consequently enhancing GTFP (Lange et al., 2020; Huang and Lei, 2021). Additionally, as economic development level increases, the coordination between social management systems and cyberspace also increases, mitigating the impact of market uncertainty on GTFP and expanding the role of DE in promoting GTFP.
The impact of DE on GTFP may also shift with the intensity of environmental regulation (ER). The combination of DE and ER can effectively leverage the contribution of DE in fostering GTFP. When the intensity of ER falls below a threshold level, enterprises may lack urgency in adopting digital technologies to mitigate environmental impacts, prioritizing short-term economic gains over long-term sustainability. This hinders the realization of the full potential of digital technologies for green production. However, once the intensity of ER surpasses the threshold, enterprises are compelled to adopt established digital technologies to minimize the environmental effects of their operations or undertake green and low-carbon transformations. Through digital transformation, these enterprises can enhance energy efficiency and lower pollution emissions, thereby promoting GTFP. Building on the analysis above, this study puts forward the hypothesis 3:
Hypothesis 3. The influence of DE on GTFP has threshold effect.
3.4 Spatial spillover effect
Krugman (1991) emphasized the potential “siphon effect” or “diffusion effect” of factor mobility in urban development (Krugman, 1991). According to this theory, when DE experiences rapid growth in a particular region, it attracts an influx of high-skilled talents, capital, and resources, creating a resource siphoning effect on the surrounding areas. This poses challenges for the green development of the adjacent regions.
Meanwhile, in contrast to traditional business models, DE takes information networks and data resources as its core components, creating an open ecosystem that transcends geographical limitations and breaks down market boundaries (Sorescu and Schreier, 2021). This promotes the flow of information and the diffusion of knowledge and technology, thus improving surrounding areas’ GTFP. First, the prosperity of DE is often accompanied by the accumulation of knowledge and TI. With the widespread adoption of digital technologies, market information and production factors, including knowledge and technology, gradually become digitized. It speeds up the dissemination of knowledge and technology to the surrounding regions, thereby enhancing GTFP of these adjacent areas. Second, according to regional innovation theory, regions that are geographically close or technologically similar are likely to undergo economic imitation (Lyu et al., 2023). The imitation further harnesses the positive spatial effects of knowledge and technology, positively impacting the GTFP of adjacent regions. Third, the characteristics of DE, such as informatization, networking, and intelligence, facilitate meaningful cross-regional collaboration among enterprises, making the dissemination of knowledge and technology more convenient. This contributes to the establishment of digital innovation ecosystems among enterprises, further promoting the production of environmentally friendly products (Wielgos et al., 2021).
Additionally, the development of DE is often accompanied by upgrades and expansions in digital infrastructure. Surrounding regions can benefit from these improvements, enhancing their digital capabilities. In turn, enterprises in surrounding regions can utilize these improvements to enhance their production and environmental management, thus increasing GTFP.
Hypothesis 4. DE has spatial spillover effect on GTFP.
4 Methodology and data
4.1 Empirical model specification
4.1.1 Preliminary model
To assess the direct impact of DE on GTFP, this study designates GTFP as the dependent variable and DE as the core explanatory variable, incorporating control variables that are closely related to GTFP. Referencing Zhang et al. (2021), the preliminary model is formulated as follows:
where i means the city; t means the year; GTFP is the green total factor productivity; DE is the development degree of digital economy; X is the control variables, which are industrial structure upgrading (ISU), urbanization level (Urban), market size (Market) and population density (Pop) respectively;
4.1.2 Mediation model
According to previous theoretical analysis, DE may indirectly enhance GTFP by promoting TI. Therefore, with TI as the mediating variable, this study constructs the mediation model using the stepwise regression method, as detailed below:
where, TI stands for technological innovation, which represents the mediating variable, and other variables are set as before. In the mediation model, the total effect is denoted by
4.1.3 Threshold model
Given the digital divide and regional development disparities within China, alongside varying intensities of local government regulation, the impact of DE on GTFP may display unique features shaped by the external environment. Traditional linear regression models, presuming a linear relationship between independent and dependent variables, cannot adequately address potential nonlinear relationships between variables. However, the threshold regression model addresses this limitation by introducing a threshold variable and its corresponding threshold parameter. It divides the data into two or more regions and fits different linear relationships within each region, thus more accurately capturing the nonlinear characteristics of the data (Hansen, 1999). In this study, economic development, the digital economy, and environmental regulation are considered as threshold variables to extend Eq. 1 as the following threshold regression model:
where
Specifically, referencing Hansen (2000), the threshold value in Eq. (5) is identified using a grid search approach, where the observation that results in the smallest sum of squared residuals is established as the conclusive threshold value. Furemore, the presence of the threshold effect is tested by a bootstrap algorithm. The null hypothesis and the alternative hypothesis are shown in Eq. (6) and Eq. (7) , respectively:
where n represents the number of threshold values,
4.1.4 Spatial econometric model
In traditional econometric models, it is commonly presumed that sample observations are independent of each other. However, in a vast country like China, where complex economic and environmental links exist between regions, GTFP at one geographic location may be influenced by DE at neighboring locations (Lyu et al., 2023). Ignoring the spatial spillover effect can lead to biased estimation results. Spatial econometric models address this spatial dependence by incorporating a spatial weight matrix to delineate connections across different geographic areas. These models can be divided into three main types: the Spatial Lag Model (SLM), the Spatial Error Model (SEM), and the Spatial Durbin Model (SDM). The SLM assumes that the value of the dependent variable is influenced by the values of the same variable in neighboring areas, while the SEM accounts for spatial correlation among the model’s error terms. The SDM integrates features of both the SLM and SEM, including spatial lag terms for both the independent and dependent variables, as well as spatial correlation among the error terms (Elhorst, 2012). Even in cases requiring the application of an SLM or SEM, the SDM can still produce unbiased estimation coefficients (Lesage and Pace, 2009). Therefore, the SDM is selected to capture the spatial correlation between DE and GTFP, and the SDM based on Eq. 1 is set as follows:
where
The spatial weight matrix plays a crucial role in the SDM. Following the first law of geography, spatial units that are closer to each other exhibit a stronger spatial spillover effect, which diminishes as the distance between them increases. Consequently, this research employs an inverse distance square spatial weight matrix W in Eq. (8), with the specific form presented below in Eq. (9):
where, d represents the direct geographical distance between the two cities, which is computed based on their latitude and longitude.
4.2 Variables definition and measurement
4.2.1 Explained variable: green total factor productivity (GTFP)
GTFP, considering “undesired output” in production activities, serves as a key metric to assess the environmentally sustainable progress of an economy. Currently, although various methods to measure GTFP have been proposed by scholars, most of them have limitations. However, since proposed by Wang et al. (2013), the Biennial Malmquist-Luenberger Productivity Index (BMLPI) method has emerged as a powerful tool for measuring GTFP and scrutinizing productivity changes, due to its advantages such as nonparametricity, consideration of uncertainty, analysis of multi-period data, and multifactor productivity measurement. This study employs the BMLPI method for GTFP calculation, using labor force, capital stock, and energy consumption as input variables, and real gross domestic product as the desired output, while considering industrial sulfur dioxide emissions, industrial wastewater discharge, and industrial smoke emissions as non-desired outputs. The GTFP used in this study is cumulative with the base year being 2010.
4.2.2 Core explanatory variable: digital economy (DE)
Digital economy (DE) is identified as economic activities related to digital technologies and information. Currently, there is no widely accepted unified measurement for DE. Due to limited data availability at the city level and with reference to Zhao et al. (2020), this study selects six indicators, including the number of internet broadband access users per 100 individuals, the percentage of employees involved in computer service and software, telecommunication services per capita, postal services per capita, the number of cell phone subscribers per 100 individuals, and the development of digital inclusive finance, to evaluate the level of DE development. The data underwent standardization and downscaling, and a composite index, denoted as DE, was derived through principal component analysis (PCA).
4.2.3 Mediating variable: technological innovation (TI)
Technological innovation (TI) is regarded as the process of improving and updating existing technologies or production methods by introducing new knowledge, ideas, methods, technologies, or applications. Typically, TI is gauged by indicators, for example, the quantity of patent applications, granted patents, new product development projects, and revenue generated from new products. However, the presence of low-quality or fraudulent patents undermines the accuracy of patent application numbers as a true reflection of regional innovation output. Additionally, acquiring data on revenue from new product sales and the quantity of new product development projects at the urban level may not be feasible. The authorized amount of invention patents, on the other hand, better captures the quality of innovation output. Hence, this study selects the authorized amount of invention patents as proxy variable of TI, designated as TI.
4.2.4 Threshold variables
In this study, economic development, digital economy and environmental regulation are used as threshold variables to test the non-linear effects of DE on GTFP.
(1) Economic development (PGDP). Economic development is mentioned as the overall progress and advancement of an economy. Regions at different levels of development exhibit disparate levels of utilization of digital technologies, which can result in heterogeneous effects of DE on GTFP. This study follows the common practice of utilizing GDP per capita as an indicator for economic development (Yang et al., 2021), denoted as PGDP.
(2) Digital economy (DE). In this study, digital economy defined and assessed above is selected also as one of the threshold variables. DE possesses technical attributes that exhibit extensive coverage and penetration, suggesting the possibility of non-linear threshold effects.
(3) Environmental regulation (ER). Environmental regulation is known as the government’s regulatory actions aimed at protecting the environment by controlling various activities that may pollute the public environment. Environmental regulation constrains the behavior of enterprises and affects the relationship between DE and GTFP. There are numerous methods available to quantify environmental regulation, and in view of the limited availability of data in urban-level cities, this study uses the rate of real GDP to total three wastes emissions as environmental regulation (Zhao, 2022). The specific calculation is as follows:
where
4.2.5 Control variables
(1) Industrial structure upgrading (ISU). Industrial structure is crucial to evaluate the progress of modern economy. A more scientifically industrial structure can effectively foster the balanced growth of the economy, resources, and environment, thereby enhancing GTFP (Deng, et al., 2022). This study adopts a method inspired by (Han et al., 2022), using the tertiary industry’s proportion of GDP to represent ISU.
(2) Urbanization level (Urban). The process of urbanization inherently generates a substantial demand for resource consumption. Nonetheless, it also has the potential to stimulate industrialization and facilitate green industrial production (Sadorsky, 2013), thereby enhancing environmental condition. In this study, Urban is quantified by the urban population proportion, following the common practice among scholars (Jiang, et al., 2021).
(3) Market size (Market). The size of the market directly relates to the potential consumer purchasing power and business opportunities within the market. The larger the market size of a city, the more it can resist the risk effects of the economic system. In this study, Market is represented by the total retail sales of social consumer goods.
(4) Population density (Pop). The agglomeration economy has scale effects and technological externalities, and may also produce crowding effects, which will exert adverse effects on the environment and impede the enhancement of GTFP. In this study, the population per unit area, commonly employed by scholars, is denoted as Pop to represent population density (Li, et al., 2021).
4.3 Data source
Since 2010, the development of DE has been steadily maturing. Due to administrative adjustments in cities like Chaohu and Bijie, as well as changes to statistical indicators from 2011 onwards, some cities, including autonomous prefecture-level cities, have experienced significant data deficiencies. Therefore, this study covers the period from 2011 to 2020 and focuses on panel data from 284 prefecture-level and above cities in China. Although these cities do not encompass all city types, which may limit the comprehensiveness of the research results, they reflect a wide variety of urban categories and development stages, providing extensive coverage and detailed insights, and are widely used in studies of China’s urban hierarchy.
Data sources include the China Urban Statistical Yearbook, the China Regional Economic Statistical Yearbook, research reports from Chinese government websites, and databases from the Digital Research Center of Peking University. The relevant data are standardized to the 2010 base year. For the missing data, the linear interpolation method and geometric average growth rate extrapolation are used to fill in the gaps. The descriptive statistics of the variables are shown in Table 1. As indicated, the fluctuations in all variables are relatively small, and there are no extreme values present.
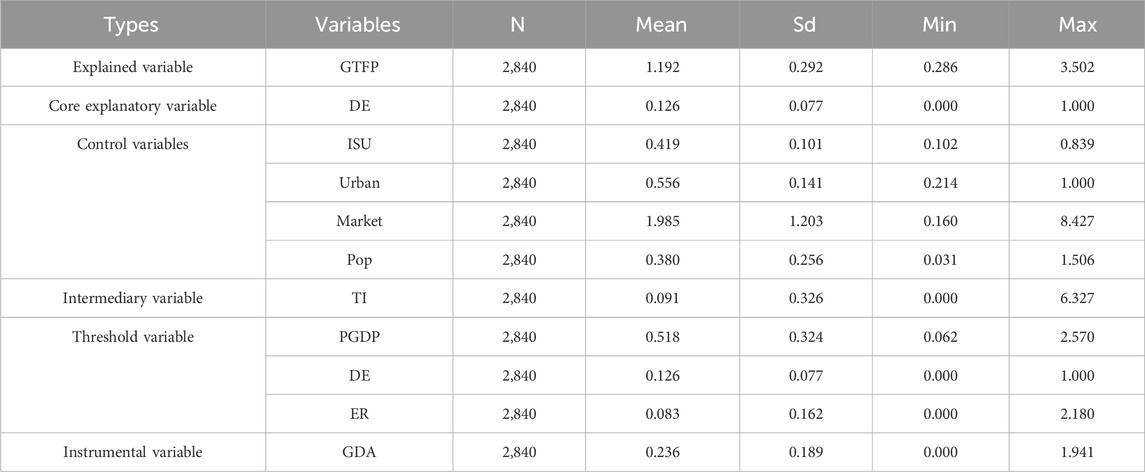
Table 1. Descriptive statistics of variables.
5 Empirical results
5.1 Spatiotemporal change of DE and GTFP
5.1.1 Temporal variation of DE and GTFP
To perform an initial analysis of the temporal variations of DE and GTFP, a statistical relationship between the two is depicted using average values obtained from 284 cities in China over the period from 2011 to 2020 (Figure 3). Both DE and GTFP show a monotonically increasing trend over the study period. Therefore, it is tentatively confirmed that DE produces a positive influence on GTFP. In particular, DE increases significantly in 2020, mainly because the outbreak of the COVID-19 epidemic has increased online activities and provided new opportunities for the development of DE (Zhang et al., 2022c).
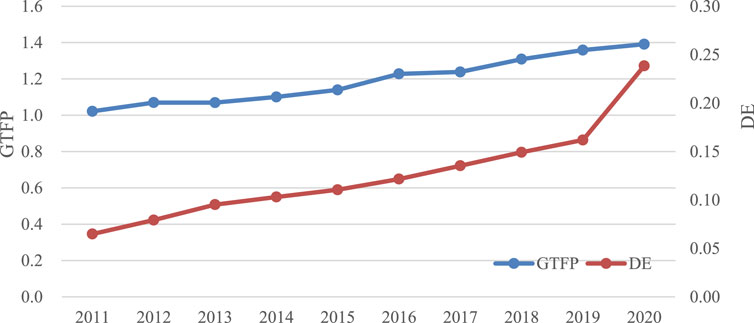
Figure 3. Temporal variation of DE and GTFP (2011–2020).
5.1.2 Spatial variation of DE and GTFP
To analyze the spatial variation of DE and GTFP, DE and GTFP are classified into five levels using the natural break method. The spatial patterns of these two factors are illustrated for two representative years, 2011 and 2020 (Figure 4). The results reveal significant spatial agglomeration characteristics of DE, with high-level DE areas primarily concentrated in the eastern coastal regions, indicating a spatial development pattern of higher levels in the east and lower levels in the west. In 2011, only Beijing exhibited a medium level of DE, while other cities were categorized as low-level. However, by 2020, the overall development level of DE had significantly improved. Higher levels of DE were observed predominantly in the eastern coastal areas, gradually expanding from the coast to the inland regions. Moreover, these higher-level areas tended to extend into surrounding regions, with existing agglomerations serving as the focal points.

Figure 4. Spatial variation of DE and GTFP (2011–2020).
However, the spatial pattern of GTFP has transitioned from a scattered distribution to a more continuous development. In 2011, GTFP exhibited a limited number of high-level cities, with only 11 cities including Liupanshui, Wuwei, Loudi, Jiayuguan, Guyuan, Jinzhong, Wuzhou, Zhuzhou, Zigong, and Suizhou, accounting for merely 3.87%. This suggests that most cities were still reliant on an extensive economic development model during that period. As the economy transformed towards high-quality development, the number of high-level cities in GTFP increased to 176 cities by 2020, accounting for 61.97%. This significant rise indicates that the majority of cities in China have made significant progress in achieving environmentally-friendly economic development.
5.2 Preliminary regression results
The results of the Ordinary Least Squares (OLS), Random Effects and Two-Way Fixed Effects (TWFE) regressions can be found in Table 2. The Hausman test results, with a p-value (Prob > chi2) less than 0.001, indicate that the TWFE model is selected for the preliminary analysis. The TWFE regression results show that the coefficient of DE is estimated to be 0.262, with a significance level of 5%. This indicates that the growth of DE significantly contributes to GTFP, highlighting the crucial role of DE in promoting green and sustainable development. Theoretically, DE is capable of facilitating energy-saving and emission-reducing effects, alongside achieving economies of scale and scope, thereby contributing to an enhancement of GTFP. This finding confirms hypothesis 1.
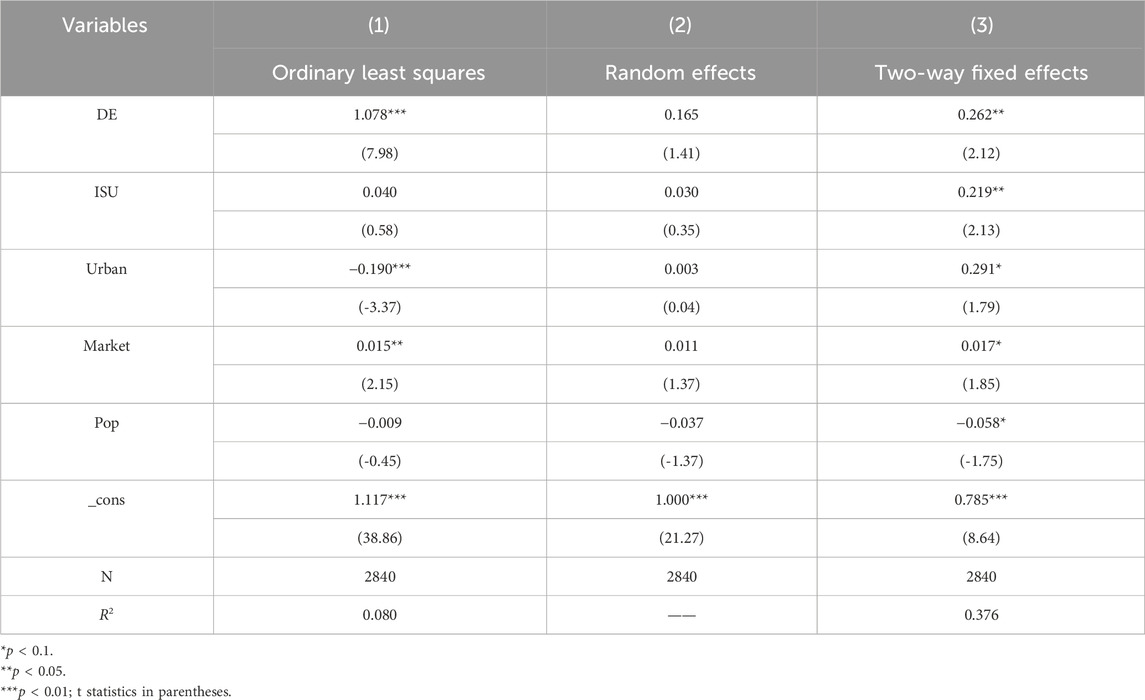
Table 2. Preliminary regression results.
Additionally, after controlling for other variables, our research indicates that upgrading industrial structures, increasing urbanization levels, and expanding market size significantly promote GTFP. Specifically, urbanization has the most notable promoting effect on GTFP, while the effect of market size on GTFP is comparatively weaker. Moreover, population density exhibits a substantial inhibitory effect on GTFP.
5.3 Mediating effect analysis
Table 3 shows the mediation model regression results. The coefficients of DE on GTFP, DE on TI, and TI on GTFP show statistical significance in all three equations. This underscores the established role of TI as a mediator in DE’s contribution to GTFP enhancement. This mediation can be attributed to competitive effects, exchange effects, and multiplier effects of DE, which not only stimulates TI within enterprises and industries but also fosters innovation incentives. Additionally, TI drives advancements in production processes, product innovation, and industrial innovation, resulting in energy savings and reduced emissions, thereby enhancing GTFP. Moreover, in column (3), the coefficient of DE on GTFP also shows statistical significance at a 10% level, but it is smaller than that observed in column (1). This suggests that TI partially mediates the impact of DE on GTFP enhancement, supporting hypothesis 2.
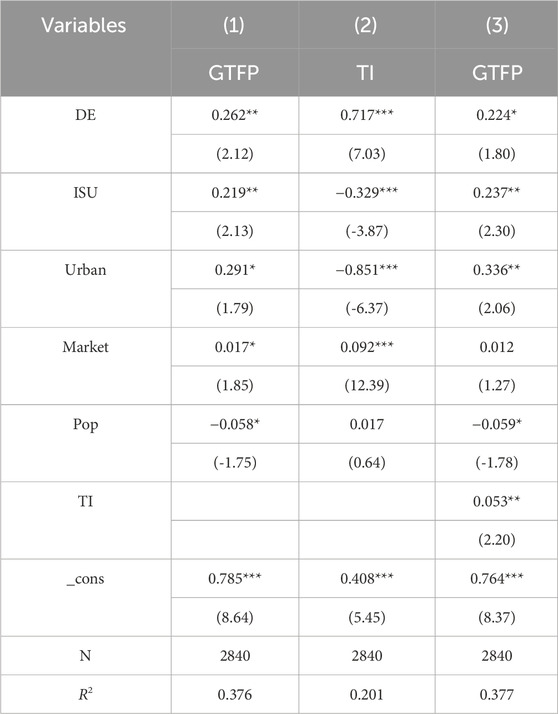
Table 3. Estimation results of mediating effect.
5.4 Nonlinear effect analysis
5.4.1 Threshold effect test
Given the potential non-linear relationship between DE and GTFP, economic development (PGDP), digital economy (DE) and environmental regulation (ER) are employed as threshold variables, respectively, to examine the threshold effect of DE on GTFP. In line with Hansen’s approach, the determination of the number and size of the thresholds precedes the estimation process. The bootstrap method is employed to test the threshold effect. Models are set up with zero, single, double, and triple thresholds for each of the variables. p-values for the triple threshold configurations—0.62, 0.83, and 0.416—suggest these thresholds do not achieve statistical significance. In contrast, the single and double thresholds demonstrate significant effects (referenced in Table 4), indicating significant double threshold effects for each variable.
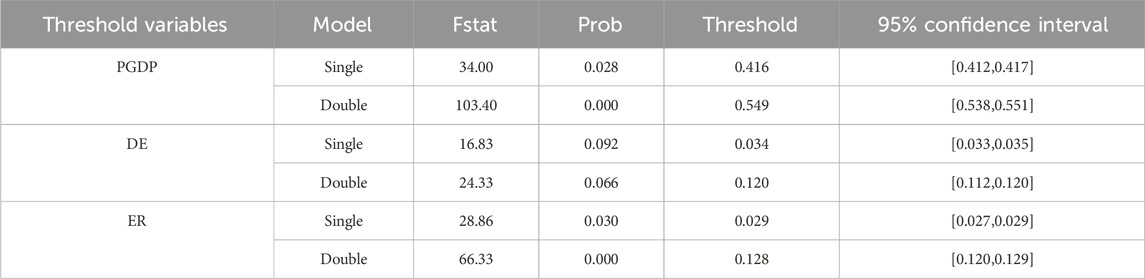
Table 4. Threshold effect test.
5.4.2 Threshold regression estimation result
The threshold regression results are presented in Table 5. First, with PGDP as the threshold variable, in the early stages of economic development, when PGDP is below the first threshold, DE influences GTFP growth, albeit without statistical significance. However, as economic development progresses and PGDP surpasses the first threshold, DE transitions from having an inconclusive effect on GTFP to bolstering it, though it still lacks statistical significance. Finally, as economic development advances and PGDP exceeds the second threshold, the growth of DE significantly improves GTFP. This can be attributed to the fact that at lower levels of economic development, constraints related to finance, talent, and technology often hinder the potential of DE to achieve green growth. As economic development progresses, these constraints gradually diminish, unleashing the latent potential of DE. Particularly noteworthy is that when economic development reaches a certain level, the synergistic integration of DE characteristics such as digitization, intelligence, and sustainability with the traditional economy creates a multiplier effect that significantly boosts GTFP growth (Choi and Hoon Yi, 2009). Therefore, in underdeveloped regions where constraints remain significant, DE negatively impacts GTFP, worsening developmental imbalances. Conversely, in developed regions, the positive effects of DE further accentuate the developmental divide.
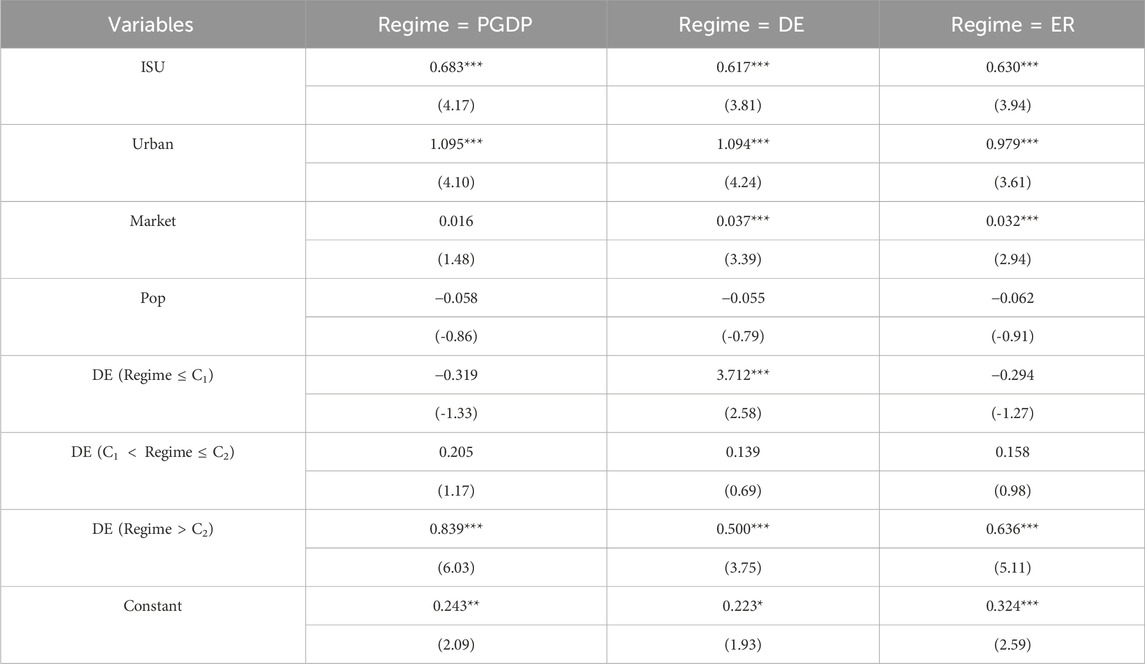
Table 5. Threshold regression results.
Considering DE as the threshold variable, its impact on GTFP follows a three-stage pattern characterized by an initial significant enhancement, followed by a weakening effect that becomes statistically insignificant, and then a subsequent significant strengthening. This diverges subtly from the theoretical analysis. It can be attributed to the nascent stage of DE, during which, as an emerging technology and infrastructure, it began to exhibit positive effects (Wu et al., 2021). Despite the initial benefits, broader adoption of DE and its infrastructure led to a rebound effect in energy consumption driven by the technological revolution propelled by digital technology (Takase et al., 2004). Specifically, the development of digital infrastructure was accompanied by substantial energy expenditure and the emission of pollutants. The advancement of digital infrastructure had both advantageous and detrimental consequences, resulting in the statistically insignificant impact of digital infrastructure on GTFP. As DE progresses beyond the second threshold, along with the growing positive externalities, its influence on GTFP becomes significantly more pronounced.
Finally, with ER serving as the threshold variable, it has similar threshold characteristics to economic development, that is, only when ER exceeds the second threshold can DE significantly promote GTFP. The possible reason is that when ER is below the threshold, enterprises rarely use digital technology to reduce the environmental impact of production. However, when ER continues to exceed the threshold, in order to cope with the high intensity of environmental regulation, enterprises will choose to utilize mature digital technology to mitigate the adverse environmental effects of production or choose to transform into green and low-carbon enterprises.
In summary, there exists a nonlinear relationship between DE and GTFP. The direction and intensity of the impact of DE on GTFP exhibit distinct stage-specific characteristics, which vary with the level of economic development, the degree of DE development, and the strength of Environmental regulation.
5.5 Spatial effect analysis
5.5.1 Spatial autocorrelation test
Before conducting the estimation, the spatial autocorrelation of the variables was assessed using the global Moran index (as presented in Table 6). The results reveal that the estimated coefficients of all variables are positive and have passed the significance level test in most years, suggesting these variables exhibit noticeable positive spatial autocorrelation.
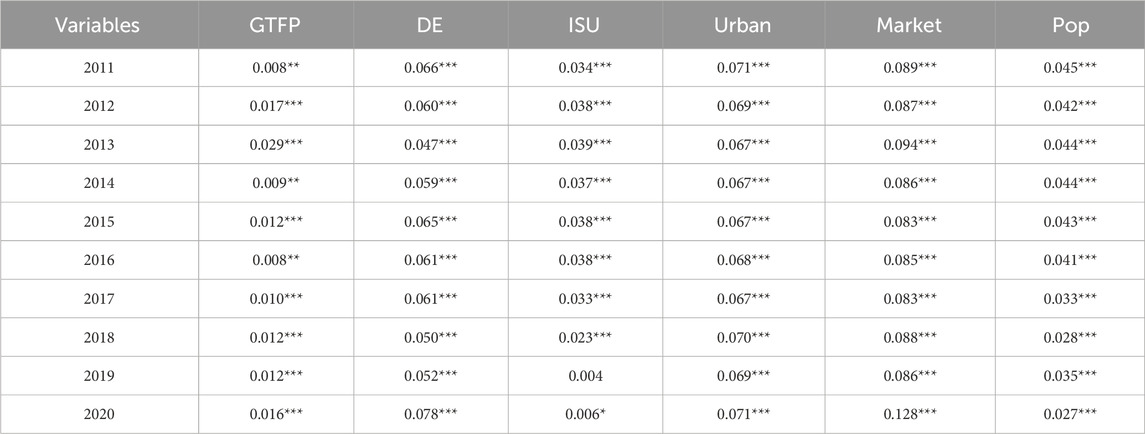
Table 6. Global spatial autocorrelation test.
Nonetheless, the global Moran index tends to equalize regional disparities and does not capture the local spatial correlation characteristics. For a more in-depth examination of the correlation among cities, using a distance-squared inverse spatial weight matrix W1, local indicators of spatial association (LISA) maps were constructed for 284 cities (2011–2020) in China (Figure 5).
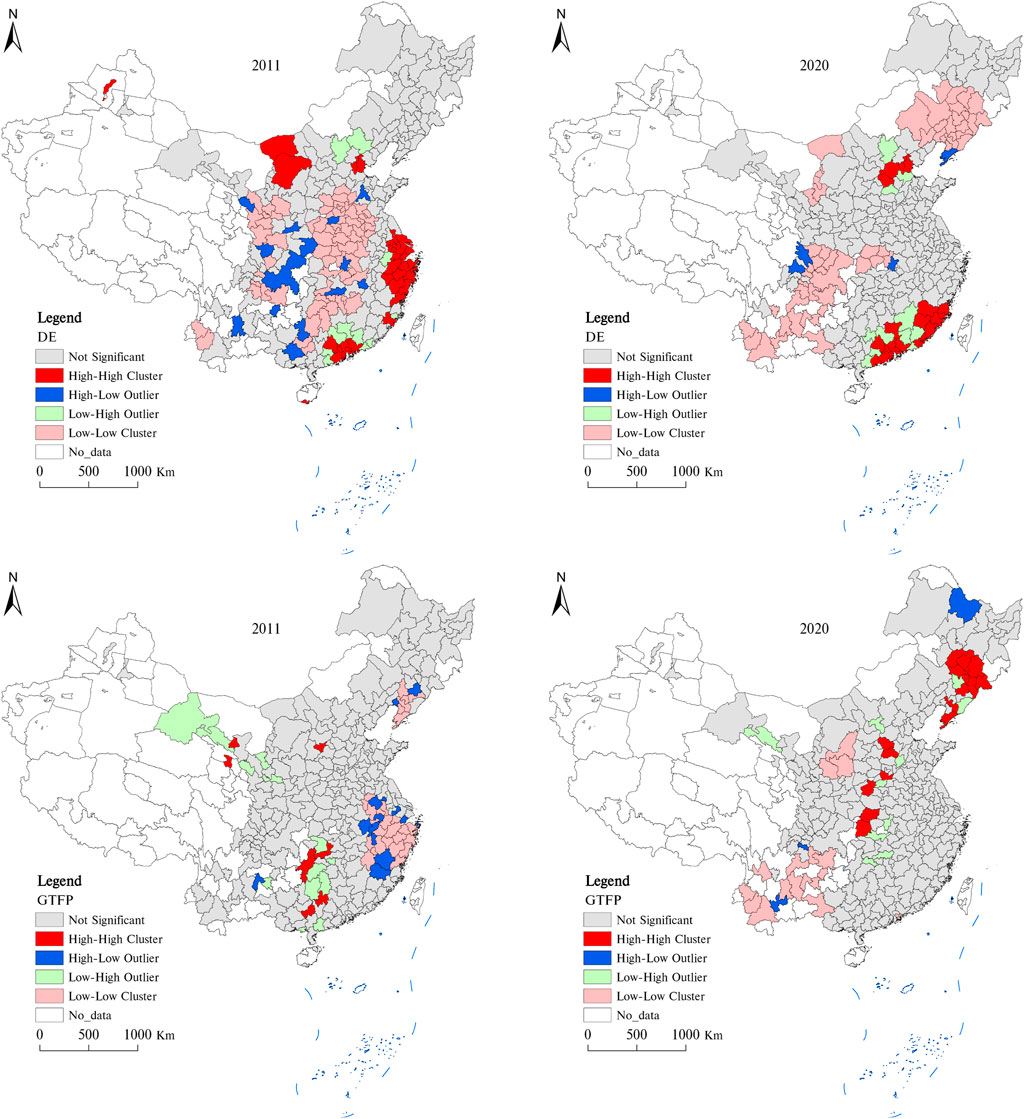
Figure 5. LISA map of DE and GTFP in 2011 and 2020.
From Figure 5, it can be observed that DE and GTFP have some local spatial autocorrelation, and the clustering pattern is clearly evident. The “High-High” cluster area of DE is relatively stable, mainly concentrated in the Beijing-Tianjin-Hebei and Pearl River Delta regions, while the distribution range of the “High-High” cluster area of GTFP is smaller than the same type area of DE, and shifts from the south to the central and northeast. The “low-low” cluster area of DE is mainly shifted from the central region to the south-west and north-east, while the “low-low” cluster area of GTFP is shifted from the eastern coastal area to the central and western regions. The “High-Low” and “Low-High” cluster areas of DE and GTFP are adjacent to their “Low-Low” and “High-High” cluster areas respectively.
5.5.2 Spatial econometric model selection
The specific form of the spatial econometric model is selected through the Lagrangian multiplier (LM) test, the Hausman test, the likelihood ratio (LR) test and the Wald test. The results of the tests are shown in Table 7. The testing procedure unfolds as follows: First, LM and its robust counterpart (R-LM) are derived through OLS estimation of the model without spatial effects, determining the suitability of either SAR or SEM model. Second, if the LM test indicates significance for both LM and R-LM, the SDM is chosen following Elhorst’s recommendations (Elhorst, 2012). Third, the Hausman test is applied to the SDM to discern between Fixed Effects (FE) or Random Effects (RE). Then, the LR test is employed to examine the FE of the SDM, identifying spatial or temporal FE. Finally, both the Wald and LR tests are conducted on the SDM to assess its potential simplification to SAR or SEM models. Following these steps, the SDM with two fixed effects emerges as the most suitable model for spatial econometric analysis in this research.
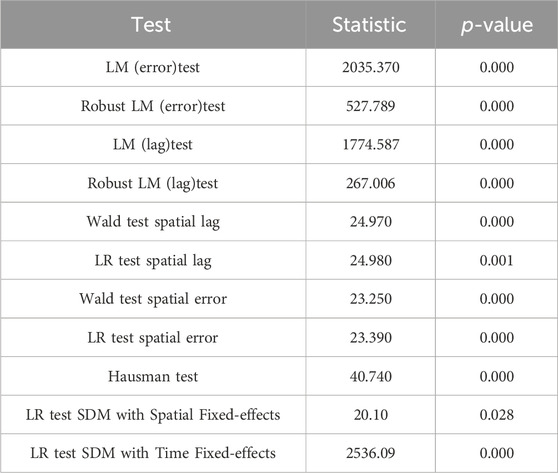
Table 7. Identification test of the spatial panel econometrics model.
5.5.3 Regression results of the spatial econometric model
Based on the SDM, the parameter estimation is conducted using Maximum Likelihood Estimation (MLE), and the results are presented in Table 8. The significantly positive spatial autocorrelation regression coefficient for GTFP in Column (3) indicates that regional GTFP benefits from the GTFP of surrounding areas. Additionally, both the direct and spatial spillover effects of DE on GTFP are significantly positive, with a more pronounced influence in surrounding areas. These findings suggest that DE has a greater technological diffusion effect on surrounding areas than the resource suction effect, positively influencing green development in these regions. Likely due to digital technology’s ability to overcome physical barriers to the dissemination of data, information, and technology, such widespread interconnectivity promotes extensive technological integration across various sectors. The results validate research hypothesis 4 and underscore the essential role of inter-regional collaboration in crafting strategies for green growth and DE advancement.
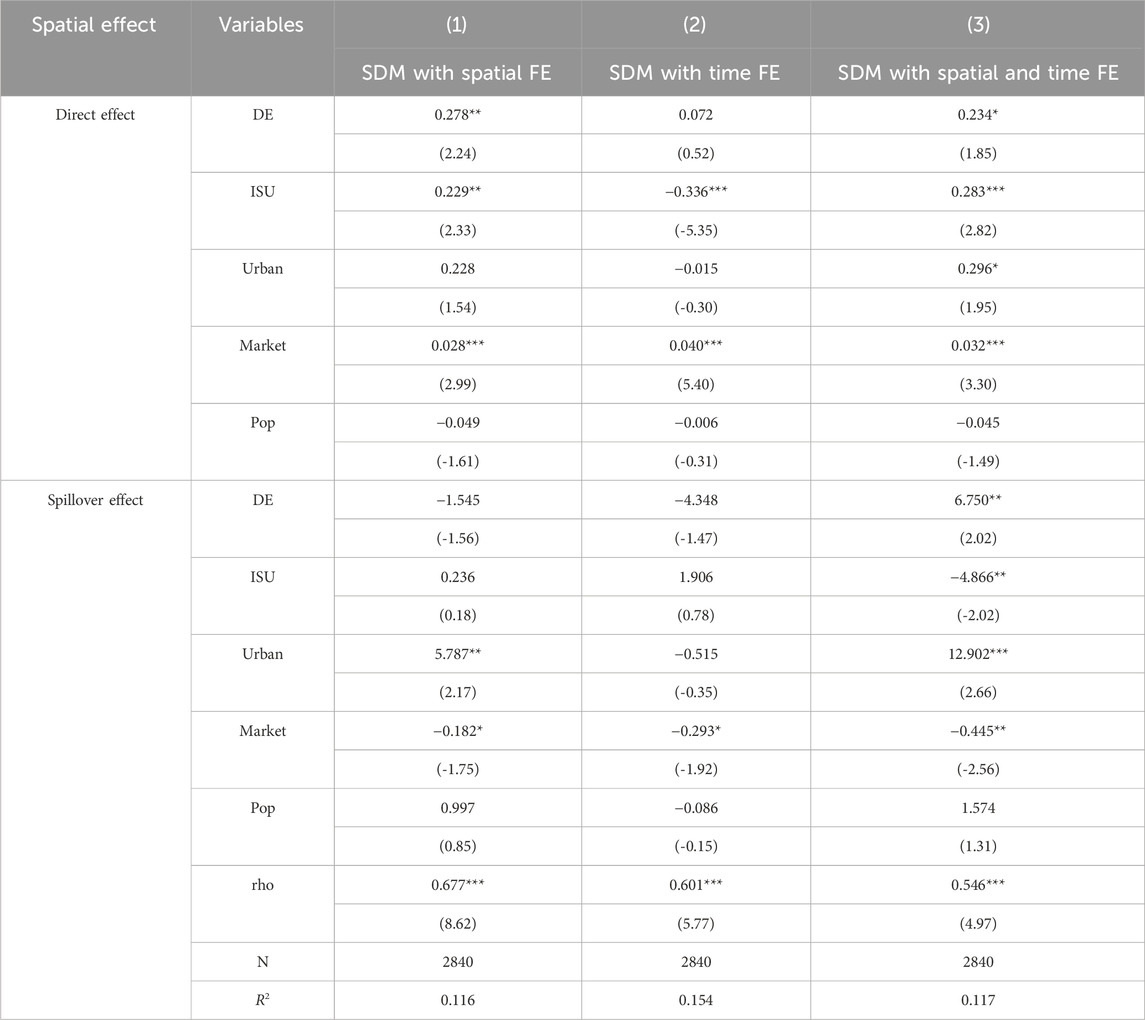
Table 8. Regression results of SDM.
The coefficients pertaining to the control variables yield the following insights. First, the coefficients for the direct and spatial spillover effects ISU and Market are significantly positive and negative, respectively, indicating that industrial structure upgrading and expanding market size can enhance local GTFP but restrain GTFP in surrounding areas. As the industrial structure continues to upgrade, resources are gradually shifting towards the low-pollution and high value-added tertiary sector, which benefits the improvement of local GTFP (Li J. et al., 2022). However, the backward industries may relocate to the surrounding areas, which hinders the improvement of GTFP in the surrounding regions. Additionally, a larger market size is also beneficial for the realization of economies of scale, thereby promoting the development of local GTFP. However, the siphoning effect may attract resources from the surrounding areas, which inhibits the enhancement of GTFP in the neighboring regions.
Second, the coefficients of direct and spatial spillover effects of Urban are both significantly positive, which means urbanization can promote GTFP both in local and neighboring regions. The agglomeration effect of factors caused by the scale economy effect and division of labor cooperation of urbanization, which contributes to enhancing production efficiency and boosting GTFP. Additionally, the advancement of urbanization fosters the optimization of the transport network, strengthening the geographical connection with the surrounding areas, promoting the full exchange of population, resources and information, and promoting GTFP in the surrounding regions. This is the same to the findings of Zhang et al. (2021).
Finally, the coefficients for direct and spatial spillover effects of Pop are negative and positive, respectively, but they are not statistically significant, showing that population density has no significant impact on local GTFP and neighboring cities. A large concentration of population is conducive to providing a labor supply, but at the same time, it also generates a high demand for resources, leading to traffic congestion.
5.6 Heterogeneity analysis
The analysis above indicates that DE has contributed to the overall improvement of GTFP in China. However, it is widely recognized that DE’s impact on GTFP is heterogeneous on key players. While DE has the potential to help address regional disparities and bridge the divide between developed and developing regions (Matkovskaya et al., 2022), it is important to note that the emergence of the information technology revolution has not only failed to promote balanced global development but has also exacerbated global inequality. This phenomenon is often referred to as the “digital divide” (Lazović et al., 2022).
China’s regional development is unbalanced and insufficient. Whether DE’s impact on GTFP varies across different cities will directly affect whether the regional development gap will widen further under the new round of development opportunities. Therefore, when examining DE’s impact on GTFP, it is necessary to explore the heterogeneity in its effects. This study analyzes the heterogeneity by considering differences in policy intensity and city development type (as shown in Table 9).
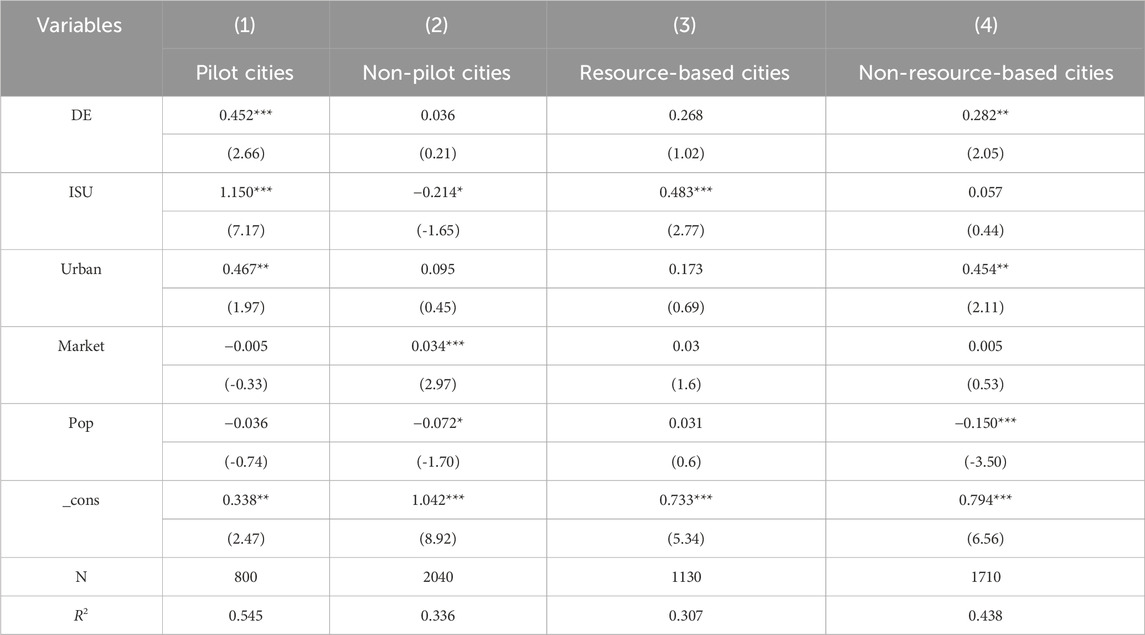
Table 9. Heterogeneity analysis.
5.6.1 Heterogeneity in policy intensity
DE is an emerging industry and relies heavily on government policy support. In 2015, the Chinese government released the “Action Outline for Promoting the Development of Big Data”, with the aim of consolidating various experiences in advancing the big data industry for nationwide promotion and replication. Subsequently, China established “big data comprehensive pilot zones” to leverage their influential and demonstrative effects. The sample is divided into pilot cities and non-pilot cities for regression analysis to explore the differences in DE’s impact on GTFP across different policy environments.
Based on the results presented in columns (1) and (2) of Table 9, it is evident that DE has a significantly positive impact on the GTFP of pilot cities, whereas its influence on the GTFP of non-pilot cities is less pronounced. This discrepancy underscores the crucial role of government policy support in enhancing the impact of DE on GTFP. In big data pilot cities, the government implements various support policies, such as advancing the construction of data centers, enhancing the integration and sharing of digital resources, improving information infrastructure, and developing innovative applications of big data. These measures not only directly foster the development of DE but also facilitate the digital and smart transformation of traditional industries, optimizing production processes and increasing energy efficiency through big data analytics. Collectively, these changes effectively enhance GTFP, contributing to green growth. Given these outcomes, it is recommended that the government intensify its policy support in regions with weaker economic development to maximize the green growth potential of DE and narrow regional disparities.
5.6.2 Heterogeneity of natural resource endowments
As China transitions from extensive to high-quality economic development, it poses significant challenges for resource-based cities. Against this backdrop, examining whether DE can bring about green development effects in resource-based cities, and how it influences “resource curse”, is crucial for the future development of these cities. According to the results presented in columns (3) and (4) (Table 9), the green impact of DE is not significant in resource-based cities, while it is relatively more pronounced in non-resource-based cities. This suggests that DE may exacerbate rather than alleviate “resource curse” in resource-based cities.
Resource-based cities typically focus their economies on heavy industries and are highly dependent on labor and natural resources inputs. This economic model exhibits significant shortcomings in technological advancement and resource allocation. In the pursuit of economic development, these regions often over-rely on natural resources, which limits economic diversification and hinders sustainable growth, thereby perpetuating the “resource curse”. However, DE emphasizes the importance of information technology and innovation. Therefore, its role in transforming the economic structure of resource-based cities is relatively limited, leading to its insignificant effect on GTFP. In contrast, non-resource-based cities rely more heavily on factors such as technology, human capital, and R&D investments, which help these cities to fully realize the potential of DE, significantly enhancing GTFP. The finding implies that the government should implement coordinated policy interventions in resource-based cities to ensure these cities fully leverage the dividends of DE and promote structural economic transformation.
5.7 Robustness tests
To further ascertain the analysis, several robustness tests are employed. These include using an alternative dependent variable, adding other control variables, shortening the time dimension, and employing the instrumental variable method to ensure the consistency of the results. The estimated results are shown in Table 10.
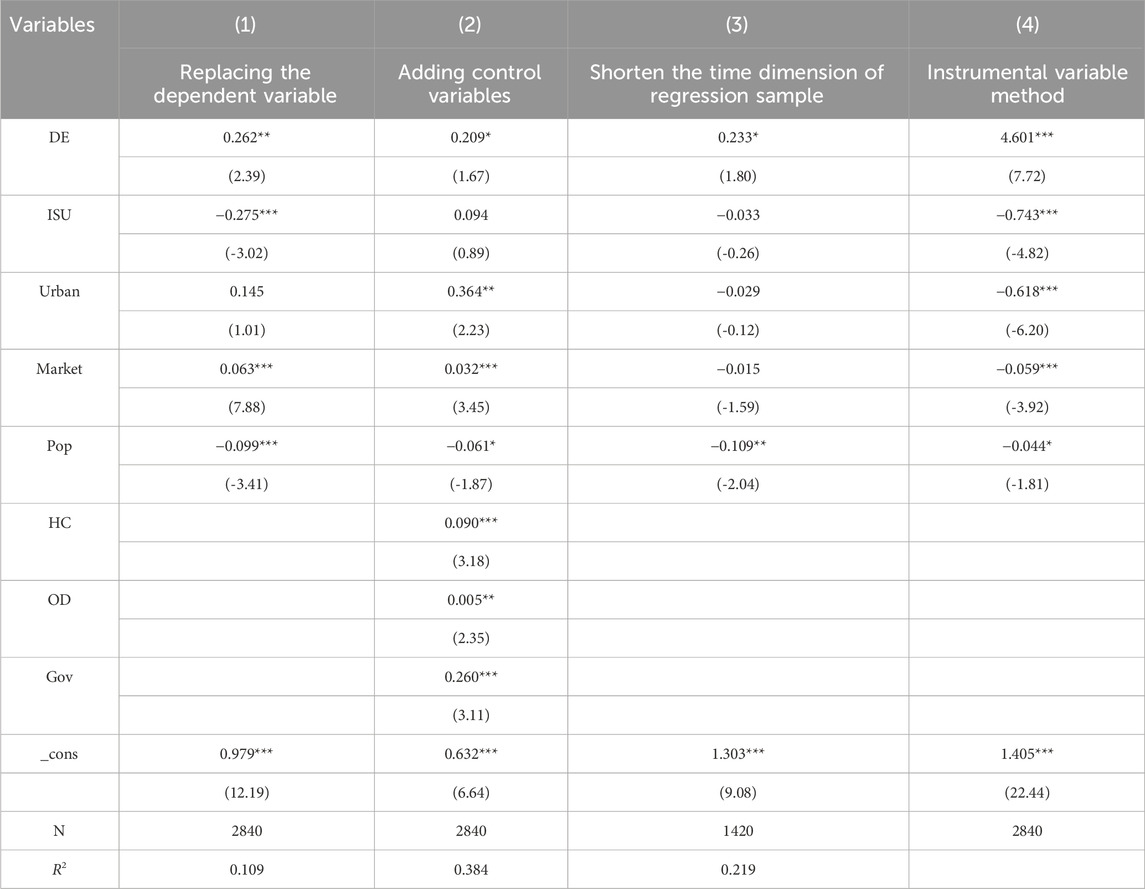
Table 10. Robustness tests.
5.7.1 Replacing the dependent variable
Given the potential variability in estimation results from different measurement approaches, this study re-measures GTFP by switching the energy consumption metric from standard electricity to standard coal. The recalculated GTFP was then used to re-estimate the equations. The findings, displayed in Column (1) (Table 10), indicate that DE continues to have a significant positive impact on the newly measured GTFP, consistent with our initial regression results.
5.7.2 Adding control variables
Omitting important control variables may introduce estimation biases into the model. To address this, the study builds upon the baseline model by further incorporating controls commonly used in previous studies for human capital, openness degree, and government intervention (Zhang et al., 2022b; Lyu et al., 2023; Zhao et al., 2023), denoted respectively by HC, OD, and Gov. The estimation results, displayed in Column (2) (Table 10), reveal that the addition of these control variables does not alter the significant positive effect of DE on GTFP. This finding reaffirms the core conclusions of this study.
5.7.3 Shortening the sampling period
5 September 2015 saw the issuance of a decree titled “Action Outline for Promoting the Development of Big Data” by the State Council of China, which carried out the national top-level design and overall deployment for the advancement of big data in China and clarified the development goals and tasks of DE. Since then, the development speed of DE has accelerated significantly. To test the robustness, this study reduces the sample time dimension of the empirical regression to 2016–2020 for the regression. From the regression outcomes in Table 10, column (3), it becomes evident that even after shortening the sample period, DE maintains its positive influence on GTFP, aligning with prior findings.
5.7.4 Treatment of endogenous problems
The above empirical analysis of DE and GTFP may have endogenous problems caused by two-way causality and missing variables. To further mitigate the potential bias in the regression results, this study seeks to identify instrumental variables for DE, effectively addressing potential endogeneity concerns. An effective instrumental variable must fulfill two fundamental requirements: first, relevance, which requires the instrument to be statistically significantly correlated with the endogenous explanatory variable; and second, exogeneity, meaning that the instrument should not directly affect the dependent variable except through its influence on the endogenous variable. Based on these criteria, this study selects government digital attention (GDA) as an instrumental variable.
The GDA is quantified using Python web scraping technology, which calculates the frequency of DE-related terms per thousand words in local government work reports. The specific construction method involves extracting texts from annual work reports for each region that pertain to DE. This frequency is calculated by dividing the count of DE-related words by the total word count of the respective government work report for that year. Specifically, this analysis targets keywords in the work reports from local governments at the prefecture level. If specific terms such as “big data”, “cloud computing”, “blockchain”, “artificial intelligence”, “network security”, “industrial Internet”, “digital agriculture”, “platform Internet”, and “digital government” are present, the text is classified accordingly. This study identified 121 such keywords and used Python for text analysis to compile the occurrences of relevant texts across different regions, utilizing this data as an indicator of GDA.
The Two-Stage Least Squares (2SLS) method is employed for estimation. The results, presented in Column (4) of Table 10, indicate that after accounting for endogeneity, the impact of DE on GTFP remains significantly positive. This finding is consistent with our initial results from the baseline regression, further confirming that DE has a significant promotional effect on GTFP.
6 Disscusion
6.1 Primary effect of DE on GTFP
This study analyzes data from Chinese cities, providing new evidence of the contributions of DE to GTFP. These findings align with the research results at various levels within China by Liu et al. (2022), An et al. (2024), Zhang et al. (2022b), and Han and Liu (2022), further demonstrating the pivotal role of DE in driving China’s green economic transformation. Moreover, the benefits of DE are not limited to China; cases in countries like Russia and Pakistan also confirm its global impact (Nizam et al., 2020; Savchenko and Borodina, 2020), underscoring the importance of digital development worldwide. Globally, economies are actively advancing strategies related to DE, such as the United States’ “Digital Strategy 2020–2024”, Germany’s “Digital Strategy 2025”, and China’s “Digital China” initiative, all aimed at leveraging DE for sustainable growth.
6.2 Indirect effect of DE on GTFP
DE impacts GTFP through various channels, notably through TI, industrial structure optimization, and capital allocation. TI, in particular, not only drives enterprises to develop and adopt new technologies and methods but also effectively enhances environmental protection and resource efficiency, thus accelerating green economic development. This study employs TI as a mediating variable, and empirical analysis reveals that DE significantly enhances TI, thereby promoting sustainable economic growth. These findings are consistent with those of Zhang et al. (2022b), using provincial-level data in China, and similar conclusions have been observed in studies from the United States, Germany, France, and Pakistan (Carlsson, 2004; Shah et al., 2024; Sun et al., 2024). This further highlights the effectiveness of DE in promoting sustainable development on a global scale.
6.3 Non-linear relationship between DE and GTFP
This study reveals a non-linear relationship between DE and GTFP. Specifically, the impact of DE on GTFP varies significantly across different levels of economic development, stages of digitalization, and intensities of environmental regulation. Empirical analysis indicates that the relationship between DE and GTFP starts insignificantly but becomes significantly positive later, especially in more economically developed regions. This pattern aligns with findings by Samimi et al. (2015), who observed that the positive effects of DE are less apparent in less economically developed countries, whereas in more developed countries, the effects are significantly enhanced. This implies that DE is intensifying developmental imbalances. Moreover, DE’s influence on GTFP is particularly notable in both its early and mature stages, with the strongest impact observed in the initial stages. This contrasts with the findings of Hao et al. (2023), who noted that the initial impact of DE on GTFP in the manufacturing sector was not significant, possibly due to unexpected outputs in early digital interventions. Additionally, the research found a positive correlation between the strictness of environmental regulations and the ability of DE to enhance GTFP, a relationship also highlighted in Shapiro and Walker’s (2018) study in the United States, demonstrating the key role of environmental regulations in fostering the synergy between digital technology and green production.
6.4 Spatial impact of DE on GTFP
In a vast country like China, where regional economic development and environmental impacts are closely interconnected, this study examined the spatial spillover effects of DE on GTFP. It was found that enhancements in DE could effectively improve GTFP in surrounding regions. This observation corresponds with the findings of Deng et al. (2022) from provincial-level data in China. Based on these insights, it is endorsed that government policies on regional development should emphasize and strengthen inter-regional cooperation, facilitating the sharing of resources, knowledge, and technology to foster the collective development of DE across regions.
6.5 Heterogeneous impacts of DE on GTFP
Through heterogeneity analysis conducted in big data pilot cities and non-pilot cities, it was found that the green effects of DE are more pronounced in big data pilot cities, corroborating the findings of Liu et al. (2024), which emphasize the role of governmental policy support in enhancing DE’s impact on green development. However, when comparing resource-based cities with non-resource-based cities, the study observed that the green effects of DE are more significant in non-resource-based cities, suggesting that resource-based cities face more severe developmental challenges in the context of DE. This result contrasts with the conclusions of Lyu et al. (2023), who argued that DE primarily addresses issues of single-industry structure, resource dependency, and path dependency in resource-based cities and has a more significant effect in these cities. Although the cities and time of Lyu et al. (2023) differ from this study, these differences are not sufficient to explain the divergence in findings, suggesting that further in-depth research is needed to provide a more comprehensive and detailed explanation.
7 Conclusion and policy implications
7.1 Research conclusion
Based on panel data spanning from 2011 to 2020 across 284 Chinese cities, this study first scientifically measures the DE and GTFP. Then, TWFE is employed to examine the direct influence of DE on GTFP and the mediating role of TI. Moreover, a threshold model is adopted to uncover the non-linear relationship between DE and GTFP, considering economic development, DE, and environmental regulation as threshold variables. Additionally, spatial spillover effects of DE on GTFP are analyzed using TWFE-SDM with an inverse distance square spatial weight matrix (W) to account for spatial interactions.
The following findings can be derived:
(1) DE exerts a significant positive direct effect, indirect effect, and spatial spillover effect on GTFP, signifying its growing role as a robust driver of GTFP. The indirect impact of DE on GTFP is predominantly facilitated through TI. Notably, DE has a more pronounced influence on GTFP in surrounding areas when contrasted with the local region; (2) DE’s impact on GTFP follows a distinct pattern. As DE advances, the impact is initially most pronounced, then gradually diminishes, and subsequently gradually rebounds; (3) DE exacerbates, rather than alleviates, the development divide. With the growth of economic development, DE’s impact on GTFP is initially quite limited, and then becomes significantly positive; (4) Strict environmental regulations can significantly stimulate the contribution of DE to GTFP, whereas when environmental regulations are relatively lax, the green benefits of DE may not be significantly evident; (5) Policy support plays a crucial role in fostering the flourishing DE, thereby promoting green growth; (6) DE exacerbates rather than alleviates the resource curse, as its contribution to GTFP in resource-rich regions is severely constrained.
7.2 Policy implications
Based on the aforementioned findings, this study derives the resulting policy considerations.
Given the significant positive impact of the DE on GTFP through direct, indirect, and spatial spillover effects, it is imperative for both governments and enterprises to increase investments in the digital technology sector, focusing particularly on TI, the development and application of green technologies, and the promotion of digital transformation across industries. In the face of potential funding constraints for enterprises in technology investments, governments can alleviate burdens by offering tax incentives, providing financial subsidies, or venture capital to incentivize capital flow towards green technologies. Furthermore, to maximize the contribution of DE to GTFP, it is essential to establish and enhance regulatory frameworks. This includes stringent environmental regulations alongside corresponding incentive measures to encourage the adoption and development of green technologies by enterprises. Considering the potential regulatory lag due to rapid advancements in digital technology, governments must create flexible and adaptive regulatory mechanisms to promote innovation while ensuring environmental protection and data security. Simultaneously, interdepartmental cooperation is crucial for expediting technology applications. Governments should encourage collaboration among government agencies, enterprises, and research institutions to drive TI and green development. To achieve this, governments can construct platforms and mechanisms for multi-stakeholder engagement, clarifying cooperation objectives and interest allocation to resolve potential conflicts among different departments and institutions.
As DE exacerbates disparities in regional development, particularly in economically underdeveloped or resource-based cities that receive limited benefits from advancements in DE, a structured approach is crucial to effectively leverage DE for enhancing GTFP and mitigating these disparities. First, the government should implement targeted support policies for economically underdeveloped and resource-based cities. In economically underdeveloped regions facing severe financial constraints, the government can establish a dedicated fund to provide targeted financial support for DE projects, while also attracting private investment by improving infrastructure and streamlining approval processes. Simultaneously, in resource-based cities, there should be a push for technological upgrades and industrial transformation, with increased investment in key technologies such as smart manufacturing and digital management to reduce dependence on traditional resources. In addition, to address talent shortages in these areas, the government should establish digital skills training centers that offer educational resources aligned with local needs, and attract and retain talent through favorable policies. Lastly, by establishing a cross-regional digital cooperation platform, the government can enhance the sharing of technology and knowledge, promote collaborative development between regions, and thereby improve the overall competitiveness and sustainability of the area.
8 Future research directions
Regarding the exploration of the relationship between DE and green sustainable development, future research should focus on several key areas to deepen understanding. First, assessing the role and potential impacts—both positive and negative—of emerging technologies like Artificial Intelligence and Blockchain on DE evolution, productivity, and economic growth is essential. Such examination will reveal opportunities and challenges within technological advancement, fostering sustainable economic growth. Furthermore, integrating DE with environmental sustainability and exploring how digital technologies support green energy utilization, circular economy models, and environmental protection will provide crucial insights into aligning technological progress with sustainable development goals. Ultimately, evaluating the effectiveness of policies in leveraging DE to boost environmental sustainability is paramount for guiding future policy decisions.
Data availability statement
The raw data supporting the conclusion of this article will be made available by the authors, without undue reservation.
Author contributions
WL: Writing–original draft, Writing–review and editing. NN: Writing–review and editing. NM: Writing–review and editing.
Funding
The author(s) declare that financial support was received for the research, authorship, and/or publication of this article. This work was supported in part by the Key R&D and Promotion Special Project (Soft Science Research) in Henan Province (grant no. 232400410145) and Philosophy and Social Science Planning Annual Project in Henan Province (grant no.2023BJJ038).
Conflict of interest
The authors declare that the research was conducted in the absence of any commercial or financial relationships that could be construed as a potential conflict of interest.
Publisher’s note
All claims expressed in this article are solely those of the authors and do not necessarily represent those of their affiliated organizations, or those of the publisher, the editors and the reviewers. Any product that may be evaluated in this article, or claim that may be made by its manufacturer, is not guaranteed or endorsed by the publisher.
References
An, Q., Wang, R., Wang, Y., and Pavel, K. (2024). The impact of the digital economy on sustainable development: evidence from China. Front. Environ. Sci. 12, 1341471. doi:10.3389/fenvs.2024.1341471
Appiah-Otoo, I., and Song, N. (2021). The impact of ICT on economic growth-comparing rich and poor countries. Telecommun. Policy 45 (2), 102082. doi:10.1016/j.telpol.2020.102082
Bai, F., Huang, Y., Shang, M., and Ahmad, M. (2022). Modeling the impact of digital economy on urban environmental pollution: empirical evidence from 277 prefecture-level cities in China. Front. Environ. Sci. 10, 991022. doi:10.3389/fenvs.2022.991022
Carlsson, B. (2004). The Digital Economy: what is new and what is not? Struct. Change Econ. Dyn. 15 (3), 245–264. doi:10.1016/j.strueco.2004.02.001
Che, S., and Wang, J. (2022). Digital economy development and haze pollution: evidence from China. Environ. Sci. Pollut. Res. 29 (48), 73210–73226. doi:10.1007/s11356-022-20957-w
Chen, W., Du, X., Lan, W., Wu, W., and Zhao, M. (2023). How can digital economy development empower high-quality economic development? Technol. Econ. Dev. Econ. 29 (4), 1168–1194. doi:10.3846/tede.2023.18784
Choi, C., and Hoon Yi, M. (2009). The effect of the internet on economic growth: evidence from cross-country panel data. Econ. Lett. 105 (1), 39–41. doi:10.1016/j.econlet.2009.03.028
Choi, Y., Zhang, N., and Zhou, P. (2012). Efficiency and abatement costs of energy-related CO2 emissions in China: a slacks-based efficiency measure. Appl. Energy 98, 198–208. doi:10.1016/j.apenergy.2012.03.024
Coyne, B., and Denny, E. (2021). Applying a model of technology diffusion to quantify the potential benefit of improved energy efficiency in data centres. Energies 14 (22), 7699. doi:10.3390/en14227699
Cui, L., Hou, Y., Liu, Y., and Zhang, L. (2021). Text mining to explore the influencing factors of sharing economy driven digital platforms to promote social and economic development. Inf. Technol. Dev. 27 (4), 779–801. doi:10.1080/02681102.2020.1815636
Danish Khan, N., Baloch, M. A., Saud, S., and Fatima, T. (2018). The effect of ICT on CO2 emissions in emerging economies: does the level of income matters? Environ. Sci. Pollut. Res. 25, 22850–22860. doi:10.1007/s11356-018-2379-2
Deng, H., Bai, G., Shen, Z., and Xia, L. (2022). Digital economy and its spatial effect on green productivity gains in manufacturing: evidence from China. J. Clean. Prod. 378, 134539. doi:10.1016/j.jclepro.2022.134539
Dexeus, C. R. (2018) The deepening effects of the digital revolution. Cham: Switzerland: Springer, 43–69.
Dian, J., Song, T., and Li, S. (2024). Facilitating or inhibiting? Spatial effects of the digital economy affecting urban green technology innovation. Energy Econ. 129, 107223. doi:10.1016/j.eneco.2023.107223
Ding, C., Liu, C., Zheng, C., and Li, F. (2022). Digital economy, technological innovation and high-quality economic development: based on spatial effect and mediation effect. Sustainability 14 (1), 216. doi:10.3390/su14010216
Dong, F., Hu, M., Gao, Y., Liu, Y., Zhu, J., and Pan, Y. (2022). How does digital economy affect carbon emissions? Evidence from global 60 countries. Sci. Total Environ. 852, 158401. doi:10.1016/j.scitotenv.2022.158401
Edquist, H., and Henrekson, M. (2017). Swedish lessons: how important are ICT and R&D to economic growth? Struct. Change Econ. Dyn. 42, 1–12. doi:10.1016/j.strueco.2017.05.004
Elhorst, J. P. (2012). Matlab software for spatial panels. Int. Reg. Sci. Rev. 37 (3), 389–405. doi:10.1177/0160017612452429
Erumban, A. A., and Das, D. K. (2016). Information and communication technology and economic growth in India. Telecommun. Policy 40 (5), 412–431. doi:10.1016/j.telpol.2015.08.006
Gaziz, S., Oteshova, A., Prodanova, N., Savina, N., and Bokov, D. O. (2020). Digital economy and its role in the process of economic development. J. Secur. Sustain. Iss. 9 (4), 1225–1235. doi:10.9770/jssi.2020.9.4(9)
Goldfarb, A., and Tucker, C. (2019). Digital economics. J. Econ. Lit. 57 (1), 3–43. doi:10.1257/jel.20171452
Hampton, S. E., Strasser, C. A., Tewksbury, J. J., Gram, W. K., Budden, A. E., Batcheller, A. L., et al. (2013). Big data and the future of ecology. Front. Ecol. Environ. 11 (3), 156–162. doi:10.1890/120103
Han, D., and Liu, M. (2022). How does the digital economy contribute to regional green development in China? Evidence-based on the intermediary effect of technological innovation. Sustainability 14 (18), 11147. doi:10.3390/su141811147
Hansen, B. E. (1999). Threshold effects in non-dynamic panels: estimation, testing, and inference. J. Econom. 93, 345–368. doi:10.1016/S0304-4076(99)00025-1
Hansen, B. E. (2000). Sample splitting and threshold estimation. Econometrica 68 (3), 575–603. doi:10.1111/1468-0262.00124
Hao, X., Wang, X., Wu, H., and Hao, Y. (2023). Path to sustainable development: does digital economy matter in manufacturing green total factor productivity? Sustain. Dev. 31 (1), 360–378. doi:10.1002/sd.2397
Hao, X., Wen, S., Li, Y., Xu, Y., and Xue, Y. (2022). Can the digital economy development curb carbon emissions? Evidence from China. Front. Psychol. 13, 938918. doi:10.3389/fpsyg.2022.938918
Hasan, I., and Tucci, C. L. (2010). The innovation–economic growth nexus: global evidence. Res. Policy 39 (10), 1264–1276. doi:10.1016/j.respol.2010.07.005
Huang, L., and Lei, Z. (2021). How environmental regulation affect corporate green investment: evidence from China. J. Clean. Prod. 279, 123560. doi:10.1016/j.jclepro.2020.123560
Huang, S., Han, F., and Chen, L. (2023). Can the digital economy promote the upgrading of urban environmental quality? Int. J. Environ. Res. Public Health 20 (3), 2243. doi:10.3390/ijerph20032243
Irfan, M., Ahmad, M., Fareed, Z., Iqbal, N., Sharif, A., and Wu, H. (2022). On the indirect environmental outcomes of COVID-19: short-term revival with futuristic long-term implications. Int. J. Environ. Health Res. 32, 1271–1281. doi:10.1080/09603123.2021.1874888
Ishida, H. (2015). The effect of ICT development on economic growth and energy consumption in Japan. Telemat. Inf. 32 (1), 79–88. doi:10.1016/j.tele.2014.04.003
Jiang, H., Jiang, P., Wang, D., and Wu, J. (2021). Can smart city construction facilitate green total factor productivity? A quasi-natural experiment based on China’s pilot smart city. Sust. Cities Soc. 69, 102809. doi:10.1016/j.scs.2021.102809
Jorgenson, D. W., and Vu, K. M. (2011). The rise of developing Asia and the new economic order. J. Policy Model. 33 (5), 698–716. doi:10.1016/j.jpolmod.2011.06.004
Jung, S., Lee, J., Hwang, W., and Yeo, Y. (2017). Growth versus equity: a CGE analysis for effects of factor-biased technical progress on economic growth and employment. Econ. Model. 60, 424–438. doi:10.1016/j.econmod.2016.10.014
Kinelski, G. (2020). The main factors of successful project management in the aspect of energy enterprises’ efficiency in the digital economy environment. Polityka Energetyczna – Energy Policy J. 23 (3), 5–20. doi:10.33223/epj/126435
Krugman, P. (1991). Increasing returns and economic geography. J. Polit. Econ. 99 (3), 483–499. doi:10.1086/261763
Lange, S., Pohl, J., and Santarius, T. (2020). Digitalization and energy consumption. Does ICT reduce energy demand? Ecol. Econ. 176, 106760. doi:10.1016/j.ecolecon.2020.106760
Lazović, V., Jovović, M., Backović, T., Djuričković, T., and Rondović, B. (2022). Is digital economy a good Samaritan to developing countries? Sustainability 14 (14), 8471. doi:10.3390/su14148471
LeSage, J., and Pace, R. K. (2009) Introduction to spatial econometrics. Boca Raton, FL, USA: CRC Press.
Levaschova, O. V., and Morgacheva, N. V. (2020). Environmental supervision (control) in the area of new technology appliance. IOP Conf. Ser. Earth Environ. Sci. 421 (6), 062004. doi:10.1088/1755-1315/421/6/062004
Li, G., Zhou, X., and Bao, Z. (2022a). A win–win opportunity: the industrial pollution reduction effect of digital economy development—a quasi-natural experiment based on the “broadband China” strategy. Sustainability 14 (9), 5583. doi:10.3390/su14095583
Li, J., Chen, L., Chen, Y., and He, J. (2022b). Digital economy, technological innovation, and green economic efficiency—empirical evidence from 277 cities in China. Manag. Decis. Econ. 43 (3), 616–629. doi:10.1002/mde.3406
Li, R., Wang, Q., Li, L., and Hu, S. (2023). Do natural resource rent and corruption governance reshape the environmental Kuznets curve for ecological footprint? Evidence from 158 countries. Resour. Policy 85, 103890. doi:10.1016/j.resourpol.2023.103890
Li, Z., Li, N., and Wen, H. (2021). Digital economy and environmental quality: evidence from 217 cities in China. Sustainability 13 (14), 8058. doi:10.3390/su13148058
Li, Z., and Wang, J. (2022). The dynamic impact of digital economy on carbon emission reduction: evidence city-level empirical data in China. J. Clean. Prod. 351, 131570. doi:10.1016/j.jclepro.2022.131570
Lincaru, C., Pîrciog, S., Grigorescu, A., Tudose, G., and Tvaronavičienė, M. (2018). Low-low (LL) high human capital clusters in public administration employment-predictor for digital infrastructure public investment priority-Romania case study. Entrep. Sustain. Iss. 6 (2), 729–753. doi:10.9770/jesi.2018.6.2(18)
Liu, J., Chang, H., Forrest, J. Y., and Yang, B. (2020a). Influence of artificial intelligence on technological innovation: evidence from the panel data of China’s manufacturing sectors. Technol. Forecast. Soc. Chang. 158, 120142. doi:10.1016/j.techfore.2020.120142
Liu, Y., Xie, Y., and Zhong, K. (2024). Impact of digital economy on urban sustainable development: evidence from Chinese cities. Sustain. Dev. 32 (1), 307–324. doi:10.1002/sd.2656
Liu, Y., Yang, Y., Li, H., and Zhong, K. (2022). Digital economy development, industrial structure upgrading and green total factor productivity: empirical evidence from China’s cities. Int. J. Env. Res. Pub. He. 19 (4), 2414. doi:10.3390/ijerph19042414
Liu, Y., Zhu, J., Li, E. Y., Meng, Z., and Song, Y. (2020b). Environmental regulation, green technological innovation, and eco-efficiency: the case of Yangtze river economic belt in China. Technol. Forecast. Soc. Chang. 155, 119993. doi:10.1016/j.techfore.2020.119993
Luo, R., and Zhou, N. (2022). Dynamic evolution, spatial differences, and driving factors of China’s provincial digital economy. Sustainability 14 (15), 9376. doi:10.3390/su14159376
Lyu, Y., Wang, W., Wu, Y., and Zhang, J. (2023). How does digital economy affect green total factor productivity? Evidence from. China. Sci. Total Environ. 857, 159428. doi:10.1016/j.scitotenv.2022.159428
Lyu, Y., Xiao, X., and Zhang, J. (2024). Does the digital economy enhance green total factor productivity in China? The evidence from a national big data comprehensive pilot zone. Struct. Change Econ. Dyn. 69, 183–196. doi:10.1016/j.strueco.2023.12.009
Ma, D., and Zhu, Q. (2022). Innovation in emerging economies: research on the digital economy driving high-quality green development. J. Bus. Res. 145, 801–813. doi:10.1016/j.jbusres.2022.03.041
Ma, Q., Khan, Z., Tariq, M., Işik, H., and Rjoub, H. (2022a). Sustainable digital economy and trade adjusted carbon emissions: evidence from China’s provincial data. Econ. Res.-Ekon. Istraz. 35 (1), 5469–5485. doi:10.1080/1331677X.2022.2028179
Ma, Q., Mentel, G., Zhao, X., Salahodjaev, R., and Kuldasheva, Z. (2022b). Natural resources tax volatility and economic performance: evaluating the role of digital economy. Resour. Policy 75, 102510. doi:10.1016/j.resourpol.2021.102510
Matkovskaya, Y. S., Ekimova, K. V., and Kuznetsov, N. V. (2022). The influence of the digital economy on the quality of the region’s development and on solving the problems of uneven regional development. Int. J. Qual. Res. 16 (2), 395–416. doi:10.24874/IJQR16.02-05
Meng, F., and Zhao, Y. (2022). How does digital economy affect green total factor productivity at the industry level in China: from a perspective of global value chain. Environ. Sci. Pollut. Res. 29 (52), 79497–79515. doi:10.1007/s11356-022-21434-0
Mgadmi, N., Moussa, W., Béjaoui, A., Sadraoui, T., and Guachaoui, A. (2021). Revisiting the nexus between digital economy and economic prosperity: evidence from a comparative analysis. J. Telecommun. Digit. Econ. 9 (2), 69–90. doi:10.18080/jtde.v9n2.384
Murthy, K. V. B., Kalsie, A., and Shankar, R. (2021). Digital economy in a global perspective: is there a digital divide? Transnatl. Corp. Rev. 13 (1), 1–15. doi:10.1080/19186444.2020.1871257
Niebel, T. (2018). ICT and economic growth–comparing developing, emerging and developed countries. World Dev. 104, 197–211. doi:10.1016/j.worlddev.2017.11.024
Nizam, H. A., Zaman, K., Khan, K. B., Batool, R., Khurshid, M. A., Shoukry, A. M., et al. (2020). Achieving environmental sustainability through information technology: “Digital Pakistan” initiative for green development. Environ. Sci. Pollut. Res. 27 (8), 10011–10026. doi:10.1007/s11356-020-07683-x
Ren, S., Hao, Y., Xu, L., Wu, H., and Ba, N. (2021). Digitalization and energy: how does internet development affect China’s energy consumption? Energy Econ. 98, 105220. doi:10.1016/j.eneco.2021.105220
Sadorsky, P. (2013). Do urbanization and industrialization affect energy intensity in developing countries? Energy Econ. 37, 52–59. doi:10.1016/j.eneco.2013.01.009
Samimi, A. J., Ledary, R. B., and Samimi, M. H. J. (2015). ICT and economic growth: a comparison between developed and developing countries. Int. J. Life Sci. Eng. 1 (1), 26–32.
Savchenko, A. B., and Borodina, T. L. (2020). Green and digital economy for sustainable development of urban areas. Reg. Res. Russ. 10, 583–592. doi:10.1134/S2079970520040097
Sergushina, E., Leontyev, D., Kozhukalova, O., Dambayeva, I., and Bekhorashvili, N. (2021). Digital economy as a factor in increasing the competitiveness of countries and industries: a quantitative analysis. Econ. Ann.-ХХI 188 (3-4), 69–76. doi:10.21003/ea.V188-08
Shah, N., Zehri, A. W., Saraih, U. N., Abdelwahed, N. A. A., and Soomro, B. A. (2024). The role of digital technology and digital innovation towards firm performance in a digital economy. Kybernetes 53 (2), 620–644. doi:10.1108/K-01-2023-0124
Shahiduzzaman, M., and Alam, K. (2014). Information technology and its changing roles to economic growth and productivity in Australia. Telecommun. Policy 38 (2), 125–135. doi:10.1016/j.telpol.2013.07.003
Shapiro, J. S., and Walker, R. (2018). Why is pollution from US manufacturing declining? The roles of environmental regulation, productivity, and trade. Am. Econ. Rev. 108 (12), 3814–3854. doi:10.1257/aer.20151272
Song, M., Zheng, C., and Wang, J. (2021). The role of digital economy in China’s sustainable development in a post-pandemic environment. J. Enterp. Inf. Manag. 35 (1), 58–77. doi:10.1108/JEIM-03-2021-0153
Sorescu, A., and Schreier, M. (2021). Innovation in the digital economy: a broader view of its scope, antecedents, and consequences. J. Acad. Mark. Sci. 49 (4), 627–631. doi:10.1007/s11747-021-00793-z
Sun, C., Khan, A., Xue, J., and Huang, X. (2024). Are digital economy and financial structure driving renewable energy technology innovations: a major eight countries perspective. Appl. Energy 362, 122990. doi:10.1016/j.apenergy.2024.122990
Takase, K., and Murota, Y. (2004). The impact of IT investment on energy: Japan and US comparison in 2010. Energy Policy 32 (11), 1291–1301. doi:10.1016/S0301-4215(03)00097-1
Tan, L., Yang, Z., Irfan, M., Ding, C. J., Hu, M., and Hu, J. (2024). Toward low-carbon sustainable development: exploring the impact of digital economy development and industrial restructuring. Bus. Strat. Environ. 33 (3), 2159–2172. doi:10.1002/bse.3584
Tang, J., and Qin, F. (2022). Analyzing the impact of local government competition on green total factor productivity from the factor market distortion perspective: based on the three stage DEA model. Environ. Dev. Sustain. 24 (12), 14298–14326. doi:10.1007/s10668-021-02032-5
Thompson, S. B. (2011). Simple formulas for standard errors that cluster by both firm and time. J. Financ. Econ. 99 (1), 1–10. doi:10.1016/j.jfineco.2010.08.016
Vu, K. M. (2013). Information and communication technology (ICT) and Singapore’s economic growth. Inf. Econ. Policy 25 (4), 284–300. doi:10.1016/j.infoecopol.2013.08.002
Wang, B., Yu, L., and Yang, Y. (2013). Measuring and decomposing energy productivity of China’s industries under carbon emission constraints. J. Financ. Res. (10), 128–141.
Wang, H., and Cheng, Y. (2024). Impact of the digital economy on total factor energy efficiency: evidence from 268 Chinese cities. Environ. Sci. Pollut. Res. 31 (2), 2960–2975. doi:10.1007/s11356-023-31356-0
Wang, J., Luo, X., and Zhu, J. (2022). Does the digital economy contribute to carbon emissions reduction? A city-level spatial analysis in China. China. J. Popul. Resour. Environ. 20 (2), 105–114. doi:10.1016/j.cjpre.2022.06.001
Wang, Q., Wang, X., Li, R., and Jiang, X. (2024). Reinvestigating the environmental Kuznets curve (EKC) of carbon emissions and ecological footprint in 147 countries: a matter of trade protectionism. Hum. Soc. Sci. Commun. 11, 117–160. doi:10.1057/s41599-024-02639-9
Wielgos, D. M., Homburg, C., and Kuehnl, C. (2021). Digital business capability: its impact on firm and customer performance. J. Acad. Mark. Sci. 49 (4), 762–789. doi:10.1007/s11747-021-00771-5
Winskel, M., and Kattirtzi, M. (2020). Transitions, disruptions and revolutions: expert views on prospects for a smart and local energy revolution in the UK. Energy Policy 147, 111815. doi:10.1016/j.enpol.2020.111815
Wu, H., Hao, Y., and Ren, S. (2020). How do environmental regulation and environmental decentralization affect green total factor energy efficiency: evidence from China. Energy Econ. 91, 104880. doi:10.1016/j.eneco.2020.104880
Wu, H., Hao, Y., Ren, S., Yang, X., and Xie, G. (2021). Does internet development improve green total factor energy efficiency? Evidence from China. Energy Policy 153, 112247. doi:10.1016/j.enpol.2021.112247
Wu, H. X., and Yu, C. (2022). The impact of the digital economy on China’s economic growth and productivity performance. China Econ. J. 15 (2), 153–170. doi:10.1080/17538963.2022.2067689
Xu, L., and Tan, J. (2020). Financial development, industrial structure and natural resource utilization efficiency in China. Resour. Policy 66, 101642. doi:10.1016/j.resourpol.2020.101642
Xu, S., Yang, C., Huang, Z., and Failler, P. (2022). Interaction between digital economy and environmental pollution: new evidence from a spatial perspective. Int. J. Env. Res. Pub. He. 19 (9), 5074. doi:10.3390/ijerph19095074
Yang, L., and Shi, L. (2021). The research on the development of industrial agglomeration of digital economy along the belt and road. China Bus. Mark. 35, 54–67. doi:10.14089/j.cnki.cn11-3664/f.2021.03.006
Yang, X., Wu, H., Ren, S., Ran, Q., and Zhang, J. (2021). Does the development of the internet contribute to air pollution control in China? Mechanism discussion and empirical test. Struct. Change Econ. Dyn. 56, 207–224. doi:10.1016/j.strueco.2020.12.001
Yi, M., Liu, Y., Sheng, M. S., and Wen, L. (2022). Effects of digital economy on carbon emission reduction: new evidence from China. Energy Policy 171, 113271. doi:10.1016/j.enpol.2022.113271
Yousefi, A. (2011). The impact of information and communication technology on economic growth: evidence from developed and developing countries. Econ. Innov. New Technol. 20 (6), 581–596. doi:10.1080/10438599.2010.544470
Yu, Z., Liu, S., and Zhu, Z. (2022). Has the digital economy reduced carbon emissions? analysis based on panel data of 278 cities in China. Int. J. Env. Res. Pub. He. 19 (18), 11814. doi:10.3390/ijerph191811814
Zhang, J., Zhao, W., Cheng, B., Li, A., Wang, Y., Yang, N., et al. (2022c). The impact of digital economy on the economic growth and the development strategies in the post-COVID-19 era: evidence from countries along the “belt and road”. Front. Public Health 10, 856142. doi:10.3389/fpubh.2022.856142
Zhang, L., Mu, R., Zhan, Y., Yu, J., Liu, L., et al. (2022a). Digital economy, energy efficiency, and carbon emissions: evidence from provincial panel data in China. Sci. Total Environ. 852, 158403. doi:10.1016/j.scitotenv.2022.158403
Zhang, S., Ma, X., and Cui, Q. (2021). Assessing the impact of the digital economy on green total factor energy efficiency in the post-covid-19 era. Front. Energy Res. 9. doi:10.3389/fenrg.2021.798922
Zhang, Z., Fu, W. K., and Ma, L. (2022b). The impact of digital economy on green development in China. Front. Environ. Sci. 10. doi:10.3389/fenvs.2022.991278
Zhao, S., Peng, D., Wen, H., and Wu, Y. (2023). Nonlinear and spatial spillover effects of the digital economy on green total factor energy efficiency: evidence from 281 cities in China. Environ. Sci. Pollut. Res. 30 (34), 81896–81916. doi:10.1007/s11356-022-22694-6
Zhao, T., Zhang, Z., and Liang, S. (2020). Digital economy, entrepreneurship, and high-quality economic development: empirical evidence from urban China. J. Manag. World 36 (10), 65–76. doi:10.19744/j.cnki.11-1235/f.2020.0154
Zhao, W. (2022). Digital economy and green total factor productivity: impact mechanism and threshold effect. China Bus. Mark. 36 (11), 15–26. doi:10.14089/j.cnki.cn11-3664/f.2022.11.002
Keywords: digital economy, green total factor productivity, two-way fixed effect model, intermediary effect model, threshold regression model, spatial Durbin model
Citation: Liu W, Naseem NAM and Mazlan NS (2024) Research on the impact of digital economy on green total factor productivity: theoretical mechanism and multidimensional empirical analysis. Front. Environ. Sci. 12:1383764. doi: 10.3389/fenvs.2024.1383764
Received: 08 February 2024; Accepted: 07 May 2024;
Published: 21 May 2024.
Edited by:
Mahmood Ahmad, Shandong University of Technology, ChinaCopyright © 2024 Liu, Naseem and Mazlan. This is an open-access article distributed under the terms of the Creative Commons Attribution License (CC BY). The use, distribution or reproduction in other forums is permitted, provided the original author(s) and the copyright owner(s) are credited and that the original publication in this journal is cited, in accordance with accepted academic practice. No use, distribution or reproduction is permitted which does not comply with these terms.
*Correspondence: N. A. M. Naseem, naseemniaz@upm.edu.my