Non-target screening to track contaminant removal and release during nature-based water treatment
 Charlotte Guy
 Geoffroy Duporté
 Linda Luquot
 Elena Gomez
- 1HydroSciences Montpellier, University of Montpellier, CNRS, IRD, Montpellier, France
- 2Geosciences Montpellier, University of Montpellier, CNRS, Montpellier, France
Introduction: Population growth and increasing water demand have exacerbated water resource scarcity. Treated wastewater (TWW) is a valuable alternative resource, but its complex composition, including micropollutants, raises concerns about reuse risks. Reactive barriers (RB) made with natural materials offer a solution to remove TWW contaminants. Evaluating RB process effectiveness and comprehending contaminant fate remain challenging. Recent advances in High-Resolution Mass Spectrometry (HRMS) and non-target analysis (NTA) provide an opportunity to identify contaminants and evaluate RB processes. The study aims to develop an NTA approach to assess RB effectiveness and understand the NTA contribution for broadening perspectives on the impact of reactive barrier treatment.
Methods: In a serie of batch experiments, TWW was mixed with a RB under two conditions: TWW in contact with RB (TWW+RB) and TWW alone (TWW). After 1 h of contact, samples were extracted and analyzed using HPLC-HRMS. NTA workflow and statistical comparison between the two sample conditions were applied for data treatment. Additionally, a quantitative method was applied to 28 pharmaceutical residues. Sorption (%) was calculated by comparing concentrations in TWW+RB and TWW experiments. NTA’s applicability for sorption estimation was investigated using intensities from differential analysis.
Results: Differential analysis shows significant differences in compounds that decrease or increase after contact with BR. A prioritization workflow identified and annotated 115 compounds. Natural products predominantly increased after RB contact, while compounds exhibited a significant 75% decrease in peak area are mainly pharmaceuticals. Notably, 61% of these molecules were sorbed at more than 50%. The sorption of emerging contaminants (ECs) estimated by NTA correlated satisfactorily with sorption quantified through target analysis, although caution regarding the matrix effect is necessary.
Discussion: NTA provides a comprehensive view of RB treatment performance, giving information on the compounds released by the barrier and its sorption capacity. NTA emphasizes the benefits of RB treatment while highlighting the need to study compounds reloaded by RB. It is a powerful tool for understanding the advantages of nature-based reactive barrier treatment in improving the quality of TWW.
1 Introduction
Population growth, rising water demand, urbanization, and climate change lead to scarcity of water resources. Confronting this issue requires finding alternative resources. Treated wastewater (TWW) is a valuable resource that can be reclaimed for a variety of purposes, including irrigation, industrial processes, and groundwater recharge (Jana et al., 2018; Radingoana et al., 2020; Tokay Yilmaz et al., 2023). Agricultural reuse benefits from wastewater nutrients and organic matter whenever significantly affects soil texture properties, biomass, and microbiota (Pedrero et al., 2010; Hoogendijk et al., 2023); industrial reuse protects water resources by limiting freshwater consumption but needs advanced treatment to improve water quality (Arabzadeh et al., 2023); groundwater recharge prevents aquifers depletion and over-exploitation (Verma et al., 2023) but is recognized to modify water quality (Bekele et al., 2011). The advantages and drawbacks related to the reuse of TWW are linked to its composition. TWW is a complex and variable mixture, depending on the source and the treatment processes used, that contains a wide range of compounds, including nutrients, organic matter, microorganisms, pathogens, and micropollutants. These micropollutants, including pharmaceuticals, pesticides and personal care products, have been detected in TWW all over the world (Adeleye et al., 2022). The presence of such compounds in the aquatic system are recognized to impact both environment and human health, even at very low concentrations (Carter et al., 2019; Shahriar et al., 2021). The presence of these contaminants in TWW raises concerns regarding the risks associated with their reuse and motivate the consideration of additional treatments to improve the water quality before its reuse.
Among the tertiary treatments, nature-based reactive barrier (RB) made with natural materials such as compost, clay, sand, and other natural materials, have demonstrated effectiveness in removing contaminants from TWW (Blum et al., 2019; Valhondo et al., 2020a; Patel et al., 2021). Valhondo et al. (2020b) also demonstrated a significant reduction in pathogens (including total coliforms and Escherichia coli.) by 2.5 to 5 log units in TWW following RB treatment. Additionally, Perez-Mercado et al. (2019) showed a reduction in pathogens using biochar filters. The composition of the reactive barrier must be carefully selected based on specific economic and environmental criteria, such as price, accessibility, and proximity. However, the mechanisms of contaminant removal are complex (sorption, transformation, biodegradation), and the potential for release of previously unidentified contaminants and transformation products (TPs) during the treatment process remains a concern. The diverse composition of TWW and the wide diversity of materials available for constructing reactive barriers present a significant challenge in understanding the fate of contaminants for evaluating the effectiveness of RB processes and to identify the fate of contaminants within them.
Traditionally, studies have focused on using High Resolution Mass Spectrometry (HRMS) targeted analyses (Valhondo et al., 2020b; Lei et al., 2023). However, for a universal assessment of the impact of RB treatment on TWW a more holistic approach is necessary. Suspect screening (SSA) and non-target analysis (NTA) have been developed to assess the presence of all the compounds of a sample (Sobus et al., 2018). NTA has emerged as a powerful analytical tool, widely recognized for its effectiveness in identifying contaminants in various applications (Kunzelmann et al., 2018; Hollender et al., 2019), including environmental monitoring and contaminant identification. NTA has also been used for other TWW treatments (Hollender et al., 2023), to assess for example to the transformation products formation in ozonation processes (Gulde et al., 2021; Alharbi et al., 2022) or advanced oxidation processes (AOP) (Tisler et al., 2022). However, the sample preparation restricts the detection of certain compounds. To minimize the occurrence of false negatives, the extraction of wastewater samples using Oasis HLB cartridges has already been demonstrated their effectiveness for the detection of a wide variety of emerging contaminants (ECs) and TPs (Wang et al., 2020). NTA can be use in different way depending of the application. Widely used in metabolomics applications, the differential approach enables two conditions to be compared in pairs and could be very useful for wastewater applications. In fact, differential approach was already use for the identification of TPs in water treatment by Negreira et al. (2015). The differential approach, by comparing fingerprints, will highlight the compounds that are impacted by RB.
This study represents a pioneering effort, representing the first-time application of NTA to enhance our understanding of RB processes and their environmental implications. The aim of the study is to better understand NTA contribution for broadening perspectives on the impact of reactive barrier treatment on the quality of reclaimed water treated with nature-based materials in regard to ECs and to evaluate the effectiveness of RB by considering substances that are either reduced or released during treatment. For this purpose, a non-target analysis using differential approach was developed and applied to batch experiments of TWW in contact with nature-based materials. The NTA was used to identify and annotate compounds differentiated by the differential approach. The identification of such compounds has allowed the evaluation of reactive barrier effects. Target analysis of 28 pharmaceuticals was done for confirmation purposes and evaluation of the applicability of NTA for sorption estimation. Finally, the matrix effect was estimated.
2 Materials and methods
2.1 Chemicals and materials
Methanol (MeOH), acetonitrile (ACN), and water (HPLC grade) were purchased from Sigma-Aldrich (St. Louis, MO, USA), as well as the formic acid (>98% purity). Distilled water was obtained by a Simplicity® Water Purification System associated with an LC-Pak® Polisher and a Millipak® Express 20 filter (0.22 μm) from Merck Millipore (Bedford, MA, USA). The list of analytical standards, including the internal standards (IS) are listed in Supplementary Table S1. Stock standard solutions of individual compounds were prepared at a concentration of 1 mg/mL in methanol (MeOH) and stored at −20°C. A mix of ISs at 1 ppm was prepared by mixing appropriate aliquots of each standard stock solution in MeOH. TWW samples were filtered through PTFE filters (wwPTFE 0.45 µm 47 MM Disc 50/K) purchased from Pall Corporation (Ann Arbor, MI, USA). Reconstituted extracts were filtered through PTFE filters (Chromafil® Xtra H-PTFE 0.2 µm 13 mm) purchased from Macherey-Nagel (Düren, Germany). SPE cartridges (Oasis HLB, 6 cc 500 mg) were purchased from Waters (Milford, MA, USA).
2.2 Experimental design
Experiments were performed to investigate the evolution of TWW quality in contact with a reactive barrier containing nature-based materials (NBM). For simplification, the term reactive barrier (RB) will be use in this article to refer to the mix of NBM.
A mix of NBM already selected for managed aquifer recharge was performed to constitute our reactive barrier (RB) (50% sand, 30% compost, 15% woodchip and 5% clay). Sand is included in the reactive barrier because of its beneficial hydraulic properties, which ensure proper water flow and distribution throughout the barrier. Vegetal compost has a high organic matter (OM) and plays a crucial role in facilitating the biological degradation of ECs under aerobic conditions. Woodchip derived from pruning residues of pine and shrubs, is porous material that offers effective absorbance properties. Clay is incorporated into the reactive barrier due to its negatively charged surfaces, which enable it to effectively sorb cationic species. The physicochemical properties of the NBM selected for the experiments are shown in Supplementary Table S2. Those NBM already demonstrated a significant sorption potential for emerging contaminants (ECs) and more detailed about these NBM are presented in Valhondo et al., 2023.
Treated wastewater (TWW) was collected from Murviel-lès-Montpellier wastewater treatment plant (43°36′18.3″N 3°45′25.4″E), located in France. The sampling was carried out in December 2021 using grab sampling method. The wastewater treatment plant processes approximately 200 m3/d (73,000 m3/year) from a population of 1500 inhabitants, using a lagoon system for the treatment process (Kalboussi et al., 2022). The collected TWW was characterized by a pH of 8.06 and a redox potential of 155 mV. Sampled was conducted with 1L glass bottles, brought back to the laboratory in a cooler with ice packs, filtrated on 0.45 µm PTFE filter and stored at 4 °C until the experiment. The batch experiments were performed within 24 h after sampling.
The experimental set-up (Figure 1) involved five replicates of two different experimental conditions: TWW in contact with RB (condition 1) and TWW alone (condition 2). 40 mL of RB with 160 mL of TWW (Soil/Water (S/W) ratio of ¼) (condition 1) or 200 mL of TWW (condition 2) were added to 200 mL glass bottles and agitated for 1 h at 60 rpm on a roller agitator. The pH and redox potential of each replicate were measured both before and after the experiment (Supplementary Table S3). In addition, five replicates of ultra-pure water were put in contact with the reactive barrier during 1 h under stirring to check whether compounds are present and release by RB (Blank+RB). At the end of the experiments, 130 mL of water solutions (condition 1, condition 2 and, blank+RB) were filtered on 0.45 µm PTFE filter. Subsequently, a mixture of 15 deuterated internal standards was added to each replicate at a concentration of 100 ng/L (listed in Supplementary Table S1).
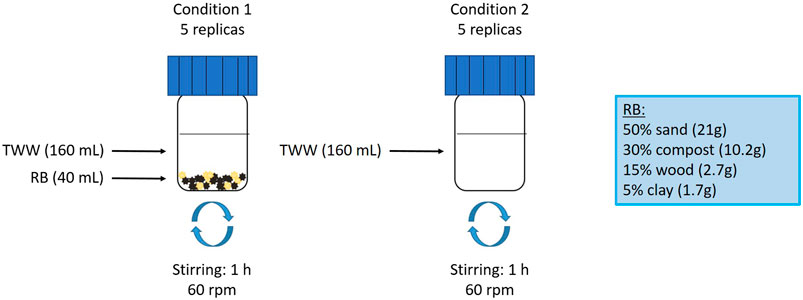
Figure 1. Experimental set-up with the two different conditions; condition 1: treated wastewater in contact with the reactive barrier condition; condition 2: treated wastewater alone.
2.3 Sampling and analysis
Samples were extracted using Oasis HLB cartridges (500 mg), previously conditioned with methanol (2 × 5 mL) followed by ultra-pure water (2 × 5 mL), at a flow rate of approximately 1 mL/min. The cartridges were then rinsed with 5 mL of ultra-pure water and dried under vacuum for 1 h. The analytes were eluted with 2 × 5 mL of methanol and the resulting extracts were evaporated to dryness under a gentle stream of nitrogen at 35°C. Afterward, the dried residues were reconstituted with 400 µL of an ACN:ultra-pure water (5:95, v/v) mixture containing 0.1% formic acid. Samples were filtered through a 0.2 µm PTFE filter before LC-MS analysis.
Analysis was performed on a LC Vanquish™ quaternary pump coupled to a Q-Orbitrap HRMS mass spectrometer (Thermo Fisher Scientific) equipped with a heated electrospray ionization probe (HESI) source for detection. Chromatographic separation was performed on a reverse phase analytical column (Kinetex Biphenyl 100Å 100 mm × 2.1 mm; 2.6 µm particle size) equipped with a security guard UHPLC Biphenyl 2.1 mm ID (Phenomenex). The injection volume was 10 µL and a binary gradient of ACN (A) and water (B) at 0.3 mL/min was used. In positive mode, both the mobile phases A and B contained 0.1% formic acid whereas no acidification was applied in negative mode. The gradient followed the following step: 5% B from 0 to 2 min, an increase from 5% to 50% B between 2 and 11 min, 50% B at 11–12 min, an increase from 50% to 100% B between 12 and 16 min, 100% A at 16–17 min, a decrease from 100% to 5% B between 17 and 19 min, and 5% B at 19 min and a stop time at 22 min. Over the 22 min run, full scan data acquisition was performed in both positive and negative ionization modes at a resolution of 70,000 full width at half maximum (FWHM). The HESI parameters were configured with 55 arbitrary units (AU) of sheath gas and 10 AU of auxiliary gas, along with a capillary temperature of 300 °C and heater temperature of 250°C. The electrospray voltage was set at + 3.5 kV and −3.5 kV in positive and negative modes, respectively. The S-lens radio frequency (RF) level was set at 50%. The ratio mass on charge (m/z) scan range was set between 100 and 700. Moreover, MS2 was achieved using both the confirmation (including an inclusion list) and the discovery mode. A 17,500 FWHM resolution was used for MS2 acquisition.
Quality control involved systematic measures to ensure analytical performances. The mass spectrometer (Q-Orbitrap HRMS, Thermo Fisher Scientific) is calibrated weekly using Pierce™ LTQ Velos ESI Positive Ion and Pierce™ Negative Ion calibration mixtures purchased from Thermo Fisher Scientific. The injections were randomly performed on the LC-HRMS. To ensure the column equilibration at the beginning of the analytical sequence, a quality control sample consisting of a pool (QC pool) of 10 µL collected from each sample extract was injected multiple times. This QC sample was injected every four samples to control and monitor analytical repeatability and sensibility. To assess the analytical performance, the relative standard deviation (RSD) was calculated for each feature detected in the replicated QC injections. A repeatability characterized by 70% of features with an RSD below 30% (Want et al., 2013) was considered acceptable. As a result, only features with an RSD below 30% were retained for further data processing and annotation. Moreover, to take into consideration the background noise coming from solvent and injection, a blank sample, consisting of ultra-pure water, was injected multiple times.
2.4 Data treatment
Date treatment includes a pre-processing and post-processing workflow followed by a prioritization workflow; it was conducted with Compound Discoverer 3.0 Software (ThermoFisher Scientific).
2.4.1 Data pre- and post-processing
The entire set of samples was used in data pre-processing. Features here are defined as three dimensional entities: retention times (RT), m/z values, and intensities (Hollender et al., 2023). The pre-processing workflow encompasses an extensive array of processing tools aimed at streamlining the process from peak picking to searching of databases (Supplementary Figure S1). The peak peaking step was executed with a mass tolerance of 5 ppm, a Signal/Noise (S/N) threshold of 6, and a minimum peak intensity of 100,000. Features grouping was also conducted at a mass tolerance of 5 ppm and retention time tolerance of 0.2 min. Elemental composition was done at a minimum element counts of C90 H190 Br3 Cl6 F20 K2 N10 Na2 O18 P3 S5. The output of this treatment generated a list of “merged features” also called components. “Merged features” refer to collections of features related to a unique chemical constituent (e.g. isotopes, adducts, and in-source fragments) which should be compare with database for compound identification. In this study, the term “features” will be used indistinctly for features or merged features. More detailed information about the Compound Discoverer settings used in this study are presented in Supplementary Table S4.
In this study, two internal complementary databases (Mass List and mzVault) were used. These internal databases contain a total of 140 organic compounds from diverse families. The selected compounds include 87 pharmaceutical compounds, 30 pesticides, 19 transformation products (TPs), and 4 industrial chemicals. Each of these micropollutants in our internal databases includes analytical information such as retention time (RT), theoretical accurate mass, and ionization mode. Furthermore, individual characterization of isotopic pattern and MS2 spectra was conducted to ensure reliable identification. For the screening of unknown contaminants, mass selection was guided by intensity and the availability of MS2 data. Compound identification were proposed from measured masses, isotopic pattern, and alignment with MS2 data. The online databases used in this work are mzCloud (www.mzcloud.org) and Mass Bank (www.massbank.eu). Compound identification was made on TWW, TWW+RB and Blank+RB samples.
Statistical analysis and differential analysis were performed as post-processing nodes (Supplementary Figure S1) on the different water samples (TWW+RB and TWW). Analysis of Variance method (ANOVA) was used to compare statistically the two experimental conditions (1: TWW+RB, 2: TWW). The results are shown using Fold change to compare the ratio of feature intensities between the two conditions and associated p-value.
2.4.2 Prioritization workflow for compound identification
Afterward, a differential analysis processing workflow was implemented to prioritize and identify the compounds, as depicted in Figure 2. The workflow involves reducing the number of features, which have a retention time between 1.15 and 20 min, based on several criteria: no presence in blank sample, and coefficient of variation lower than 30% in QC pool (quality control sample). Following this reduction, the remaining features are further selected according to: a p-value equal to or less than 0.01, indicating statistical significance between the two conditions, a log2FoldChange equal to or greater than 2.00 or equal to or less than −2.00, and Δmass (mass accuracy) between −5.00 ppm and 5.00 ppm. A log2Fold Change of 2.00 implies that the mean area in one condition is four times higher than in the other condition. For identifying and annotating compounds only features that meet the following criteria are kept: MS2 data, and a match with internal or online databases. Finally, additional data processing was performed, consisting in a manual checking performed to exclude the information that did not meet the analytical criteria (chromatogram and MS2 spectrum quality). In this work, the level of confidence for the identified compounds was set according to Schymanski et al. (2014) and Alygizakis et al. (2023), where level 1 represents confirmed compound by analytical standards and our internal database information (RT and MS2 data in our analytical conditions), level 2 corresponds to probable compounds (verified with MS2 on-line database and a minimum of three product ions), and level 3 represents tentative candidates (verified with MS2 on-line database but only two or less fragmented ions were present). Additionally, compounds are identified with a name, a chemical formula, a polarity, a retention time, a mass on charge ratio, a Δmass, a compound class, and main fragments are associated. Compound classes have been searched on PubChem database. For molecules for which no class could be identified, the “other” compound class is assigned.
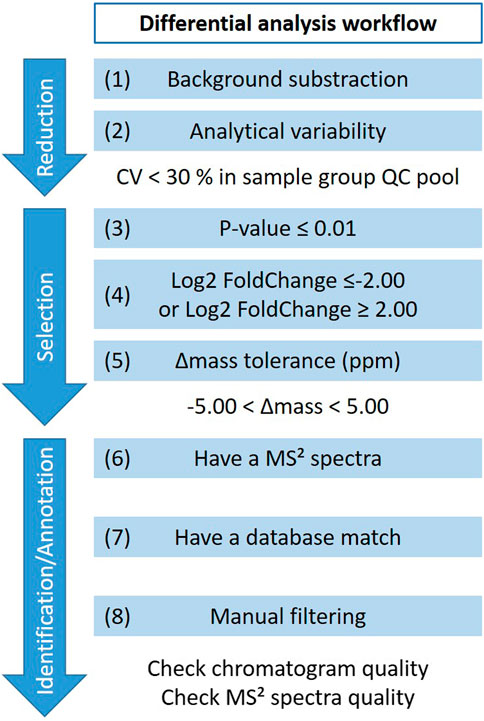
Figure 2. Prioritization workflow for compound identification.
In parallel, the xcms package on R software was used to build a Venn diagram. Venn diagram represents the relationships between different sets of items, each circle representing a set, and the overlapping regions representing the intersection between the sets. In this study, a set corresponds to a condition.
2.4.3 Quantification of pharmaceuticals residues
A quantitative method was applied on a list of 28 pharmaceutical residues in order to characterize the contribution of NTA to assess RB treatment of micropollutants in TWW. The list of pharmaceuticals and internal standard associated at each compound is presented in Supplementary Table S1. Calibration solutions were used to calculate the internal standard response factor between target analyte and its corresponding internal labelled standard. The quantification process was performed using the XCalibur software (ThermoFisher Scientific). The retention times, m/z values, recoveries, and limits of quantification of the 28 pharmaceuticals are presented in Supplementary Table S5. To account for potential preparation losses and matrix effect, 15 internal standards were used, resulting in procedural recoveries within acceptable range of 80%–120% for 21 compounds. 4 compounds have intermediate recoveries between 60% and 140% and 3 compounds (diltiazem, crotamiton, and climbazole) have lower recoveries (under 50%). Limits of detection did not exceed 1 ng/L for 26 compounds (2 ng/L for the two remaining). The mass labelled standards were also used for matrix effects evaluation.
2.5 Sorption estimation by non-target analysis
Sorption is a critical parameter for assessing the effectiveness of a reactive barrier as tertiary treatment for the removal of emerging contaminants. The calculated sorption percentage (CS) was determined by comparing concentrations in the TWW + RB and TWW experiments using Eq. 1:
where CTWW+RB and CTWW are the concentrations in TWW+RB and TWW, respectively.
To investigate the applicability of NTA for sorption estimation, peak area obtained through differential analysis were used. The estimated sorption (ES) via differential analysis is presented in Eq. 2:
where ATWW+RB and ATWW are the peak area in TWW+RB and TWW, respectively.
To compare the calculated sorption and the estimated sorption, a Δ sorption percentage (ΔS) was calculated using Eq. 3:
where ES is the estimated sorption and CS is the calculated sorption.
To link calculated sorption and estimated sorption a correlation between the two was drawn. In addition, matrix effect was calculated using mass labelled standards with the Eq. 4:
where A’TWW+RB and A’TWW are the mean peak area of mass labelled standards in TWW+RB and TWW, respectively.
3 Results
Our focus delves into the results derived from NTA, which allowed for the identification of various compounds present in the TWW and in the TWW+RB and for the differential approach between them. Subsequently, targeted analysis was employed to quantify the sorption of specific molecules onto the reactive barrier. This quantitative approach was then compared with sorption estimations derived from NTA, providing a holistic understanding of the barrier’s sorption capacity and offering insights into the reliability of NTA in evaluating environmental processes.
3.1 Identification of micropollutants
The investigation of measurement data for NTA required time consuming and systematic analysis of the dataset that can be reduce by using software and tools. As the amount of data was very large (20,331 features in positive mode and 11,572 features in negative mode), appropriate prioritization was implemented. The results for the positive mode (Figure 3) are detailed here, while the results for the negative mode are presented in Supplementary Material since the path followed is the same in both modes. In positive mode, the componentization step, utilizing both retention time and peak shape of the features to combine them in a single component, allowed a reduction from 20,331 features to 8,075 merged features (Figure 3A). These features were further prioritized to highlight the statistical differences between the two studied conditions, leading to a notable reduction in the number of significant features to 3,978 features (a 51% reduction). The identification effort (step 6 and 7 of the prioritization workflow, shown in Figure 2) and the verification of the quality of the chromatograms and spectra resulted in identified and annotated 85 compounds in positive mode.
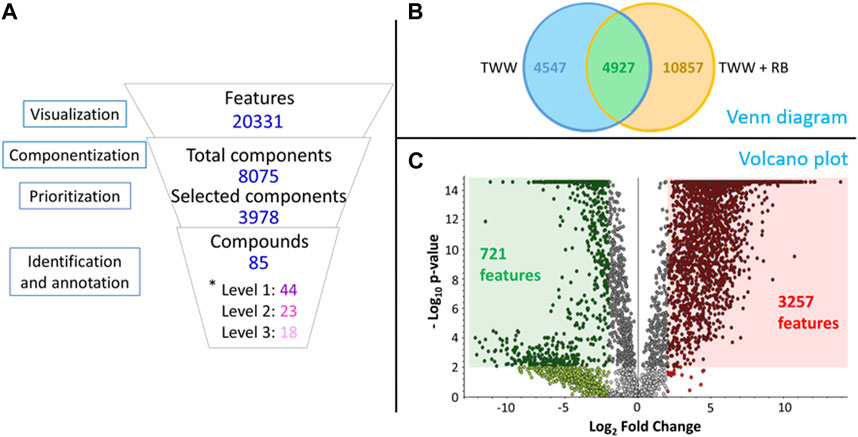
Figure 3. Comprehensive analysis in positive mode: (A) Number of analytical signals (Venn Diagram), prioritized features (Vulcano plot) and annotated or identified compounds from non-target data analysis - *level inspired from Schymanski et al., 2014; Alygizakis et al., 2023; (B) Venn diagram between TWW and TWW+RB; (C) Volcano plot representing the results of the ANOVA build on features.
The distribution of features between the two conditions is illustrated in the Venn diagram (Figure 3B), which shows the greater number of features provided by TWW+RB (15,784) compared with TWW (9,474). Specifically, there are 4,927 features common to both conditions, with 4,547 features unique to TWW and 10,857 unique to TWW+RB.
To unveil essential insights from prioritized features, we employed Analysis of Variance (ANOVA), as presented in Figure 3C. The volcano plot displays features in relation to Log2 Fold Change versus -Log10 p-value, considering the average chromatographic peak area in each condition. Red points signify features with a peak area in TWW + RB four times higher than in TWW, while green points indicate features with an area in TWW + RB four times lower than in TWW. Features within the red square exhibited a -Log10 p-value equal or higher than 2 (p-value ≤0.01) and Log2 Fold Change equal or higher than 2. Conversely, features within the green square meet the criteria of a -Log10 p-value equal or higher than 2 (p-value ≤0.01) and a Log2 Fold Change equal or lower than −2. This stringent selection identifies 3,257 features in the red square and 721 features in the green square, providing a focused and robust understanding of the key features influencing the observed variations.
Negative mode showed selection of 1,458 features in red square and 325 features in green square conducting to the identification and annotation of 30 compounds (Supplementary Figure S2). In addition, suspect screening of our in-house databases (MassList and mzVault) has enabled us to identify 18 compounds. The number of features at each stage of prioritization workflow for both positive and negative modes is summarized in the Supplementary Figure S3. Among the total 110 compounds identified and annotated in both positive and negative modes, a total of 49 compounds were confidently identified at the level 1 according to Schymanski et al. (2014) and Alygizakis et al. (2023). Additionally, 26 and 35 other compounds were tentatively identified at level 2 and 3, respectively. Thus, 44 pharmaceuticals, 3 pesticides, 10 industrials compounds, 25 natural products, and 20 transformation products were annotated or identified (Supplementary Table S6).
3.2 Reactive barrier effects
Once the annotation was complete, we set about attributing the compounds to each condition. 35 compounds were exclusive of TWW, 46 compounds of TWW+RB and 29 compounds were found in both conditions (columns TWW and TWW+RB in Supplementary Table S6). In addition, the variation after contact with the reactive barrier was determined in correlation with the Log2 Fold Change. Thus, there are 49 compounds where the peak area increased after contact with reactive barrier, 43 compounds where the peak area decreases after contact with reactive and 18 compounds where the peak area has no significant variation after contact with reactive barrier. The column Blank+RB of Supplementary Table S6 presented the 57 compounds found in Blank+RB samples. The 49 compounds with a peak area increasing after contact with reactive barrier were also detected in Blank+RB. The other 8 contaminants of Blank+RB are present in the 3 conditions. Among compounds decreasing significantly, 31 compounds are pharmaceuticals and 10 are pharmaceutical metabolites (e.g. N-desmethylvenlafaxine, O-desmethylvenlafaxine, NN-didesmethylvenlafaxine and NO-didesmethylvenlafaxine). An additive, the lauryl sulfate, and a fatty acid, the ricin oleic acid, also decreased. Compounds decreasing were identified, in majority, at level 1.
Among compounds increasing significantly, 27 are natural products and 3 are transformation products. Contrary to the compounds where the peak decreases after contact with reactive barrier, compounds with higher peak area after RB have been annotated at level 2 or 3. To better understand which type of natural products are released by the reactive barrier a separate table (Supplementary Table S7) focusing on natural products was built. Among them, some are very common in plant structure such as matairesinol, which is one of the lignan found in cereals, or maesopsin found in lots of flowering plants and trees.
3.3 NTA applicability for sorption estimation
A total of 22 up on 28 searched pharmaceuticals were detected by target analysis in the TWW at concentrations ranging from less than 10 ng/L to more than 1 μg/L. Among them, 4 compounds (acetaminophen, caffeine, metoprolol, primidone) have been also detected in Blank+RB (ultra-pure water in contact with TWW) at concentration indicating RB materials provided those pharmaceuticals (Supplementary Figure S4). After contact of treated wastewater with the reactive barrier, 16 compounds concentrations have decreased and 2 have weakly increased (Figure 4). Those results were first used to quantify sorption and then to evaluate the relevance of estimating sorption through NTA. In TWW, irbesartan, lamotrigine and diclofenac showed the highest concentrations (>1 μg/L), whereas mefenamic acid, climbazole, cocaine, prednisolone, sulfamethizole, and valsartan were not detected. The concentrations in TWW+ RB also cover a range from lower than limit of detection to more than 1 μg/L for irbesartan. Amisulpride, diazepam, diltiazem, ketoprofen, and trimethoprim are under the limit of detection.
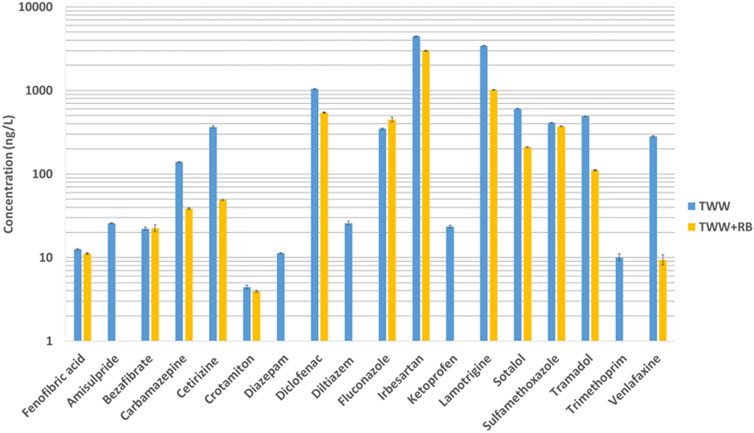
Figure 4. Concentrations in ng/L of 18 targeted compounds found in treated wastewater (in blue) and in treated wastewater after contact with reactive barrier (in orange).
Applying Equation 1 and assuming that the differences in concentrations measured for the 18 molecules in TWW and TWW+RB are exclusively attributed to sorption, we were able to calculate the percentage of sorption for these 18 molecules in the RB. Among the 18 molecules, it is worth noting that 61% of these molecules are sorbed at more than 50% and 39% at more than 80% (Supplementary Figure S5).
The comparison between sorption, calculated using quantitative method (Eq. 1), and estimated sorption, calculated based on peak areas provided by the NTA workflow (Eq. 2), is essential for addressing this issue and confirming the feasibility of estimation through non-target analysis. The estimated sorption is compared to the calculated sorption (Supplementary Table S6; Figure 5) for the 18 quantified compounds (Figure 4) that were also detected using NTA (Supplementary Table S6). Supplementary Table S6 presents the calculated sorption, estimated sorption and the Δ Sorption (%) for each compound, calculated respectively by Eqs 1,2, 3. In the Δ sorption column, positive values indicate an overestimation, while negative values suggest an underestimation.
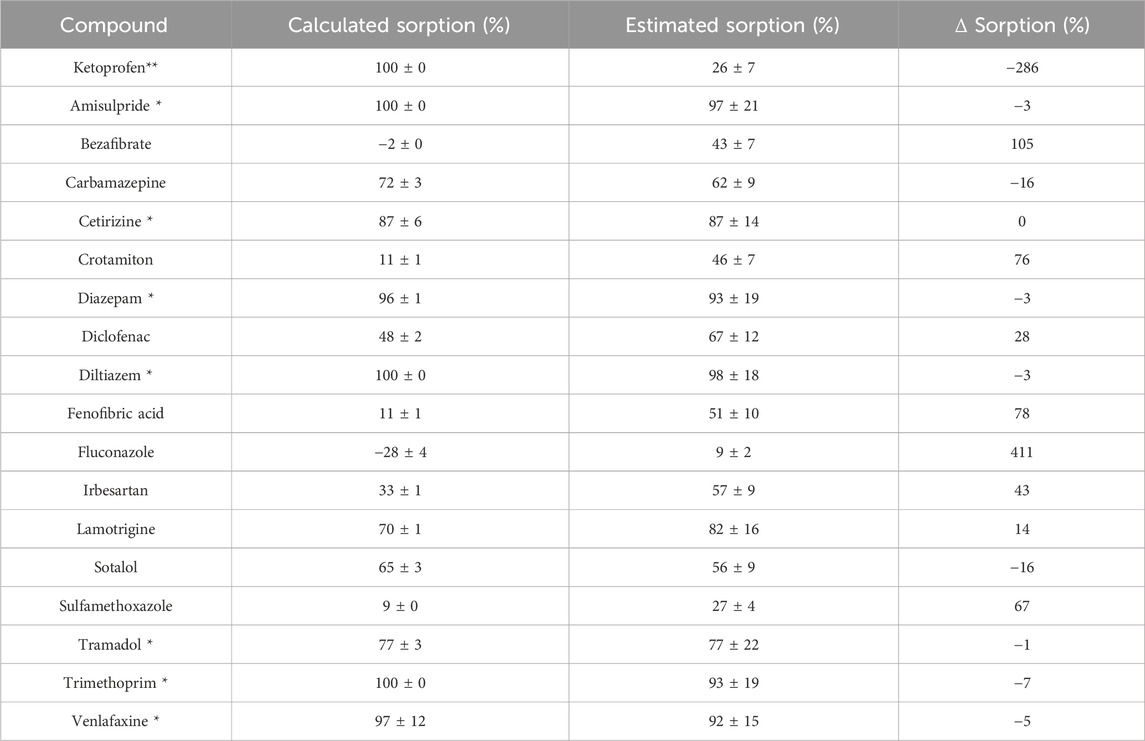
Table 1. Comparison of calculated and estimated sorption for the 18 quantified compounds, highlighting those with >75% calculated sorption (*) and the particular case of ketoprofen (**).
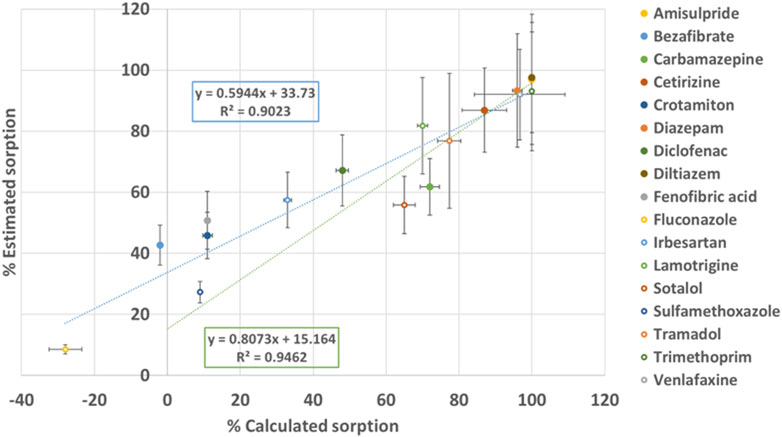
Figure 5. Percentage of sorption estimated by non-target analysis in function of percentage of sorption calculated for target analysis; in blue: linear regression accounting all the compounds, in orange: linear regression accounting compounds with S>60%.
The correlation between estimated sorption and calculated sorption (indicated in blue line in Figure 5) is 59% as determined by a linear regression. Despite a satisfactory correlation (r2 = 0.90), increased vigilance regarding the matrix effect is deemed necessary. Notably, a 34% variation in the estimation of sorption through non-target analysis was observed. Estimating sorption becomes also more challenging for compounds with small variations of concentrations between the two conditions. When considering compounds with calculated sorption greater than 75% (indicated with “*” in Supplementary Table S6), the correlation between calculated and estimated sorption (indicated in green line in Figure 5) is very good (81%). With improved correlation (r2 = 0.95), all the compounds with calculated sorption greater than 75% have an optimized estimated sorption (Δ sorption less than 10%).
However, ketoprofen, despite having high calculated sorption, is poorly estimated with non-target analysis. This discrepancy may stem from its quantification close to the limit of detection, emphasizing the need for a sufficient Signal-to-Noise (S/N) value in the pre-processing workflow of NTA.
The matrix effect is calculated on 15 internal standards spiked into each sample. The difference between TWW and TWW+RB is shown in Supplementary Figure S6, where a twofold increase in TWW+RB compared to TWW was observed in 5 out of the 15 internal standards. Conversely, telmisartan d3 have a threefold reduction. It highlights the importance of exercising caution when selecting compounds in NTA for the estimation of sorption. In this study, opting for a log2 FoldChange of 2 was selected to prevent false observations due to the matrix effect between the two sets of samples. The matrix effect in both TWW and TWW+RB compared to ultra-pure water is further displayed in Supplementary Figure S7.
4 Discussion
The results showed the importance to use NTA with differential approach to assess RB application on TWW. The discussion of this study will focus on the challenges associated with compound identification, on the precautions to be taken due to matrix effect and on the role of NTA in assessing RB application on TWW.
4.1 Compound identification challenges
NTA approach has a great potential for understanding the role of RB in improving the quality of TWW effluent. However, there are several challenges in compound identification that need to be addressed. Determining the efficacy of a reactive barrier poses a complex and challenging analytical undertaking, as the barrier components interact with contaminants in diverse ways. Precautions should be implemented early in the sample preparation process, a critical step as emphasized by Hajeb et al. (2022) review. Once the sample preparation defined, the optimization of parameters of the NTA workflow data processing is one of the key points to reduce the rate of false positives and negatives (Chaker et al., 2021). Peak detection and blank subtraction are key steps in data processing to avoid false positives and negatives. Limits of the identification are link with false positives and false negatives rates. False negatives (type II errors) are the compounds that are present in the sample but have not been detected by the analytical process. False negatives may occur because of really small concentrations and complexity of the matrix. Due to a decrease in potentially relevant data, false negatives can result in misinterpretation of the role of RB. However, the quantity of data available is sufficient for prospecting in our study and we hypothesize that false negatives represent a minimal hazard for compound identification and data interpretation. On the contrary, false positives (type I errors) are a real pitfall to be avoided. They represent compounds that are not present in the sample, but have been tentatively annotated. Properly selected settings reduce the amount of noise signals, even if they cannot be completely avoided in large datasets (Nürenberg et al., 2015). To minimize false positive rate, different strategies are used in literature. As suggested by Hollender et al. (2023) and reference in, this study ensured a sufficient number of matching fragments. An increased number of replicates also reduce both false positive and negative rates (Bader et al., 2016). The determination of true positives has been made in agreement with Dietrich et al. (2022): only one peak with signal intensity clearly distinguished from background noise and peak maximum inside the peak width window. According to this work, our selection of a chromatographic S/N threshold of 6 results in limiting our false positive rate under 10%. Optimizing this specific parameter involves a delicate balance between minimizing false positives (background noise) and achieving additional reduction, which may risk eliminating crucial data.
The quality of the differential approach, comparing our two conditions (TWW and TWW+RB), also relies on the use of blanks and quality controls. As mentioned by Hollender et al. (2023) and references in, we know that blanks are used to eliminate background and contamination features. In this study, we use two types of quality control. The first one, commonly used in targeted applications, rely to the use of internal standards. In their guideline for the non-target screening in water analysis Schulz et al. (2019) remind that the use of internal standards permits to compensate potential losses in sample preparation or correct matrix effect. Our investigation of 15 internal standards with retention times between 1.45 and 15.2 min allow us to have a global physico-chemical properties representation of compounds that may occur in our samples. Second type of quality control are QC pool. This is a pool of all samples of the analytical sequence. Widely applied in metabolomics, this method permits to select the features with reliable analytical stability (CV<30% in sample group QC pool) (Gika et al., 2012) along the analytical sequence. Some research focusses on utilizing native standards to complement existing internal databases and confirm identifications through matching retention time and ionization fragments to ensure confidence in identification propositions (Sobus et al., 2018). While this method allows for complete confidence in identification, the task of grouping all existing native standards in a single internal database remains elusive.
The reproducibility in non-target approach remains also a challenge. Within-lab reproducibility can be achieved thanks to the use of protocols that consistently employ the same equipment and involve the same operator (Samanipour et al., 2019). However, the inter-laboratory reproducibility, defined as the ability to independently identify and quantify the same compound in a similar sample (Hites and Jobst, 2018), need further developments. Compared to target analysis that use internal standards and reproducible protocols, NTA is machine, operator, and even day dependent. The choices made for the data treatment in NTA lead also to differences between laboratories. Characterizing the strengths and weaknesses of chosen algorithm permits to ensure traceability and reliability of results as reviewed by Renner and Reuschenbach (2023). The efforts made to characterize contaminants (Norman network for example) are a great help, thanks to comparisons between different HRMS techniques (Hollender et al., 2023), but efforts must be continued, especially for natural components if focusing in RBs. Finally, compound identification faces huge number of features after NTA workflow coming from the complexity of the matrix made by TWW after contact with RB.
4.2 Matrix effect challenges
Matrix effect impact the sensitivity, reproducibility, linearity and accuracy of the method. It can cause signal reductions at high concentrations of compounds of interest and signal enhancements at low compound concentrations (Paszkiewicz et al., 2022). When applying differential approach with two completely different matrices, there is a risk of having issue with matrix effect. Matrix effect can therefore impact our assessment of sorption through non-target analysis which must be conducted with caution. The two experimental conditions (TWW vs. TWW+RB) are characterized by different matrices, which implies matrix effect and difference in ionization. Differences in ionization will have a direct impact on the peak area on so, on estimated sorption. In target analysis, this matrix effect is corrected by internal standards which permit to ensure correction in concentration calculations and so, in calculated sorption. However, in NTA combined with differential approach, there is a need to find out methods to manage matrix effect. Among the various methods that attempt to avoid or reduce the impact of matrix effect there is the use of a mixture of internal standards to evaluate matrix effect (Verkh et al., 2018). Nürenberg et al. (2015) highlights that a better compensation of matrix effect can be reach with high dilution degree but this leads also to the reduction of overall intensities. As with false negative and positive rates, correcting the matrix effect using dilution is a balancing act between reducing the matrix effect and losing crucial data.
As the TWW+RB matrix is different than TWW matrix, the ionization differs, resulting in variations in the calculation of feature areas. In our study, all compounds exhibiting a calculated sorption greater than 75% showed an optimized estimated sorption (with a Δ sorption less than 10%). This highlights the relevance of choosing a Log2 Fold Change equal or higher than 2 in the differential analysis, representing a difference of 75% in peak area. Focusing on a 75% of change between the two conditions permits to reduce dramatically the risk of false interpretation. This is consistent with Schollée et al. (2021) that have done an automated trend assignment with three intensity domains and took a change of 80% between two conditions to conclude. In environmental studies, the availability of the NTA offers many advantages, but developments to overcome matrix effects must continue to enable comparisons between different matrices such as the two conditions of our study.
4.3 NTA contribution for broadening perspectives on the impact of reactive barrier treatment
Building upon the extensive list of compounds identified or annotated in our study, the effectiveness of the reactive barrier in removing organic contaminants from treated wastewater becomes even more evident. The comprehensive NTA conducted in our research reveals the removal of diverse contaminants, encompassing various chemical families. This finding agrees with the results reported form a field study carried out by Valhondo et al. (2020b), who demonstrated the removal efficiencies for organic UV filters, paraben preservatives and pharmaceuticals. Compounds, like carbamazepine and trimethoprim, have similar comportment in terms of sorption as other type of treatment such as bark-biochar constructed wetland (Lei et al., 2023) or macro-algae (Li et al., 2019). The differences in sorption between molecules has already been associated with the physical-chemical properties and composition of the barrier (Beckchanov et al., 2024). Hydrophobic particles present in the barrier sorbed more organic compounds (Zhang et al., 2022). It appears that the surface area, the organic carbon (OC) and the cation exchange capacity (CEC) are the main parameters influencing sorption (Manthiram Karthik and Philip, 2021).
Our results also reveal numerous chemical compounds which were not initially present in the effluent. In the context of managing artificial recharge through reactive barrier, these compounds could potentially reach groundwater. In our experimental study, primarily natural products released from vegetable compost or woodchips have been annotated. Natural-based materials release certain contaminants, as shown by compounds determined under TWW+RB and Blank+RB conditions, highlighting there is a need of vigilance about the contribution of the barrier. The biodegradation processes of organic compounds are well-documented in soils (McGuinness and Dowling, 2009). The composition of reactive barriers, such as compost, woodchips, and other natural compounds, contributes to the enhancement of these processes (Kästner and Miltner, 2016).
The two main processes involved when TWW is in contact with RB are sorption and biodegradation (Valhondo et al., 2023). Considering our experimental conditions (time and agitation), sorption is expected to be the predominant process. Therefore, in this study, we will solely focus on the sorption process. Longer-term experiments, allowing biofilm development that could produce TPs shoud be further studied. Increasing compounds can be either TPs of compounds from treated wastewater (Tisler et al., 2022) or natural compounds release from the barrier and mainly by compost and woodchips (Verkh et al., 2018). The apparition of TPs is unlikely to occur as the contact time between the barrier and TWW is very short, and there is no biodegradation in such few time (Maeng et al., 2011). However, 1 hour of contact between TWW and RB permits to reach maximum sorption capacity (Gil et al., 2019).
In order to identify natural products, a number of Chemspider databases have been selected but other interesting online databases are available such as Natural Product Atlas (van Santen et al., 2019). For example, some natural products identified in this study have been found in a mixed medicinal plant extract (Seetaha et al., 2022). Like for transformation products, a prediction of natural product could be done (Harn et al., 2017).
NTA emerges as a powerful tool in expanding our understanding of the impact of reactive barriers treatment on TWW. Traditionally, studies have focused on targeted analyses, demonstrated the sorption capabilities of reactive barriers for pharmaceuticals or other emerging contaminants (Valhondo et al., 2020b; Lei et al., 2023; Valhondo et al., 2023). These investigations have showed the effectiveness of RB in renaturalizing treated wastewater, emphasizing their role in mitigating the impact of specific contaminants (Schaffer et al., 2015). In contrast, NTA introduces a paradigm shift by offering a comprehensive view of the composition of TWW after contact with a RB, uncovering a diverse spectrum of compounds that may impact water quality.
As commonly known, NTA reveals that numerous compounds are present in the TWW influent. Our results, obtained through a differential analysis, highlight that 1,046 compounds detected in TWW have experienced statistically and significantly decreased concentrations (>75% variation) after contact with RB. However, the application of NTA has been instrumental in bringing increasing compounds to light and initiating identification efforts. This aspect of our investigation is crucial as it highlights a previously underexplored spectrum of compounds that warrant in-depth investigation to assess their potential risks.
Differential analysis allows for a nuanced understanding of sorption dynamics, providing valuable insights into the efficiency of the reactive barrier in removing contaminants. Identifying the products provided by the RB would enable us to study whether or not they are of interest to the process (contribution of organic matter, support for bacterial development). We recommend applying NTA in more realistic conditions such as column experiments or field project to gain an overview of these new compounds that may arise from biotransformation processes or be released from RB.
4.4 Summary
Here we report the first study to investigate the contributions and limitations of NTA combined to differential approach to determine its relevance in the case of RB processes concerning sorption and release of chemical compounds and their environmental implications. However, it is worth noting that microorganisms and pathogens are commonly found in TWW. Minimum requirements for water reuse (European Parliament and of the council, 2020), especially for agricultural irrigation, regarding microbiological indicators should be met. In particular cases, disinfection of TWW before reactive barrier treatment may be required.
The study permits to identified or tentatively annotated 110 compounds. The implementation of a reactive barrier has a significant impact on the composition of treated wastewater resulting in the reduction of numerous signals. In particular, the study revealed a reduction for pharmaceuticals and pharmaceutical metabolites, consistent with findings from previous studies utilizing target analysis. Furthermore, a noteworthy observation is that 61% of the compounds exhibit sorption levels exceeding 50%. The use of NTA allows to highlight that a huge number of features was brought by RB and predominantly consist of natural products. While accounting the various challenges of identification, this study emphasizes the possibility offered by NTA for estimating the sorption of TWW compounds on RB, proposing a way of dealing with matrix effect.
NTA provides a broad and complete view of the performances of nature-based reactive barrier treatment, giving information on the compounds released by the barrier in addition to its sorption capacity. NTA highlights the benefits of using a mix of nature-based materials to conduct RB treatment but also the necessity to study compounds reloaded by these materials. NTA is a powerful tool to increase the understanding of nature-based reactive barrier benefits for improving the quality of treated wastewater and for evaluating the risks associated to reutilization of TWW. The NTA approach holds promises that merits further exploration. To enrich the quality of information obtained in this study it would be interesting to pursue investigations using a real reactive barrier made with the studied materials in column experiments. Such studies could explore other parameters such as flow, duration, redox conditions, microbiological activity and in real-life situations.
Data availability statement
The original contributions presented in the study are included in the article/Supplementary Material, further inquiries can be directed to the corresponding author.
Author contributions
CG: Data curation, Formal Analysis, Methodology, Writing–original draft. GD: Funding acquisition, Conceptualization, Methodology, Supervision, Validation, Writing–review and editing. LL: Conceptualization, Funding acquisition, Methodology, Project administration, Supervision, Writing–review and editing. EG: Conceptualization, Funding acquisition, Methodology, Project administration, Supervision, Writing–review and editing.
Funding
The author(s) declare that financial support was received for the research, authorship, and/or publication of this article. This study was founded by Centre National de la Recherche Scientifique (doctoral scholarship), Institut Carnot Eau & Environnement and Agence Nationale de la Recherche (NEREIDE project), and the European Union through LIFE20 ENV/ES/000284 LIFE REMAR project.
Acknowledgments
The authors thank Téo Ferreux for his help in the development and validation of the analytical methods. The authors also thank the Platform Of Non-Target Environmental Metabolomics (PONTEM) of the Montpellier Alliance for Metabolomics and Metabolism Analysis (MAMMA) consortium.
Conflict of interest
The authors declare that the research was conducted in the absence of any commercial or financial relationships that could be construed as a potential conflict of interest.
Publisher’s note
All claims expressed in this article are solely those of the authors and do not necessarily represent those of their affiliated organizations, or those of the publisher, the editors and the reviewers. Any product that may be evaluated in this article, or claim that may be made by its manufacturer, is not guaranteed or endorsed by the publisher.
Author disclaimer
It reflects only the author’s view and the Agency is not responsible for any use that may be made of the information it contains.
Supplementary material
The Supplementary Material for this article can be found online at: https://www.frontiersin.org/articles/10.3389/fenvs.2024.1385806/full#supplementary-material
References
Adeleye, A. S., Xue, J., Zhao, Y., Taylor, A. A., Zenobio, J. E., Sun, Y., et al. (2022). Abundance, fate, and effects of pharmaceuticals and personal care products in aquatic environ-ments. J. Hazard. Mater. 424, 127284. doi:10.1016/j.jhazmat.2021.127284
Alharbi, S. K., Ansari, A. J., Nghiem, L. D., and Price, W. E. (2022). New transformation products from ozonation and photolysis of diclofenac in the aqueous phase. Process Saf. Environ. Prot. 157, 106–114. doi:10.1016/j.psep.2021.10.050
Alygizakis, N., Lestremau, F., Gago-Ferrero, P., Gil-Solsona, R., Arturi, K., Hollender, J., et al. (2023). Towards a harmonized identification scoring system in LC-HRMS/MS based non-target screening (NTS) of emerging contaminants. TrAC Trends Anal. Chem. 159, 116944. doi:10.1016/j.trac.2023.116944
Arabzadeh, M., Eslamidoost, Z., Rajabi, S., Hashemi, H., Aboulfotoh, A., Rosti, F., et al. (2023). Wastewater quality index (WWQI) as an indicator for the assessment of sanitary effluents from the oil and gas industries for reliable and sustainable water reuse. Groundw. Sustain. Dev. 23, 101015. doi:10.1016/j.gsd.2023.101015
Bader, T., Schulz, W., Kümmerer, K., and Winzenbacher, R. (2016). General strategies to increase the repeatability in non-target screening by liquid chromatography-high resolution mass spectrometry. Anal. Chim. Acta 935, 173–186. doi:10.1016/j.aca.2016.06.030
Bekchanov, D., Mukhamediev, M., Yarmanov, S., Lieberzeit, P., and Mujahid, A. (2024). Functionalizing natural polymers to develop green adsorbents for wastewater treatment applications. Carbohydr. Polym. 323, 121397. doi:10.1016/j.carbpol.2023.121397
Bekele, E., Toze, S., Patterson, B., and Higginson, S. (2011). Managed aquifer recharge of treated wastewater: water quality changes resulting from infiltration through the vadose zone. Water Res. 45, 5764–5772. doi:10.1016/j.watres.2011.08.058
Blum, K. M., Gallampois, C., Andersson, P. L., Renman, G., Renman, A., and Haglund, P. (2019). Comprehensive assessment of organic contaminant removal from on-site sewage treatment facility effluent by char-fortified filter beds. J. Hazard. Mater. 361, 111–122. doi:10.1016/j.jhazmat.2018.08.009
Carter, L. J., Chefetz, B., Abdeen, Z., and Boxall, A. B. A. (2019). Emerging investigator series: towards a framework for establishing the impacts of pharmaceuticals in wastewater irrigation systems on agro-ecosystems and human health. Environ. Sci. Process. Impacts 21, 605–622. doi:10.1039/C9EM00020H
Chaker, J., Gilles, E., Léger, T., Jégou, B., and David, A. (2021). From metabolomics to HRMS-based exposomics: adapting peak picking and developing scoring for MS1 suspect screening. Anal. Chem. 93, 1792–1800. doi:10.1021/acs.analchem.0c04660
Dietrich, C., Wick, A., and Ternes, T. A. (2022). Open-source feature detection for non-target LC–MS analytics. Rapid Commun. Mass Spectrom. 36, e9206. doi:10.1002/rcm.9206
European Parliament and of the council (2020). Regulation 2020/741. Available at: https://eur-lex.europa.eu/legal-content/EN/TXT/HTML/?uri=CELEX:32020R0741 (Accessed March 14, 2024).
Gika, H. G., Theodoridis, G. A., Earll, M., and Wilson, I. D. (2012). A QC approach to the determination of day-to-day reproducibility and robustness of LC–MS methods for global metabolite profiling in metabonomics/metabolomics. Bioanalysis 4, 2239–2247. doi:10.4155/bio.12.212
Gil, A., Taoufik, N., García, A. M., and Korili, S. A. (2019). Comparative removal of emerging contaminants from aqueous solution by adsorption on an activated carbon. Environ. Technol. 40, 3017–3030. doi:10.1080/09593330.2018.1464066
Gulde, R., Rutsch, M., Clerc, B., Schollée, J. E., von Gunten, U., and McArdell, C. S. (2021). Formation of transformation products during ozonation of secondary wastewater effluent and their fate in post-treatment: from laboratory-to full-scale. Water Res. 200, 117200. doi:10.1016/j.watres.2021.117200
Hajeb, P., Zhu, L., Bossi, R., and Vorkamp, K. (2022). Sample preparation techniques for suspect and non-target screening of emerging contaminants. Chemosphere 287, 132306. doi:10.1016/j.chemosphere.2021.132306
Harn, Y.-C., Su, B.-H., Ku, Y.-L., Lin, O. A., Chou, C.-F., and Tseng, Y. J. (2017). NP-StructurePredictor: prediction of unknown natural products in plant mixtures. J. Chem. Inf. Model. 57, 3138–3148. doi:10.1021/acs.jcim.7b00565
Hites, R. A., and Jobst, K. J. (2018). Is nontargeted screening reproducible? Environ. Sci. Technol. 52, 11975–11976. doi:10.1021/acs.est.8b05671
Hollender, J., Schymanski, E. L., Ahrens, L., Alygizakis, N., Béen, F., Bijlsma, L., et al. (2023). NORMAN guidance on suspect and non-target screening in environmental monitoring. Environ. Sci. Eur. 35, 75. doi:10.1186/s12302-023-00779-4
Hollender, J., van Bavel, B., Dulio, V., Farmen, E., Furtmann, K., Koschorreck, J., et al. (2019). High resolution mass spectrometry-based non-target screening can support regulatory environmental monitoring and chemicals management. Environ. Sci. Eur. 31, 42. doi:10.1186/s12302-019-0225-x
Hoogendijk, K., Myburgh, P. A., Howell, C. L., and Hoffman, J. E. (2023). Irrigation of agricultural crops with municipal wastewater - a review. South Afr. J. Enology Vitic. 44, 31–54. doi:10.21548/44-1-5718
Jana, S., Gnanakan, K., and Jana, B. B. (2018). “Multiple reuse of wastewater: economic perspectives,” in Wastewater management through aquaculture. Editors B. B. Jana, R. N. Mandal, and P. Jayasankar (Singapore: Springer), 255–267. doi:10.1007/978-981-10-7248-2_13
Kalboussi, N., Biard, Y., Pradeleix, L., Rapaport, A., Sinfort, C., and Ait-mouheb, N. (2022). Life cycle assessment as decision support tool for water reuse in agriculture irrigation. Sci. Total Environ. 836, 155486. doi:10.1016/j.scitotenv.2022.155486
Kästner, M., and Miltner, A. (2016). Application of compost for effective bioremediation of organic contaminants and pollutants in soil. Appl. Microbiol. Biotechnol. 100, 3433–3449. doi:10.1007/s00253-016-7378-y
Kunzelmann, M., Winter, M., Åberg, M., Hellenäs, K.-E., and Rosén, J. (2018). Non-targeted analysis of unexpected food contaminants using LC-HRMS. Anal. Bioanal. Chem. 410, 5593–5602. doi:10.1007/s00216-018-1028-4
Lei, Y., Wagner, T., Rijnaarts, H., de Wilde, V., and Langenhoff, A. (2023). The removal of micropollutants from treated effluent by batch-operated pilot-scale constructed wetlands. Water Res. 230, 119494. doi:10.1016/j.watres.2022.119494
Li, Y., Taggart, M. A., McKenzie, C., Zhang, Z., Lu, Y., Pap, S., et al. (2019). Utilizing low-cost natural waste for the removal of pharmaceuticals from water: mechanisms, isotherms and kinetics at low concentrations. J. Clean. Prod. 227, 88–97. doi:10.1016/j.jclepro.2019.04.081
Maeng, S. K., Sharma, S. K., Abel, C. D. T., Magic-Knezev, A., and Amy, G. L. (2011). Role of biodegradation in the removal of pharmaceutically active compounds with different bulk organic matter characteristics through managed aquifer recharge: batch and column studies. Water Res. 45, 4722–4736. doi:10.1016/j.watres.2011.05.043
Manthiram Karthik, R., and Philip, L. (2021). Sorption of pharmaceutical compounds and nutrients by various porous low cost adsorbents. J. Environ. Chem. Eng. 9, 104916. doi:10.1016/j.jece.2020.104916
McGuinness, M., and Dowling, D. (2009). Plant-associated bacterial degradation of toxic organic compounds in soil. Int. J. Environ. Res. Public Health 6, 2226–2247. doi:10.3390/ijerph6082226
Negreira, N., Regueiro, J., López de Alda, M., and Barceló, D. (2015). Degradation of the anticancer drug erlotinib during water chlorination: non-targeted approach for the identification of transformation products. Water Res. 85, 103–113. doi:10.1016/j.watres.2015.08.005
Nürenberg, G., Schulz, M., Kunkel, U., and Ternes, T. A. (2015). Development and validation of a generic nontarget method based on liquid chromatography – high resolution mass spectrometry analysis for the evaluation of different wastewater treatment options. J. Chromatogr. A 1426, 77–90. doi:10.1016/j.chroma.2015.11.014
Paszkiewicz, M., Godlewska, K., Lis, H., Caban, M., Białk-Bielińska, A., and Stepnowski, P. (2022). Advances in suspect screening and non-target analysis of polar emerging contaminants in the environmental monitoring. TrAC Trends Anal. Chem. 154, 116671. doi:10.1016/j.trac.2022.116671
Patel, M., Kumar, R., Pittman, C. U., and Mohan, D. (2021). Ciprofloxacin and acetaminophen sorption onto banana peel biochars: environmental and process parameter influences. Environ. Res. 201, 111218. doi:10.1016/j.envres.2021.111218
Pedrero, F., Kalavrouziotis, I., Alarcón, J. J., Koukoulakis, P., and Asano, T. (2010). Use of treated municipal wastewater in irrigated agriculture—review of some practices in Spain and Greece. Agric. Water Manag. 97, 1233–1241. doi:10.1016/j.agwat.2010.03.003
Perez-Mercado, L. F., Lalander, C., Joel, A., Ottoson, J., Dalahmeh, S., and Vinnerås, B. (2019). Biochar filters as an on-farm treatment to reduce pathogens when irrigating with wastewater-polluted sources. J. Environ. Manag. 248, 109295. doi:10.1016/j.jenvman.2019.109295
Radingoana, M. P., Dube, T., and Mazvimavi, D. (2020). Progress in greywater reuse for home gardening: opportunities, perceptions and challenges. Phys. Chem. Earth, Parts A/B/C 116, 102853. doi:10.1016/j.pce.2020.102853
Renner, G., and Reuschenbach, M. (2023). Critical review on data processing algorithms in non-target screening: challenges and opportunities to improve result comparability. Anal. Bioanal. Chem. 415, 4111–4123. doi:10.1007/s00216-023-04776-7
Samanipour, S., Martin, J. W., Lamoree, M. H., Reid, M. J., and Thomas, K. V. (2019). Letter to the editor: optimism for nontarget analysis in environmental Chemistry. Environ. Sci. Technol. 53, 5529–5530. doi:10.1021/acs.est.9b01476
Schaffer, M., Kröger, K. F., Nödler, K., Ayora, C., Carrera, J., Hernández, M., et al. (2015). Influence of a compost layer on the attenuation of 28 selected organic micropollutants under realistic soil aquifer treatment conditions: insights from a large scale column experiment. Water Res. 74, 110–121. doi:10.1016/j.watres.2015.02.010
Schollée, J. E., Hollender, J., and McArdell, C. S. (2021). Characterization of advanced wastewater treatment with ozone and activated carbon using LC-HRMS based non-target screening with automated trend assignment. Water Res. 200, 117209. doi:10.1016/j.watres.2021.117209
Schulz, W., Lucke, T., Achten, C., Oberleitner, D., Balsaa, P., Hinnenkamp, V., et al. (2019). Use of non-target screening by means of LC-ESI-HRMS in water analysis. Guideline - edition 1.0 2019.
Schymanski, E. L., Jeon, J., Gulde, R., Fenner, K., Ruff, M., Singer, H. P., et al. (2014). Identifying small molecules via high resolution mass spectrometry: communicating confidence. Environ. Sci. Technol. 48, 2097–2098. doi:10.1021/es5002105
Seetaha, S., Khamplong, P., Wanaragthai, P., Aiebchun, T., Ratanabunyong, S., Krobthong, S., et al. (2022). KERRA, mixed medicinal plant extracts, Inhibits SARS-CoV-2 targets Enzymes and feline Coronavirus. Inhibits SARS-CoV-2 Targets Enzym. Feline Coronavirus. COVID 2, 621–632. doi:10.3390/covid2050046
Shahriar, A., Tan, J., Sharma, P., Hanigan, D., Verburg, P., Pagilla, K., et al. (2021). Modeling the fate and human health impacts of pharmaceuticals and personal care products in reclaimed wastewater irrigation for agriculture. Environ. Pollut. 276, 116532. doi:10.1016/j.envpol.2021.116532
Sobus, J. R., Wambaugh, J. F., Isaacs, K. K., Williams, A. J., McEachran, A. D., Richard, A. M., et al. (2018). Integrating tools for non-targeted analysis research and chemical safety evaluations at the US EPA. J. Expo. Sci. Environ. Epidemiol. 28, 411–426. doi:10.1038/s41370-017-0012-y
Tisler, S., Tüchsen, P. L., and Christensen, J. H. (2022). Non-target screening of micropollutants and transformation products for assessing AOP-BAC treatment in groundwater. Environ. Pollut. 309, 119758. doi:10.1016/j.envpol.2022.119758
Tokay Yılmaz, F. G., Tekin, G., Ersöz, G., and Atalay, S. (2023). Reclamation of real textile wastewater by sequential advanced oxidation and adsorption processes using corn-cob based materials. Environ. Pollut. 335, 122196. doi:10.1016/j.envpol.2023.122196
Valhondo, C., Carrera, J., Martínez-Landa, L., Wang, J., Amalfitano, S., Levantesi, C., et al. (2020a). Reactive barriers for renaturalization of reclaimed water during soil aquifer treatment. Water 12, 1012. doi:10.3390/w12041012
Valhondo, C., Duporté, G., Cabaret, G., Rosain, D., Gomez, E., and Luquot, L. (2023). Assessing the feasibility of sustainable materials to Boost the sorption of pharmaceutical active compounds when included in reactive barriers in soil aquifer treatment for water reuse. Water 15, 1393. doi:10.3390/w15071393
Valhondo, C., Martínez-Landa, L., Carrera, J., Díaz-Cruz, S. M., Amalfitano, S., and Levantesi, C. (2020b). Six artificial recharge pilot replicates to gain insight into water quality enhancement processes. Chemosphere 240, 124826. doi:10.1016/j.chemosphere.2019.124826
van Santen, J. A., Jacob, G., Singh, A. L., Aniebok, V., Balunas, M. J., Bunsko, D., et al. (2019). The natural products Atlas: an open access knowledge base for microbial natural products discovery. ACS Cent. Sci. 5, 1824–1833. doi:10.1021/acscentsci.9b00806
Verkh, Y., Rozman, M., and Petrovic, M. (2018). A non-targeted high-resolution mass spectrometry data analysis of dissolved organic matter in wastewater treatment. Chemosphere 200, 397–404. doi:10.1016/j.chemosphere.2018.02.095
Verma, K., Manisha, M., Shivali, N., Santrupt, R., Anirudha, T., Ramesh, N., et al. (2023). Investigating the effects of irrigation with indirectly recharged groundwater using recycled water on soil and crops in semi-arid areas. Environ. Pollut. 337, 122516. doi:10.1016/j.envpol.2023.122516
Wang, X., Yu, N., Yang, J., Jin, L., Guo, H., Shi, W., et al. (2020). Suspect and non-target screening of pesticides and pharmaceuticals transformation products in wastewater using QTOF-MS. Environ. Int. 137, 105599. doi:10.1016/j.envint.2020.105599
Want, E. J., Masson, P., Michopoulos, F., Wilson, I. D., Theodoridis, G., Plumb, R. S., et al. (2013). Global metabolic profiling of animal and human tissues via UPLC-MS. Nat. Protoc. 8, 17–32. doi:10.1038/nprot.2012.135
Keywords: non-target analysis, differential analysis, nature-based materials water treatment, emerging contaminants, matrix effect
Citation: Guy C, Duporté G, Luquot L and Gomez E (2024) Non-target screening to track contaminant removal and release during nature-based water treatment. Front. Environ. Sci. 12:1385806. doi: 10.3389/fenvs.2024.1385806
Received: 13 February 2024; Accepted: 22 March 2024;
Published: 17 April 2024.
Edited by:
Pedro Neves Carvalho, Aarhus University, DenmarkReviewed by:
Linyan Zhu, Aarhus University, DenmarkGianluigi Buttiglieri, Catalan Institute for Water Research, Spain
Copyright © 2024 Guy, Duporté, Luquot and Gomez. This is an open-access article distributed under the terms of the Creative Commons Attribution License (CC BY). The use, distribution or reproduction in other forums is permitted, provided the original author(s) and the copyright owner(s) are credited and that the original publication in this journal is cited, in accordance with accepted academic practice. No use, distribution or reproduction is permitted which does not comply with these terms.
*Correspondence: Elena Gomez, maria-elena.gomez-hernandez@umontpellier.fr