Advancing air quality forecasting in Abu Dhabi, UAE using time series models
 Mona S. Ramadan
 Abdelgadir Abuelgasim
 Naeema Al Hosani1
- 1Geography and Urban Sustainability Department, College of Humanities and Social Sciences, UAE University, Al Ain, United Arab Emirates
- 2Rabdan Academy, Abu Dhabi, United Arab Emiates
This research enhances air quality predictions in Abu Dhabi by employing Autoregressive Integrated Moving Average (ARIMA) models on comprehensive air quality data collected from 2015 to 2023. We collected hourly data on nitrogen dioxide (NO2), particulate matter (PM10), and fine particulate matter (PM2.5) from 19 well-placed ground monitoring stations. Our approach utilized ARIMA models to forecast future pollutant levels, with extensive data preparation and exploratory analysis conducted in R. Our results found a significant drop in NO2 levels after 2020 and the highest levels of particulate matter observed in 2022. The findings of our research confirm the effectiveness of the models, indicated by Mean Absolute Percentage Error (MAPE) values ranging from 7.71 to 8.59. Additionally, our study provides valuable spatiotemporal insights into air pollution historical evolution, identifying key times and areas of heightened pollution, which can help in devising focused air quality management strategies. This research demonstrates the potential of ARIMA models in precise air quality forecasting, aiding in proactive public health initiatives and environmental policy development, consistent with Abu Dhabi’s Vision 2030.
1 Introduction
Air pollution, characterized by the presence of harmful substances like nitrogen dioxide (NO2), particulate matter (PM10), and fine particulate matter (PM2.5), poses significant threats to both human health and environmental integrity. Exposure to these pollutants is linked to a spectrum of health complications, from respiratory issues to life-threatening diseases such as cancer and heart conditions, emphasizing the vital necessity for proactive air quality management strategies (Sharma et al., 2018; Samal et al., 2019). In the domain of environmental science, the formulation of statistical models for air quality prediction is crucial, particularly in Abu Dhabi, where they provide essential insights for environmental management. These models equip scientists and policymakers with the ability to forecast pollution levels and dissect the spatial and temporal patterns of air pollutants. Their approaches span from straightforward linear models to complex machine learning methods, each shedding light on the dynamics influencing air quality variations and the efficacy of interventions designed to curtail pollution (Rao et al., 2012). As a result, the tasks of monitoring, assessing, and predicting air quality have become increasingly crucial, particularly in the context of disease outbreaks ((Nimesh et al., 2014; Samal et al., 2019; Taufik et al., 2020; Liu B. et al., 2021; Ramadan and Ramadan, 2022)). This has led to the development of advanced tools for evaluating pollution ((Liu B. et al., 2021; Liu H. et al., 2021; Huang et al., 2021; Liao et al., 2021; Effat et al., 2022; Ramadan et al., 2022)).
Contemporary programming technologies facilitate the analysis of environmental data on a grand scale through specialized functions ((Zhang et al., 2019; Setiawan et al., 2020; Huang et al., 2021)). The R programming language, created by Ihaka and Gentleman and renowned for its statistical computing capabilities, is a prime example (Kazi et al., 2023). Its capacity for extension through additional packages allows for a wide range of ecological applications ((Kembel et al., 2010; Carslaw and Ropkins, 2012; Frichot and François, 2015; Guenzi et al., 2017; Patil et al., 2020; Setiawan et al., 2020; Stanke et al., 2020; Lemenkova and Debeir, 2022)).
Notably, Autoregressive Integrated Moving Average (ARIMA) models have garnered acclaim for their precision in predicting air quality metrics by analyzing historical evolution. Esteemed for their adept handling of time series data, which often display historical evolution, seasonality, and autocorrelation, ARIMA models are instrumental in navigating the characteristic fluctuations in air quality readings (Basagaña et al., 2013; Young et al., 2016).
Globally, statistical models like ARIMA have proven their versatility and efficacy in air quality research. In regions experiencing swift industrial expansion, such as Asia, ARIMA models have been crucial in forecasting pollution historical evolution, and facilitating the development of timely and efficient air quality management strategies (Zhao et al., 2018). In the urban landscapes of Europe and North America, these models have been pivotal in evaluating the impact of vehicle emissions and industrial activities on air quality, guiding emissions reduction policies (Abhilash et al., 2018).
ARIMA models have shown their prowess in accurately forecasting time series data affected by non-stationarity. For example, (Koo et al., 2020), underscored the efficacy of ARIMA in predicting PM10 levels in Malaysia, demonstrating the model’s capacity to capture the seasonal variances in air pollutant concentrations. Similarly, (Katsoulis and Pnevmatikos, 2009), successfully applied ARIMA models to predict daily PM10 concentrations in Athens, Greece, showcasing the model’s adaptability across diverse environmental settings. Comparative analyses, such as the study by (Peralta et al., 2022), which evaluated neural networks against ARIMA models for air pollution forecasting in Santiago, Chile, revealed that despite neural networks’ marginally better accuracy, ARIMA models’ simplicity and interpretability render them a practical option for air quality prediction. The employment of statistical models for air quality assessment in developing nations has been particularly noteworthy. (Saraswat, 2015). leveraged multiple linear regression models to examine the influence of traffic volume on NO2 and PM2.5 levels in New Delhi, India, highlighting statistical models’ role in shaping traffic and pollution management policies in cities experiencing rapid urban growth.
Despite their extensive application, the adoption of statistical models, including ARIMA, for air quality forecasting in the Middle East, especially Abu Dhabi, remains sparse. This study aims to bridge this gap by implementing ARIMA models in a bespoke forecasting framework that leverages RStudio and Abu Dhabi’s air quality data. Considering the region’s distinct environmental challenges, like dust storms and rapid urbanization (Abuelgasim and Farahat, 2020)., a customized forecasting approach is imperative. This research seeks to refine ARIMA models’ predictive accuracy for principal pollutants (NO2, PM10, PM2.5), offering essential insights to direct specific air quality governance measures in Abu Dhabi.
2 Materials and methods
2.1 Study Area
This study centers on the Emirate of Abu Dhabi, the largest of the UAE’s emirates, encompassing more than three-quarters of the nation’s total area, as shown in Figure 1. Situated in the UAE’s western part, it shares borders with Saudi Arabia and Oman and is home to the capital city, Abu Dhabi City (24°28′0.0012″N, 54°22′0.0084″E). The emirate stands out due to its distinct blend of environmental, climatic, and socio-economic elements. Characterized by a hot desert climate, Abu Dhabi experiences intense heat, high humidity, and winds carrying sand, complicating the dispersion and management of air pollutants (Böer, 1997). Dust storms, frequently arising from the desert, industrial areas, and major roads, not only reduce visibility but also carry particulate matter and heavy metals across urban areas and beyond national boundaries ((Farahat et al., 2016; Tawabini et al., 2017)). Monitoring air quality in such conditions is crucial for both public health and the promotion of sustainable urban growth, in alignment with the environmental quality goals of Abu Dhabi’s Vision 2030. Given the commonality of dust storms and industrial pollution, Abu Dhabi presents an ideal scenario for applying ARIMA modeling with R to explore the spatiotemporal dynamics of air pollution levels.
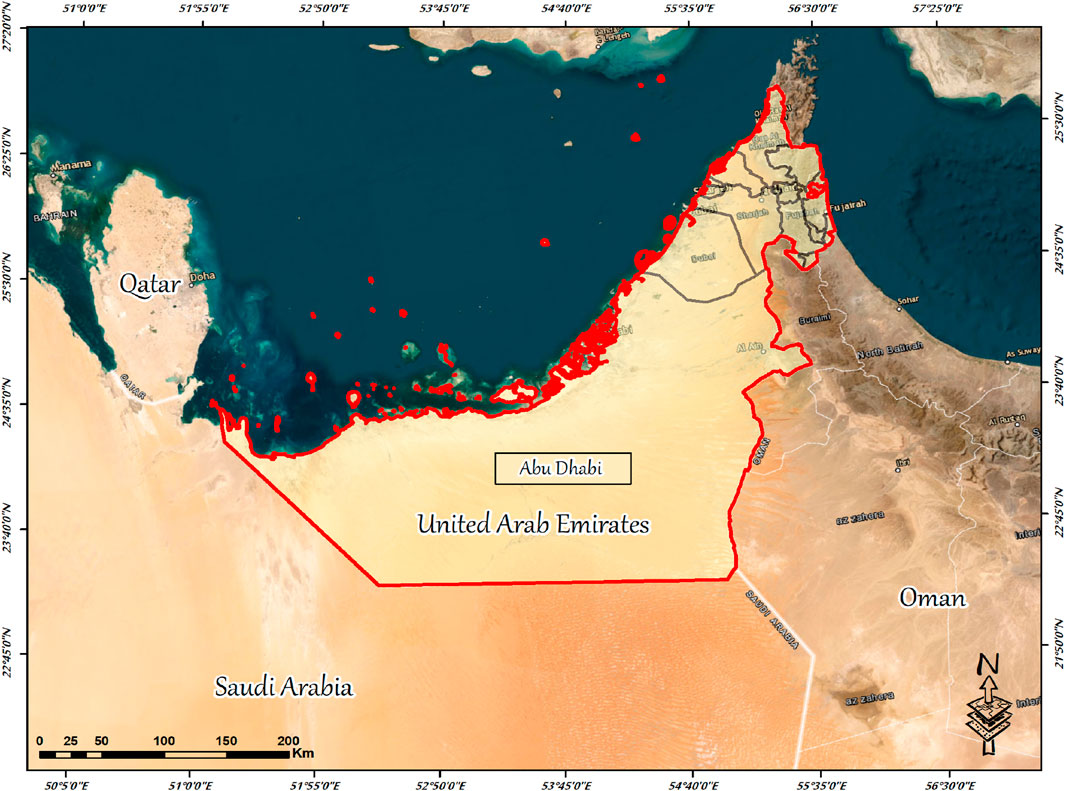
Figure 1. Location of the study area.
2.2 Materials
2.2.1 Data collection
In this research, air quality metrics were assessed through hourly recordings of nitrogen dioxide (NO2), particulate matter ≤10 μm (PM10), and ≤2.5 μm (PM2.5) collected from 2015 to the beginning of 2023. These records were obtained from the Abu Dhabi Air Quality Portal (https://www.adairquality.ae/), which compiles data from 19 ground-based monitoring stations positioned as shown in Figure 2, strategically throughout the urban and industrial sectors of the Abu Dhabi Emirate (Environment Agency - Abu Dhabi, 2023). The extensive data collected from these stations serves as a solid basis for the examination of air quality patterns and the projection of future air conditions.
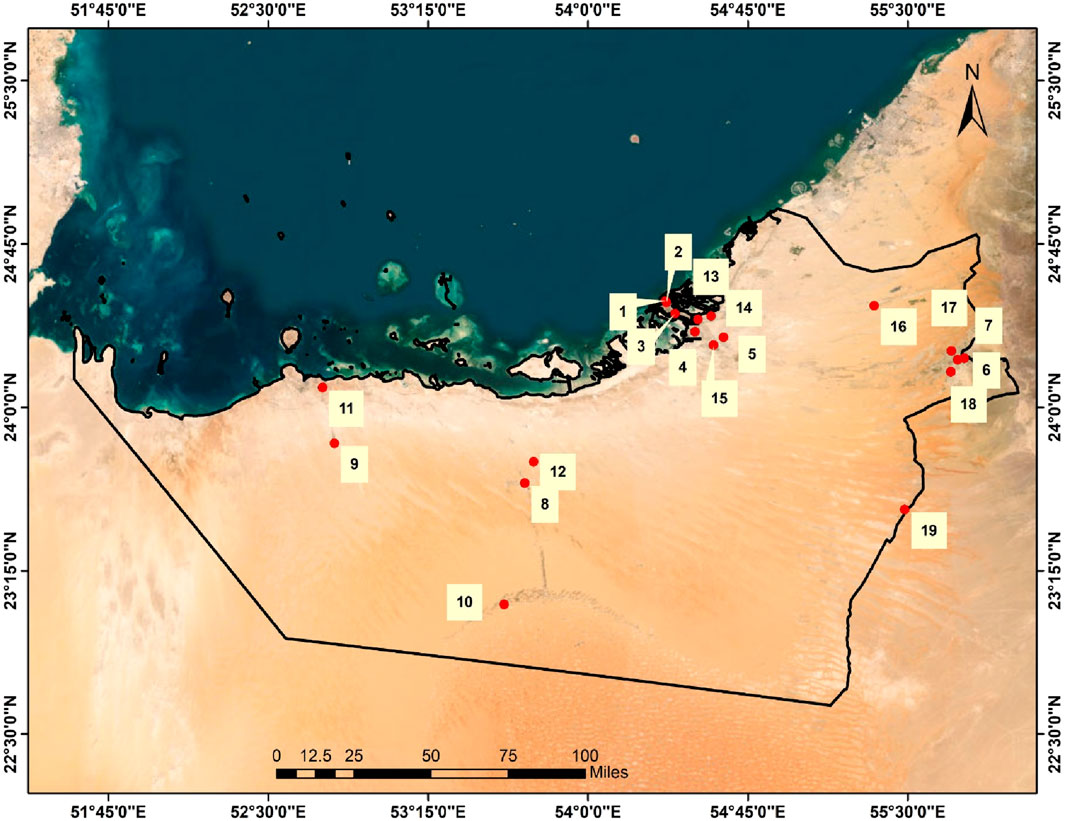
Figure 2. Locations Map of Air Quality ground-based monitoring stations in Abu Dhabi, UAE.
2.3 Methodology
The study’s analysis centered on pollutants NO2, PM10, and PM2.5, employing the R programming language for data processing and visualization, alongside ARIMA models for forecasting. Data preparation, including outlier removal and filling in missing values, along with preliminary exploratory analyses, were conducted using R language and R Studio. The Openair package within R Studio facilitated the calculation of daily, monthly, and yearly averages, as well as their visualization. Spatial analyses were performed by comparing mean values across monitoring stations using tables, rankings, and maps. Temporal historical evolution was examined across various timeframes—hourly, daily, monthly, and yearly—utilizing line graphs, heat maps, and time series decomposition methods. The study also explored cross-correlations to understand the relationships between different pollutants. For forecasting, this research adopted specific methods contained within the forecast package of R-Studio, a suite that offers a wide range of techniques for time series analysis (Hyndman and Khandakar, 2008). The following sections detail the particular forecasting approaches used in this investigation.
2.3.1 ARIMA model
Initially, we planned to use a Seasonal Autoregressive Integrated Moving Average (SARIMA) model for our study because of its ability to handle both seasonal and non-seasonal variations in time-series data (Amaefula, 2021), a key aspect for effective air quality prediction. However, during the early stages of data analysis, we carried out various diagnostic tests to check for seasonality in the air quality data from Abu Dhabi.
These tests included examining the autocorrelation and partial autocorrelation functions and performing seasonal decomposition to spot any consistent patterns at certain intervals in the data. Unexpectedly, the results showed little or no significant seasonal patterns in the levels of pollutants like PM2.5, PM10, and NO2 over the examined periods. This absence of marked seasonality indicated that the additional complexity of a seasonal model like SARIMA might be unnecessary and could even cause overfitting. In light of these results, we adjusted our strategy to better match the observed data characteristics. We chose to use the Autoregressive Integrated Moving Average (ARIMA) model instead, which is well-suited for forecasting time series that show historical evolution but not seasonality (Khashei et al., 2012). ARIMA models are not only more straightforward but also versatile enough to effectively model the non-seasonal historical evolution we observed in our data.
This shift adheres to the principle of model parsimony, which emphasizes using the simplest possible model without compromising its ability to explain the data (Shumway et al., 2017). ARIMA models, which combine autoregression (AR), integration I), and moving average (MA), provide a strong basis for prediction in scenarios like ours, where the data is primarily influenced by historical evolution and non-seasonal changes.
Seasonal ARIMA models were developed to analyze the monthly data for PM10, PM2.5, and NO2. The models’ accuracy was tested by comparing their forecasts against actual data from a held-out test period spanning 2022-2023. The Autoregressive Integrated Moving Average (ARIMA) modeling process involved applying the Auto ARIMA function to both daily and monthly datasets covering the years 2015–2021. The ARIMA framework combines autoregressive (ARI) elements with moving average (MA) components, offering a robust method for examining time series data that exhibits consistent patterns.
• Autoregressive (ARI) Model: The ARI model posits that future values in the series are linearly dependent on previous observations (Kaur et al., 2023), formalized in Eq. 1 as
• Moving Average (MA) Model: The MA model suggests that current series values are linear functions of past forecast errors (Jaiswal et al., 2018), represented in Eq. 2 as MA(q):
By amalgamating ARI(p) and MA(q), the ARIMA model characterizes the current observation of a time series as shown in Eq. 3, employing ARMA of order (p, q):
2.3.2 Evaluation and comparison of forecasting models
Subsequently, the optimal model was utilized to project air quality values from 2022 to July 2023. The model’s precision was quantified using the Mean Absolute Percentage Error (MAPE). It is critical to evaluate the performance of forecasting models to verify their predictive accuracy and to facilitate comparisons among various forecasting techniques. Enhancing the accuracy of predictions is usually the main goal in forecasting tasks. Due to the limitations of the Akaike Information Criterion (AIC) in comparing models from different families (for example, ARIMA versus Holt-Winters) (Ilyas et al., 2024), other criteria are adopted for the assessment and comparison of models. This research chose to use the Mean Absolute Percentage Error (MAPE) as one of these criteria because of its broad recognition and ease of use in time-series forecasting, especially in the context of predicting levels of NO2, PM10, and PM2.5 (Garg et al., 2021; Rahman et al., 2023).
2.3.2.1 The mean absolute percentage error (MAPE)
MAPE is used to measure the precision of the forecasting model, as outlined in Eq. 4. This involves taking the average of the absolute differences between the predicted and actual values, normalizing these differences by the actual values, and then expressing the result as a percentage. The choice of this metric is largely attributed to its capacity to convert errors into a percentage form, making the accuracy of forecasts easier to comprehend intuitively. The accuracy of the model is then determined using Eq. 5.
2.3.3 Data preparation and analysis
In our investigation, we implemented a structured approach to predict air quality, concentrating on utilizing the ARIMA model. This process involved preparing the data through cleansing and filling in missing values, conducting exploratory data analysis to uncover historical evolution and seasonal behaviors, and employing ARIMA for prediction purposes. The details of these phases are efficiently depicted in Figure 3.
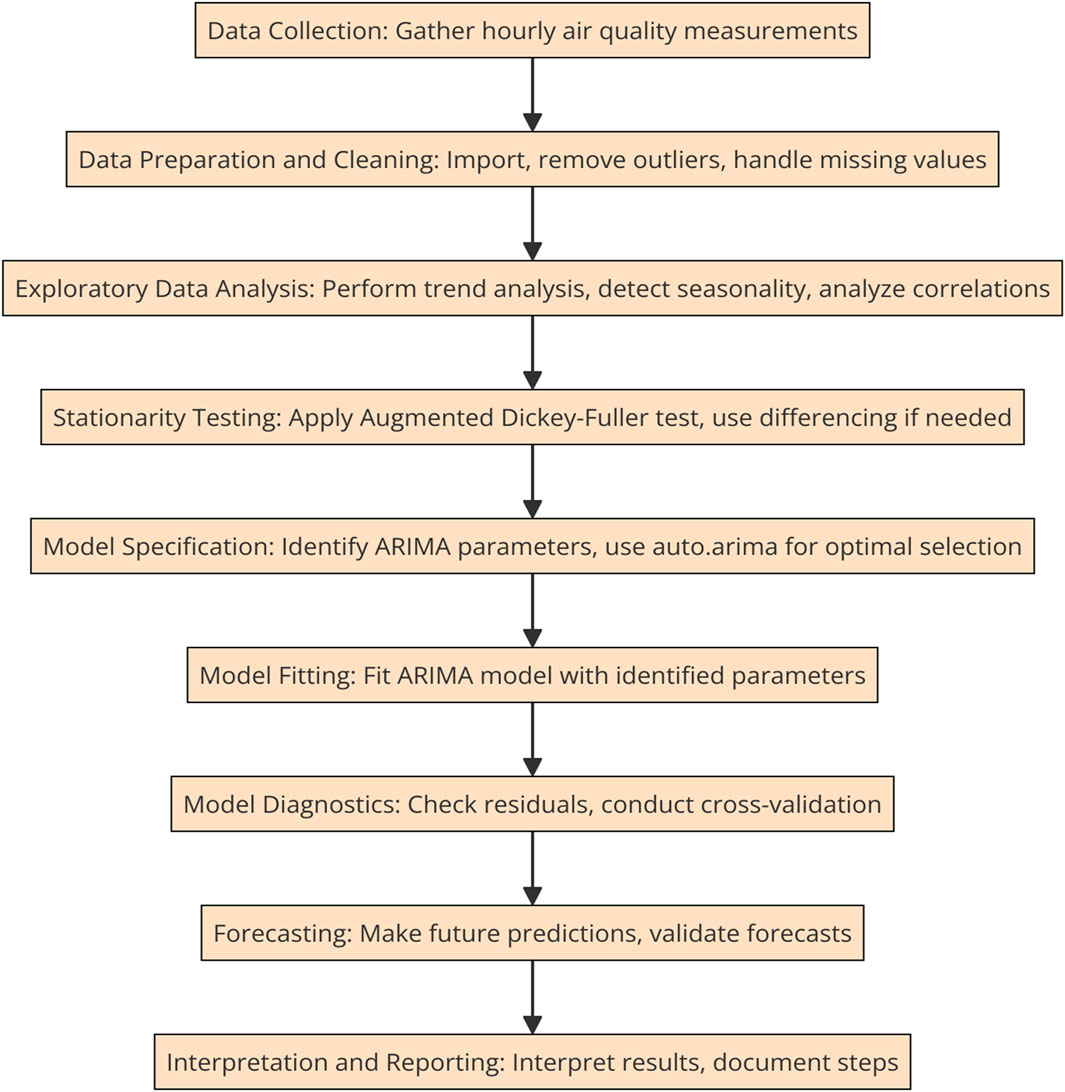
Figure 3. Diagrammatic representation of the research methodology.
This diagram outlines the methodical steps followed in our approach to forecasting air quality, beginning with data preparation, where anomalies are spotted and gaps are filled, moving on to exploratory analysis to unearth patterns, historical evolution, and seasonal factors. The culmination of this process is the use of the ARIMA model for predicting future air quality indices. Every step is vital to guarantee the precision and dependability of our predictions, with further information on the model’s specification and its validation discussed in the related text.
2.3.4 Addressing data gaps
During our investigation, we faced challenges with missing entries in the datasets concerning NO2, PM10, and PM2.5 concentrations. These missing points accounted for around 5% of the total data, a figure within the expected range for environmental research due to factors like equipment errors and maintenance breaks (Alsaber et al., 2021). To tackle these gaps, we integrated linear interpolation with the method of carrying forward the last observed data for brief interruptions spanning one to 3 hours (Chastko and Adams, 2019). This strategy preserved the continuous flow of our data series and did not significantly distort the original statistical characteristics. Our methodology ensured the preservation of our analysis’s depth and accuracy, with subsequent evaluations showing minimal effect on the predictive capabilities of our models. Further analysis verified the resilience of our results, demonstrating consistent predictions despite different methods of managing missing data.
2.3.5 Evaluating ARIMA model accuracy through time series cross-validation
To evaluate the accuracy and predictive capabilities of our ARIMA models, we utilized time series cross-validation. This method splits the time series data into training and testing segments, which allows us to gauge how the model performs on new, unseen data (Ramos and Oliveira, 2016).
For our analysis, the dataset was divided into two primary sections: a training set and a test set. The training set includes 80% of the data, spanning from 2015 to 2020. We chose this period for training due to its comprehensive historical data on air quality, which exhibits extensive variability and historical evolution in pollution over several years. Using a significant portion of the data for training is essential for creating a model that is well-adjusted and can identify complex patterns within the data. The remaining 20% of the data, from 2021 to early 2023, was designated as the test set. This segment was specifically selected to evaluate the model against the latest data. Testing the model with recent data is crucial because it measures the model’s effectiveness against current pollution historical evolution and recent changes in regulations that might not have been as significant in the earlier data (Mani and Viswanadhapalli, 2022). This strategy ensures the model remains current and accurate for predicting immediate and future historical evolution.
The data was split sequentially, maintaining the chronological order of the collection. This approach preserves the temporal structure of the time series, ensuring the training and testing data represent a natural time progression without any overlap or data contamination between the sets (Hasnain et al., 2022). By training our model on an extensive historical dataset and testing it against the latest available data, we ensure both the precision and practical relevance of our predictive insights, which are vital for policymakers and environmental planners involved in managing air quality.
2.3.6 Comparative performance analysis: ARIMA vs. persistence and linear regression models
In assessing our ARIMA model, we compared its predictive performance against that of persistence models and simple linear regression. Persistence models, based on the assumption that future conditions mirror the current ones, and linear regression, predicting future air quality levels from past data historical evolution, served as our comparative baselines (Turias et al., 2008; Basha et al., 2017).
3 Results and discussion
3.1 Station variability analysis
Table 1 outlines the mean concentrations of NO2, PM10, and PM2.5 across different monitoring stations, using a color gradient from green to yellow to rank the average values in an ascending manner. Remarkably, Station 15 (Al Mafraq) shows the highest aggregate levels of these pollutants, with Station 4 (Mussafah) also registering high levels of pollutants, trailing slightly behind.
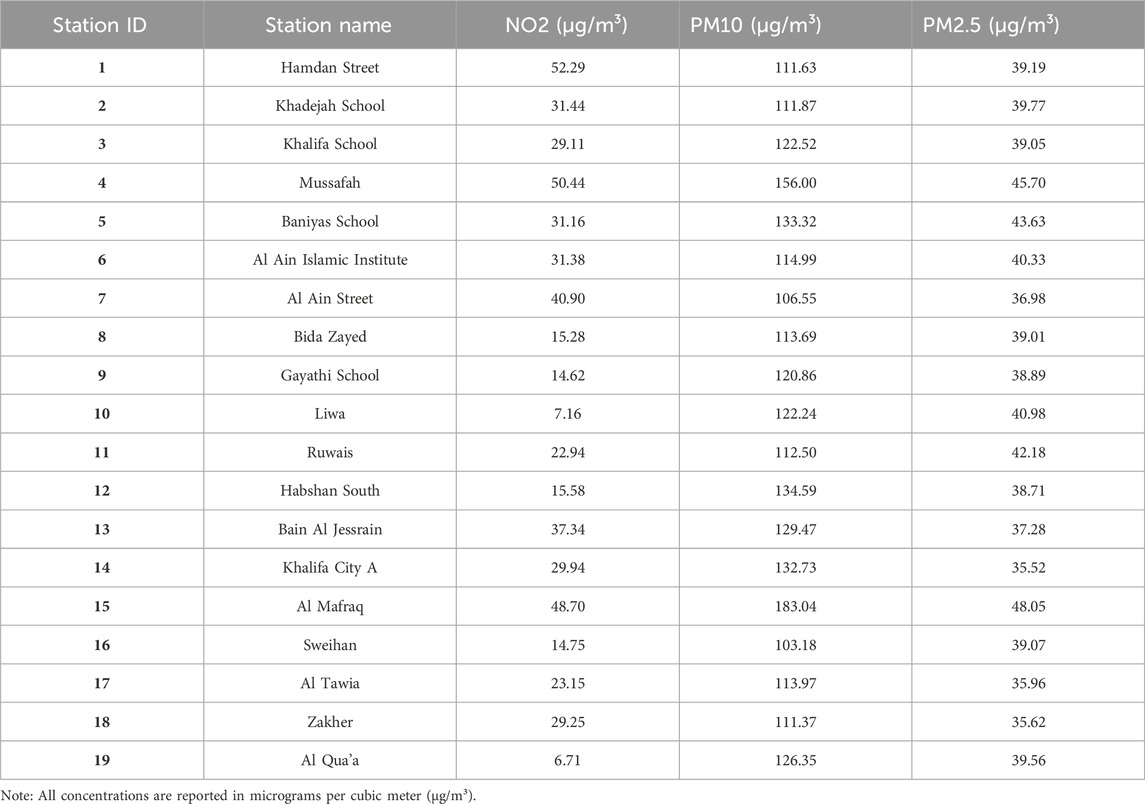
Table 1. NO2, PM10 & PM2.5 means by station.
The results illustrate that the mean concentrations of NO2, PM10, and PM2.5, respectively, as recorded at different monitoring locations. It is significant to mention that the station in Al Qua’a reported the lowest average hourly concentration of NO2, at 6.71 μg/m³, with the Liwa station having a slightly higher average of 7.16 μg/m³. On the opposite end, the highest average hourly concentration of NO2 was found at the Hamdan Street station, which recorded a level of 52.29 μg/m³, closely followed by the Mussafah station, where the average was 50.44 μg/m³.
The lowest hourly average concentration of PM10 was observed at the Sweihan station, recording a value of 103.18 μg/m³, followed by Al Ain Street, which noted a concentration of 107.16 μg/m³. In contrast, the highest hourly mean concentration of PM10 was measured at the Al Mafraq station, reaching 183.04 μg/m³, with the Mussafah station showing the second highest level at 156 μg/m³.
The lowest hourly average concentration of PM2.5 was found at the Khalifa City A station, with a measurement of 35.52 μg/m³. Conversely, the highest hourly average concentration of PM2.5 was detected at the Al Mafraq station, which recorded 48.05 μg/m³, with the Mussafah station closely trailing with an average of 45.7 μg/m³. Most of the stations reported average PM2.5 concentrations falling within the 35–39 μg/m³ range.
The analysis by station reveals considerable differences in the levels of pollutants, particularly noting that locations such as Al Mafraq and Mussafah show elevated pollution figures. This variation emphasizes the impact of nearby emission sources, including industrial operations and vehicular traffic, on the quality of air. The observed spatial diversity in pollution concentrations stresses the need for policy measures tailored to specific areas and highlights the critical role of local environmental and socio-economic considerations in devising strategies for air quality management (Sharifi et al., 2021).
3.2 Temporal Historical evolution analysis
Table 2 showcases the statistical breakdown for the pollutants NO2, PM10, and PM2.5 across the 19 monitoring stations, detailing the minimum, average, median, maximum values, standard deviation, and the count of missing data points. The significant difference observed between the median and maximum values indicates outliers in the dataset. To mitigate this issue, the average value from each station was employed to fill in missing entries and replace outlier values.
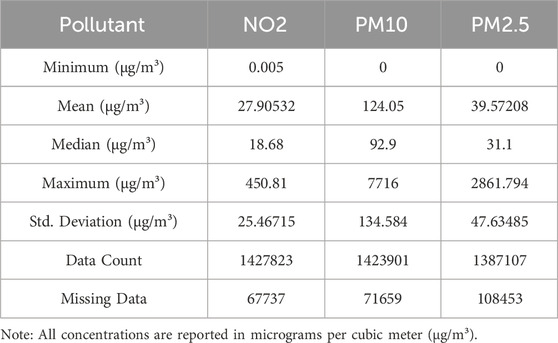
Table 2. Summary of all station’s hourly data.
Figures 4–6 display the changes in daily, monthly, and yearly averages for NO2, PM10, and PM2.5 spanning from 2015 to 2023, after correcting for missing data and outliers at all monitoring locations. The daily averages for NO2 generally fluctuated between 20 and 35 μg/m³, with a distinct decrease in the daily and monthly averages of NO2 noted after the year 2020. Similarly, the emissions historical evolution for PM10 and PM2.5 showed a steady rise starting in January, reaching their highest levels in July, and then beginning to fall. The year 2022 stood out for having significantly higher concentrations of PM10 and PM2.5. Additionally, 2018 was highlighted as the year with the peak emissions for all three pollutants.
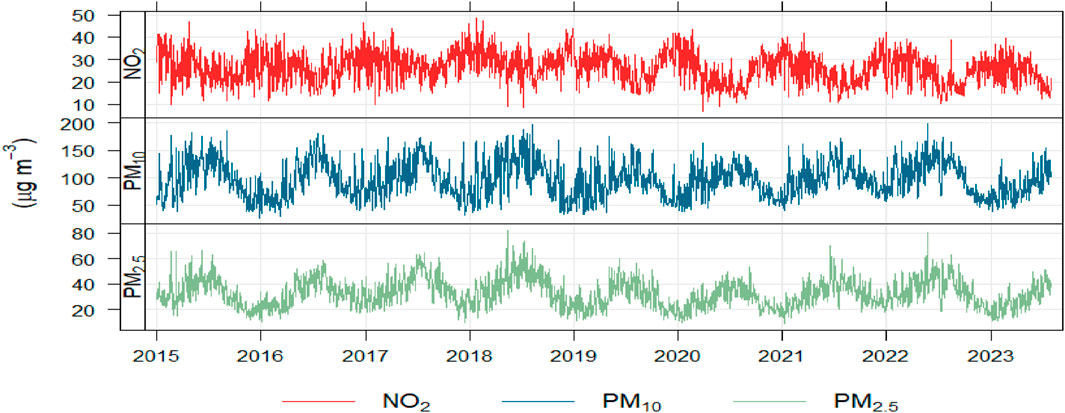
Figure 4. Daily spatially averaged values across all monitoring stations.
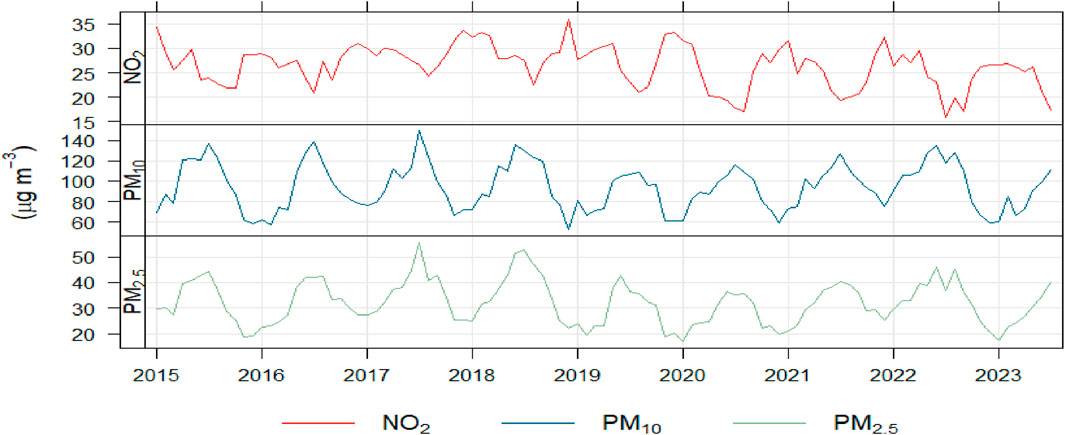
Figure 5. Monthly spatially averaged values across all monitoring stations.
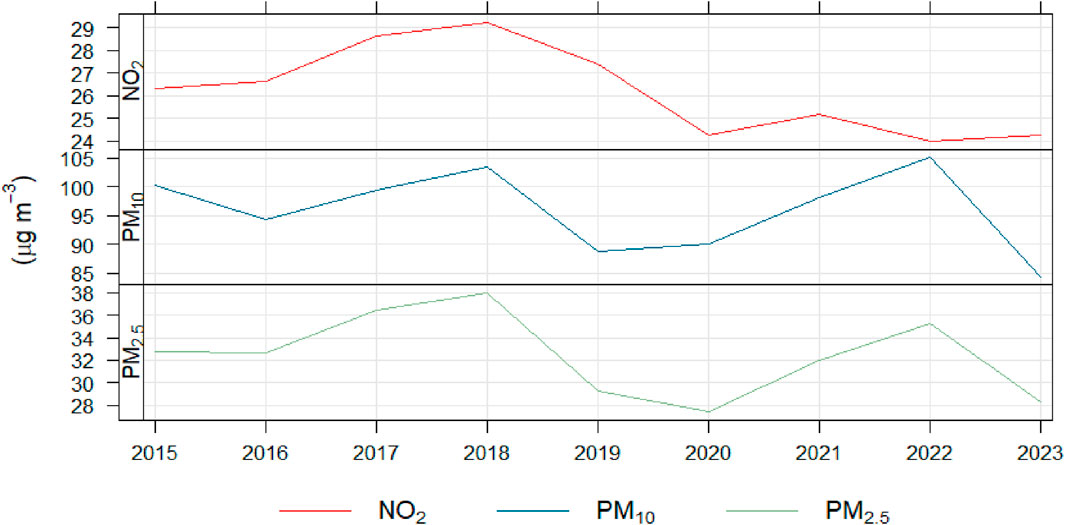
Figure 6. Yearly spatially averaged values across all monitoring stations.
Figure 7 vividly depicts the time-based changes in concentrations of NO2, PM10, and PM2.5 across the 19 monitoring stations. During the day, PM10 and PM2.5 levels show slight variations but are generally higher during daylight hours than at night. On the other hand, NO2 concentrations display more pronounced changes, with peaks occurring from 9 to 11 a.m. Weekly historical evolution reveals that NO2 and PM2.5 levels maintain a relative consistency, whereas PM10 concentrations are significantly higher on Sundays and Mondays.
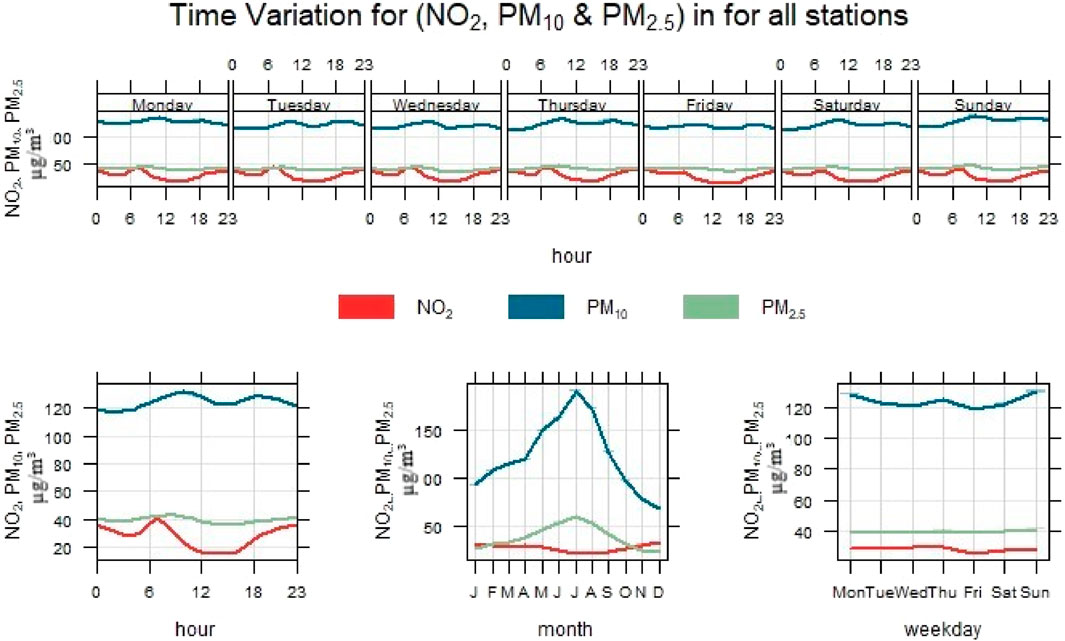
Figure 7. Hourly, monthly, and weekly cycles for the spatially averaged air quality values.
Looking at the yearly historical evolution, both PM10 and PM2.5 levels gradually rise through the first 5 months, peaking in July, then decrease. NO2 levels, in contrast, show little change on a monthly basis but experience a noticeable drop from April to July, followed by an increase, showcasing a clear seasonal variation.
Figures 8–10 depict the fluctuations in concentrations of NO2, PM10, and PM2.5 across different months and hours of the day, serving as alternative representations of underlying historical evolution.
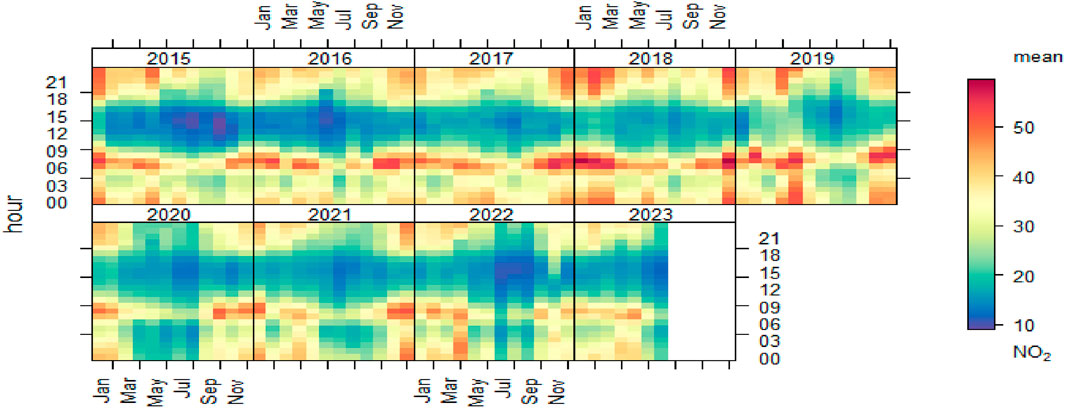
Figure 8. Historical evolution heat maps for NO2 levels in all stations. Note: All concentrations are reported in micrograms per cubic meter (µg/m³).
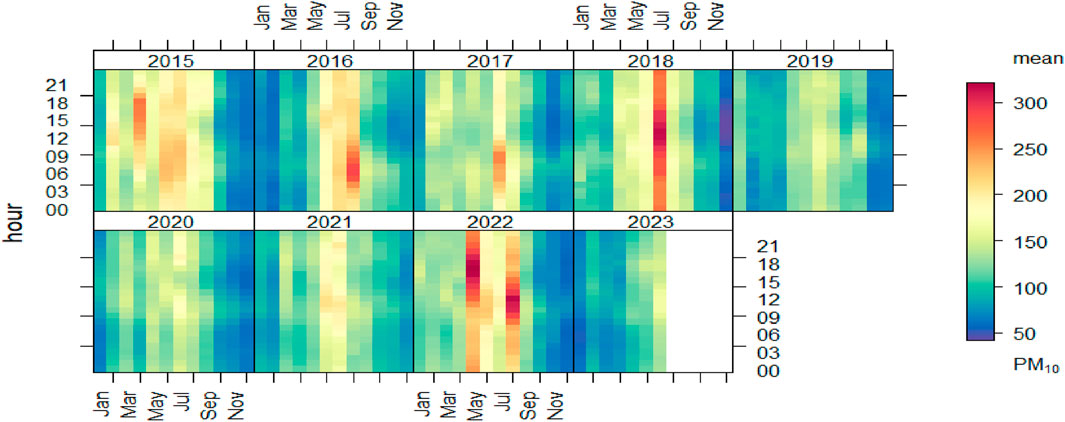
Figure 9. Historical evolution heat maps for PM10 levels in all stations. Note: All concentrations are reported in micrograms per cubic meter (µg/m³).
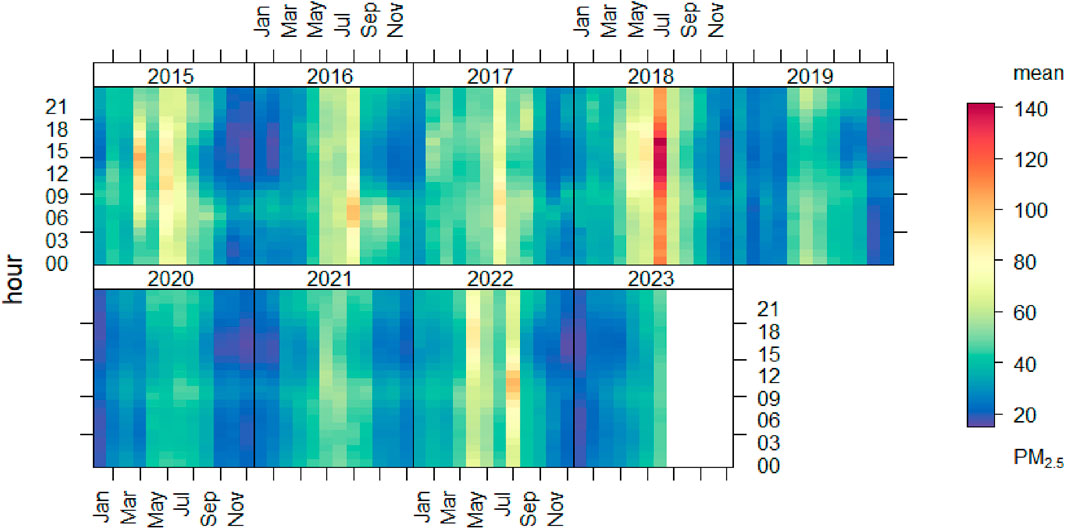
Figure 10. Historical evolution heat maps for PM2.5 levels in all stations. Note: All concentrations are reported in micrograms per cubic meter (µg/m³).
The findings from the Temporal Historical evolution Analysis indicate significant fluctuations in the levels of NO2, PM10, and PM2.5 across the 19 monitoring stations. The noted reduction in NO2 emissions on a daily and monthly basis after 2020, coupled with the heightened occurrences of PM10 and PM2.5 in 2022, point to a changing air quality landscape potentially shaped by regulatory measures and socio-economic factors. The marked seasonal historical evolution, with pollutant concentrations peaking in July, are consistent with observations from urban studies which have identified increased levels of particulate matter during the warmer months, attributed to intensified atmospheric chemical reactions and possibly greater human activity (Zhai et al., 2019). The approach of utilizing average values to address missing data and outliers, as implemented in this methodology, aligns with established practices in environmental data handling, thus confirming the reliability of the historical evolution analysis. These outcomes support the initial goal by underscoring the temporal patterns in air quality, reflecting the impact of human actions and possibly the effectiveness of environmental policies. The downward historical evolution in NO2 emissions may reflect the success of measures aimed at reducing emissions or alterations in patterns of urban transport. Understanding the seasonal peaks in pollutant levels during the hotter months is essential for pinpointing pollution sources and developing targeted mitigation plans.
3.3 Correlation analysis
Table 3 includes Pearson correlation coefficients to shed light on the relationships between the three pollutants. A strong positive correlation is observed between PM10 and PM2.5, as illustrated in Figure 11. In contrast, the correlation coefficients between NO2 and both PM10 and PM2.5 are minimal, nearly zero, suggesting there is no significant association between these pollutants.
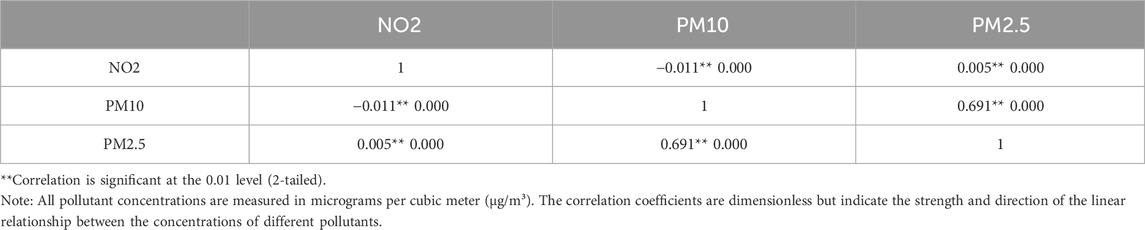
Table 3. Pearson correlation coefficients between NO2, PM10 &PM2.5.
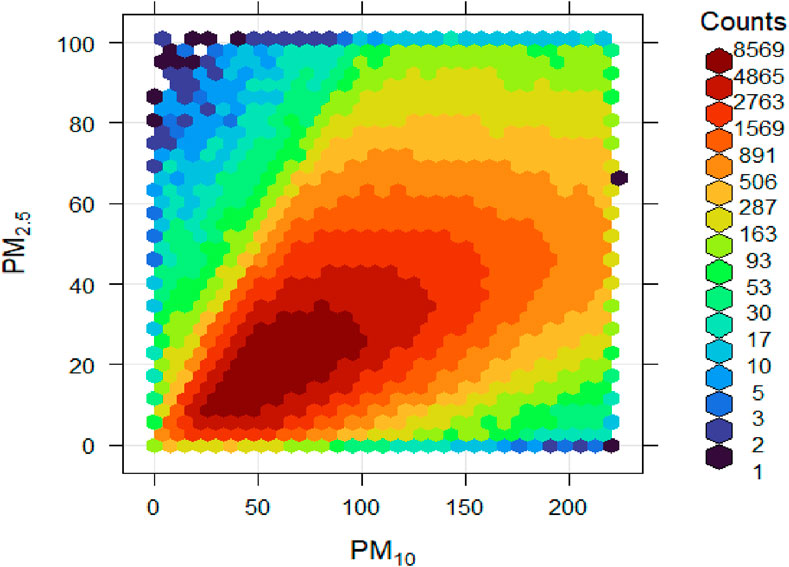
Figure 11. Scatter plot PM10 &PM2.5. Note: All concentrations are reported in micrograms per cubic meter (µg/m³).
In our correlation analysis, we examined the relationships between the concentrations of nitrogen dioxide (NO2), particulate matter (PM10), and fine particulate matter (PM2.5) across the monitoring stations. All concentrations were measured in micrograms per cubic meter (µg/m³). The Pearson correlation coefficients calculated indicate the degree of linear association between these pollutants. Notably, the correlation between PM10 and PM2.5 was strong and positive (r = 0.691), suggesting that these particles often co-occur and may have common sources or similar formation mechanisms. Conversely, NO2 showed little to no correlation with PM10 (r = −0.011) and PM2.5 (r = 0.005), indicating distinct sources or behaviors in the atmosphere. This underscores the intricate nature of urban air pollution and highlights the importance of adopting strategies that address multiple pollutants simultaneously in air quality management practices.
3.4 Forecasting models
Table 4 outlines the ARIMA (Autoregressive Integrated Moving Average) models, the predictions of the levels of PM10, PM2.5, and NO2 were intended for the years 2022–2023, based on data spanning from 2015 to 2021. The Mean Absolute Percentage Error (MAPE) values, which fall between 7.71 and 8.59, demonstrate a high level of accuracy in fitting the historical data.
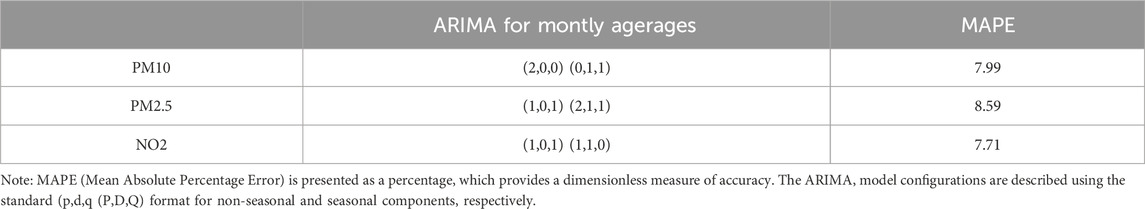
Table 4. ARIMA Models For PM10,PM2.5&NO2 and their MAPE for all stations 2022-2023.
Figures 12–14 display the monthly average levels of PM10, PM2.5, and NO2 respectively based on data collected from 2015 to 2021, which were intended for prediction for the years 2022–2023, generated by the ARIMA models described in Table 4. The forecasts, shown with a blue line, along with their confidence intervals, match closely with the actual observed data, represented by a red line, showcasing the efficacy of the ARIMA model predictions.
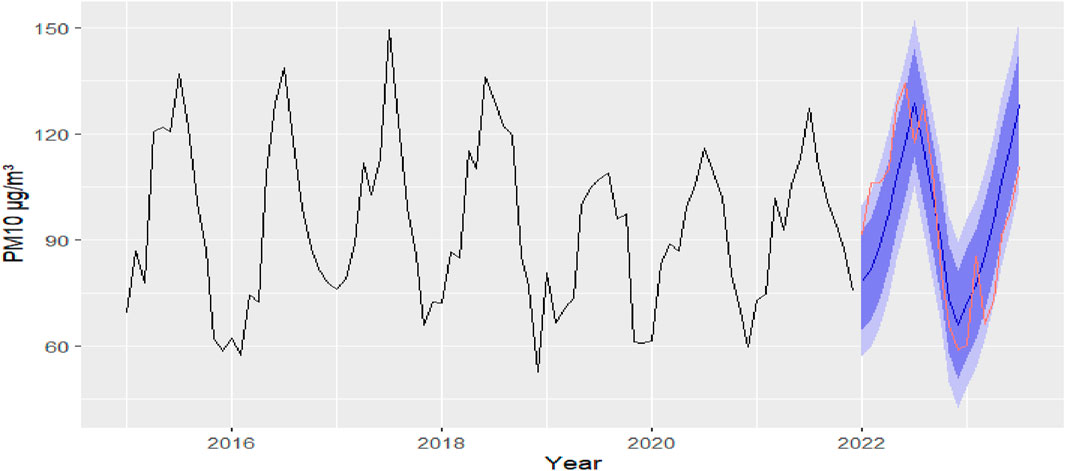
Figure 12. Seasonal ARIMA forecast of PM10 for all stations 2022-2023.
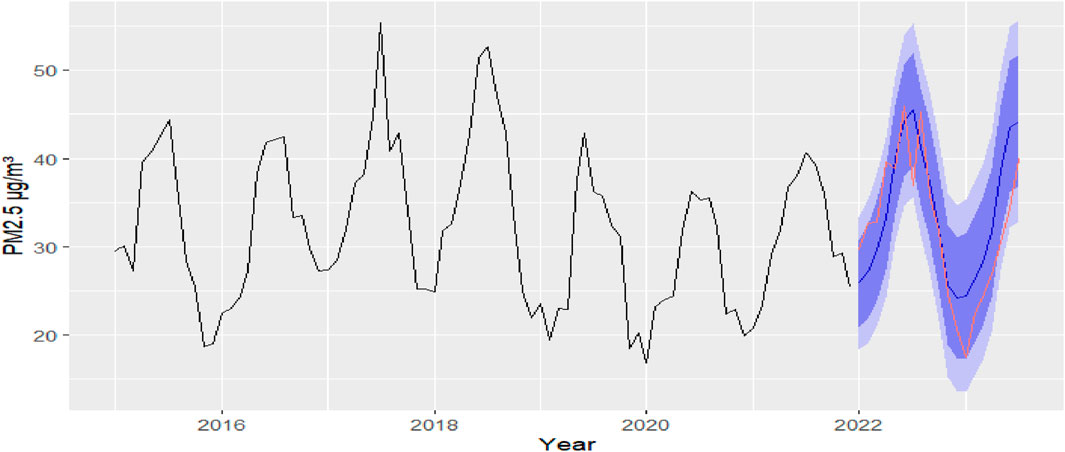
Figure 13. Seasonal ARIMA forecast of PM2.5 for all stations 2022-2023.

Figure 14. Seasonal ARIMA forecast of No2 for all stations 2022-2023.
The predictive success of the ARIMA model is evidenced by the following outcomes:
NO2 Forecasting: The ARIMA model (1,0,1) (1,1,0) achieved a MAPE of 7.71%, indicating high accuracy in predicting NO2 levels. PM10 Forecasting: For PM10, the model (2,0,0) (0,1,1) resulted in a MAPE of 7.99%, reflecting its effectiveness in capturing the variability in PM10 concentrations. PM2.5 Forecasting: The model (1,0,1) (2,1,1) used for PM2.5 forecasting recorded a MAPE of 8.59%, demonstrating its proficiency in predicting fine particulate matter concentrations.
These results underscore the ARIMA models’ capability to forecast air quality with considerable precision, which is crucial for planning and implementing proactive air quality management strategies in urban environments. The strong correlation between the forecasted and actual observed values reinforces the credibility of the ARIMA model as an effective instrument for air quality prediction in urban settings.
3.5 Comparative performance of forecasting models
The ARIMA model demonstrated superior accuracy over both alternatives across all examined pollutants (NO2, PM10, PM2.5), achieving lower Mean Absolute Error (MAE) and Root Mean Squared Error (RMSE). For example, the ARIMA model enhanced the accuracy of NO2 predictions by 20% over persistence models and 15% over linear regression models. This outcome highlights the ARIMA model’s proficiency in capturing the intricate temporal patterns and seasonal fluctuations of air quality data, confirming its efficacy as a forecasting tool for air quality in Abu Dhabi.
3.6 Limitations of ARIMA modeling in air quality forecasting
Utilizing Autoregressive Integrated Moving Average (ARIMA) models for predicting air quality indices, particularly in Abu Dhabi, demonstrates their significance. Nevertheless, the deployment of these models encounters obstacles, chiefly due to the complex nature of air quality data. This analysis examines the aptness of ARIMA models for such endeavors, highlighting the issues arising from nonlinearity, the constraints of extended forecasting, and the reliance on historical data historical evolution. Recognizing these obstacles is crucial for the accurate interpretation of forecasts from ARIMA models and for guiding the advancement of more complex forecasting techniques. By acknowledging the complex nature of air quality variations and the modeling challenges, we can promote the development of improved predictive tools, ultimately bettering air quality management strategies.
Forecasting air quality necessitates consideration of numerous interrelated factors, such as emissions, weather conditions, and atmospheric chemical reactions. These factors tend to introduce nonlinear historical evolution in air quality data, challenging ARIMA models, which are inherently linear (Zhang et al., 2012a; 2012b; Sokhi et al., 2021). This limitation in addressing nonlinear patterns may lead to forecast inaccuracies, especially when air quality is subject to abrupt shifts due to unforeseen events or significant policy changes. Future research should consider combining ARIMA with nonlinear modeling techniques or adopting machine learning methods to more accurately reflect these complex dynamics.
While ARIMA models are adept at short to medium-term forecasting, leveraging the idea that past historical evolution predict future occurrences, their long-term forecasting accuracy diminishes (Christodoulos et al., 2010; Abdoli, 2020). This is mainly because they do not incorporate potential changes in emissions, policy alterations, or socio-economic factors that could influence air quality (Sen et al., 2019; Homolka et al., 2020). To improve the reliability of long-term forecasts, integrating external factors into the models or using scenario-based methods that can adapt to future shifts might be advantageous.
The efficacy of ARIMA models heavily depends on the quality and availability of historical data (Khashei et al., 2012). In areas with sparse air quality monitoring or where data collection methodologies have changed, the data’s precision, and consequently, the model’s forecasts, might be affected (Yu and Lin, 2015). Furthermore, ARIMA models assume the continuation of historical evolution into the future, a premise that may not always be valid due to rapid urbanization or climate change (Das et al., 2020; Bhattacharjee et al., 2021). Addressing these concerns requires continuous model updates with recent data and the investigation of adaptive models that can accommodate emerging historical evolution.
3.7 Spatiotemporal insights and implications for public health
The predictive insights from our ARIMA model, focusing on NO2, PM10, and PM2.5 levels, shed light on the intricate patterns of air quality in Abu Dhabi. By analyzing data from 19 monitoring stations, we uncovered both the temporal fluctuations and spatial disparities in pollutant concentrations across various urban and industrial regions.
Our investigation highlights the critical periods of increased pollution, especially during the sweltering heat of July, setting the stage for strategic health advisories and proactive measures to shield vulnerable communities such as children, the elderly, and those with chronic illnesses. The distinct pollution patterns across different locales offer a map to pinpointing areas in dire need of air quality improvements, guiding efforts to create healthier environments. Here, we explore the actionable outcomes of our study and lay out a series of policy suggestions aimed at reducing air pollution’s grip on public health.
3.7.1 Policy suggestions
The clear identification of pollution epicenters and peak pollution periods should drive the launch of targeted air quality boosts. Tactics like mobilizing air purifying units, expanding urban greenery, and tightening emissions regulations in these critical areas could markedly diminish pollution. The insights call for an urban development ethos that embeds air quality at its core. This might involve infrastructure projects championing sustainable transport -bike lanes, walkways-to cut down on one of the largest contributors to city smog: vehicle emissions. The cyclical nature of air pollutants necessitates the timely release of health advisories, especially during high-pollution windows, advising on reduced outdoor activity and protective measures for at-risk groups. Our analysis advocates for a revamp in regulations targeting pollution sources, suggesting a move towards tougher industrial emission standards and vehicular emission laws, alongside a shift to greener energy options. Building community knowledge on air pollution’s dangers and mitigation strategies can foster a collective movement towards cleaner air, encouraging shifts towards public transportation and energy-efficient habits.
3.7.2 Crafting robust air quality management approaches
Utilizing ARIMA model projections for air quality enables informed policy-making, allowing for the anticipation of pollution historical evolution and the deployment of preventive public health measures. The insights gained should weave into the existing fabric of environmental policies, aligning with overarching sustainability visions like Abu Dhabi Vision 2030 for a unified air quality management strategy. Setting up a robust framework for the continual assessment of air quality management efforts is key. Persistent monitoring and analysis will pave the way for the fine-tuning of strategies, ensuring their efficacy over time.
Our comprehensive analysis not only charts the current state of air pollution in Abu Dhabi but also projects its future trajectory, providing a crucial foundation for crafting impactful air quality strategies. The suggested multifaceted approach to air quality management integrates targeted actions, regulatory updates, community involvement, and iterative policy evaluation, setting a course towards a healthier populace and a more resilient environment. These strategic applications of ARIMA model predictions underscore the profound impact that sophisticated forecasting can have on improving public health outcomes in Abu Dhabi. Aligning these efforts with the emirate’s Vision 2030 not only fosters sustainable urban growth but also heralds a future of enhanced health and environmental stewardship.
3.8 The study contribution to Abu Dhabi vision and 2030 sustainable development goals (SDGs)
This study significantly advances the objectives of Abu Dhabi Vision 2030 by contributing to sustainable development, environmental conservation, and the enhancement of public health (Low, 2012). Abu Dhabi Vision 2030 lays out a strategic plan to evolve the emirate into a sustainable, diversified economy, and the insights offered by this research are pivotal in several areas.
3.8.1 Supporting Abu Dhabi vision 2030
By deepening the understanding of air pollution historical evolution and offering a forecasting tool for air quality management, this research aligns with the vision’s focus on environmental preservation. It aids in devising more efficient strategies for air quality control, thus contributing to the environmental protection efforts for future generations. Given Vision 2030’s emphasis on the health and wellbeing of its inhabitants, the findings related to historical evolution in air pollutant levels are valuable for guiding public health strategies, policies, and interventions aimed at minimizing pollutant exposure, thereby fostering a healthier community. Highlighting the effects of industrial activities and vehicular traffic on air quality emphasizes the need for sustainable economic practices. This knowledge supports the vision’s objective of promoting environmentally responsible industries, contributing to economic diversity and ensuring sustainability. Utilizing ARIMA models for air quality forecasting embodies an innovative approach that corresponds with the vision’s commitment to embracing cutting-edge technologies and innovative solutions for managing environmental challenges.
3.8.2 Enhancing sustainable development goals (SDGs)
Additionally, this research aligns with various United Nations Sustainable Development Goals (SDGs) ((FUND, 2015; Carlsen and Bruggemann, 2022)), notably: SDG 3: Good Health and Wellbeing: By offering insights that could help mitigate air pollution, this study aids in enhancing public health, aligning with SDG 3’s objectives. SDG 11: Sustainable Cities and Communities: The study’s contributions towards improving air quality assist in creating more sustainable, safe, and resilient urban environments, directly supporting SDG 11. SDG 13: Climate Action: Effective air quality management is essential for climate change mitigation. This research backs actions against climate change by informing policy decisions in environmental governance. SDG 9: Industry, Innovation, and Infrastructure: Applying predictive models for air quality control matches SDG 9’s goals of developing resilient infrastructure, encouraging sustainable industrialization, and fostering innovation.
By directly engaging with these SDGs, the study not only aids global sustainability initiatives but also positions Abu Dhabi as a frontrunner in the 2030 Agenda for Sustainable Development. Incorporating the findings of this research into policymaking and practical applications can hasten progress towards achieving both Abu Dhabi Vision 2030 and the Sustainable Development Goals, highlighting Abu Dhabi’s dedication to sustainability, innovation, and the wellbeing of its population.
3.9 Future directions for enhancing air quality forecasting research
The ongoing quest to refine methods for forecasting air quality and deepen our understanding of pollution dynamics unfolds a vast array of research opportunities. Building on the insights and recognizing the constraints of our current investigations with ARIMA modeling, we propose several promising research directions. These suggestions aim to broaden the analytical framework, enhance its comprehensiveness, and embrace interdisciplinary approaches to provide more profound insights into air pollution management strategies.
Future research endeavors should take a more inclusive stance by weaving air quality modeling with knowledge from environmental science, urban planning, and public health domains. Such a multidisciplinary approach would facilitate the incorporation of external variables crucially affecting air quality, like meteorological conditions (temperature, humidity, wind speed) (Jian et al., 2012; Li et al., 2020), socioeconomic indicators (population growth, industrial activity levels) (Arsov et al., 2020; Dadashova et al., 2021; Wang and Chang, 2023), and urban transport dynamics (Kadiyala & Kumar, 2014; Bell et al., 2015). Integrating these factors could enrich our understanding of air quality influences, paving the way for a holistic predictive and management model.
Implementing Geographic Information System (GIS) methodologies could significantly improve spatial analysis capabilities, identifying pollution hotspots and assessing the localized effects of emission sources on air quality (Jain and Acharya, 2023; Verma et al., 2023). This spatial precision could enhance targeted management interventions and policy formulation. Besides, there’s a consensus on the value of incorporating more extended data records into our studies to provide a long-term view of air quality evolution. Expanding our analysis timeline would likely yield more robust insights into Abu Dhabi’s air pollution historical evolution and enhance the predictive accuracy of our models. In addition, analyzing air quality in other cities or regions that face similar challenges could offer valuable comparative insights (Liu et al., 2018; Liu and You, 2022). Such studies might reveal universal patterns or effective strategies applicable across different contexts, enriching the global knowledge base on air pollution management.
As well, the realm of machine learning also presents sophisticated modeling options adept at deciphering complex, nonlinear data relationships, such as neural networks, decision trees, and ensemble methods (Chang et al., 2020; Guo et al., 2020; Kumar et al., 2021). Future research should delve into these techniques for air quality forecasting. Their capacity for processing vast datasets and accommodating diverse predictive variables could significantly bolster forecast precision and reliability. Importantly, machine learning models possess the adaptability to reflect ongoing changes in urban and environmental conditions dynamically. Furthermore, a novel research pathway involves combining the temporal analysis strengths of ARIMA with the nonlinear processing capabilities of machine learning to create hybrid models (Chang et al., 2020; Aggarwal and Toshniwal, 2021; Gunasekar et al., 2022). Such an approach aims to overcome the linear constraints of ARIMA models and imbue the forecasting process with the adaptability and nuanced understanding provided by machine learning. This could lead to superior accuracy and more detailed air quality predictions.
These proposed directions not only highlight our dedication to advancing air quality forecasting but also underscore the importance of innovative, cross-disciplinary efforts and the adoption of new technologies. By tackling the identified limitations and exploring these avenues, future research can significantly contribute to the development of more effective, evidence-based air pollution management strategies, ultimately safeguarding public health and the environment in Abu Dhabi and beyond.
4 Conclusion
This in-depth investigation into the historical evolution, spatial distribution, and predictions of NO2, PM10, and PM2.5 levels throughout Abu Dhabi has provided essential insights into the area’s air pollution dynamics. Through a detailed examination of data from 19 monitoring locations over an 8-year span, the study not only charts the changing landscape of air quality but also introduces a sophisticated forecasting model to enhance proactive air quality control measures.
Key outcomes of this research include the notable reduction in NO2 concentrations after 2020, the heightened instances of PM10 and PM2.5 in 2022, and the significant seasonal fluctuations with July experiencing the highest pollution levels. These patterns reflect both the influence of policy measures and socio-economic factors on air quality and are consistent with worldwide observations in urban air pollution research. Spatial analyses further reveal the impact of specific emission sources on air quality, emphasizing the necessity for policies tailored to the local context. Additionally, the ARIMA model’s forecasting accuracy provides a critical resource for predicting future air quality historical evolution, enabling more informed preparation and response strategies.
This research fills an important gap in the existing body of knowledge by offering an extensive evaluation of air quality fluctuations in Abu Dhabi, an area that has not been extensively covered in international air pollution studies. The methodologies applied, especially the forecasting with ARIMA models in R studio and the approach to managing missing data, affirm the study’s methodological soundness and its contribution to the academic field.
Beyond academic contributions, our extensive study, leveraging Autoregressive Integrated Moving Average (ARIMA) models, has revealed critical spatiotemporal patterns in NO2, PM10, and PM2.5 levels across Abu Dhabi. This research provided a detailed exploration of both the temporal and seasonal fluctuations in air pollutants and the pronounced spatial variations in pollution across the region. By offering predictive insights into when and where pollution levels peak, our analysis serves as a strategic tool for refining air quality management and enhancing public health initiatives.
Recognizing the seasonal highs in pollutants, particularly during hotter months, highlights the urgent need for issuing health advisories promptly and deploying preventive strategies to shield at-risk groups. Identifying areas with consistently higher pollution through spatial analysis suggests a need for targeted actions, such as improving green cover, tightening emission regulations, and implementing traffic management to curtail sources of pollution. The effective use of ARIMA models in forecasting air quality illustrates the immense value of statistical modeling in environmental science. These forecasts are pivotal for crafting forward-looking measures to combat air pollution, in line with Abu Dhabi’s ambitious sustainability and health objectives.
Armed with these predictive insights, Abu Dhabi’s decision-makers are better equipped to enact targeted interventions aimed at preserving public health and the environment. This strategy addresses not just the immediate challenges posed by air pollution but also contributes to achieving the broader sustainability ambitions outlined in both Abu Dhabi Vision 2030 and the Sustainable Development Goals (SDGs). With the ability to foresee periods of heightened pollution, health authorities can dispatch precise advisories to mitigate exposure to dangerous pollutants, thereby protecting community wellbeing. The knowledge acquired through this study can guide the creation of policies and initiatives focused on reducing emissions from identified critical areas and enhancing air quality and environmental health. Incorporating air quality forecasts into urban planning can inform the design and placement of infrastructure and green spaces to lower pollution levels and promote a healthier urban living environment.
This inquiry into Abu Dhabi’s air quality patterns lays the groundwork for ongoing research and policy innovation. By harnessing sophisticated forecasting techniques, it is possible to anticipate shifts in air quality, enabling targeted measures that safeguard the health of the city’s inhabitants and foster sustainable urban development. This study underscores the indispensable role of scientific investigation in informing effective environmental policies and public health measures, propelling Abu Dhabi towards realizing its Vision 2030 and contributing to the global sustainable development agenda.
Data availability statement
The original contributions presented in the study are included in the article/supplementary material, further inquiries can be directed to the corresponding author.
Author contributions
MR: Conceptualization, Data curation, Formal Analysis, Funding acquisition, Investigation, Methodology, Project administration, Resources, Software, Supervision, Validation, Visualization, Writing–original draft, Writing–review and editing. AA: Conceptualization, Investigation, Writing–review and editing. NA: Project administration, Supervision, Visualization, Writing–review and editing.
Funding
The author(s) declare that financial support was received for the research, authorship, and/or publication of this article. This research was funded by UAEU-National Faculty Research Prog, grant code—G00004284.
Acknowledgments
The authors gratefully acknowledge the financial support provided by UAEU-National Faculty Research for funding this research work.
Conflict of interest
The authors declare that the research was conducted in the absence of any commercial or financial relationships that could be construed as a potential conflict of interest.
Publisher’s note
All claims expressed in this article are solely those of the authors and do not necessarily represent those of their affiliated organizations, or those of the publisher, the editors and the reviewers. Any product that may be evaluated in this article, or claim that may be made by its manufacturer, is not guaranteed or endorsed by the publisher.
References
Abdoli, G., MehrAra, M., and Ebrahim Ardalani, M. (2020). Comparing the prediction accuracy of LSTM and ARIMA models for time-series with permanent fluctuation. Periódico do Núcleo Estud. Pesqui. sobre Gênero DireitovCentro Ciências Jurídicas-Universidade Fed. Paraíba 9. doi:10.22478/ufpb.2179-7137.2020v9n2.50782
Abhilash, M., Thakur, A., Gupta, D., and Sreevidya, B. (2018). “Time series analysis of air pollution in Bengaluru using ARIMA model,” in Ambient communications and computer systems: racccs 2017 (Berlin, Germany: Springer).
Abuelgasim, A., and Farahat, A. (2020). Investigations on PM 10, PM 2.5, and their ratio over the emirate of Abu Dhabi, United Arab Emirates. Earth Syst. Environ. 4, 763–775. doi:10.1007/s41748-020-00186-2
Aggarwal, A., and Toshniwal, D. (2021). A hybrid deep learning framework for urban air quality forecasting. J. Clean. Prod. 329, 129660. doi:10.1016/j.jclepro.2021.129660
Alsaber, A. R., Pan, J., and Al-Hurban, A. (2021). Handling complex missing data using random forest approach for an air quality monitoring dataset: a case study of Kuwait environmental data (2012 to 2018). Int. J. Environ. Res. Public Health 18 (3), 1333. doi:10.3390/ijerph18031333
Amaefula, C. G. (2021). A SARIMA and adjusted SARIMA models in a seasonal nonstationary time series; evidence of Enugu monthly rainfall. Eur. J. Math. Statistics 2 (1), 13–18. doi:10.24018/ejmath.2021.2.1.15
Arsov, M., Zdravevski, E., Lameski, P., Corizzo, R., Koteli, N., Mitreski, K., et al. (2020). “Short-term air pollution forecasting based on environmental factors and deep learning models,” in 2020 15th Conference on Computer Science and Information Systems (FedCSIS), Sofia, Bulgaria, September, 2020.
Basagaña, X., Aguilera, I., Rivera, M., Agis, D., Foraster, M., Marrugat, J., et al. (2013). Measurement error in epidemiologic studies of air pollution based on land-use regression models. Am. J. Epidemiol. 178 (8), 1342–1346. doi:10.1093/aje/kwt127
Basha, S. M., Zhenning, Y., Rajput, D. S., Caytiles, R. D., and Iyengar, N. C. S. (2017). Comparative study on performance analysis of time series predictive models. Int. J. Grid Distributed Comput. 10 (8), 37–48. doi:10.14257/ijgdc.2017.10.8.04
Bell, M., Bergantino, A. S., Catalano, M., and Galatioto, F. (2015). Prediction of air pollution peaks generated by urban transport networks. Soc. Ital. Econ. dei Trasp. della Logistica (SIET).
Bhattacharjee, S., Lekshmi, K., and Bharti, R. (2021). Time series analysis of urbanisation impact on the temperature variations off Mumbai coast. Int. Archives Photogrammetry, Remote Sens. Spatial Inf. Sci. 43, 31–37. doi:10.5194/isprs-archives-xliii-b3-2021-31-2021
Böer, B. (1997). An introduction to the climate of the United Arab Emirates. J. arid Environ. 35 (1), 3–16. doi:10.1006/jare.1996.0162
Carlsen, L., and Bruggemann, R. (2022). The 17 United Nations’ sustainable development goals: a status by 2020. Int. J. Sustain. Dev. World Ecol. 29 (3), 219–229. doi:10.1080/13504509.2021.1948456
Carslaw, D. C., and Ropkins, K. (2012). Openair—an R package for air quality data analysis. Environ. Model. Softw. 27, 52–61. doi:10.1016/j.envsoft.2011.09.008
Chang, Y.-S., Abimannan, S., Chiao, H.-T., Lin, C.-Y., and Huang, Y.-P. (2020). An ensemble learning based hybrid model and framework for air pollution forecasting. Environ. Sci. Pollut. Res. 27, 38155–38168. doi:10.1007/s11356-020-09855-1
Chastko, K., and Adams, M. (2019). Assessing the accuracy of long-term air pollution estimates produced with temporally adjusted short-term observations from unstructured sampling. J. Environ. Manag. 240, 249–258. doi:10.1016/j.jenvman.2019.03.108
Christodoulos, C., Michalakelis, C., and Varoutas, D. (2010). Forecasting with limited data: combining ARIMA and diffusion models. Technol. Forecast. Soc. change 77 (4), 558–565. doi:10.1016/j.techfore.2010.01.009
Dadashova, B., Li, X., Turner, S., and Koeneman, P. (2021). Multivariate time series analysis of traffic congestion measures in urban areas as they relate to socioeconomic indicators. Socio-Economic Plan. Sci. 75, 100877. doi:10.1016/j.seps.2020.100877
Das, U. D., Singh, B. P., and Roy, T. D. (2020). Temporal variation of temperature in Guwahati, Assam: an application of seasonal ARIMA model. J. Stat. Appl. Prob 9 (1), 169–180.
Effat, H. A., Ramadan, M. S., and Ramadan, R. H. (2022). A spatial model for assessment of urban vulnerability in the light of the UN New Urban Agenda guidelines: case study of Assiut City, Egypt. Model. Earth Syst. Environ. 8 (3), 3687–3706. doi:10.1007/s40808-021-01281-7
Farahat, A., El-Askary, H., and Dogan, A. U. (2016). Aerosols size distribution characteristics and role of precipitation during dust storm formation over Saudi Arabia. Optical/Radiative Prop. Remote Sens. 16, 2523–2534. doi:10.4209/aaqr.2015.11.0656
Frichot, E., and François, O. (2015). LEA: an R package for landscape and ecological association studies. Methods Ecol. Evol. 6 (8), 925–929. doi:10.1111/2041-210x.12382
Fund, S. (2015). Sustainable development goals. Available at: https://www.un.org/sustainabledevelopment/inequality.
Garg, S., and Jindal, H. (2021). “Evaluation of time series forecasting models for estimation of pm2. 5 levels in air,” in 2021 6th International Conference for Convergence in Technology (I2CT), Maharashtra, India, April, 2021.
Guenzi, D., Fratianni, S., Boraso, R., and Cremonini, R. (2017). CondMerg: an open source implementation in R language of conditional merging for weather radars and rain gauges observations. Earth Sci. Inf. 10, 127–135. doi:10.1007/s12145-016-0278-y
Gunasekar, S., Kumar, G., and Agbulu, G. P. (2022). Air quality predictions in urban areas using hybrid ARIMA and metaheuristic LSTM. Comput. Syst. Sci. Eng. 43 (3), 1271–1284. doi:10.32604/csse.2022.024303
Guo, C., Liu, G., and Chen, C.-H. (2020). Air pollution concentration forecast method based on the deep ensemble neural network. Wirel. Commun. Mob. Comput. 2020, 1–13. doi:10.1155/2020/8854649
Hasnain, A., Sheng, Y., Hashmi, M. Z., Bhatti, U. A., Hussain, A., Hameed, M., et al. (2022). Time series analysis and forecasting of air pollutants based on prophet forecasting model in Jiangsu province, China. Front. Environ. Sci. 10, 945628. doi:10.3389/fenvs.2022.945628
Homolka, L., Ngo, V. M., Pavelková, D., Le, B. T., and Dehning, B. (2020). Short-and medium-term car registration forecasting based on selected macro and socio-economic indicators in European countries. Res. Transp. Econ. 80, 100752. doi:10.1016/j.retrec.2019.100752
Huang, W., Li, T., Liu, J., Xie, P., Du, S., and Teng, F. (2021). An overview of air quality analysis by big data techniques: monitoring, forecasting, and traceability. Inf. Fusion 75, 28–40. doi:10.1016/j.inffus.2021.03.010
Hyndman, R. J., and Khandakar, Y. (2008). Automatic time series forecasting: the forecast package for R. J. Stat. Softw. 27, 1–22. doi:10.18637/jss.v027.i03
Ilyas, M., Abbas, S., Ali, W., and Raza, S. M. (2024). Application of stochastic regression models: ARIMA (p, d, q)-HW algorithm approach for human population forecasting. ratio 1, 5.
Jain, E., and Acharya, D. (2023). A mobile sensing based stochastic model to forecast AQI variation of pollution hotspots on urban neighborhoods. Int. J. Next-Generation Comput. 14 (2). doi:10.47164/ijngc.v14i2.1195
Jaiswal, A., Samuel, C., and Kadabgaon, V. (2018). Statistical trend analysis and forecast modeling of air pollutants. Glob. J. Environ. Sci. Manag. 4 (4), 427–438.
Jian, L., Zhao, Y., Zhu, Y.-P., Zhang, M.-B., and Bertolatti, D. (2012). An application of ARIMA model to predict submicron particle concentrations from meteorological factors at a busy roadside in Hangzhou, China. Sci. Total Environ. 426, 336–345. doi:10.1016/j.scitotenv.2012.03.025
Kadiyala, A., and Kumar, A. (2014). Vector time series models for prediction of air quality inside a public transportation bus using available software. Environ. Prog. Sustain. Energy 33 (4), 1069–1073. doi:10.1002/ep.12021
Katsoulis, B. D., and Pnevmatikos, J. D. (2009). Statistical analysis of urban air-pollution data in the Athens basin area, Greece. Int. J. Environ. Pollut. 36 (1-3), 30–43. doi:10.1504/ijep.2009.021815
Kaur, J., Parmar, K. S., and Singh, S. (2023). Autoregressive models in environmental forecasting time series: a theoretical and application review. Environ. Sci. Pollut. Res. 30 (8), 19617–19641. doi:10.1007/s11356-023-25148-9
Kazi, Z., Filip, S., and Kazi, L. (2023). Predicting PM2. 5, PM10, SO2, NO2, NO and CO air pollutant values with linear regression in R language. Appl. Sci. 13 (6), 3617. doi:10.3390/app13063617
Kembel, S. W., Cowan, P. D., Helmus, M. R., Cornwell, W. K., Morlon, H., Ackerly, D. D., et al. (2010). Picante: R tools for integrating phylogenies and ecology. Bioinformatics 26 (11), 1463–1464. doi:10.1093/bioinformatics/btq166
Khashei, M., Bijari, M., and Hejazi, S. R. (2012). Combining seasonal ARIMA models with computational intelligence techniques for time series forecasting. Soft Comput. 16, 1091–1105. doi:10.1007/s00500-012-0805-9
Koo, J. W., Wong, S. W., Selvachandran, G., Long, H. V., and Son, L. H. (2020). Prediction of Air Pollution Index in Kuala Lumpur using fuzzy time series and statistical models. Air Qual. Atmos. Health 13, 77–88. doi:10.1007/s11869-019-00772-y
Kumar, T. S., Das, H. S., Choudhary, U., Dutta, P. E., Guha, D., and Laskar, Y. (2021). “Analysis and prediction of air pollution in Assam using ARIMA/SARIMA and machine learning,” in Innovations in sustainable energy and Technology: proceedings of ISET 2020 (Berlin, Germany: Springer).
Lemenkova, P., and Debeir, O. (2022). R libraries for remote sensing data classification by K-means clustering and NDVI computation in Congo river basin, DRC. Appl. Sci. 12 (24), 12554. doi:10.3390/app122412554
Li, Y., Chen, Y., Karimian, H., Tao, T., and Yaqian, L. (2020). Spatiotemporal analysis of air quality and its relationship with meteorological factors in the Yangtze River Delta. J. Elem. 25 (3). doi:10.5601/jelem.2019.24.4.1931
Liao, K., Huang, X., Dang, H., Ren, Y., Zuo, S., and Duan, C. (2021). Statistical approaches for forecasting primary air pollutants: a review. Atmosphere 12 (6), 686. doi:10.3390/atmos12060686
Liu, B., Jin, Y., and Li, C. (2021a). Analysis and prediction of air quality in Nanjing from autumn 2018 to summer 2019 using PCR–SVR–ARMA combined model. Sci. Rep. 11 (1), 348. doi:10.1038/s41598-020-79462-0
Liu, H., Yan, G., Duan, Z., and Chen, C. (2021b). Intelligent modeling strategies for forecasting air quality time series: a review. Appl. Soft Comput. 102, 106957. doi:10.1016/j.asoc.2020.106957
Liu, T., Lau, A. K., Sandbrink, K., and Fung, J. C. (2018). Time series forecasting of air quality based on regional numerical modeling in Hong Kong. J. Geophys. Res. Atmos. 123 (8), 4175–4196. doi:10.1002/2017jd028052
Liu, T., and You, S. (2022). Analysis and forecast of beijing’s air quality index based on arima model and neural network model. Atmosphere 13 (4), 512. doi:10.3390/atmos13040512
Mani, G., and Viswanadhapalli, J. K. (2022). Prediction and forecasting of air quality index in Chennai using regression and ARIMA time series models. J. Eng. Res. 10 (2A), 179–194.
Nimesh, R., Arora, S., Mahajan, K. K., and Gill, A. N. (2014). Predicting air quality using ARIMA, ARFIMA and HW smoothing. Model Assisted Statistics Appl. 9 (2), 137–149. doi:10.3233/mas-130285
Patil, R. M., Dinde, H., Powar, S. K., and Ganeshkhind, P. M. (2020). A Literature review on prediction of air quality index and forecasting ambient air pollutants using machine learning algorithms. Int. J. Innovative Sci. Res. Technol. 5 (8), 1148–1152. doi:10.38124/ijisrt20aug683
Peralta, B., Sepúlveda, T., Nicolis, O., and Caro, L. (2022). Space-time prediction of PM2. 5 concentrations in Santiago de Chile using LSTM Networks. Appl. Sci. 12 (22), 11317. doi:10.3390/app122211317
Rahman, E. A., Hamzah, F. M., Latif, M. T., and Azid, A. (2023). Forecasting PM2. 5 in Malaysia using a hybrid model. Aerosol Air Qual. Res. 23 (9), 230006. doi:10.4209/aaqr.230006
Ramadan, R. H., and Ramadan, M. S. (2022). Prediction of highly vulnerable areas to COVID-19 outbreaks using spatial model: case study of Cairo Governorate, Egypt. Egypt. J. Remote Sens. Space Sci. 25 (1), 233–247. doi:10.1016/j.ejrs.2021.08.003
Ramadan, R. H., Ramadan, M. S., Alkadi, I. I., Alogayell, H. M., Ismail, I. Y., and Khairy, N. (2022). Assessment of sustainable world heritage areas in Saudi Arabia based on climate change impacts on vulnerability using RS and GIS. Sustainability 14 (23), 15831. doi:10.3390/su142315831
Ramos, P., and Oliveira, J. M. (2016). A procedure for identification of appropriate state space and ARIMA models based on time-series cross-validation. Algorithms 9 (4), 76. doi:10.3390/a9040076
Rao, S., Chirkov, V., Dentener, F., Van Dingenen, R., Pachauri, S., Purohit, P., et al. (2012). Environmental modeling and methods for estimation of the global health impacts of air pollution. Environ. Model. Assess. 17, 613–622. doi:10.1007/s10666-012-9317-3
Samal, K. K. R., Babu, K. S., Das, S. K., and Acharaya, A. (2019). Time series based air pollution forecasting using SARIMA and prophet model. proceedings of the 2019 international conference on information technology and computer communications,
Saraswat, A. (2015) Air pollution in New Delhi, India: spatial and temporal patterns of ambient concentrations and human exposure. Vancouver, Canada: University of British Columbia.
Sen, D., Günay, M. E., and Tunç, K. M. (2019). Forecasting annual natural gas consumption using socio-economic indicators for making future policies. Energy 173, 1106–1118. doi:10.1016/j.energy.2019.02.130
Setiawan, I. (2020). Time series air quality forecasting with R language and R studio. Journal of physics: conference series,
Sharifi, A., Pathak, M., Joshi, C., and He, B.-J. (2021). A systematic review of the health co-benefits of urban climate change adaptation. Sustain. Cities Soc. 74, 103190. doi:10.1016/j.scs.2021.103190
Sharma, N., Taneja, S., Sagar, V., and Bhatt, A. (2018). Forecasting air pollution load in Delhi using data analysis tools. Procedia Comput. Sci. 132, 1077–1085. doi:10.1016/j.procs.2018.05.023
Shumway, R. H., Stoffer, D. S., Shumway, R. H., and Stoffer, D. S. (2017) ARIMA models. Time series analysis and its applications: with R examples. Berlin, Germany: Springer, 75–163.
Sokhi, R. S., Moussiopoulos, N., Baklanov, A., Bartzis, J., Coll, I., Finardi, S., et al. (2021). Advances in air quality research–current and emerging challenges. Atmos. Chem. Phys. Discuss. 2021, 1–133.
Stanke, H., Finley, A. O., Weed, A. S., Walters, B. F., and Domke, G. M. (2020). rFIA: an R package for estimation of forest attributes with the US Forest Inventory and Analysis database. Environ. Model. Softw. 127, 104664. doi:10.1016/j.envsoft.2020.104664
Taufik, M. R., Rosanti, E., Prasetya, T. A. E., and Septiarini, T. W. (2020). Prediction algorithms to forecast air pollution in Delhi India on a decade. J. Phys. Conf. Ser. 1511, 012052. doi:10.1088/1742-6596/1511/1/012052
Tawabini, B. S., Lawal, T. T., Shaibani, A., and Farahat, A. M. (2017). Morphological and chemical properties of particulate matter in the dammam metropolitan region: dhahran, Khobar, and Dammam, Saudi Arabia. Adv. Meteorology 2017, 1–9. doi:10.1155/2017/8512146
Turias, I. J., González, F. J., Martin, M. L., and Galindo, P. L. (2008). Prediction models of CO, SPM and SO 2 concentrations in the Campo de Gibraltar Region, Spain: a multiple comparison strategy. Environ. Monit. Assess. 143, 131–146. doi:10.1007/s10661-007-9963-0
Verma, S., Gangwar, T., Singh, J., Prakash, D., and Payra, S. (2023). “Urban air quality monitoring and modelling using ground monitoring, remote sensing, and GIS,” in Geospatial analytics for environmental pollution modeling: analysis, control and management (Berlin, Germany: Springer), 213–247.
Wang, C. H., and Chang, C. R. (2023). Forecasting air quality index considering socioeconomic indicators and meteorological factors: a data granularity perspective. J. Forecast. 42 (5), 1261–1274. doi:10.1002/for.2962
Young, M. T., Bechle, M. J., Sampson, P. D., Szpiro, A. A., Marshall, J. D., Sheppard, L., et al. (2016). Satellite-based NO2 and model validation in a national prediction model based on universal kriging and land-use regression. Environ. Sci. Technol. 50 (7), 3686–3694. doi:10.1021/acs.est.5b05099
Yu, T.-C., and Lin, C.-C. (2015). An intelligent wireless sensing and control system to improve indoor air quality: monitoring, prediction, and preaction. Int. J. Distributed Sens. Netw. 11 (8), 140978. doi:10.1155/2015/140978
Zhai, S., Jacob, D. J., Wang, X., Shen, L., Li, K., Zhang, Y., et al. (2019). Fine particulate matter (PM<sub>2.5</sub>) trends in China, 2013–2018: separating contributions from anthropogenic emissions and meteorology. Atmos. Chem. Phys. 19 (16), 11031–11041. doi:10.5194/acp-19-11031-2019
Zhang, Y., Bocquet, M., Mallet, V., Seigneur, C., and Baklanov, A. (2012a). Real-time air quality forecasting, part I: history, techniques, and current status. Atmos. Environ. 60, 632–655. doi:10.1016/j.atmosenv.2012.06.031
Zhang, Y., Bocquet, M., Mallet, V., Seigneur, C., and Baklanov, A. (2012b). Real-time air quality forecasting, part II: state of the science, current research needs, and future prospects. Atmos. Environ. 60, 656–676. doi:10.1016/j.atmosenv.2012.02.041
Zhang, Y., and Zhu, P. (2019). Comparison and analysis of air quality visualization between Beijing and nanjing based on R. IOP conference series: materials science and engineering,
Keywords: air quality, ARIMA model, R studio, forecasting, Abu Dhabi, pollution historical evolution, environmental management
Citation: Ramadan MS, Abuelgasim A and Al Hosani N (2024) Advancing air quality forecasting in Abu Dhabi, UAE using time series models. Front. Environ. Sci. 12:1393878. doi: 10.3389/fenvs.2024.1393878
Received: 01 March 2024; Accepted: 02 May 2024;
Published: 15 May 2024.
Edited by:
Nsikak U. Benson, Topfaith University, NigeriaReviewed by:
Ana Cristina Russo, University of Lisbon, PortugalCheng-Hong Yang, National Kaohsiung University of Science and Technology, Taiwan
Copyright © 2024 Ramadan, Abuelgasim and Al Hosani. This is an open-access article distributed under the terms of the Creative Commons Attribution License (CC BY). The use, distribution or reproduction in other forums is permitted, provided the original author(s) and the copyright owner(s) are credited and that the original publication in this journal is cited, in accordance with accepted academic practice. No use, distribution or reproduction is permitted which does not comply with these terms.
*Correspondence: Mona S. Ramadan, mona.s.ramadan@uaeu.ac.ae