Ecological construction status of photovoltaic power plants in China’s deserts
 Yimeng Wang
 Benli Liu
 Yu Xing1,2
 - 1Key Laboratory of Ecological Safety and Sustainable Development in Arid Lands Research Station of Gobi Desert Ecology and Environment in Dunhuang of Gansu Province, Northwest Institute of Eco-environment and Resources, Chinese Academy of Sciences, Lanzhou, China
- 2University of Chinese Academy of Sciences, Beijing, China
- 3Academy of Plateau Science and Sustainability, Qinghai Normal University, Xining, China
- 4Northwest Engineering Corporation Limited, Xian, China
Solar photovoltaic (PV) is one of the most environmental-friendly and promising resources for achieving carbon peak and neutrality targets. Despite their ecological fragility, China’s vast desert regions have become the most promising areas for PV plant development due to their extensive land area and relatively low utilization value. Artificial ecological measures in the PV plants can reduce the environmental damage caused by the construction activity and promote the ecological condition of fragile desert ecosystems, therefore yield both ecological and economic benefits. However, the understanding of the current status and ecological benefits of this approach in existing desert PV plants is limited. Here we surveyed 40 PV plants in northern China’s deserts to identify the ecological construction modes and their influencing factors. We quantified the ecosystem service value (ESV) provided by these PV plants using remote sensing data and estimated the potential for ESV enhancement. Our results show that PV plant construction in desert regions can significantly improve the ecosystem, even with natural restoration measures (M1) alone, resulting in a 74% increase in average fractional vegetation cover (FVC) during the growing season, although the maximum average FVC of only about 10%. The integrated mode M4, which combined artificial vegetation planting M2 and sand control measures M3, further enhance the average growing season FVC to 14.53%. Currently, 22.5% of plants lack ecological measures, 40% employ only a single measure, but 92% of new plants since 2017 have adopted at least one ecological construction mode. The main influencing factors include surface type, policy support, water resources, ecological construction costs, and scientific management guidance. If artificial ecological construction were incorporated, a significant ESV could be achieved in these PV plants, reaching $8.9 million (a 7.7-fold increase) if assuming a targeted 50% vegetation coverage. This study provides evidence for evaluating the ecological benefit and planning of large-scale PV farms in deserts.
1 Introduction
Due to factors such as the growing global energy demand, the non-renewable energy crisis, and climate change, etc., there is an international consensus to promote the utilization of renewable energy and develop a low-carbon society (Riahi et al., 2012; Hertwich et al., 2015). As one of the most important renewable resources, solar energy possesses the qualities of clean environmental protection-friendly and inexhaustibility (Mekhilef et al., 2011; Hernandez et al., 2015). Currently, photovoltaic (PV) power generation is the predominant method of solar energy utilization (Yan et al., 2007). In the past 5 years, the global PV installed capacity had nearly tripled, increasing from 402.5 GW in 2017 to 1185 GW in 2022 (IEA Photovoltaic Power Systems Programme, 2018; IEA Photovoltaic Power Systems Programme, 2023). China added 106 GW of new installations in the year of 2022 alone, accounting for 44% of the world’s new installed capacity, with a total installed capacity of 414.5 GW, solidifying its position as the largest contribution to the PV market for eighth consecutive year (IEA Photovoltaic Power Systems Programme, 2023).
China has a vast area of deserts (including gravel deserts, sandy deserts, desert steppes, and alpine deserts), mainly distributed in northern and northwest parts of the country, and the Qinghai-Tibet Plateau, which accounts for 27.2% of China’s total land area (National Forestry and Grassland Administration, 2015). More than 60% of China’s PV resources and development capabilities are concentrated in the deserts (Xinhua News Agency, 2021), together with the flat terrain, low population density, and limited land expenditure costs, which making the deserts ideal for the growth of large-scale PV farms (Xiao et al., 2011; Wu et al., 2014; Tanner et al., 2020). Besides, the construction of PV farms in deserts can improve the utilization rate of degraded land and enable the spatial coexistence of PV with other industries, such as farming and livestock raising (Yan et al., 2007; Marco et al., 2014). The National Development and Reform Commission and the Energy Bureau issued a notice titled “Planning and Layout Scheme for Large-scale Wind and Solar Power Bases with a Focus on Desert” in 2022, which plans the construction of large-scale wind and PV farms focusing on desert in northwest China, with a total capacity of 455 GW by 2030 (People’s Daily Overseas Edition, 2023), of which 284 GW are in Kubuqi, Ulanbh, Tengger and Badain Jaran deserts (China Securries Journal, 2022). By the end of 2022, the cumulative grid-connected capacity of PV plants in the desert regions such as Gansu, Qinghai, Xinjiang, Ningxia, Inner Mongolia, Shaanxi, and Tibet has reached 96.19 GW, accounting for 24.54% in China’s total cumulative grid-connected capacity and still holding great development potential (National Energy Administration, 2023).
The land surface and the overall ecological environment are fragile in deserts, which can be easily affected or aggravated by irresponsible human activities (Wu et al., 2014; Borrelli et al., 2020). As the quantity and scale of PV installations continue to grow, so does the scrutiny regarding their impact on the local ecological environment. Some studies indicate that the construction of large-scale PV farms will disturb the land surface, destroy surface vegetation and soil crusts, and cause severe wind erosion, posing a significant threat to the normal operation of PV plants and the local ecological environment (Grodsky and Hernandez, 2020; Scarrow, 2020). However, the construction of PV plants in deserts can usually facilitate plant growth. After installation, the PV arrays can increase surface roughness, reduce the surface wind speed, and decrease wind-driven sand and dust (Wu et al., 2014; Chang et al., 2016). Simultaneously, a large area of PV panels can effectively reduce direct solar radiation and surface water evaporation, thereby promoting vegetation growth and aiding in the restoration of damaged ecosystems (Wu et al., 2014; Liu et al., 2020; Xia et al., 2022b). Nevertheless, these positive factors are hard to yield significant effects if relying solely on natural process, and artificial vegetation is often required to accelerate the ecosystem improvement process (Marrou et al., 2013; Li Y. et al., 2018; Liu et al., 2020). In desert, a composite system of PV plus agriculture and animal husbandry is possible to construct by manually installing sand fences and sand barriers, tying grass grids to the surface, and sowing and breeding in PV farm (Semeraro et al., 2022). Current research mainly focuses on the use of remote sensing data to study the changes in vegetation cover before and after the construction of PV power plants (Marrou et al., 2013; Li Y. et al., 2018; Xia et al., 2022a; Xia et al., 2022b; Semeraro et al., 2022), or in-depth studies of the ecological impacts and values of PV power plants on a small scale (Li Y. et al., 2018; Luo et al., 2023). However, no regional-scale field research on the ecological construction condition of PV power plants in desert areas has been conducted so far, and there is a lack of comprehensive understanding and assessment of their existing status.
In light of the fact that many large-scale PV farms have already been constructed in the vast China’s deserts, it is of great importance to understand the existing wind-sand prevention measures and ecological construction status of desert PV plants, as well as the environmental improvement and ecological service value (ESV) enhancement benefits that brought by ecological construction activities, which are essential for preventing and eliminating any negative impact of power plants construction on the environment and guiding ecological construction activities. This paper aims to: 1) assess the ecological environment status of PV plants in China’s deserts through field survey and investigate the wind-sand control measures, ecological construction, and vegetation growth conditions and 2) estimate the ESV and potential ecological service function that can be brought by the ecological construction measures in the large-scale PV plants in deserts.
2 Material and methods
2.1 Study area
The study area is located in the Badain Jaran Desert, Tengger Desert and surrounding areas in northwest China (98°79′E−105°95′E, 37°05′N-42°20′N), which includes the western portion of Inner Mongolia Autonomous Region, northern Gansu and western Ningxia provinces (Figure 1A). With an area of 52,162 km2, the Badain Jaran Desert is the second largest desert in China (Zhu et al., 2010). The Tengger Desert is the fourth largest desert in China with an area of 42,700 km2 (Wu et al., 1980). This region has abundant solar energy resources and is home to the greatest concentration of grid-connected solar power farms in China (Xia et al., 2022a). The sunshine duration is between 2661 and 3406 h, and the average annual solar radiation reaches 1550–1819 kWh/(m2·a) (Figure 1A), which is higher than the lower limit of 1400 kWh/(m2·a) for the economic development feasibility of solar projects (Guo and Wang, 2014). The altitude of this region is between 800 and 1500 m, with an area of about 33.69 × 10⁴ km2. This region has a temperate continental arid climate with scarce water resources, high evaporation (about 1000 mm), an average annual temperature of 7.2°C, and average annual precipitation of 50–150 mm which concentrates in the plant growing season (from May to September). The natural landscape here is dominated by dunes, gravel desert, and desert grasslands. The natural vegetation is relatively sparse, mostly shrubs and semi-shrubs including Artemisia desertorum, Agriophyllum squarrosum, Allium mongolicum, Haloxylon ammodendron, Tamarix ramosissima, Halogeton arachnoideus, Peganum harmala, Neotrinia splendens, Calligonum mongolicum, Ephedra przewalskii, etc (Sun, 2018).
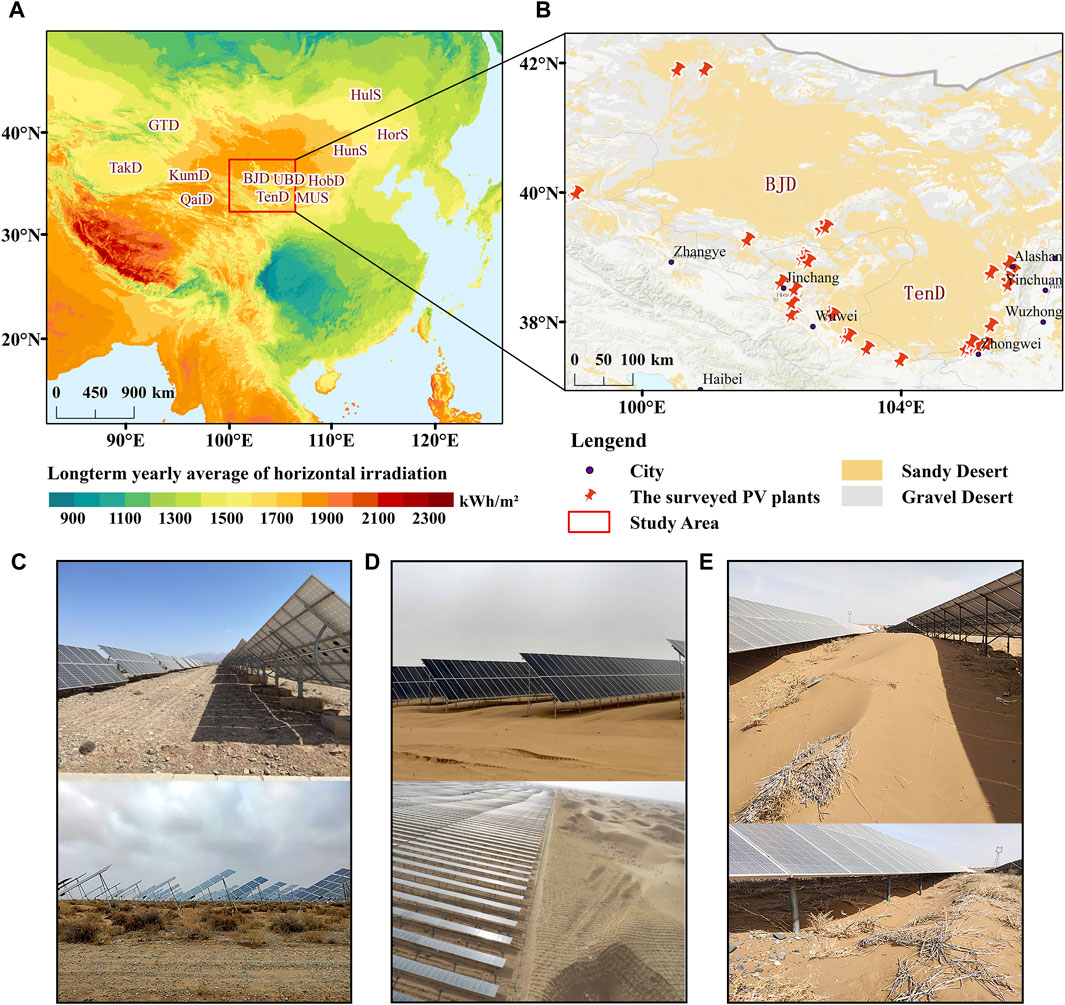
Figure 1. Map of the distribution of solar horizontal irradiance and large deserts in China [Data from The World Bank (Solar Energy Industries Association SEIA, 2022)]. Location of the Badain Jaran Desert and Tengger Desert (A), locations of the surveyed PV plants (B), gravel surface (C), sandy surface in PV plants (D) and PV plants subject to sand accumulation and wind erosion problems (E).
The used data in this paper come from a field investigation of 40 PV plants and remote sensing data in the study area. We used face-to-face questionnaire interviews with the operators of each plant. Figure 1B displays all the surveyed sites, including 23 gravel desert PV plants (Figure 1C) and 17 sandy desert ones (Figure 1D). The survey contents include basic information about PV plants, wind-sand disaster situations, wind-breaking and sand-fixing measures and their implementation areas, the types and growth conditions of natural vegetation, ecological construction measures and artificial planting vegetation types, the cleaning and maintenance cycle of PV panels, and so on (View the Supplementary Table A1 for the details of questionnaire’s contents). According to the survey, the wind and sand control and ecological construction of PV plants in desert can be classified into five modes: no measures (M1), artificial planting (M2), sand-prevention measures (M3), sand-prevention measures + artificial planting (M4), and sand-prevention measures + farming or animal husbandry (M5). The five modes are categorized for discussion according to the land surface type and policy impact. Additional information of each plant is provided in the Supplementary Table A2.
2.2 Ecological construction modes of PV plants
2.2.1 No measures (M1)
This mode (Figure 2A) refers to the natural restoration of ecosystems in PV plants without human intervention. This is because PV panels and their supports can reduce soil evaporation, block wind and sand, and decrease surface wind speed, thereby facilitating plant growth (Lu, 2013). In this mode, natural vegetation growth relies on precipitation and water from PV panel cleaning at no additional cost. However, this mode has the problems of relatively long vegetation restoration period and limited application areas (only in regions with relatively high rainfall and stable ground surface) (Cui et al., 2017).
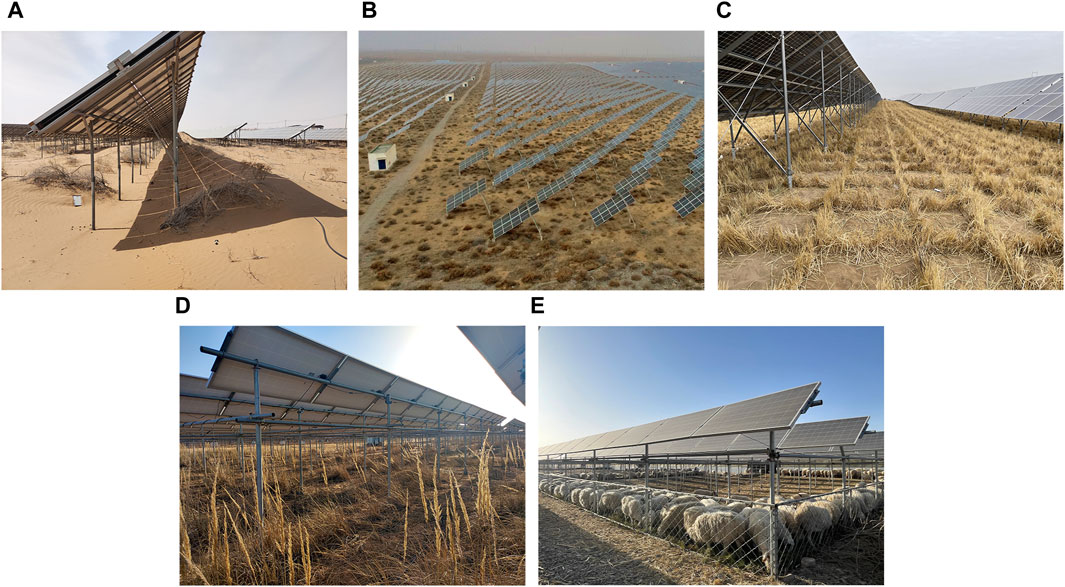
Figure 2. Different ecological construction modes status in PV plants. PV plants adopting modes of M1 (No measures) (A), M2 (Artificial planting) (B), M3 (Sand-prevention measures) (C), M4 (Sand-prevention measures + Artificial planting) (D), and M5 (Sand-prevention measures + Artificial planting) (E).
2.2.2 Artificial planting (M2)
This mode involves artificial planting of native shrubs or herbs, such as Haloxylon ammodendron, Hippophae rhamnoides, inside and around the perimeter of the PV plants. Additionally, low drought-tolerant windbreak and sand-fixing plants like Agriophyllum squarrosum, Medicago sativa, and Calligonum mongolicum, etc., can be planted beneath the PV equipment to serve as barrier against wind and blown sand (Cui et al., 2017; Mai and Bai, 2023) (Figure 2B). This mode is frequently visited in the PV plants at gravel desert. The gravel desert is flat, and the surface is predominantly covered with gravel of varying sizes. The strong winds allow the blown sand to travel through the PV equipment area rapidly. In these plants, accumulation, erosion, and other wind-related hazards are not severe, and sand control and fixing measures are not indispensable.
2.2.3 Sand-prevention measures (M3)
The M3 mode refers to the implementation of wind and sand control measures, including artificial sand fences, sand barriers with straw, high density polyethylene (HDPE) or clay, gravel coverage, and the establishment of grass grids that beneath, between, and around PV equipment to prevent wind and sand disasters (Lu, 2013; Cui et al., 2017; Shen et al., 2021; Mai and Bai, 2023). Artificial sand-prevention measures can increase the roughness of surface, reduce the wind speed, weaken the mobility of sand, and create more favorable conditions for the growth of natural plants, together with the improving of local climatic conditions by PV systems, so that it can also contribute to promoting plant growth (Cui et al., 2017; Shen et al., 2021; Yue et al., 2021; Mai and Bai, 2023). The lifespan of straw barrier is typically around 3 years. They offer effective sand control with relatively low costs, making them the preferred sand control method for PV plants (Figure 2C). Gravel coverage is also a common measure that mimics gravel desert surfaces, protects sand-fixing plants from wind erosion and burial while improving soil moisture conditions, which are beneficial for plant survival and growth. Nevertheless, due to the higher cost involved, gravel coverage is employed only selectively in the plants, typically applied to maintenance roads, the first several rows of PV panels at the boundary of the plants, and the vicinity of equipment foundations in order to effectively reduce surface wind erosion and dust generation from maintenance vehicles.
2.2.4 Sand-prevention measures + artificial planting (M4)
This mode combines the M2 and M3 modes and can effectively prevent the severe wind erosion disasters as well as improve vegetation survival rates in desert PV plants. The application of this integrated mode can accelerate the formation of organic crust on desert surfaces and gradually establish a stable green protective system, thereby promoting a virtuous cycle of the ecological environment in PV plants (Cui et al., 2017) (Figure 2D).
2.2.5 Sand-prevention measures + farming or animal husbandry (M5)
This integrated ecological construction mode combines sand-prevention and artificial planting measures with agricultural or livestock industries by means such as “power generation on the board, planting between the boards, and raising sheep under the boards (Xiao et al., 2021) (Figure 2E).” This mode can create more job opportunities, provide convenience for local farmers and herders, and generate economic, social, and ecological benefits (Xiao et al., 2021; Jing et al., 2022). In this mode, the PV modules must be raised from about 50 cm to more than 150 cm above the ground, while grass grids and drip irrigation pipelines are installed beneath the PV panels to cultivate forage grass and cash crops (Zhao and Zhong, 2022). This mode requires cooperation with neighboring herders to enable livestock access to the PV equipment area for foraging or to regularly harvest the grass under the panels for feeding livestock in the breeding area. This approach not only addresses the issue of excessive grass height in the PV equipment area, which leads to shading and reduced conversion efficiency of the modules, but also reduces the risk of fire in the PV plants (Hernandez et al., 2014; Vaverková et al., 2022).
2.3 Estimation of ecosystem service value
Costanza et al. (1997) proposed the ESV evaluation method and assessed the value of ecosystem services on a global scale. The method has been widely used for assessing the value of world ecosystem services and natural capital. Xie et al. (2001) further divided China’s grasslands into 18 ecosystem types and corrected the unit service function values using a biomass index, and the results has been referred and adopted by a group of following studies. Wang and Qin (2007) further improved this method from a remote sensing perspective, incorporating vegetation coverage data to better suit the specific context of China’s ecosystems. In the present study, the predominant land type found in the investigated PV plants belong to temperate desert ecosystem. We calculates the ESV per unit area of temperate desert in 2022 using the values proposed by Xie et al. (2001) for the year 2000 as the baseline data.
As economic indicators fluctuate over time, the ESV needs to be adjusted to the 2022 level. This adjustment is performed by Eqs 1, 2 as follows Costanza et al. (2014):
in which ESV (2022) and ESV (2000) represent the ESV per unit area of temperate desert grassland ecosystems in 2022 and 2000 ($ yr−1 ha−1). ICR is the inflation conversion rate, while CPI (2022) and CPI (2000) are the US consumer price index in 2022 and 2000. The ESV (2000) per unit area of temperate desert was 67.9 $ yr−1 ha−1 (Xie et al., 2001). The CPI (2000) and CPI (2022) are derived from U.S. Bureau of Labor Statistics data (U.S. Bureau of Labor Statistics, 2023). The U.S. CPI was used to calculate the inflation conversion rate to ensure comparability across different time periods, as the original ESV data from Xie et al. (2001) was estimated in U.S. dollars as well as the majority of following studies (Costanza et al., 2014; Liu et al., 2020).
The ESV of the PV plants area, which fluctuates over time and is proportional to the temperate desert ecosystem’s type, area, and quality, was estimated by adapting the method proposed by Costanza et al. (1997) of multiplying each biome’s land area by its unit value. Inspired by Liu et al. (2020), who used biomass proportion as an ecological parameter, we modified the biomass parameter with the more readily available vegetation coverage data to calculate the existing ESV and estimated the potential for its increase in the PV plants area. The calculation formulas Eqs (3, 4) are as follows:
where ESVi (N) ($ yr −1) represents the existing ESV of the ith PV plant. ESVi (P) ($ yr −1) indicates the value of ecosystem services that can be improved when ith PV plant takes ecological construction and reaches the threshold of vegetation coverage improvement. Si is the area (ha) of ith PV plant, and FVCi (N) is the existing growing season vegetation coverage of the ith PV plant. FVCp is the threshold of vegetation coverage. i = 1, 2, 3... 40, which represents the 40 investigated PV plants.
Existing total value of ecological services (ESVN) and total value of ecological services improvement potential (ESVP) of the 40 investigated PV plants are calculated by summing up the corresponding value of every plant as Eqs 5, 6:
In addition, we calculated the 95% confidence intervals for the mean fractional vegetation cover (FVCi (N)) at each surveyed PV power plant to quantify the margin of error in the derived potential ecological service values.
2.4 Other data sources
Normalized difference vegetation index data are acquired by the National Tibetan Plateau Scientific Data Center from the Aqua/Terra-MODIS satellite sensor MOD13Q1 product and land use data with a 250 m spatial resolution (Gao et al., 2023a). The FVC data at growing season are based on the vegetation index data set and calculated using the normalized difference vegetation index pixel dichotomy model, also with a 250 m spatial resolution (Gao et al., 2023b). The potential vegetation coverage used as the threshold value in Eq. 4 is set to 50%, because this value in a desert is sufficient to achieve sufficient windbreak and sand fixation benefits (Zhao, 2016).
3 Results
3.1 The current status of ecological construction in desert PV plants
3.1.1 Statistics of surveyed PV plants
We summarized the conditions of the surveyed PV plants based on five ecological construction modes as classified in Section 2.2. The total area of the plants is 112.85 km2, and the total installed capacity is 7029.97 MW. The large-scale PV plants (≥30 MW) are mainly distributed in the southeast and southwest parts of the Tengger Desert and the western part of the Badain Jaran Desert, while the middle and small scale plants (<30 MW) are mostly distributed in the desert margins and external areas (Figure 3A).
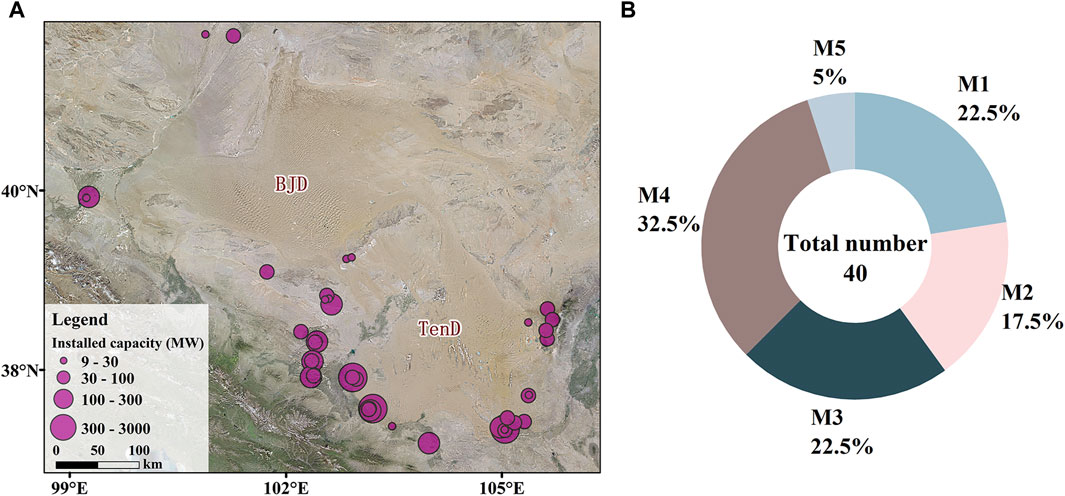
Figure 3. Spatial distribution map of installed capacity of PV plants (Satellite data from 2022 The ArcGIS Satellite) (A), pie chart of the proportions of five ecological construction modes in PV plants (B).
3.1.2 Statistics of ecological construction modes of the PV plants
The proportion of PV plants adopting each of the five ecological construction modes is shown in Figure 3B. It can be seen that the number of PV plants adopting the M4 is the largest of thirteen, followed by M1 and M3 with nine each. There are seven PV plants taking M2, accounting for 17.5%. The plants adopt the combination of sand-prevention measures and farming or animal husbandry (M5) have the least number of only two.
Although a large number of PV plants take the M4 mode, there are still 22.5% of PV plants that have not taken any measures, 40% of PV plants without sand-prevention measures, and 45% of PV plants that have not taken any artificial vegetation measures. In PV plants that adopt M1, there are serious wind and sand hazards (inter-panel sand accumulation and under-panel scouring), and sparse natural vegetation (Figure 1E). In the PV plants with M3, the wind-sand disaster is substantially controlled, the surface beneath and surrounding the PV panels is usually free of sand, and the vegetation density in the areas with sand control measures is significantly higher than the areas without measures. The M4 and M5 plants have the best treatment effects. There is no obvious sand damage in these plants, the vegetation is rich in variety and grows vigorously, and the average cleaning cycle of PV panels is reduced by 3–5 times per year on average.
3.1.3 Differences in ecological construction mode of PV plants over desert surface types
Figure 4A shows that the PV plants with M1 and M2 are primarily distributed on gravel desert, the ones with M3 and M4 mainly on sandy desert, and the number of PV plants with M5 is equally distributed on two kinds of deserts. From the perspective of the area (Figure 4B), installed capacity (Figure 4C), and power generation (Figure 4D) of the investigated PV plants, the proportion of plants adopting M4 is the largest in the sandy desert, which is 83.88%, 89.93% and 90.88%, respectively. The proportion of plants adopting M2 in the gravel desert is the largest, which is 56.40%, 54.54% and 57.74%, respectively. The PV plants in the sandy desert have a higher proportion of taking ecological construction than that of the gravel desert. This is due to the fact that wind and sand disasters on gravel desert are less severe, allowing for simpler measures, while sandy desert requires more ecological measures.
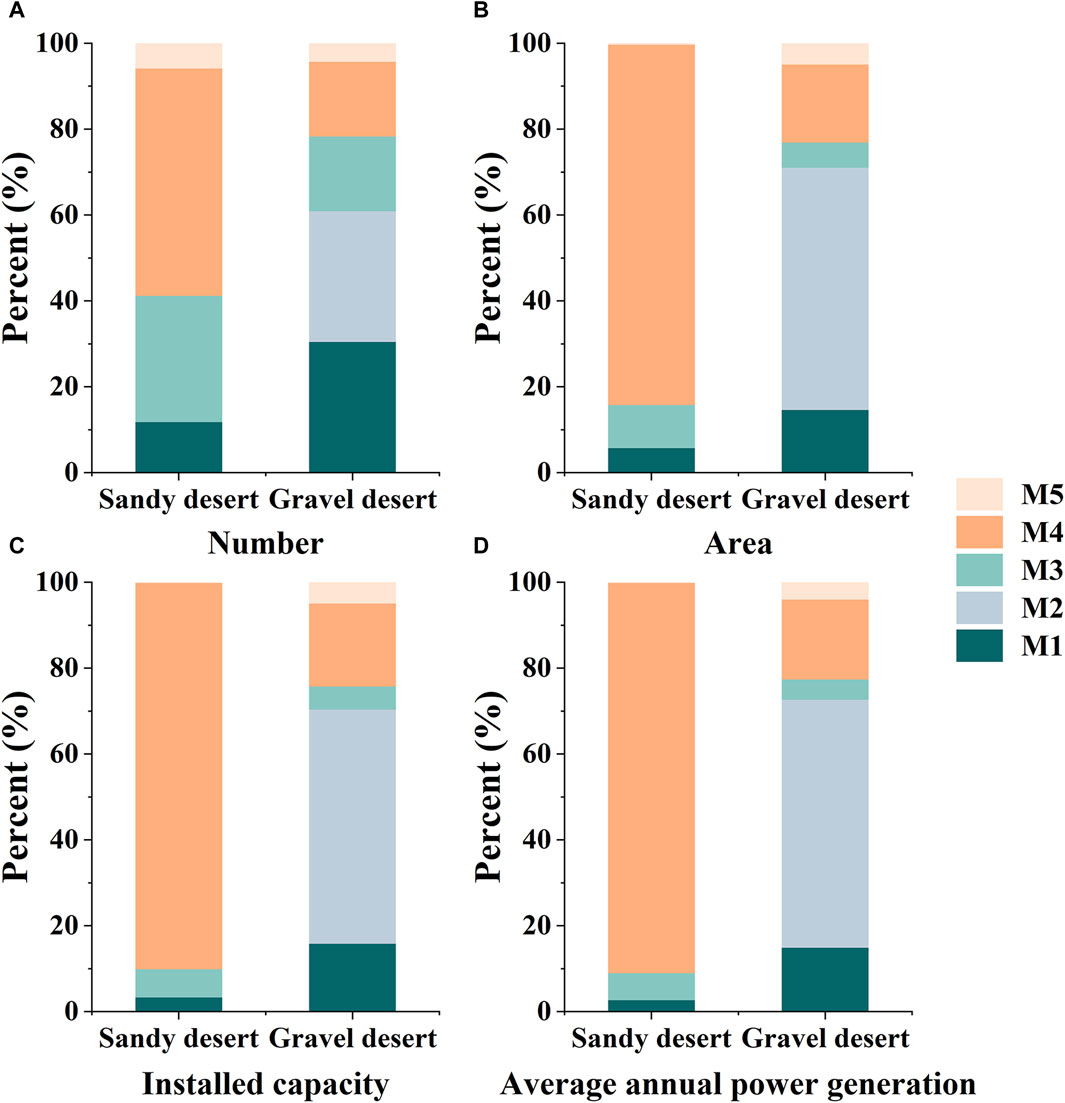
Figure 4. The ratios of number (A), area (B), installed capacity (C), and annual average power generation (D) of the investigated PV plants with five modes over sandy deserts and gravel deserts.
3.1.4 Changes in ecological construction mode of PV plants over time
The distribution of the number and scale of PV plants over time is shown in Figure 5A. All the surveyed PV plants were constructed between 2011 and 2022. Since 2011, both the construction number and total installed capacity of PV plants declined until 2017, when the construction number rebounded with an average installed capacity of 556 MW per plant. Compared to the situation before 2017, the average installed capacity of PV plants has increased by 7.9 times, indicating a recent emphasis on the development of large-scale PV farms in desert regions.
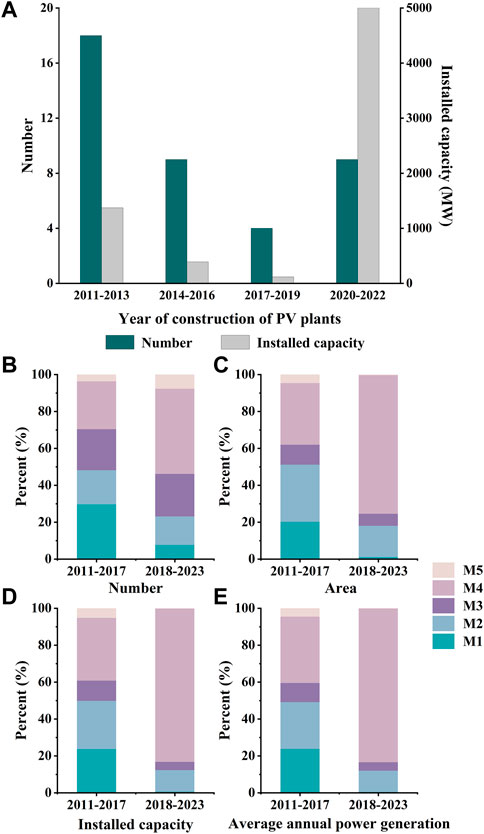
Figure 5. Distribution of the number and installed capacity of investigated PV plants by construction time (A), percentage of number (B), area (C), installed capacity (D), and average annual power generation (E) of the five ecological construction modes before and after 2017.
Figures 5B–E displays the change of each ecological construction mode adopted by PV plants over time. For the PV plants that built before 2017, the number of M1 is the largest, accounting for 29.6%. Among the PV plants built after 2017, M4 has the largest proportion (50%). From the perspective of the plant number, the proportion of M1 and M2 in the newly built PV plants after 2017 has both decreased by 21.3% and 1.9%, respectively, while the proportion of M3 and M4 has increased by 2.8% and 24.1%, respectively (Figure 5B). From the perspective of construction area (Figure 5C), installed capacity (Figure 5D), and annual average power generation (Figure 5E) of PV plants, the proportion of plants adopting M4 after 2017 increased to 75.1%, 83.0% and 83.3% from 41.7%, 49.0% and 47.3% before 2017, respectively. We observed a significant change in the ecological construction mode adopted by PV plants around 2017, and we will discuss the reasons in the following sections.
3.2 Analysis of ESV changes in PV plants investigated under different modes
The statistical analysis of the growing season vegetation coverage in the surveyed PV power plants under different ecological construction modes (Table 1) reveals a significant enhancement in vegetation. As the ESV is linearly related to the FVC, the improvement in ESV can be represented by the changes of FVC. In the M1 mode plants that rely solely on the natural restoration of vegetation after the construction, the average FVC at growing season increase from initially 5.92%–10.31% by 2022, resulting in an increase of 74% of the ESV. The M2 mode plants experienced a 5.73% increase in FVC, with the ESV being enhanced by 102%. The M3 mode and M5 mode had relatively lower ESV enhancements of 16% and 12%, despite their higher initial FVC. It is worth noting that the M5 mode plants that incorporate grazing activities within the site still exhibited overall increasing trend in vegetation coverage, despite being significantly influenced by human activities. However, due to the limited sample size of only two PV power plants in the M5 mode, further validation of this result is required. The M4 mode achieved the highest average growing season FVC among the five modes, reaching 14.53%, with the ESV being enhanced by 58%.
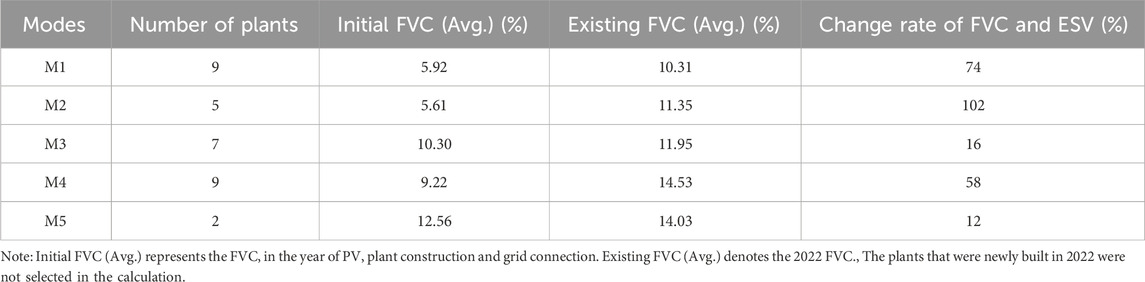
Table 1. Growing season vegetation coverage and ESV change rate in the surveyed PV power plants under different ecological construction modes.
These findings demonstrate that PV plants can facilitate vegetation restoration and enhance ecological service functions, with a 74% increase in the average growing season FVC of the nine PV plants adopting the M1 mode. However, ecological improvement activities, such as sand control measures and artificial vegetation planting, can significantly increase the upper limit of FVC in desert regions from 10.31% (M1) to 14.53% (M4). The M4 mode is the most effective in improving FVC and ESV, followed by the M2 mode. Notably, the M5 mode not only facilitates ecological restoration but also provides additional economic benefits to local residents, suggesting considerable development potential for a sustainable future that balances environmental conservation with socio-economic growth.
3.3 Estimation of ESV potential of PV plants
The PV plants that carry out ecological construction can produce significant biomass increase, promote rapid vegetation growth, and have a high ESV (Liu et al., 2020; Xia et al., 2022b). From 2011 to 2022, the average FVC in the vegetation growing seasons of the surveyed PV plants (under all ecological construction modes) increased from 8.5% to 10.5%, with an average annual increase of 0.2%. While this growth rate is limited, the maximum fractional growing season vegetation coverage increased from 33.6% to 57.9% during the same period (Figure 6), with the highest value observed in a PV plant adopting the M4 mode, indicating the substantial potential for ecological restoration in PV plants. However, to fully realize this potential, it is essential for all PV plants to adopt comprehensive sand control measures and artificial ecological construction. With these measures, the FVC can be increased to about 50% in the future, which is the threshold required to fix the sandy surface in the desert and significantly reduce wind and sand problems (Zhao, 2016). It provides additional ecological and environmental benefits by enhancing carbon fixation, which in turn reduces the negative impact of PV plants construction. It also has a positive impact on the planning, policy and management, and sustainability of large-scale PV systems.
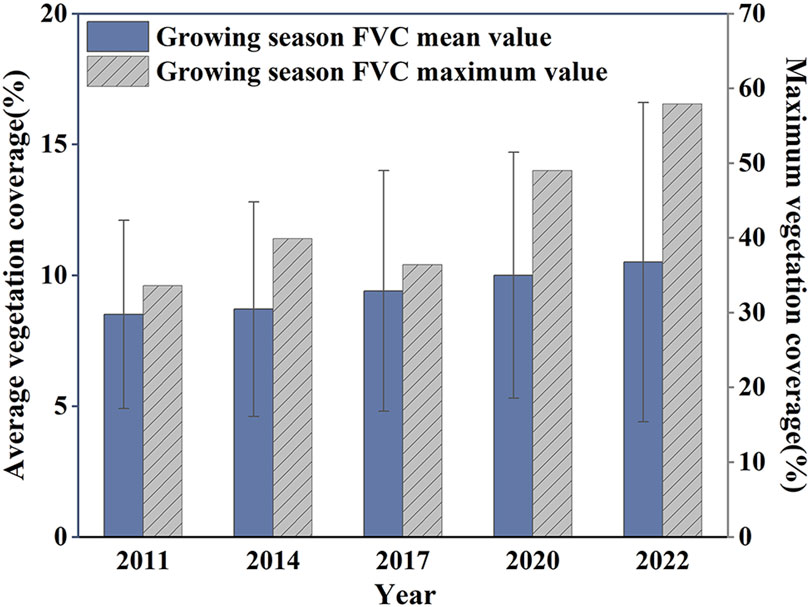
Figure 6. Average and maximum growing season FVC changes in the surveyed PV plants.
Using the ESV assessment model, the total ESV provided by the surveyed PV plants at the current stage and after implementing ecological construction were calculated (Table 2). The results show that the investigated PV plants can provide an average of approximately $1.2 million of ESV per year, and if artificial ecological construction is effectively implemented and given sufficient growing time, the ESV provided by the plants could be increased by 7.7 (7.1–8.3, confidence interval, and the same below) times to approximately $8.9 (8.2–9.5) million per year.
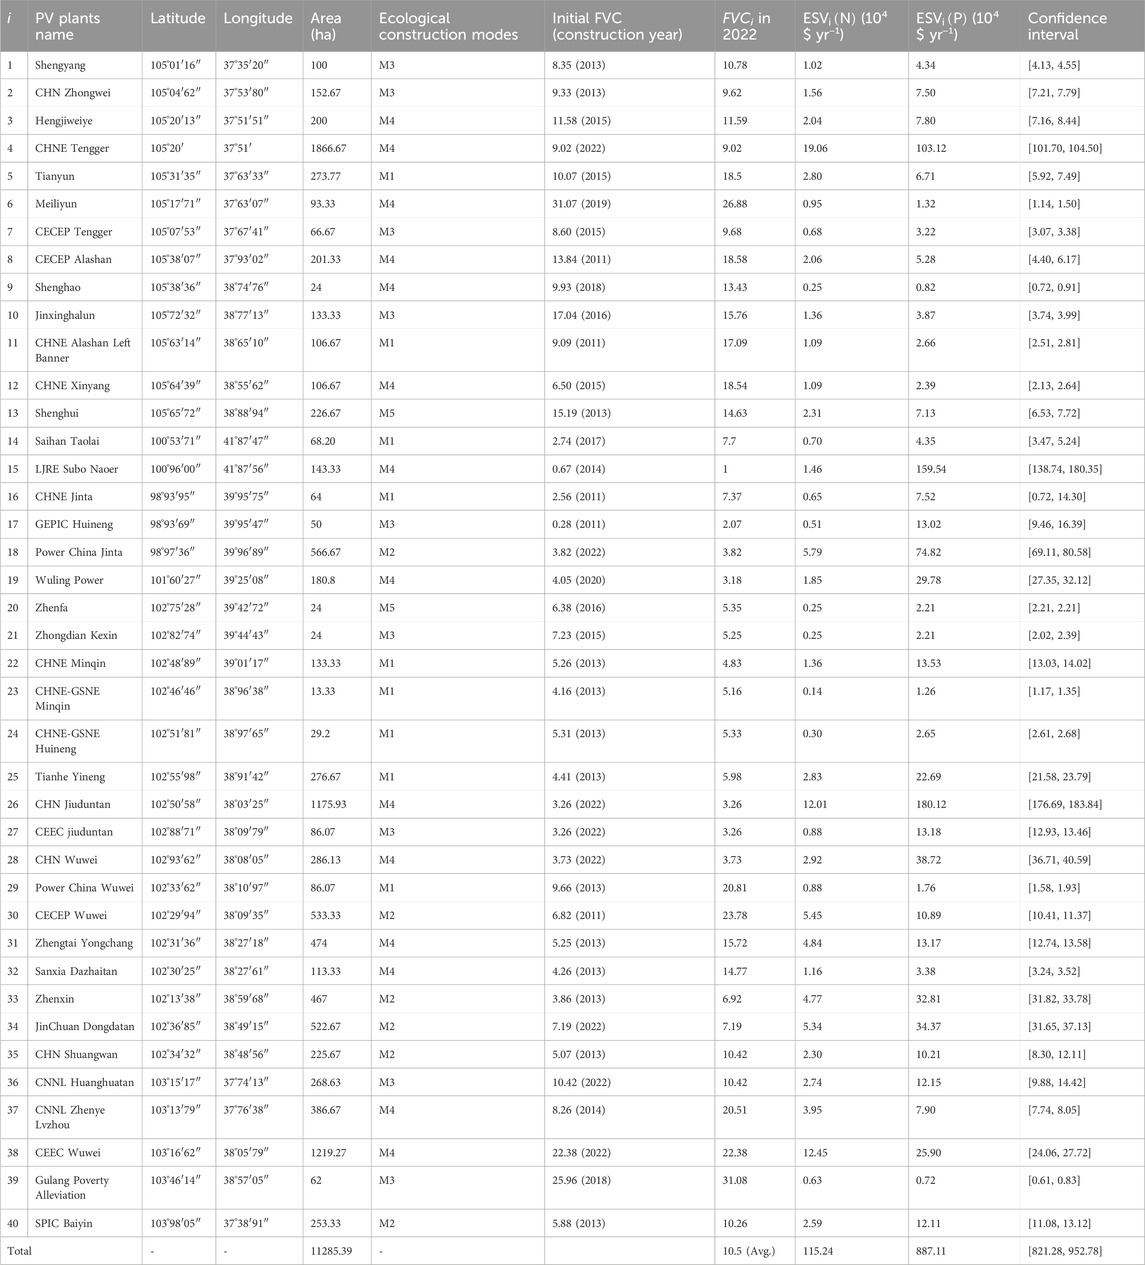
Table 2. The existing ecosystem service value (ESVN) and the potential for enhancing ecosystem service value (ESVP) of the surveyed PV plants.
4 Discussion
4.1 Ecological construction contributes to enhancing ESV in desert
Desert has become the hot development zone of large-scale wind and PV farms. According to China’s Renewable Energy Development Plan, the total installed capacity of wind and solar power farms in desert will reach 200 GW in 2025 and 455 GW in 2030 (National Development and Reform Commission and National Energy Administration, 2021). The rapid development of renewable energy in desert faces great challenges, as wind and sand activities, as well as the expansion of desertification land, pose serious threats to the safety and sustainable development of PV plants. Previous studies have indicated that the construction activities of PV plants, especially the leveling of ground, can disrupt the original soil environment, leading to a significant decline in vegetation coverage and very fragile surface soil (Wu et al., 2014; Hernandez et al., 2015).
However, in most deserts, the degradation of vegetation caused by the construction of PV plants is small. This is partially due to the fact that these regions may have very little vegetation prior to the installation of the plants, but more importantly that the vegetation removed during the construction process can be recovered after the completion of the PV plants (Wu et al., 2014; Uldrijan et al., 2021; Xia et al., 2022b). Furthermore, the installation of PV plants can alter the local microclimate, regulate the thermal balance in desert, reduce the amount of wind-blown sand, and contribute to the improvement of growth conditions for plants in arid regions (Chang et al., 2016). Previous studies utilizing remote sensing imagery, field monitoring, and surveys have found that the construction of PV plants has resulted in significant vegetation changes, with most PV plants showing positive vegetation growth, while a few PV plants resulted in vegetation degradation (Chang et al., 2018; Liu et al., 2020; Uldrijan et al., 2021; Xia et al., 2022b; Luo et al., 2023). The 74% increase of FVC in the surveyed plants with M1 mode proves this ecological enhancement ability of PV system. Moreover, the less surface-disturbing construction methods such as the using of screw pile are increasingly used in the new plants. The Sanxia Dazhaitan (No. 32 in Table 2) plant, as an example of coexistence between PV panels and Hippophae rhamnoides in the Tengger Desert near Jinchang, Gansu Province, provides additional evidence of the function of PV panels in improving the overall environment against erosion.
In addition, numerous biological soil crusts were found around the drip lines beneath the PV plants (Figures 7E, F). The presence of these biological crusts enhances the stability of desert soil, reduces soil erosion, and fosters the recovery of desert ecosystems (Li X. et al., 2018; Choi et al., 2020; Luo et al., 2023). This occurrence is attributed to the periodic cleaning operations required to remove dust particles from the PV panel surfaces. According to the survey results, the PV panels are typically cleaned 7–8 times per year. During the cleaning process, the PV panels intercept a portion of the cleaning water that drops from the edges and gaps of the panels and forms drip lines beneath. As substantial cleaning water falling to the ground, the soil moisture content increases, thereby providing the growth of vegetation underneath the panels (Figures 7D, E). It is important to note that although the PV plants are situated in the desert where water evaporates quickly, the regular cleaning operations ensure a consistent supply of water to the ground surfaced, which significantly helps the vegetation growth and biological crust development.
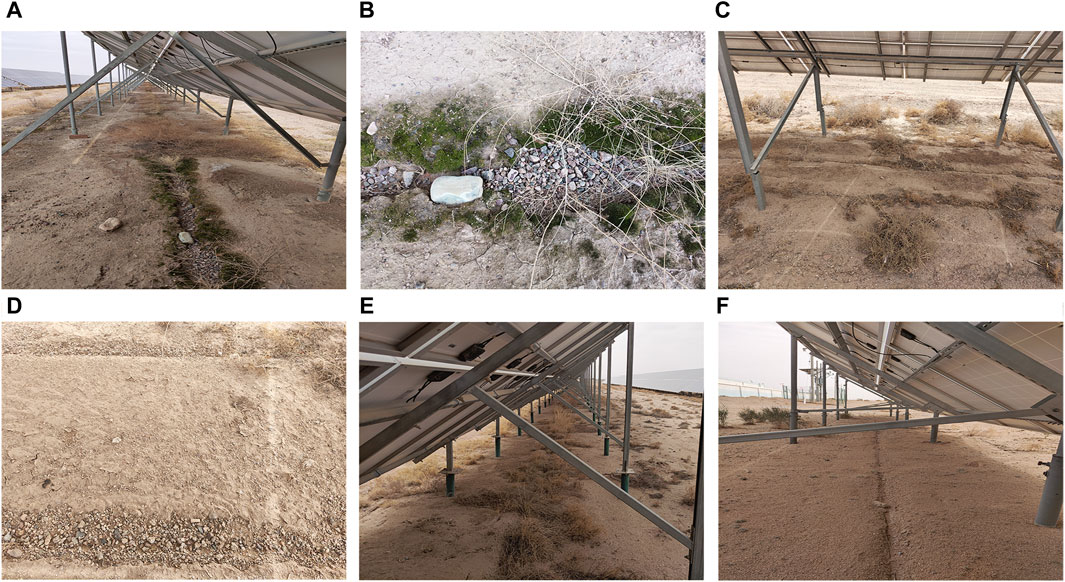
Figure 7. Cleaning water and rainwater flow down through the gaps between PV panels, forming drip lines (A,B), hydraulic erosion lines (C,D), moss and biological crusts (E,F) around the drip lines.
Unfortunately, the intensity of these positive effects is inherently limited, and the resulting change processes can be very slow. Implementing wind-break and sand-fixation measures, as well as artificial planting (M4) in PV plants, can effectively prevent and control wind and sand disasters, protect soil from erosion, enhance vegetation coverage, and provide higher ESV. This approach enables the simultaneous development of ecology and economy, achieving a synergy effect between environmental and economic benefits. All of these suggest that vegetation construction in desert PV plants has a promising future.
4.2 Restrictions of ecological construction in current PV plants
The rapid development of PV industry necessitates a heightened focus on its ecological functions (Semeraro et al., 2022). However, 22.5% of the surveyed PV plants still did not take any sand prevention or vegetation construction measures, and 45% of them did not take artificial vegetation construction measures. In addition to the differences of surface landforms, the implementation of ecological construction measures for PV plants is also affected by resource shortages and economic costs.
The scarcity of resources in desert is primarily due to the prevalent aridity and water scarcity. It is estimated that the northwest China’s deserts will require an additional 20 billion cubic meters of water per year from 2010 to 2030, and the water scarcity crisis will exacerbate due to climate change and human activity (Wu et al., 2014). Water is mainly sourced from water tankers and groundwater wells for daily consumption and panel cleaning in the PV plants, while some PV plants located near towns could access tap water. However, a substantial portion of the water used for PV plants cleaning is lost via surface runoff, which can even contribute to hydraulic erosion beneath the panel (Figures 7A–D). The limited water resources are not fully utilized.
The issue of economic cost primarily arises from the significant human labor and financial resources required for the ecological construction of PV plants, which may take several years to yield returns (Jing et al., 2022). The increase in the construction and operational costs of the PV plants may dampen the desire of owners to carried out ecological construction practices (Li et al., 2020). Although the ecological construction of the plants can generate substantial ESV, these potential values cannot be directly transferred to the plant owners and operators (Semeraro et al., 2022). Therefore, additional policy support to encourage investment in ecological construction initiatives is required if we want to obtain the high potential ESV (Li et al., 2020). Ecological construction measures and their economic costs vary largely under different ecological modes (see 2.2.3), So that the accurate assessment of their economic costs and benefits requires further study, as well as reasonable financial policies (regulation, subsidies or taxes).
4.3 Unsatisfactory effects of current ecological construction measures in PV plants
The effectiveness of existing sand-prevention and artificial planting measures in the PV plants may not meet expectations (Mai and Bai, 2023). According to the survey, only 36.4% of the PV plants with artificial planting would reseed grass in the later stages, while the remaining plants have not implemented any maintenance measures, thereby failing to guarantee the survival rate of plants after ecological construction. Moreover, only 23% of the plants have a vegetation maintenance regulation, and would irrigate periodically. As a result, the anticipated ecological and economic benefits may not be achieved.
Our study also revealed that many PV plants lack scientific sand control and ecological construction guidelines during the construction phase. In terms of sand control, the surveyed plants only implemented limited traditional methods such as straw barrier and surface compaction with gravel, while many updated techniques such as new materials sand barriers, environmental-friendly chemical sand stabilization materials, and bio crust were not utilized. Also, no effective standards were developed for the implementation area of the sand control measures. Some plants covered the whole equipment area with sand control measures but without specific targeting, resulting in the waste of funds. Others only built barriers at places with severe sand damage without considering the source or transportation path of sands, leading to an incomplete protection system with low control effectiveness. In terms of ecological construction, most surveyed PV plants adopt the approach of artificial vegetation establishment by sowing mixed grass species. However, due to the absence of sufficient irrigation, the lack of a mature irrigation system, and the inadequacy of plant species selection, issues arise such as low plant survival rates and excessive plant growth obstructing the PV panels.
It is evident that the current implementation of ecological construction measures may only address the dichotomous question of “presence or absence” of such measures, while the actual ecological outcomes have not received adequate attention. The future challenges include developing tailored and scientifically sound ecological construction plans, conducting reasonable evaluations on the ecological construction effects to quantify the generated economic and ecological benefits, and correcting underperforming projects (Shen et al., 2021).
4.4 Strong policies can stimulate the ecological construction of PV plants
Energy policy plays a crucial role in driving the rapid development of PV plants in China (Li et al., 2020). Since 2017, the Chinese government has demonstrated a heightened focus on modes such as “solar energy + sand control” and “solar energy + ecological restoration,” accompanied by the implementation of a series of policies designed to foster the development of desert ecological PV plants. For instance, in 2017, the Ministry of Land and Resources issued a notification indicating that no administrative fees would be imposed on PV + projects that change land use types, thereby reducing land utilization costs (Ministry of Land and Resources, 2017). In 2019, “PV +” projects received priority in renewable subsidy payments, providing support for off-grid projects that aimed at poverty alleviation (Shen et al., 2021). In 2020, the Inner Mongolia energy regulatory agency prioritized the development of integrated solar energy projects incorporating desertification control measures, terminating subsidies for standalone solar PV plants that fail to contribute to ecological restoration efforts (IMAR Development and Reform Commission, 2020). Additionally, some regional authorities have declared more favorable policies for the innovative application of solar PV projects installed on barren land and deserts (Ministry of Natural Resources et al., 2023).
In line with the implementation of these boosting government policies, the construction quantity and scale of PV plants reached a turning point at 2017, initially declining but subsequently recovering. The ecological construction modes adopted by PV plants have undergone a significant transformation since the same time point. Among the 13 newly built PV plants after 2017, 12 (92%) adopted M2 to M5 modes, with 7 (54%) employing M4 and M5 modes. The proportion of PV plants employing the M4 mode has risen substantially in terms of construction area, installed capacity, and annual average power generation. This shift in ecological construction modes has led to an increase in the FVC and corresponding ESV values for the region, with PV plants adopting M2 to M5 measures experiencing an approximately 7.2% improvement of net ESV from the completion of PV plants to 2022. We therefore recommend the government to encourage and guide PV plants in adopting scientific ecological construction measures, thereby promoting the ecological construction and sustainable development of PV plants in desert regions.
5 Conclusion
This research presents a comprehensive study based on field survey and remote sensing investigations of 40 PV plants in the Badain Jaran Desert and Tengger Desert, two of the hot solar energy exploration areas in China. We examine the existing ecological construction mode and key influencing factors of PV plants, and estimate the current and potential ecosystem service value (ESV) within the investigated plant areas.
We found that PV plants without ecological construction (M1 mode) boost vegetation cover by 74%, highlighting their capacity to enhance desert ecosystems. However, the highest FVC only reaches approximately 10%. By implementing sand control and vegetation planting measures, the average growing season FVC can be elevated to 14.53%, with a peak of 57.9%. Currently, 22.5% of PV plants lack ecological construction measures, 40% lack sand control, and 45% do not employ vegetation, agricultural, or pastoral measures. Nevertheless, over 92% of PV plants constructed after 2017 have adopted at least one ecological construction mode (M2 to M5). The key factors influencing the choice of ecological construction mode are land surface types, policy support, water scarcity, and ecological construction costs. The surveyed plant areas’ annual ecological service value could surge from $1.2 million to $8.9 (8.2–9.5) million, representing a 7.7-fold (7.1–8.3) increase. This substantial ESV deserves further attention and policy guidance.
It is noteworthy that large-scale PV farms face several challenges regarding ecological improvement. These include the lack of scientific sand control management and ecological construction guidelines, inadequate evaluation of the ecological service value (ESV) of implemented ecological construction measures, and the failure to achieve the desired ecological, economic, and social benefits. In the future, it is crucial to establish sand control and ecological construction guidelines tailored to PV plants in desert areas, considering various factors like land surface types, sand disaster status, water availability, and vegetation conditions. Additionally, evaluations must be conducted on the economic costs of various ecological construction modes, along with on-site assessments of the ecological service value of large-scale PV plants.
Data availability statement
The original contributions presented in the study are included in the article/Supplementary Material, further inquiries can be directed to the corresponding author.
Author contributions
YW: Data curation, Formal Analysis, Investigation, Visualization, Writing–original draft. BL: Conceptualization, Funding acquisition, Methodology, Resources, Supervision, Writing–review and editing. YX: Data curation, Investigation, Writing–review and editing. HP: Funding acquisition, Project administration, Supervision, Writing–review and editing. HW: Project administration, Supervision, Writing–review and editing. JZ: Project administration, Supervision, Writing–review and editing.
Funding
The author(s) declare that financial support was received for the research, authorship, and/or publication of this article. This research was funded by the National Key R&D Program of China (grant number 2022YFB4202102), the National Natural Science Foundation of China (grant number 42071014), and the Excellent Member of Youth Innovation Promotion Association CAS (grant number Y202085).
Conflict of interest
Authors HP, HW, and JZ were employed by Northwest Engineering Corporation Limited.
The remaining authors declare that the research was conducted in the absence of any commercial or financial relationships that could be construed as a potential conflict of interest.
Publisher’s note
All claims expressed in this article are solely those of the authors and do not necessarily represent those of their affiliated organizations, or those of the publisher, the editors and the reviewers. Any product that may be evaluated in this article, or claim that may be made by its manufacturer, is not guaranteed or endorsed by the publisher.
Supplementary material
The Supplementary Material for this article can be found online at: https://www.frontiersin.org/articles/10.3389/fenvs.2024.1406546/full#supplementary-material
References
Borrelli, P., Robinson, D. A., Panagos, P., Lugato, E., Yang, J. E., Alewell, C., et al. (2020). Land use and climate change impacts on global soil erosion by water (2015-2070). Proc. Natl. Acad. Sci. 117 (36), 21994–22001. doi:10.1073/pnas.2001403117
Chang, Z. F., Liu, S. Z., Zhu, S. J., Han, F. G., Zhong, S. N., and Duan, X. F. (2016). Ecological functions of PV power plants in the Desert and gobi. J. Resour. Ecol. 7 (2), 130–136. doi:10.5814/j.issn.1674-764x.2016.02.008
Chang, Z. F., Wang, Q., and Liu, S. Z. (2018). Sand fixation effect of photovoltaic field of gobi desert - take Gansu hexi corridor as an example (in Chinese with English abstract). Soil Water Conservation China. 08, 18–22. doi:10.14123/j.cnki.swcc.2018.0172
China Securries Journal (2022). The 14th Five-Year Plan" installed capacity of about 200 million kilowatts, the second batch of scenery base planning landing. Available at: https://www.cs.com.cn/cj2020/202202/t20220228_6245405.html (Accessed May 31, 2023).
Choi, C. S., Cagle, A. E., Macknick, J., Bloom, D. E., Caplan, J. S., and Ravi, S. (2020). Effects of revegetation on soil physical and chemical properties in solar photovoltaic infrastructure. Front. Environ. Sci. 8, 140. doi:10.3389/fenvs.2020.00140
Costanza, R., d'Arge, R., de Groot, R., Farber, S., Grasso, M., Hannon, B., et al. (1997). The value of the world's ecosystem services and natural capital. Nature 387 (6630), 253–260. doi:10.1038/387253a0
Costanza, R., de Groot, R., Sutton, P., van der Ploeg, S., Anderson, S. J., Kubiszewski, I., et al. (2014). Changes in the global value of ecosystem services. Glob. Environ. Change-Human Policy Dimensions 26, 152–158. doi:10.1016/j.gloenvcha.2014.04.002
Cui, Y. Q., Feng, Q., Sun, J. H., and Xiao, J. H. (2017). A review of revegetation patterns of photovoltaic plant in northwest China. Bull. Soil Water Conservation 37 (3), 200–203. doi:10.1016/j.seta.2023.103120
Gao, J. X., Zhang, H. W., Zhang, W. G., Chen, X. H., Shen, W. M., Xiao, T., et al. (2023a) “Data from: China regional 250m normalized difference vegetation index data set (2000-2022),” in National Tibetan plateau date center third Pole environment data center. doi:10.11888/Terre.tpdc.300328
Gao, J. X., Zhang, H. W., Zhang, W. G., Chen, X. H., Shen, W. M., Xiao, T., et al. (2023b) “Data from: China regional 250m fractional vegetation cover data set (2000-2022),” in National Tibetan plateau date center third Pole environment data center. doi:10.11888/Terre.tpdc.300330
Grodsky, S. M., and Hernandez, R. R. (2020). Reduced ecosystem services of desert plants from ground-mounted solar energy development. Nat. Sustain. 3 (12), 1036–1043. doi:10.1038/s41893-020-0574-x
Guo, J. B., and Wang, Y. (2014) Key technology of photovoltaic power plants design. Beijing: China Electric Power Press.
Hernandez, R. R., Easter, S. B., Murphy-Mariscal, M. L., Maestre, F. T., Tavassoli, M., Allen, E. B., et al. (2014). Environmental impacts of utility-scale solar energy. Renew. Sustain. Energy Rev. 29, 766–779. doi:10.1016/j.rser.2013.08.041
Hernandez, R. R., Hoffacker, M. K., Murphy-Mariscal, M. L., Wu, G. C., and Allen, M. F. (2015). Solar energy development impacts on land cover change and protected areas. Proc. Natl. Acad. Sci. U. S. A. 112 (44), 13579–13584. doi:10.1073/pnas.1517656112
Hertwich, E. G., Gibon, T., Bouman, E. A., Arvesen, A., Suh, S., Heath, G. A., et al. (2015). Integrated life-cycle assessment of electricity-supply scenarios confirms global environmental benefit of low-carbon technologies. Proc. Natl. Acad. Sci. 112 (20), 6277–6282. doi:10.1073/pnas.1312753111
IEA Photovoltaic Power Systems Programme (2018). Snapshot of global PV markets 2018. Available at: https://iea-pvps.org/wp-content/uploads/2020/01/IEA-PVPS_-_A_Snapshot_of_Global_PV_-_1992-2017.pdf (Accessed May 25, 2023).
IEA Photovoltaic Power Systems Programme (2023). Snapshot of global PV markets 2023. Available at: https://iea-pvps.org/snapshot-reports/snapshot-2023/ (Accessed May 25, 2023).
IMAR Development and Reform Commission (2020). Inner Mongolia electricity sector Reform plan. Available at: https://www.ndrc.gov.cn/fzggw/jgsj/tgs/sjdt/201610/W020190906633217378679.pdf (Accessed May 31, 2023).
Jing, R., He, Y., He, J. J., Liu, Y., and Yang, S. B. (2022). Global sensitivity based prioritizing the parametric uncertainties in economic analysis when co-locating photovoltaic with agriculture and aquaculture in China. Renew. Energy 194, 1048–1059. doi:10.1016/j.renene.2022.05.163
Li, B., Wang, Y., Xia, G. C., and Jiang, G. (2020). Comparative efficacy of treatments for patients with knee osteoarthritis: a network meta-analysis. Qinghai Sci. Technol. 25 (05), 27–33. doi:10.1186/s40001-020-00426-1
Li, X., Tan, H., Hui, R., Zhao, Y., Huang, L., Jia, R., et al. (2018a). Researches in biological soil crust of China: a review. Chin. Sci. Bull. 63 (23), 2320–2334. doi:10.1360/N972018-00390
Li, Y., Kalnay, E., Motesharrei, S., Rivas, J., Kucharski, F., Kirk-Davidoff, D., et al. (2018b). Climate model shows large-scale wind and solar farms in the Sahara increase rain and vegetation. Science 361 (6406), 1019–1022. doi:10.1126/science.aar5629
Liu, Y., Zhang, R. Q., Ma, X. R., and Wu, G. L. (2020). Combined ecological and economic benefits of the solar photovoltaic industry in arid sandy ecosystems. J. Clean. Prod. 262, 121376. doi:10.1016/j.jclepro.2020.121376
Lu, X. (2013) The environmental effect analysis of PV power plant construction in desert gobbi —take dongdongtan million kilowatt solar power demonstration base, jiuquan city as an example. LanZhou University. [dissertation/master's thesis], [LanZhou (GanSu)].
Luo, L. H., Zhuang, Y. L., Liu, H., Zhao, W. Z., Chen, J. Z., Du, W. T., et al. (2023). Environmental impacts of photovoltaic power plants in northwest China. Sustain. Energy Technol. Assessments 56, 103120. doi:10.1016/j.seta.2023.103120
Mai, F. J., and Bai, R. L. (2023). Discussion on PV desertification control Scheme (in Chinese with English abstract). Sol. Energy 01, 30–34. doi:10.19911/j.1003-0417.tyn20211202.06
Marco, De, Irene, S., Teodoro, P., Rita, M., Aretano, R., and Zurlini, G. (2014). The contribution of Utility-Scale Solar Energy to the global climate regulation and its effects on local ecosystem services. Glob. Ecol. Conservation 2, 324–337. doi:10.1016/j.gecco.2014.10.010
Marrou, H., Dufour, L., and Wery, J. (2013). How does a shelter of solar panels influence water flows in a soil-crop system? Eur. J. Agron. 50, 38–51. doi:10.1016/j.eja.2013.05.004
Mekhilef, S., Saidur, R., and Safari, A. (2011). A review on solar energy use in industries. Renew. Sustain. Energy Rev. 15 (4), 1777–1790. doi:10.1016/j.rser.2010.12.018
Ministry of Land and Resources (2017). Opinions on supporting PV poverty alleviation and regulating land use for PV power generation industry. Available at: www.nea.gov.cn/2017-10/10/c_136669687.htm (Accessed july 25, 2020).
Ministry of Natural Resources, PRC., National Forestry and Grassland Administration., and Administration (2023). Notice on supporting the development of photovoltaic power generation industry and regulating land use management related work. Available at: https://www.gov.cn/zhengce/zhengceku/2023-04/03/content_5749824.htm (Accessed May 20, 2023).
National Development and Reform Commission, and National Energy Administration (2021). China’s 14th five-year plan for renewable energy development. Available at: https://www.ndrc.gov.cn/xwdt/tzgg/202206/P020220602315650388122.pdf (Accessed July 14, 2023).
National Energy Administration (2023). Construction and operation status of photovoltaic power generation in 2022. Available at: http://www.nea.gov.cn/2023-02/17/c_1310698128.htm (Accessed June 11, 2023).
National Forestry and Grassland Administration (2015). State bulletin of desertification and desertification in China. Available at: https://www.forestry.gov.cn/main/65/20151229/835177.html (Accessed May 31, 2023).
People's Daily Overseas Edition (2023). Three ministries jointly issue document to encourage the construction of large-scale photovoltaic power plants in desert. Available at: https://www.gov.cn/zhengce/2023-04/06/content_5750194.htm (Accessed june 11, 2023).
Riahi, K., Dentener, F., Gielen, D., Grubler, A., Jewell, J., Klimont, Z., et al. (2012). “Energy pathways for sustainable development,” in Global energy assessment: toward a sustainable future (Cambridge: Cambridge University Press), 1205–1306.
Scarrow, R. (2020). Solar plants versus desert plants. Nat. Plants 6 (8), 908. doi:10.1038/s41477-020-00753-5
Semeraro, T., Scarano, A., Santino, A., Emmanuel, R., and Lenucci, M. (2022). An innovative approach to combine solar photovoltaic gardens with agricultural production and ecosystem services. Ecosyst. Serv. 56, 101450. doi:10.1016/j.ecoser.2022.101450
Shen, W., He, J. J., and Yao, S. H. (2021). Green industrial policy in the post grid parity era: governing integrated Solar + projects in China. Energy Policy 150, 112129. doi:10.1016/j.enpol.2020.112129
Solar Energy Industries Association (SEIA) (2022) Data from: global solar atlas 2.0-solar resource data-global horizontal irradiation. Available at: https://solargis.com/maps-and-gis-data/download/world.
Sun, J. (2018) Biodiversity of the plant community and ecosystem assessments at different scales in alxa deserts. LanZhou University. [dissertation/doctoral's thesis], [LanZhou (GanSu)].
Tanner, K. E., Moore-O'leary, K. A., Parker, I. M., Pavlik, B. M., and Hernandez, R. R. (2020). Simulated solar panels create altered microhabitats in desert landforms. Ecosphere 11 (4). doi:10.1002/ecs2.3089
Uldrijan, D., Kováčiková, M., Jakimiuk, A., Vaverková, M. D., and Winkler, J. (2021). Ecological effects of preferential vegetation composition developed on sites with photovoltaic power plants. Ecol. Eng. 168, 106274. doi:10.1016/j.ecoleng.2021.106274
U.S. Bureau of Labor Statistics (2023). Consumer price index summary. Available at: https://www.bls.gov/news.release/ (Accessed May 20, 2023).
Vaverková, M. D., Winkler, J., Uldrijan, D., Ogrodnik, P., Vespalcová, T., Aleksiejuk-Gawron, J., et al. (2022). Fire hazard associated with different types of photovoltaic power plants: effect of vegetation management. Renew. Sustain. Energy Rev. 162, 112491. doi:10.1016/j.rser.2022.112491
Wang, R. J., and Qin, Z. H. (2007). Valuation of Chinese grassland ecosystem services using MODIS data (in Chinese with English abstract). Chin. J. Grassl. 29 (1), 50–54. doi:10.3969/j.issn.1673-5021.2007.01.009
Wu, Z. D., Wu, Z., Liu, S., and Di, X. M. (1980) Introduction to deserts in China (Revised version). Beijing: Science Press.
Wu, Z. Y., Hou, A. P., Chang, C., Huang, X., Shi, D. Q., and Wang, Z. F. (2014). Environmental impacts of large-scale CSP plants in northwestern China. Environ. Science-Processes Impacts 16 (10), 2432–2441. doi:10.1039/c4em00235k
Xia, Z. L., Li, Y. J., Chen, R. S., Sengupta, D., Guo, X. N., Xiong, B., et al. (2022a). Mapping the rapid development of photovoltaic power stations in northwestern China using remote sensing. Energy Rep. 8, 4117–4127. doi:10.1016/j.egyr.2022.03.039
Xia, Z. L., Li, Y. J., Zhang, W., Chen, R. S., Guo, S. C., Zhang, P., et al. (2022b). Solar photovoltaic program helps turn deserts green in China: evidence from satellite monitoring. J. Environ. Manag. 324, 116338. doi:10.1016/j.jenvman.2022.116338
Xiao, J. H., Si, J. H., Liu, C., Li, X. J., Xi, H. Y., Yu, T. F., et al. (2021). Concept,connotation and development model of Desert Energy Ecosphere (in Chinese with English abstract). J. Desert Res. 05, 11–20. doi:10.7522/j.issn.1000-694X.2021.00038
Xiao, J. H., Yao, Z. Y., and Sun, J. H. (2011). Review on optimal site selection for grid-connected solar photovoltaic plants (in Chinese with English abstract). J. Desert Res. 06, 1598–1605.
Xie, G. D., Zhang, Y. L., Lu, C. X., Zheng, D., and Cheng, S. K. (2001). Study on valuation of rangeland ecosystem services of China (in Chinese with English abstract). J. Nat. Resour. 01, 47–53. doi:10.3321/j.issn:1000-3037.2001.01.009
Xinhua News Agency (2021). Large-scale wind and photovoltaic power projects in China's desert commence in an orderly manner. Available at: https://www.gov.cn/xinwen/2021-10/30/content_5647888.htm (Accessed May 31, 2023).
Yan, L. G., Xia, X. C., Zhou, F. Q., and Zhao, Z. X. (2007). A development study for Chinese large scale renewable energy source base and technology (in Chinese with English abstract). Adv. Technol. Electr. Eng. Energy 26 (1), 13. doi:10.3969/j.issn.1003-3076.2007.01.002
Yue, S. J., Guo, M. J., Zou, P. H., Wu, W., and Zhou, X. D. (2021). Effects of photovoltaic panels on soil temperature and moisture in desert areas. Environ. Sci. Pollut. Res. 28 (14), 17506–17518. doi:10.1007/s11356-020-11742-8
Zhao, Y., and Zhong, Y. J. (2022). Analysis of optimal design of photovoltaic power generation system (in Chinese with English abstract). Energy Conserv. 04, 16–18. doi:10.3969/j.issn.1004-7948.2022.04.005
Keywords: photovoltaic plants, desert ecosystem, ecological construction, ecosystem services value, economic benefits
Citation: Wang Y, Liu B, Xing Y, Peng H, Wu H and Zhong J (2024) Ecological construction status of photovoltaic power plants in China’s deserts. Front. Environ. Sci. 12:1406546. doi: 10.3389/fenvs.2024.1406546
Received: 25 March 2024; Accepted: 30 April 2024;
Published: 15 May 2024.
Edited by:
Zhiming Han, Northwest A&F University, ChinaReviewed by:
Baoli Fan, Northwest Normal University, ChinaPing Wang, Beijing Forestry University, China
Copyright © 2024 Wang, Liu, Xing, Peng, Wu and Zhong. This is an open-access article distributed under the terms of the Creative Commons Attribution License (CC BY). The use, distribution or reproduction in other forums is permitted, provided the original author(s) and the copyright owner(s) are credited and that the original publication in this journal is cited, in accordance with accepted academic practice. No use, distribution or reproduction is permitted which does not comply with these terms.
*Correspondence: Benli Liu, liubenli@lzb.ac.cn