The different vegetation types responses to potential evapotranspiration and precipitation in China
 Haojie Liu1,2
  GuangLei Zhu
 Yibo Ding
- 1Yellow River Engineering Consulting Co. Ltd., Zhengzhou, China
- 2Key Laboratory of Water Management and Water Security for Yellow River Basin, Ministry of Water Resources (Under Construction), Zhengzhou, China
- 3College of Water Resources and Architectural Engineering, Northwest A&F University, Yangling, China
Global climate change is considered one of the greatest environmental threats in the world. It is expected to significantly change the global hydrological cycle. The two main water cycle components, potential evapotranspiration (PET) and precipitation (P), are closely related to vegetation dynamics. In this study, the partial correlation analysis method was used to analyzed the relationship between Normalized Difference Vegetation Index (NDVI) and climate factors (PET and P) based on grid cells. PET was calculated by FAO-56 Penman–Monteith method. Moreover, we also investigated the NDVI and climate factors in different vegetation cover types. The results showed that grassland, forest and cropland in China were positively correlated with PET and P. The time scales of the maximum partial correlation coefficients between NDVI and PET of grassland vegetation were mostly longer than 5–6 months. These time scales were longer than the time scales related to P. The partial correlation coefficients between NDVI and PET, P of forest vegetation were higher in northern China, whereas the spatial distribution of related time scales was the opposite. The partial correlation coefficients between NDVI and PET, P of forest vegetation were higher in northern China. However, the spatial distribution of related time scales was the opposite. The correlations between NDVI and PET, P of cropland vegetation and the time scales related to PET had clear spatial heterogeneity. The time scale of the correlation between NDVI and P for cropland in the northern China was about 2 months. P had a strong influence on the growth of various types of vegetation in the study area, and grassland vegetation was affected by P over the shortest time scale. We compare and analyze the results of this study with other related studies. These results provide a reference for exploring the dynamic changes in different vegetation types and factors impacting them.
1 Introduction
The global climate change occasioned by the greenhouse and has become a common challenge facing humanity today (Shi et al., 2020; Zhang et al., 2024). As an important component of the terrestrial ecosystem, vegetation plays a key role in reflecting and regulating the climate (Baldocchi et al., 2001). Vegetation influences the energy balance, carbon balance, hydrological cycle, greenhouse gas fixation, and climate stabilization (Zhang et al., 2013). A number of studies have shown that vegetation dynamics in recent decades have been closely related to climate change (Jiapaer et al., 2015; Ren et al., 2020). In recent decades, rapid urbanization (Tan et al., 2016), forest degradation and desertification (Sun et al., 2015; Hassan et al., 2018) have led to significant changes in the types of vegetation systems in China. These changes have in turn influenced China’s terrestrial ecology system. The ecology system is seriously out of balance (Ding et al., 2020). It is essential for us to pay closer attention to changes in the ecosystem in China. Climate change has an unprecedented impact on the environments on which humans depend, and the structure and function of ecosystems have undergone rapid changes (Wang et al., 2019). Therefore, it is necessary to conduct an analysis of the influencing factors of climate change on Chinese vegetation dynamics.
Climate change is the main factor affecting the hydrological cycle (Dai, 2011). Global warming has exacerbated and expedited the hydrological cycle, resulting in precipitation patterns shifting towards higher variability, marked by more frequent wet and dry years. (Trenberth, 2011). Precipitation is one of the main factors limiting vegetation growth (Rundquist and Harrington Jr, 2000; Tateishi and Ebata, 2004). Precipitation (P) affects the availability of soil water, which in turn affects vegetation growth (Dermody et al., 2007). Evapotranspiration, as a primary component of the hydrological cycle, will affect vegetation water demand and the planning and management of future water resources (Goyal, 2004).
Potential evapotranspiration (PET) is commonly used in hydrology to estimate actual evapotranspiration. PET is a crucial parameter for calculating drought severity indices, and its application has been widespread for many years (Zhou et al., 2018). PET is a function of climate, crops, and agricultural management (Abbasian et al., 2021). Long-term changes have been used to diagnose the influence of climate change on ecosystems based on climate model projections (Milly and Dunne, 2016). In recent years, evaporation measuring equipment and potential evaporation in different regions of China have decreased significantly (Xu et al., 2006; Shen et al., 2010). Therefore, it is necessary to study the effects of PET and P on different vegetation types in different climate zones under the background of climate change.
Remote sensing is a common method for studying vegetation temporal and spatial distributions and classification (Birtwistle et al., 2016). In recent decades, the relationship between normalized vegetation index (NDVI) and vegetation cover has been well verified (Pettorelli et al., 2005), and NDVI has become an effective indicator for quantifying vegetation cover. The correlation between NDVI and climate factors provides a practical method for exploring ecosystem response to climate change (Potter and Brooks, 1998). Many studies have used NDVI for extensive drought and vegetation dynamics assessments. Ji and Peters (2003) studied the response of vegetation in the American Great Plains to drought conditions. Ding et al. (2020) analyzed the correlations between drought and vegetation dynamic changes in China. Zheng et al. (2018) explored the impacts of different climatic conditions on vegetation changes. Mo et al. (2019) studied the spatiotemporal changes in vegetation coverage and precipitation in the mountain-oasis river basin in the arid area of Northwest China. At the same time, NDVI was used to study the response of vegetation dynamics in the upper Shiyang River to temperature and precipitation (Tang et al., 2017). NDVI is the most commonly used vegetation index globally for monitoring vegetation conditions. Therefore, it can also assess the impacts of P and PET on various vegetation types.
Many researchers have used the standardized precipitation-evapotranspiration index (SPEI, the ratio of P to PET) to study the NDVI response of different vegetation types to drought (Zhang and Zhang, 2019; Li et al., 2020; Shi et al., 2021) and the time scale of the response (Vicente-Serrano et al., 2013; Zhang et al., 2017; Jiang et al., 2020). Although SPEI considers the effects of precipitation and evapotranspiration, there are significant differences between precipitation (Tian et al., 2018) and evapotranspiration (Müller Schmied et al., 2014) during the hydrological cycle. Therefore, it is indispensable to study the response of different vegetation types to PET and P. The main purpose of this research was to: (1) study the impacts of PET and P on different vegetation types, and (2) study the time scale of the response of different vegetation types to PET and P. This research contributed to assess ecosystem health, climate change impacts, and water resource management.
2 Materials and methods
2.1 Study area
China is located in the eastern part of the Eurasian continent, spanning 3°51′N–53°34′N in latitude and 73°29′E–135°04′E in longitude, with a total land area of about 9.6 million square kilometers (Figure 1A). From east to west, elevations rise from the plain in the east to the plateau in the west, showing a three-step distribution (Wang et al., 2017). China contains a wide variety of terrain types, including mountains, plains, basins and plateaus (Figure 1B); there is also a variety of climate types from tropical to frigid zones. Due to China’s clear geographical and regional differences and the influence of climate types, there are significant monthly, annual and interannual changes in temperature and precipitation. In general, there is more precipitation in the east and less in the west; temperatures are high in the south and low in the north, respectively. China’s rich climate diversity also leads to diversified vegetation communities and land use types. The main land use types include cropland vegetation, forest vegetation, grassland vegetation, desert and water bodies (Figure 1A). Cropland vegetation is primarily found in the northeast and central regions, while forest vegetation is predominantly located in the northeast and southeast regions. Grasslands are mainly distributed across the Inner Mongolia Plateau and Qinghai-Tibet Plateau, while deserts are primarily situated in the northwest. The vegetation types in this study were mainly grassland, forest and cropland. The land in northeastern China is mainly dominated by black soil, while the mountainous and plain areas in tropical and subtropical China are mainly characterized by yellow soil. In areas with high temperatures and abundant rainfall in China, the land is primarily red soil.
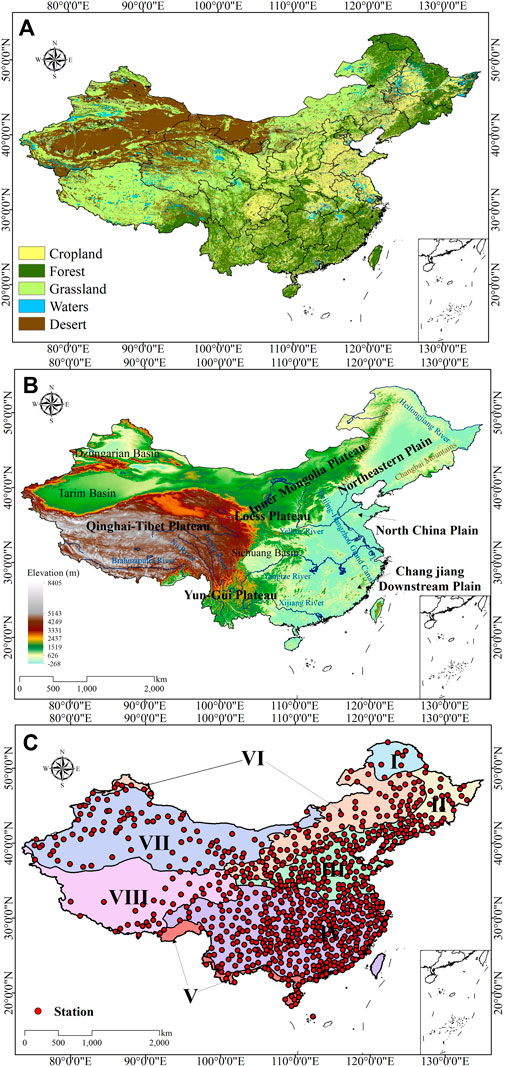
Figure 1. The spatial distribution of different vegetation coverage types (A); the spatial distribution of the main topographical areas in the study area (B); the division of the eight climate zones and the spatial distribution of weather stations (C). Climate zone boundaries are indicated by dark solid lines.
To explore the response of different vegetation system types to PET and P, this study referred to the research method of Ding et al. (2021) and roughly divided the study area into eight climate zones (Figure 1C): (I) Cold temperate coniferous forest, temperate monsoon climate; (II) Temperate coniferous forest and deciduous broad-leaved mixed forest, temperate monsoon climate; (III) Warm temperate deciduous broad-leaved forest, temperate monsoon climate; (IV) Subtropical evergreen broad-leaved forest, subtropical monsoon climate; (V) Tropical monsoon forest and tropical rain forest, tropical monsoon climate; (VI) Temperate grassland, temperate monsoon climate and temperate continental climate; (VII) Temperate desert, temperate continental climate; and (VIII) Vegetation in the cold areas of the Qinghai-Tibet Plateau, alpine plateau climate. Climate zone I is located in the northern part of the Greater Khingan Mountains, climate zone II includes the Northeast Plain and Changbai Mountain, climate zone III includes the North China Plain and the Loess Plateau, and the geographical types of climate zone IV are the lower reaches of the Yangtze River Plain, the Yunnan-Guizhou Plateau, the Sichuan Basin and the southeast hilly area. Climate zone VI includes the Inner Mongolia Plateau, climate zone VII includes the Junggar Basin and Tarim Basin, and climate zone VIII is almost entirely located on the Qinghai-Tibet Plateau (Figures 1B, C). Average annual potential evapotranspiration and annual average cumulative precipitation for each climate zones, as shown in Table 1 (Hao et al., 2019).
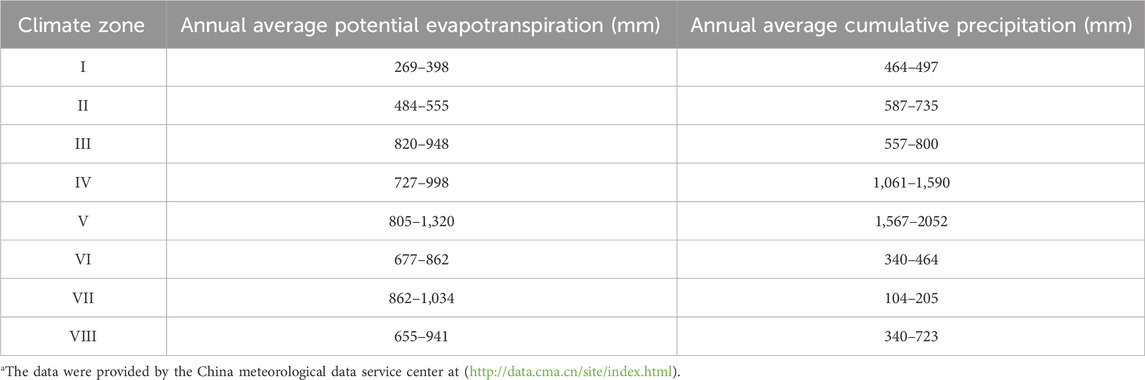
Table 1. Annual average potential evapotranspiration and annual average cumulative precipitation in the eight climate zones (1982-2015).
2.2 Data sources
This study used NDVI as an indicator to characterize the dynamic changes of vegetation system types. The selected NDVI data set is the third-generation NDVI (NDVI 3 g) data developed from the Advanced Ultra High Resolution Radiation Sensor (AVHRR) by the Global Inventory Modeling and Mapping Research (GIMMS) group (http://ecocast.arc.nasa.gov/). Beck et al. (2011) and Tian et al. (2015) found that this was the best comprehensive NDVI product for monitoring long-term land vegetation dynamics. The spatial resolution of the data set is about 8km, and the temporal resolution is 1 month. The time series selected in this study was the latest data version from 1982 to 2015. Cihlar et al. (2004) and Zeng et al. (2013) corrected NDVI for orbital drift, viewing geometry, snow cover, volcanic aerosols, ozone cover, atmospheric water vapor, cloud cover, and other errors not related to vegetation change. Pinzon and Tucker (2014) calibrated parameters for AVHRR. We adopted the Maximum Value Composite (MVC) technique (Holben, 1986) to aggregate the time steps of the original NDVI sequence into a monthly scale to further reduce the impacts of clouds and airborne particles.
The monthly-scale meteorological data (1982–2015) used in this study came from 699 meteorological sites (Figure 1C) (http://data.cma.cn/site/index.html) and were downloaded from the China Meteorological Data Sharing Website. These include maximum temperature, minimum temperature, precipitation, wind speed, relative humidity and solar radiation. We eliminated outliers and impute missing records to ensure the quality of the data. A Digital Elevation Model (DEM) dataset with a spatial resolution of 1 km was downloaded from the NASA Space Shuttle Radar Topographic Mission (SRTM) website (http://www.glcf.umd.edu/). We supported spatial climate interpolation by providing terrain information. The thin-plate smoothing spline method (Hancock and Hutchinson, 2006) was used to evaluate the influence of elevation and atmospheric level on spatial climate interpolation, so all meteorological data were processed into a monthly scale grid cells layer with a spatial resolution of 8 km.
The vegetation ecosystem type data with a spatial resolution of 1 km were developed by the China Resource and Environment Data Cloud Platform (http://www.resdc.cn/Default.aspx) (Wei et al., 2018) (Figure 1A). Grid cells contain vegetation ecosystem type attributes in the area. We used most of the functions in the Resample Tool of ArcGIS 10.2 (ESRI, Redlands, California, USA) to resample it to match the spatial resolution of 8 km (Xu et al., 2018). This study considered three vegetation types: cropland, forest, and grassland.
2.3 Data analysis
2.3.1 Calculating potential evapotranspiration
PET is not only a key factor for estimating ecological water demand and agricultural irrigation, but also controls the vegetation coverage system (Hao et al., 2019). The revised Penman–Monteith equation introduced by the World Food and Agriculture Organization (FAO) in 1998 is one of the most commonly used methods for estimating PET (Allen et al., 1998). Yang et al. (2021) evaluated 18 models for calculating potential evapotranspiration in different climatic zones of China, and found that the Penman–Monteith equation is the optimal choice in all climatic zones. In this study, the FAO-56 Penman–Monteith method was selected to estimate PET, and the formula is as follows:
where
2.3.2 Correlation analysis
Geographical systems are complex and multi-factor, where one kind of change will inevitably affect another kind of change. Partial correlation analysis is the most widely used correlation analysis method (Liu et al., 2014). When two variables are simultaneously related to a third variable, the influence of the third variable is not considered, and only the correlation of the other two variables is estimated. The formula is as follows:
where
where
In this study, for each grid point, partial correlation coefficients of different scales were calculated. Statistically significant maximum partial correlation coefficients were recorded, along with the maximum partial correlation coefficient time scale of NDVI-PET and NDVI-P (months). The maximum partial correlation coefficient shows the strongest response of vegetation to PET and precipitation, indicating the sensitivity of each grid point to PET and precipitation at different time scales. Zhang et al. (2013) and Zhou et al. (2018) employed the maximum partial correlation coefficients method to analyze the relationship of different variables in each grid cells in the map.
3 Results
3.1 Vegetation change trends in different climate zones
The NDVI tendency rate represents the vegetation trends and change rate in each climate zone. A positive value reflects an increase in NDVI and a negative value reflects the opposite. In this study, the variation of average NDVI in eight climate regions showed a small fluctuation, and all showed a decreasing trend (Figure 2). The overall average change trend of each climate zone showed that climate zone IV had the lowest absolute value, with a median value of −0.003. Both climate zones I and II were in Northeast China and had mainly forest vegetation. From 1982 to 2015, rapid expansion of arable land and urbanization led to a reduction in forest area, resulting in a significant deterioration in the region’s vegetation status. This was evidenced by a notable decrease in NDVI and median NDVI tendency rates. The median and tendency rates of NDVI was 0.059 and −0.116, respectively. Although the main land cover type of climate zone VII was desert, NDVI continuously decreased with a median change tendency rate of −0.012. Climatic zone VIII was located in the Qinghai-Tibet Plateau and was mainly composed of grassland vegetation in the cold plateau. There was little NDVI change and the median change tendency rate was only −0.007. Vegetation in other climatic regions (III, V, VI) also decreased to varying degrees, with median NDVI tendency rates of −0.034, −0.026 and −0.024, respectively (Figure 2B). There were significant regional differences in NDVI change trends in climate zones I, II, IV and V, and the regional differences in NDVI change trends in climate zone VII were the lowest among all climate zones.
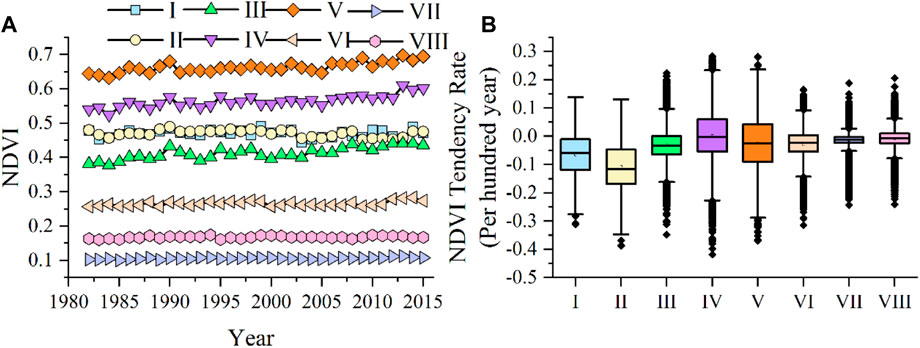
Figure 2. Interannual dynamic change of average NDVI in each climate zone from 1982 to 2015 (A); box plot of monthly average NDVI tendency rate in each climate zone from 1982 to 2015 (B).
3.2 The effects of PET and P on NDVI of grassland vegetation
The grassland vegetation in the study area was mainly distributed in climate zones VI and VIII and the Dzungarian Basin located in climate zone VII. Grassland vegetation coverage in other climate zones was relatively low (Figures 1A, B). Almost all grassland vegetation NDVI and PET values in the study area were positive correlation (Figure 3A). Correlations between NDVI and PET in the northern Inner Mongolia Plateau, the eastern Qinghai-Tibet Plateau and the Dzungarian Basin in climate zone VII were very high, and the maximum partial correlation coefficients ranged from 0.597-0.968. At the same time, the partial correlation coefficients between NDVI and PET of sparse grassland vegetation in climate zone I are greater than 0.734. The correlations between NDVI and PET of grassland vegetation in the southern Inner Mongolia Plateau in climate zone VI were lower than in the northern area. However, partial correlation coefficient in the western the Qinghai-Tibet Plateau were lower than eastern. Moreover, the range of correlation coefficients was 0.394–0.597. The Tarim Basin in climate zone VII was mostly desert. Correlations between NDVI and PET in the western and southern margins were low, with coefficients from 0.394–0.597. We found that the grassland and climate factors (P and PET) had positive relationship. Similarly, NDVI and p values in almost all climate zones were positively correlated (Figure 3B). Correlations between NDVI and P in the northern part of the Inner Mongolia Plateau and the eastern part of the Qinghai-Tibet Plateau were the highest, ranging between 0.670 and 0.897 in most regions. However, correlations in the western part of the Qinghai-Tibet Plateau were significantly lower than in the east, with negative correlations in some areas and coefficients ranging from–0.240–0.162. At the same time, correlations in the southern Inner Mongolia Plateau were lower than that in the northern Inner Mongolia Plateau and the eastern Qinghai-Tibet Plateau, where the maximum coefficient was 0.670. Correlations between NDVI and P in the Loess Plateau were significantly less than those for PET (Figures 2A, B). NDVI and P correlations for sparsely distributed grassland vegetation in climate zone I were less than those for PET, all less than 0.670. Correlations in the central part of the Dzungarian Basin were greater than those for PET, ranging from 0.349–0.523. Correlations in other regions of the Dzungarian Basin were less than 0.349. Correlations in the Tarim Basin were less than 0.349, and the NDVI and P of grassland vegetation in some areas were negatively correlated.
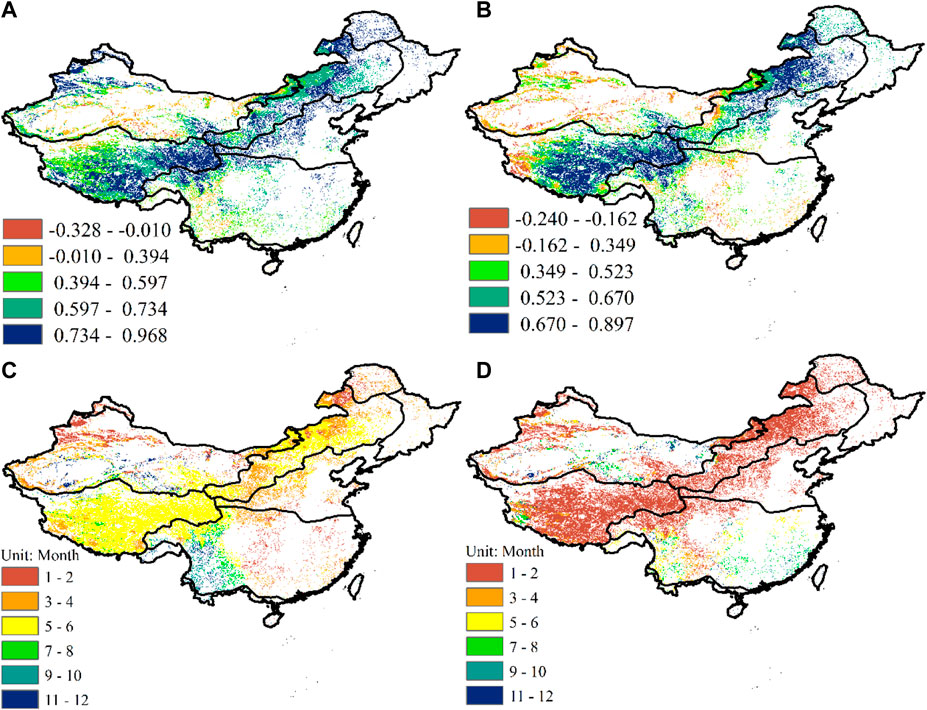
Figure 3. Spatial distribution of maximum partial correlation coefficients between NDVI and PET of grassland vegetation (A); spatial distribution of maximum partial correlation coefficients between NDVI and P of grassland vegetation (B); time scale of the maximum partial correlation coefficients of grassland vegetation NDVI and PET (C); the time scale of the largest partial correlation coefficients between NDVI and P of grassland vegetation (D).
The temporal and spatial variability of NDVI for grassland vegetation in the study area to PET and P were relatively large (Figures 3C, D). The time scale in the Inner Mongolia Plateau and the eastern Qinghai-Tibet Plateau affected by PET was significantly longer than the time scale of the response to P. The response time scales were 5–6 months and 1–2 months, respectively. The response time scale of NDVI in the southwestern corner of the Qinghai-Tibet Plateau to PET was shorter than that of the eastern region, around 3–4 months; however, the time scale of the response of grassland vegetation NDVI to P in the southwestern corner of the Qinghai-Tibet Plateau was longer than in the eastern region, around 7–8 months. The time scale of the response of grassland vegetation NDVI to PET in the Loess Plateau was also longer than the time scale of its response to P. Response time scales were 3–4 months and 1–2 months, respectively. The time scales for NDVI response in the Dzungarian Basin to PET and P were almost the same, around 1–2 months. The response time scale of NDVI of grassland vegetation to PET in most areas of the Tarim Basin was longer than the time scale of its response to P. The time scale of the NDVI response to PET for sparse grassland vegetation in climate zone I was longer than the time scale of its response to P. The NDVI of grassland vegetation on the Yunnan-Guizhou Plateau in climate zone IV responded to PET with a longer time scale, all of which were longer than 7 months, and more than 11 months in parts of the western region. However, the time scale of the NDVI response in the Yunnan-Guizhou Plateau to P was significantly shorter than the time scale of the response to PET, and the response time scale of the eastern region was around 1–2 months.
The effects of PET and P on NDVI for grassland vegetation in different climate zones in the study area was very different (Figure 4). The median partial correlation coefficients of NDVI and PET in climate zones VI and VIII where grassland vegetation was concentrated were 0.734 and 0.727, respectively. However, correlations between NDVI and P in climate zones VI and VIII were less than those for PET, and median partial correlation coefficients were 0.690 and 0.671, respectively. The distribution of grassland vegetation in climate zones I, II and III was very sparse. However, the correlations between NDVI and climate factors in different climate zones were relatively high, and the median partial correlation coefficients with PET were 0.860, 0.845 and 0.793 respectively. However, the partial correlation coefficients between NDVI and P for grassland vegetation in zones I, II and III were smaller, and median values were 0.634, 0.598 and 0.600, respectively. The spatial variability of NDVI in climate zones IV and VII to PET and P was significantly greater than in other climate zones (Figures 3A, B). The median partial correlation coefficients of NDVI and PET for grassland vegetation in climate zones IV and VII were 0.635 and 0.601, respectively. The grassland NDVI had higher correlation with P than PET, with median values of 0.463 and 0.323, respectively. Grassland vegetation in climate zone V had the lowest correlations between NDVI and PET, with a median value of 0.462, whereas correlations between grassland vegetation NDVI and P in this climate zone were the highest, with a median value of 0.690. The time scale of the response of grassland vegetation NDVI to PET and P in each climate zone was also very characteristic (Figures 4C, D). The response time scale of NDVI for grassland vegetation in climate zone VI to PET was slightly shorter than in climate zone VIII, and the median response time scales were 4 months and 5 months, respectively. Climate zones VI and VIII had the same time scale in response to P, with a median value of 2 months, and the time scale and spatial variability of the two climate zones were very small. The median time scales of grassland vegetation NDVI response to PET in climate zones I, II, and III were 3, 3, and 4 months, respectively, which were longer than the time scales of these climate zones to P response, and the median values were 1, 1 and 2 months. The time scales of the response of grassland vegetation NDVI to PET and P in climate zones IV and VII were clearly different (Figures 3A, B). The median time scales of grassland vegetation NDVI response to PET in climate zones IV and VII were 5 and 4 months, respectively, which were longer than the time scales of response to P, and median values were both 2 months. The response time scales of NDVI of grassland vegetation in climate zone V to PET and P were the longest, with median values 10 and 6 months, respectively.
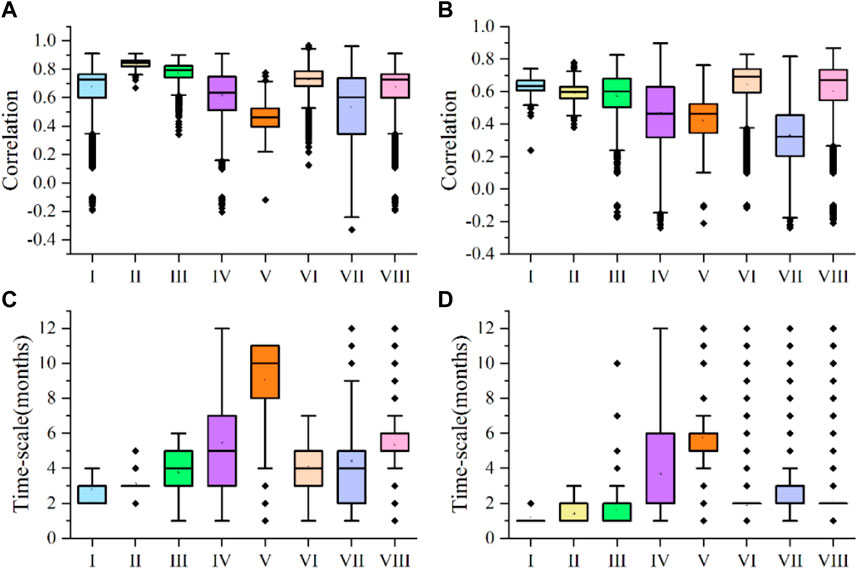
Figure 4. Partial correlation coefficients of NDVI and PET for grassland vegetation in different climate zones (A); Partial correlation coefficients of NDVI and P for grassland vegetation in different climate zones (B); Time scale of response of grassland vegetation NDVI to PET in different climate zones (C); the time scale of the response of grassland vegetation NDVI to P in different climate zones (D). Box chart elements: the box contains 25%–75% of the values; the horizontal line is the median line value, the error bars represent ±1 standard deviation (SD), and the thick black points are the outliers.
3.3 The effects of PET and P on NDVI of forest vegetation
The forest vegetation in the study area was mainly distributed in the Greater Xing’an Mountains, the Changbai Mountains, the Yun-Gui Plateau, the Changjiang Downstream Plain, and climate zone V. The forest vegetation in other areas was less distributed (Figures 1A, B). NDVI for forest vegetation in the entire study area was positively correlated with PET and P (Figures 5A, B). NDVI and PET of forest vegetation in the northern Greater Xing’an Mountains and Changbai Mountains were significantly positively correlated, with coefficients of 0.768–0.961. However, the correlations between NDVI and P in the northern Greater Xing’an Mountains and Changbai Mountains were significantly lower than correlations with PET, with coefficients from 0.517–0.638 and 0.389–0.638, respectively. The coefficients between NDVI and PET in the Loess Plateau were 0.768–0.961, significantly greater than those between NDVI and P (less than 0.517). Correlations between NDVI and PET in the entire Yun-Gui Plateau were significantly less than those with P. The coefficients between NDVI and PET in most regions were only 0.097-0.362. The response of NDVI in the Sichuan Basin to PET was stronger than its response to P. Coefficients between NDVI and P of forest vegetation in the Yun-Gui Plateau and western Sichuan Basin were only 0.097–0.251, which were significantly less than those with PET (0.362–0.639). However, the partial correlation coefficients between NDVI and PET in most areas of the Changjiang Downstream Plain were greater than 0.639, and greater than those for NDVI and P in this area (lower than 0.638). The response of forest vegetation NDVI to PET in southeast climate zone IV was significantly stronger than its response to P. Coefficients for NDVI and PET in this area were 0.511–0.639, whereas those for NDVI and P in this area were less than 0.389. Correlations between NDVI and PET and P in the Brahmaputra River Valley of climate zone V were almost the same, ranging from 0.362–0.639 and 0.389–0.638, respectively.
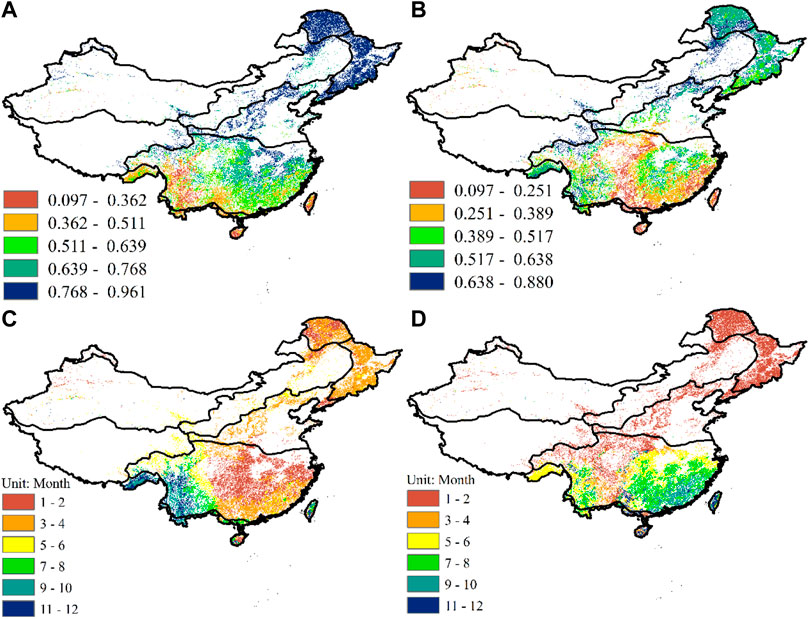
Figure 5. Spatial distribution of the maximum partial correlation coefficients of forest vegetation NDVI and PET (A); spatial distribution of the maximum partial correlation coefficients of forest vegetation NDVI and P (B); the time scale of the maximum partial correlation coefficients of forest vegetation NDVI and PET Scale (C); the time scale of the maximum partial correlation coefficients between NDVI and P of forest vegetation (D).
The time scale of the response of forest vegetation NDVI to PET and P in the study area also had large spatial variability (Figures 5C, D). The response time scale of NDVI to PET in the northern Greater Xing’an Mountains and Changbai Mountains was relatively short, around 3–4 months; the time scale of NDVI response to P in this area was only 1–2 months. The response time scale of the Loess Plateau to P was 1–2 months, which was less than the time scale of NDVI response to PET in this area (3–4 months). The time scale of the response of NDVI to PET in the Yun-Gui Plateau varied. The time scales NDVI response to PET in the central, western and eastern regions of the Yun-Gui Plateau were 11–12, 9–10 and 7–8 months, respectively. At the same time, the time scales of NDVI response to P in the central, western and eastern regions of the Yun-Gui Plateau were 5–6, 7–8, and 3–4 months, respectively. The time scale of NDVI response in the Sichuan Basin to P was around 1–2 months, while the time scale of the response to PET in this area ranged from 1 to 2 to 5–6 months. The time scale of NDVI response to PET in the Changjiang Downstream Plain was only 1–2 months, significantly shorter than the time scale of NDVI response to P in this area (5–8 months). The time scale associated with NDVI and P in the southeast of climate zone IV was greater than 7 months, significantly longer than the time scale associated with PET (3–4 months). The response time scale of NDVI to PET in the Brahmaputra River Valley in climate zone V was 9–12 months, while the time scale of NDVI to P in this area was only 5–6 months.
Correlations between NDVI of forest vegetation and climate factors were analyzed in different climatic regions (Figures 6A, B). NDVI values in climatic areas with dense forest vegetation distribution were very sensitive to PET, and the median partial correlation coefficients were 0.863 and 0.839, respectively; The partial correlation coefficients were significantly higher than those observed between NDVI and PET in climatic areas with the same dense forest vegetation (median values of 0.591 and 0.463, respectively). However, partial correlation coefficients between NDVI and P in climate zones I and II were 0.612 and 0.554, significantly less than coefficients with PET. Correlations between NDVI and P in climate zones IV and V were even lower, with coefficients of only 0.368 and 0.468. PET had strong impacts on forest vegetation NDVI in climate zones III and VI where forest was less distributed. The median partial correlation coefficients for NDVI and PET in the two regions were 0.817 and 0.813, respectively. Compared with the impact of PET on forest vegetation in climate zones III and VI, the influence of P is slightly lower. Coefficients for NDVI and P in climate zones III and VI were 0.569 and 0.676, respectively. Although the forest vegetation in climate zones VII and VIII was very scarce, correlations between NDVI and PET were high and median values were 0.751 and 0.786, respectively. The median value of the partial correlation coefficient between NDVI and P of forest vegetation in climate zone VIII is 0.714, significantly higher than that of NDVI and P (median value 0.400). The time scales of forest vegetation NDVI response to PET and P in the study area were mostly short-term and medium-term (Figures 6C, D). The median time scale of NDVI response to PET in climate zones I and II was 3 months, which was longer than the time scales of response to P (median values were 1 and 2 months, respectively). The time scale of NDVI response to PET in climate zone IV was very different from the time scale of NDVI response to PET in climate zone V, with median values of 3 and 10 months, respectively. However, the time scales of NDVI response to P in climate zones IV and V were the same, with a median value of 6 months. The median time scales of NDVI response to PET in climate zones III and VI were both 3 months, which were slightly longer than the time scales of NDVI response to P (median value was 2 months). The time scales of NDVI response to P in climate zones VII and VIII were relatively short (the median value was 2 months), whereas the time scales for PET response were mid-term with median time scales of 4 and 5 months, respectively.
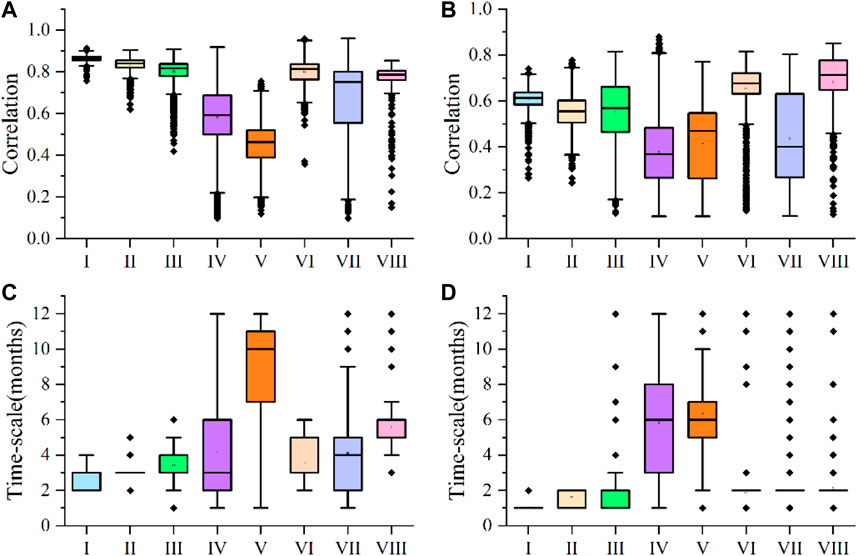
Figure 6. Partial correlation coefficients of NDVI and PET of forest vegetation in different climatic regions (A); Partial correlation coefficients of NDVI and P of forest vegetation in different climatic regions (B); Time scale of response of forest vegetation NDVI to PET in different climatic regions (C); the time scale of forest vegetation NDVI response to P in different climate zones (D). Box plot elements: the box contains 25%–75% of values; the horizontal line is the median line value, the error bars represent ±1 standard deviation (SD), and the thick black points are the outliers.
3.4 The effects of PET and P on NDVI of cropland vegetation
The cropland vegetation in the study area was mainly distributed in the Northeast Plain, North China Plain, Loess Plateau, Sichuan Basin, Changjiang Downstream Plain and Yun-Gui Plateau (Figures 1A, B). Of the cropland in the study area, only a small portion of the NDVI results were negatively correlated with PET and P (Figures 7A, B). The areas with negative correlations between NDVI and PET were mainly distributed in the Yun-Gui Plateau and parts of the southern North China Plain. Negative correlations between NDVI and P were less common and included the Sichuan Basin and a small part of the southern North China Plain area. The response of NDVI in the Northeast Plain to PET was similar to its response to P, with partial correlation coefficients of 0.662–0.766 and 0.628–0.885, respectively. There were clear spatial differences in correlations between NDVI and PET and P of cropland vegetation in North China Plain. The spatial distribution of correlations between NDVI and PET and P in the northern and southern parts was small. The partial correlation coefficients between NDVI and P in the Loess Plateau were mostly 0.454–0.628, whereas those between NDVI and PET were 0.549–0.766. The response of NDVI in the Sichuan Basin to P was slightly weaker than its response to PET. Correlations between NDVI and PET in the central area of the Changjiang Downstream Plain were higher than those with P, with coefficients from 0.766–0.965 and 0.454–0.628, respectively.
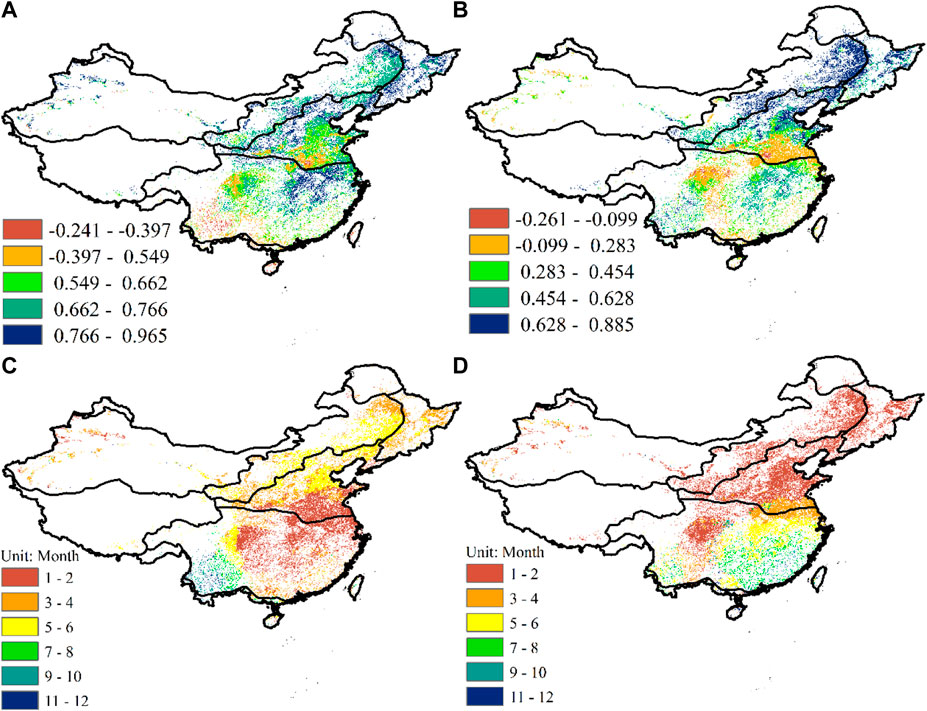
Figure 7. Spatial distribution of the maximum partial correlation coefficients between NDVI and PET in cropland vegetation (A); spatial distribution of the maximum partial correlation coefficients between NDVI and P in cropland vegetation (B); time scale of the maximum partial correlation coefficients between NDVI and PET in cropland vegetation (C); time scale of the largest partial correlation coefficients between NDVI and P of cropland vegetation (D).
In general, the time scale of the response of cropland vegetation NDVI to P in the northern part of the study area was significantly shorter than that in the south, whereas the time scale and spatial distribution of the response of NDVI to PET were different (Figures 7C, D). The response time scale of NDVI to P in the Northeast Plain and Loess Plateau was very short (1–2 months), but the time scale of response of NDVI to PET in these two regions was longer than 3 months. The time scale of the NDVI response to PET in the northern part of the North China Plain was 5–6 months, and the time scale of the response of NDVI to PET in the southern part of the region was shorter (1–2 months). The time scale of the NDVI response to P in the northern part of the North China Plain was shorter than in the southern part. The response time scale of the Sichuan Basin to PET and P was 1–2 months, and only some of the NDVI response time scale to PET was around 5–6 months. The response time scale of NDVI in the Changjiang Downstream Plain to P was greater than 5 months, longer than the time scale of response of NDVI to PET in this area (less than 4 months). The response time scale of NDVI on the Yun-Gui Plateau to PET was longer than the response to P.
The correlations between NDVI of cropland vegetation and PET were higher than P in different climatic regions (Figures 8A, B). Although cropland vegetation in climate zones I and VIII was sparsely distributed, the NDVI values in these two climate zones had strong correlations with PET, with median values of 0.852 and 0.750, respectively. In contrast, the median partial correlation coefficients for NDVI and P in climate zones I and VIII were 0.679 and 0.722, respectively. The partial correlation coefficients of NDVI and P in climate zones II and VI were similar, whereas median partial correlation coefficients of the two climate zones and PET are 0.805 and 0.742 respectively. The same was true for correlations between NDVI and P in climate zones II and VI, with median values of 0.665 and 0.723, respectively. The median value of the partial correlation coefficient between NDVI and PET in the climate zone with the most densely distributed cropland vegetation was 0.689, which was significantly higher than the coefficient for NDVI and P (the median value is 0.469) in this area. The response of NDVI to PET in climate zone IV was stronger than its response to P. The median values of partial correlation coefficients for NDVI, PET and P in this area were 0.651 and 0.367, respectively. Of all the climate zones, correlations between NDVI, PET and P in climate zone V were the lowest, with median values of 0.467 and 0.308, respectively. P in climate zone VII had little effect on NDVI in this area, with a median correlation of only 0.330. However, the partial correlation coefficients between NDVI and PET were relatively large (median value is 0.779). The median time scale of the response of NDVI to PET and P in different climate zones was less than 6 months (Figures 8C, D). The median time scales of the response of NDVI to PET in climate zones I and VIII were 3 and 5 months, respectively, and the spatial heterogeneity was the lowest. Climate zone IV had the shortest response time scale to PET (median 2 months), whereas climate zone V had the longest (median 6 months). The median time scales of response to PET in climate zones II, III, and VI with densely distributed cropland vegetation were 4, 3, and 5 months, respectively. The median time scale of response to PET in climate zone VII was 3 months. Except for the two climatic regions (IV and V) with the largest spatial heterogeneity in NDVI to P response time scale, the median time scale of the response to P in all other climatic regions was 2 months. The median time scales for climate zones IV and V were 5 and 6 months, respectively.
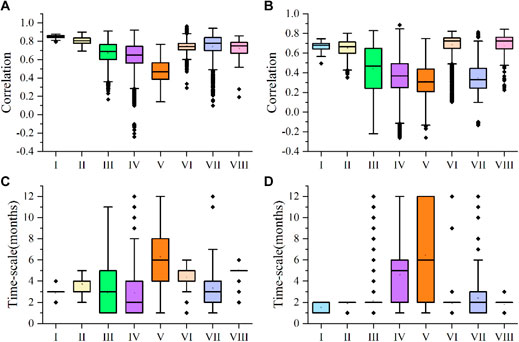
Figure 8. Partial correlation coefficients of NDVI and PET of cropland vegetation in different climatic regions (A); Partial correlation coefficients of NDVI and P of cropland vegetation in different climatic regions (B); Time scale of the response of NDVI of cropland vegetation in different climatic regions to PET (C); the time scale of the response of cropland vegetation NDVI to P in different climate zones (D). Box plot elements: the box contains 25%–75% of values; the horizontal line is the median line value, the error bars represent ±1 standard deviation (SD), and the thick black points are the outliers.
4 Discussion
4.1 Spatio-temporal NDVI response of different vegetation types and climate zones to PET
The grassland vegetation in the study area was mainly distributed in the temperate grassland area (VI), the cold vegetation area of the Qinghai-Tibet Plateau (VIII) and the Dzungarian Basin located in the temperate desert area (VII) (Figures 1A, B). There were positive correlations between NDVI and PET for grassland vegetation in almost all climate zones (Figure 3A). Higher cover level of grassland in Climate zone VI had higher partial correlation coefficient with PET than P (Table 1). The reduction of aerodynamic terms was significant (Han et al., 2012) and strongly impacted the change in PET (Wang et al., 2019), which was reduced due to the decrease of wind speed (Zhao and Ma, 2021). The reduction of PET was conducive to moisture and the growth of grassland. Dai (2013) indicated that, in the context of global warming, the semi-arid or arid area of the Qinghai-Tibet Plateau would be more severe droughts than the semi-humid or humid area. This was also the reason why the correlations between NDVI and PET for grassland vegetation in the western part of climate zone VIII and its time scale were lower than those in the eastern part (Figure 3A). The time scale of the NDVI response of grassland vegetation to PET in the Dzungarian Basin in climate zone VII was short-term, whereas the same responses in climate zones VI and VIII were medium-term (Figure 3C). Snow melt in the Dzungarian Basin may have offset the impact of high potential evaporation on vegetation in areas that have experienced climate changes (Duan et al., 2016). Forest vegetation in the study area was mainly distributed in the temperate monsoon climate zone (climate zone I and II), subtropical monsoon climate zone (climate zone IV) and tropical monsoon climate zone (V) (Figures 1A, B). Precipitation in climate zones IV and V was much higher than PET (Table 1), so the NDVI response of forest vegetation in the two climate zones to PET was lower than the same response in climate zones I and II, which was similar to Xu et al. (2018)’s findings. The Atlantic Ocean multi-decadal oscillation influences the Northern Hemisphere’s drought by regulating the ocean-atmosphere-land surface interaction processes and other large-scale circulations (Zhu et al., 2021). In climate zone I over the study time interval, the northern part of the Greater Xing’an Mountains was in the cold period of the multi-decadal oscillation, so drought in this area was effectively alleviated (Zhu et al., 2021). The growth of cropland vegetation in the northern part of climate zones VI, II and III mostly depended on irrigation (Yin et al., 2020), while large-scale irrigation and human activities have significantly changed PET (Han et al., 2009). The response time scale of NDVI for cropland vegetation to PET was longer than in other parts of the study area (Figure 7C).
4.2 Spatio-temporal NDVI response of different vegetation types and climate zones to P
P is a key factor leading to changes in NDVI, and the response of NDVI to P varies with vegetation type (Wang et al., 2001). There was a positive correlation between NDVI and P of grassland vegetation in almost all climatic regions (Figure 3B), which was consistent with the response relationship obtained by Nanzad et al. (2019). The Dzungarian Basin in climate zone VII was surrounded by mountains (Figure 1B), and this area had an arid and rainless temperate continental climate (Table 1). The grassland vegetation in this region was mostly fed by ice and snow melt water. Therefore, P had a relatively low impact on the NDVI of grassland vegetation in this area (Duan et al., 2016). Climate zone VI was at the junction of temperate continental and temperate monsoon climates (Wang et al., 2019), and the NDVI of grassland vegetation near the temperate monsoon climate with more precipitation showed a strong response to P. Climate zone VIII had an alpine plateau climate, which was located on the side of the moist airflow with less rainfall, resulting in a greater correlation between the NDVI and P for grassland vegetation in the region (Yang et al., 2017). The time scale of grassland vegetation NDVI response to P in densely distributed grassland areas in the study area was 1–2 months (Figure 3D). Because the densely distributed grassland areas were all in semi-arid areas, the water availability in semi-arid areas was strong, and precipitation was absorbed by the soil and used by plants quickly. Water availability is a decisive factor affecting the function of semi-arid ecosystems (He et al., 2021). According to Table 1, climate zones I and II were semi-humid regions, whereas climate zones IV and V were humid regions with abundant precipitation. The NDVI response of forest vegetation in climate zones I and II to P was stronger than the same response in climate zones IV and V (Figure 6B), which was consistent with the NDVI and P in temperate regions calculated by Schultz and Halpert (1993). This result was consistent with the greatest correlation. Studies have shown that the embolism resistance of forest vegetation during continuous dry periods determines its viability (McDowell et al., 2008), whereas the embolism resistance in areas with less rainfall is low, and precipitation is used rapidly. For this reason, the median time scale of forest vegetation NDVI response to P in climate zones I and II was only 2 months, much shorter than the same result in climate zones IV and V (6 months). We found that the median time scale of NDVI response of cropland vegetation to P in the north (climate zones II, III and VI) was only 2 months, whereas the same result in climate zone IV in the south was 5 months (Figure 8D). This showed that the response of cropland vegetation NDVI to P may be affected by human activities. For example, humans have used crop improvements and water-saving irrigation technologies to reduce the dependence of northern cropland vegetation on P (Deng et al., 2006). Due to the large distribution of water at the junction of the Sichuan Basin, the North China Plain and the Changjiang Downstream Plain (Figure 1B), the correlations between NDVI and P for cropland vegetation in these areas were generally less than 0.283 (Figure 8B).
4.3 Responses of different vegetation types to P and PET
With climate change, the increase in surface roughness in semi-arid areas has led to a decrease in wind speed, which in turn has caused a decrease in PET and promoted vegetation growth (Vautard et al., 2010). In the study area, the dense grassland vegetation in the semi-arid area (Figures 1A, B) had annual precipitation of 200 mm–400 mm (Table 1). This may be one of the reasons why NDVI for grassland vegetation was more dependent on PET than the other vegetation types (Figure 9A). The influence of P on the three types of vegetation studied in the study area was dominant (Figure 9B), which was consistent with the relationship between vegetation and precipitation described by Wang et al. (2003). The impacts of irrigation on cropland increases cropland PET (Qiu et al., 2008), which also produced the short-term time scale of NDVI and PET related to cropland vegetation that accounted for the largest proportion of the three types of vegetation in this study. The proportion of short-term time scales related to forest vegetation NDVI and P was the lowest among the three types of vegetation in this study (Figures 9C, D). Studies have shown that forest vegetation benefits from longer root systems that can absorb moisture from deep soils (Anderegg et al., 2015).
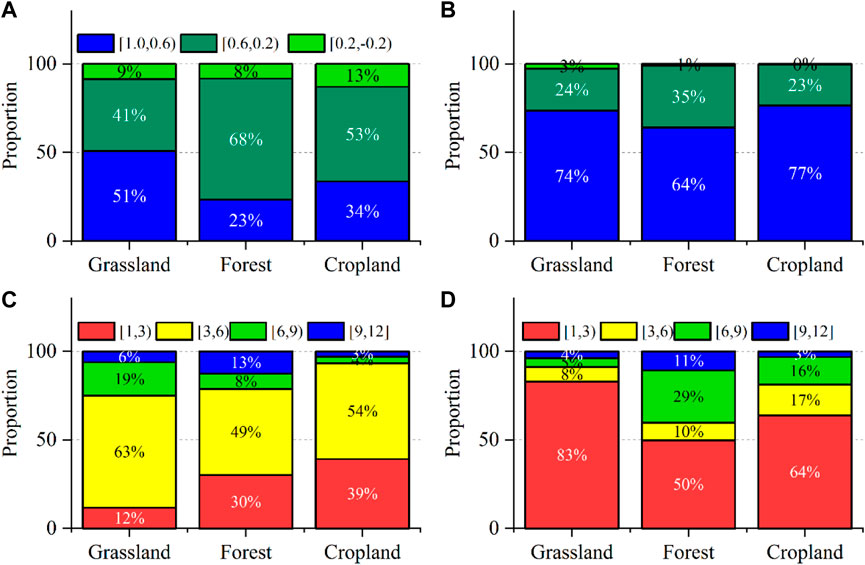
Figure 9. Correlation ratios of NDVI and PET for each vegetation type in the entire study area (A); Correlation ratios of NDVI and P for each vegetation type in the entire study area (B); NDVI response of each vegetation type in the entire study area to PET time scale (C); the time scale of the NDVI response to PET for each vegetation type in the entire study area (D).
5 Conclusion
This study used NDVI as an indicator and meteorological data was used to calculate drought index. This study combined partial correlation analysis to reveal the response of different vegetation types to precipitation (P) and potential evapotranspiration (PET). Additionally, it retained the time scale of the largest partial correlation coefficient to reflect the time scale of vegetation affected by P and PET. Almost all grassland vegetation, forest vegetation and cropland vegetation NDVI are positively correlated with P and PET. The specific research results are as follows:
(1) NDVI of grassland vegetation in high cover level grassland areas was very sensitive to both P and PET. Correlations between NDVI and PET in most areas with dense grassland were greater than 0.597. Correlations with P were greater than 0.670. The response time scale of NDVI to PET was mostly around 5–6 months, while the same result for P was only 1–2 months.
(2) The response characteristics of forest vegetation NDVI to PET and P in the study area were from northern to southern China. Correlations between northern semi-humid forest vegetation and PET were about 0.840, while those with P were slightly lower (about 0.603). Correlations between forest vegetation in the southern part of the study area and PET and P in the humid area were significantly less than that in the northern part, with median coefficients of 0.591 and 0.368. Time scales for the correlation between forest vegetation and PET and P in the northern part of the study area were about 3 and 2 months with low spatial variability.
(3) Both the response of cropland vegetation NDVI to PET and P and the time scale of the response of NDVI to PET had clear spatial heterogeneity. Correlations for NDVI, PET and P were highest in the Northeast Plain and were more than 0.662 and 0.628, respectively. The time scale of the NDVI response to P in the northern part of the study area had good spatial consistency, around 2 months.
This study used the remote sensing vegetation index (NDVI) data for analysis. There may have been noise and splicing traces in the imagery, as well as the influence of the NDVI data itself (soil background effects and other factors). Therefore, this may have introduced some errors in the research results. In addition, few meteorological stations were used and they did accurately reflect the actual situation of the entire study area, especially the western region. More detailed and accurate data are needed to analyze the effects of P and PET on vegetation. Therefore, further efforts are needed to accurately quantify the above-mentioned factors, combined with long-term field research to reduce the uncertainty of the research results.
Data availability statement
The original contributions presented in the study are included in the article/Supplementary material, further inquiries can be directed to the corresponding author.
Author contributions
HL: Data curation, Formal Analysis, Writing–original draft, Validation, Project administration, , Resources. WW: Writing–original draft, Methodology, Supervision, Funding acquisition, Software. GZ: Methodology, Visualization, Writing–review and editing. YD: Data curation, Methodology, Project administration, Writing–review and editing. XP: Supervision, Resources, Writing–review and editing.
Funding
The author(s) declare that financial support was received for the research, authorship, and/or publication of this article. This study was funded by The National Key Research and Development Program of China (No. 2023YFC3209200). Dynamic monitoring and evaluation of regional agricultural water saving level based on multi-source remote sensing information (Major key technology research project of water conservancy in 2021).
Acknowledgments
The authors are grateful to the editors and reviewers for their valuable suggestions to improve the quality of this manuscript.
Conflict of interest
Authors HL, WW, GZ, and YD were employed by Yellow River Engineering Consulting Co., Ltd.
The remaining author declares that the research was conducted in the absence of any commercial or financial relationships that could be construed as a potential conflict of interest.
Publisher’s note
All claims expressed in this article are solely those of the authors and do not necessarily represent those of their affiliated organizations, or those of the publisher, the editors and the reviewers. Any product that may be evaluated in this article, or claim that may be made by its manufacturer, is not guaranteed or endorsed by the publisher.
References
Abbasian, M. S., Najafi, M. R., and Abrishamchi, A. (2021). Increasing risk of meteorological drought in the Lake Urmia basin under climate change: introducing the precipitation–temperature deciles index. J. Hydrology 592, 125586. doi:10.1016/j.jhydrol.2020.125586
Allen, R. G., Pereira, L., and Smith, M. (1998) Crop evapotranspiration-Guidelines for computing crop water requirements-FAO Irrigation and drainage paper 56. Rome: FAO.
Anderegg, W. R. L., Schwalm, C., Biondi, F., Camarero, J. J., Koch, G., Litvak, M., et al. (2015). Pervasive drought legacies in forest ecosystems and their implications for carbon cycle models. Science 349, 528–532. doi:10.1126/science.aab1833
Baldocchi, D., Falge, E., Gu, L., Olson, R., Hollinger, D., Running, S., et al. (2001). FLUXNET: a new tool to study the temporal and spatial variability of ecosystem-scale carbon dioxide, water vapor, and energy flux densities. Bull. Am. Meteorological Soc. 82, 2415–2434. doi:10.1175/1520-0477(2001)082<2415:fantts>2.3.co;2
Beck, H. E., McVicar, T. R., van Dijk, A. I. J. M., Schellekens, J., de Jeu, R. A. M., and Bruijnzeel, L. A. (2011). Global evaluation of four AVHRR-NDVI data sets: intercomparison and assessment against Landsat imagery. Remote Sens. Environ. 115, 2547–2563. doi:10.1016/j.rse.2011.05.012
Birtwistle, A. N., Laituri, M., Bledsoe, B., and Friedman, J. M. (2016). Using NDVI to measure precipitation in semi-arid landscapes. J. Arid Environ. 131, 15–24. doi:10.1016/j.jaridenv.2016.04.004
Cihlar, J., Latifovic, R., Chen, J., Trishchenko, A., Du, Y., Fedosejevs, G., et al. (2004). Systematic corrections of AVHRR image composites for temporal studies. Remote Sens. Environ. 89, 217–233. doi:10.1016/j.rse.2002.06.007
Dai, A. (2011). Drought under global warming: a review. Wiley Interdiscip. Reviews-Climate Change 2, 45–65. doi:10.1002/wcc.81
Dai, A. (2013). Increasing drought under global warming in observations and models. Nat. Clim. Change 3, 52–58. doi:10.1038/nclimate1633
Deng, X. P., Shan, L., Zhang, H. P., and Turner, N. C. (2006). Improving agricultural water use efficiency in arid and semiarid areas of China. Agric. Water Manag. 80, 23–40. doi:10.1016/j.agwat.2005.07.021
Dermody, O., Weltzin, J. F., Engel, E. C., Allen, P., and Norby, R. J. (2007). How do elevated CO2, warming, and reduced precipitation interact to affect soil moisture and LAI in an old field ecosystem? Plant Soil 301, 255–266. doi:10.1007/s11104-007-9443-x
Ding, Y., Xu, J., Wang, X., Cai, H., Zhou, Z., Sun, Y., et al. (2021). Propagation of meteorological to hydrological drought for different climate regions in China. J. Environ. Manag. 283, 111980. doi:10.1016/j.jenvman.2021.111980
Ding, Y., Xu, J., Wang, X., Peng, X., and Cai, H. (2020). Spatial and temporal effects of drought on Chinese vegetation under different coverage levels. Sci. Total Environ. 716, 137166. doi:10.1016/j.scitotenv.2020.137166
Duan, C., Wu, L., He, L., and Wang, S. (2016). Spatio-temporal distribution pattern of vegetation coverage in Junggar Basin, Xinjiang. Acta Ecol. Sin. 36, 72–76. doi:10.1016/j.chnaes.2016.01.003
Goyal, R. K. (2004). Sensitivity of evapotranspiration to global warming: a case study of arid zone of Rajasthan (India). Agric. Water Manag. 69, 1–11. doi:10.1016/j.agwat.2004.03.014
Han, S., Hu, H., Yang, D., and Liu, Q. (2009). Differences in changes of potential evaporation in the mountainous and oasis regions of the Tarim basin, northwest China. Sci. China Ser. E-Technological Sci. 52, 1981–1989. doi:10.1007/s11431-009-0123-3
Han, S., Xu, D., and Wang, S. (2012). Decreasing potential evaporation trends in China from 1956 to 2005: accelerated in regions with significant agricultural influence? Agric. For. Meteorol. 154-155, 44–56. doi:10.1016/j.agrformet.2011.10.009
Hancock, P. A., and Hutchinson, M. F. (2006). Spatial interpolation of large climate data sets using bivariate thin plate smoothing splines. Environ. Model. Softw. 21, 1684–1694. doi:10.1016/j.envsoft.2005.08.005
Hao, Y., Baik, J., and Choi, M. (2019). Combining generalized complementary relationship models with the Bayesian Model Averaging method to estimate actual evapotranspiration over China. Agric. For. Meteorol. 279, 107759. doi:10.1016/j.agrformet.2019.107759
Hassan, M. M., Smith, A. C., Walker, K., Rahman, M. K., and Southworth, J. (2018). Rohingya refugee crisis and forest cover change in teknaf, Bangladesh. Remote Sens. 10 (5), 689. doi:10.3390/rs10050689
He, L., Li, Z.-L., Wang, X., Xie, Y., and Ye, J.-S. (2021). Lagged precipitation effect on plant productivity is influenced collectively by climate and edaphic factors in drylands. Sci. Total Environ. 755, 142506. doi:10.1016/j.scitotenv.2020.142506
Holben, B. N. (1986). Characteristics of maximum-value composite images from temporal AVHRR data. Int. J. Remote Sens. 7, 1417–1434. doi:10.1080/01431168608948945
Ji, L., and Peters, A. J. (2003). Assessing vegetation response to drought in the northern Great Plains using vegetation and drought indices. Remote Sens. Environ. 87, 85–98. doi:10.1016/s0034-4257(03)00174-3
Jiang, P., Ding, W., Yuan, Y., and Ye, W. (2020). Diverse response of vegetation growth to multi-time-scale drought under different soil textures in China's pastoral areas. J. Environ. Manag. 274, 110992. doi:10.1016/j.jenvman.2020.110992
Jiapaer, G., Liang, S., Yi, Q., and Liu, J. (2015). Vegetation dynamics and responses to recent climate change in Xinjiang using leaf area index as an indicator. Ecol. Indic. 58, 64–76. doi:10.1016/j.ecolind.2015.05.036
Li, J., Wu, C., Wang, X., Peng, J., Dong, D., Lin, G., et al. (2020). Satellite observed indicators of the maximum plant growth potential and their responses to drought over Tibetan Plateau (1982–2015). Ecol. Indic. 108, 105732. doi:10.1016/j.ecolind.2019.105732
Liu, X., Zhang, J., Zhu, X., Pan, Y., Liu, Y., Zhang, D., et al. (2014). Spatiotemporal changes in vegetation coverage and its driving factors in the Three-River Headwaters Region during 2000-2011. J. Geogr. Sci. 24, 288–302. doi:10.1007/s11442-014-1088-0
McDowell, N., Pockman, W. T., Allen, C. D., Breshears, D. D., Cobb, N., Kolb, T., et al. (2008). Mechanisms of plant survival and mortality during drought: why do some plants survive while others succumb to drought? New phytol. 178, 719–739. doi:10.1111/j.1469-8137.2008.02436.x
Milly, P. C. D., and Dunne, K. A. (2016). Potential evapotranspiration and continental drying. Nat. Clim. Change 6 (10), 946–949. doi:10.1038/nclimate3046
Mo, K., Chen, Q., Chen, C., Zhang, J., Wang, L., and Bao, Z. (2019). Spatiotemporal variation of correlation between vegetation cover and precipitation in an arid mountain-oasis river basin in northwest China. J. Hydrology 574, 138–147. doi:10.1016/j.jhydrol.2019.04.044
Müller Schmied, H., Eisner, S., Franz, D., Wattenbach, M., Portmann, F. T., Flörke, M., et al. (2014). Sensitivity of simulated global-scale freshwater fluxes and storages to input data, hydrological model structure, human water use and calibration. Hydrology Earth Syst. Sci. 18, 3511–3538. doi:10.5194/hess-18-3511-2014
Nanzad, L., Zhang, J., Tuvdendorj, B., Nabil, M., Zhang, S., and Bai, Y. (2019). NDVI anomaly for drought monitoring and its correlation with climate factors over Mongolia from 2000 to 2016. J. Arid Environ. 164, 69–77. doi:10.1016/j.jaridenv.2019.01.019
Pettorelli, N., Vik, J. O., Mysterud, A., Gaillard, J. M., Tucker, C. J., and Stenseth, N. C. (2005). Using the satellite-derived NDVI to assess ecological responses to environmental change. Trends Ecol. Evol. 20, 503–510. doi:10.1016/j.tree.2005.05.011
Pinzon, J. E., and Tucker, C. J. (2014). A non-stationary 1981-2012 AVHRR NDVI3g time series. Remote Sens. 6, 6929–6960. doi:10.3390/rs6086929
Potter, C. S., and Brooks, V. (1998). Global analysis of empirical relations between annual climate and seasonality of ndvi. International Journal of Remote Sensing 19 (15), 2921–2948. doi:10.1080/014311698214352
Qiu, G. Y., Wang, L., He, X., Zhang, X., Chen, S., Chen, J., et al. (2008). Water use efficiency and evapotranspiration of winter wheat and its response to irrigation regime in the north China plain. Agric. For. Meteorol. 148, 1848–1859. doi:10.1016/j.agrformet.2008.06.010
Ren, S., Li, Y., and Peichl, M. (2020). Diverse effects of climate at different times on grassland phenology in mid-latitude of the Northern Hemisphere. Ecol. Indic. 113, 106260. doi:10.1016/j.ecolind.2020.106260
Rundquist, B. C., and Harrington, J. A. (2000). The effects of climatic factors on vegetation dynamics of tallgrass and shortgrass cover. GeoCarto Int. 15, 33–38. doi:10.1080/10106040008542161
Schultz, P. A., and Halpert, M. S. (1993). Global correlation of temperature, NDVI and precipitation. Adv. Space Res. 13, 277–280. doi:10.1016/0273-1177(93)90559-t
Shen, Y., Liu, C., Liu, M., Zeng, Y., and Tian, C. (2010). Change in pan evaporation over the past 50 years in the arid region of China. Hydrol. Process. 24, 225–231. doi:10.1002/hyp.7435
Shi, S., Yu, J., Wang, F., Wang, P., Zhang, Y., and Jin, K. (2021). Quantitative contributions of climate change and human activities to vegetation changes over multiple time scales on the Loess Plateau. Sci. Total Environ. 755, 142419. doi:10.1016/j.scitotenv.2020.142419
Shi, Y., Jin, N., Ma, X., Wu, B., He, Q., Yue, C., et al. (2020). Attribution of climate and human activities to vegetation change in China using machine learning techniques. Agric. For. Meteorol. 294, 108146. doi:10.1016/j.agrformet.2020.108146
Sun, W., Song, X., Mu, X., Gao, P., Wang, F., and Zhao, G. (2015). Spatiotemporal vegetation cover variations associated with climate change and ecological restoration in the Loess Plateau. Agric. For. Meteorol. 209-210, 87–99. doi:10.1016/j.agrformet.2015.05.002
Tan, Y., Xu, H., and Zhang, X. (2016). Sustainable urbanization in China: a comprehensive literature review. Cities 55, 82–93. doi:10.1016/j.cities.2016.04.002
Tang, Z., Ma, J., Peng, H., Wang, S., and Wei, J. (2017). Spatiotemporal changes of vegetation and their responses to temperature and precipitation in upper Shiyang river basin. Adv. Space Res. 60, 969–979. doi:10.1016/j.asr.2017.05.033
Tateishi, R., and Ebata, M. (2004). Analysis of phenological change patterns using 1982-2000 advanced very high resolution radiometer (AVHRR) data. Int. J. Remote Sens. 25, 2287–2300. doi:10.1080/01431160310001618455
Tian, F., Fensholt, R., Verbesselt, J., Grogan, K., Horion, S., and Wang, Y. (2015). Evaluating temporal consistency of long-term global NDVI datasets for trend analysis. Remote Sens. Environ. 163, 326–340. doi:10.1016/j.rse.2015.03.031
Tian, W., Liu, X., Liu, C., and Bai, P. (2018). Investigation and simulations of changes in the relationship of precipitation-runoff in drought years. J. Hydrology 565, 95–105. doi:10.1016/j.jhydrol.2018.08.015
Trenberth, K. E. (2011). Changes in precipitation with climate change. Clim. Res. 47, 123–138. doi:10.3354/cr00953
Vautard, R., Cattiaux, J., Yiou, P., Thepaut, J.-N., and Ciais, P. (2010). Northern Hemisphere atmospheric stilling partly attributed to an increase in surface roughness. Nat. Geosci. 3, 756–761. doi:10.1038/ngeo979
Vicente-Serrano, S. M., Gouveia, C., Julio Camarero, J., Begueria, S., Trigo, R., Lopez-Moreno, J. I., et al. (2013). Response of vegetation to drought time-scales across global land biomes. Proc. Natl. Acad. Sci. U. S. A. 110, 52–57. doi:10.1073/pnas.1207068110
Wang, J., Price, K. P., and Rich, P. M. (2001). Spatial patterns of NDVI in response to precipitation and temperature in the central Great Plains. Int. J. Remote Sens. 22, 3827–3844. doi:10.1080/01431160010007033
Wang, J., Rich, P. M., and Price, K. P. (2003). Temporal responses of NDVI to precipitation and temperature in the central Great Plains, USA. Int. J. Remote Sens. 24, 2345–2364. doi:10.1080/01431160210154812
Wang, Y., Liu, G., and Guo, E. (2019). Spatial distribution and temporal variation of drought in inner Mongolia during 1901–2014 using standardized precipitation evapotranspiration index. Sci. Total Environ. 654, 850–862. doi:10.1016/j.scitotenv.2018.10.425
Wang, Z., Li, J., Lai, C., Zeng, Z., Zhong, R., Chen, X., et al. (2017). Does drought in China show a significant decreasing trend from 1961 to 2009? Sci. Total Environ. 579, 314–324. doi:10.1016/j.scitotenv.2016.11.098
Wei, B., Xie, Y., Jia, X., Wang, X., He, H., and Xue, X. (2018). Land use/land cover change and it's impacts on diurnal temperature range over the agricultural pastoral ecotone of Northern China. Land Degrad. Dev. 29, 3009–3020. doi:10.1002/ldr.3052
Xu, C.-y., Gong, L., Jiang, T., Chen, D., and Singh, V. P. (2006). Analysis of spatial distribution and temporal trend of reference evapotranspiration and pan evaporation in Changjiang (Yangtze River) catchment. J. Hydrology 327, 81–93. doi:10.1016/j.jhydrol.2005.11.029
Xu, H.-j., Wang, X.-p., Zhao, C.-y., and Yang, X.-m. (2018). Diverse responses of vegetation growth to meteorological drought across climate zones and land biomes in northern China from 1981 to 2014. Agric. For. Meteorol. 262, 1–13. doi:10.1016/j.agrformet.2018.06.027
Yang, Y., Chen, R., Han, C., and Liu, Z. (2021). Evaluation of 18 models for calculating potential evapotranspiration in different climatic zones of China. Agric. Water Manag. 244, 106545. doi:10.1016/j.agwat.2020.106545
Yang, Y., Wu, Q., Hou, Y., Zhang, Z., Zhan, J., Gao, S., et al. (2017). Unraveling of permafrost hydrological variabilities on Central Qinghai-Tibet Plateau using stable isotopic technique. Sci. Total Environ. 605-606, 199–210. doi:10.1016/j.scitotenv.2017.06.213
Yin, L., Feng, X., Fu, B., Chen, Y., Wang, X., and Tao, F. (2020). Irrigation water consumption of irrigated cropland and its dominant factor in China from 1982 to 2015. Adv. Water Resour. 143, 103661. doi:10.1016/j.advwatres.2020.103661
Zeng, F.-W., Collatz, G. J., Pinzon, J. E., and Ivanoff, A. (2013). Evaluating and quantifying the climate-driven interannual variability in global inventory modeling and mapping studies (GIMMS) normalized difference vegetation index (NDVI3g) at global scales. Remote Sens. 5, 3918–3950. doi:10.3390/rs5083918
Zhang, G., Zhang, S., Wang, H., Gan, T. Y., Su, X., Wu, H., et al. (2024). Evaluating vegetation vulnerability under compound dry and hot conditions using vine copula across global lands. J. Hydrology 631, 130775. doi:10.1016/j.jhydrol.2024.130775
Zhang, Q., Kong, D., Singh, V. P., and Shi, P. (2017). Response of vegetation to different time-scales drought across China: spatiotemporal patterns, causes and implications. Glob. Planet. Change 152, 1–11. doi:10.1016/j.gloplacha.2017.02.008
Zhang, X., and Zhang, B. (2019). The responses of natural vegetation dynamics to drought during the growing season across China. J. Hydrology 574, 706–714. doi:10.1016/j.jhydrol.2019.04.084
Zhang, Y., Peng, C., Li, W., Fang, X., Zhang, T., Zhu, Q., et al. (2013). Monitoring and estimating drought-induced impacts on forest structure, growth, function, and ecosystem services using remote-sensing data: recent progress and future challenges. Environ. Rev. 21, 103–115. doi:10.1139/er-2013-0006
Zhao, H., and Ma, Y. (2021). Effects of various driving factors on potential evapotranspiration trends over the main grain-production area of China while accounting for vegetation dynamics. Agric. Water Manag. 250, 106854. doi:10.1016/j.agwat.2021.106854
Zheng, Y., Han, J., Huang, Y., Fassnacht, S. R., Xie, S., Lv, E., et al. (2018). Vegetation response to climate conditions based on NDVI simulations using stepwise cluster analysis for the Three-River Headwaters region of China. Ecol. Indic. 92, 18–29. doi:10.1016/j.ecolind.2017.06.040
Zhou, Q., Luo, Y., Zhou, X., Cai, M., and Zhao, C. (2018). Response of vegetation to water balance conditions at different time scales across the karst area of southwestern China-A remote sensing approach. Sci. Total Environ. 645, 460–470. doi:10.1016/j.scitotenv.2018.07.148
Keywords: NDVI, grassland, forest, cropland, precipitation, potential evapotranspiration
Citation: Liu H, Wei W, Zhu G, Ding Y and Peng X (2024) The different vegetation types responses to potential evapotranspiration and precipitation in China. Front. Environ. Sci. 12:1406621. doi: 10.3389/fenvs.2024.1406621
Received: 26 March 2024; Accepted: 03 May 2024;
Published: 03 June 2024.
Edited by:
Peng Chen, Hohai University, ChinaReviewed by:
Tangzhe Nie, Heilongjiang University, ChinaEnnan Zheng, Heilongjiang University, China
Gengxi Zhang, Yangzhou University, China
Copyright © 2024 Liu, Wei, Zhu, Ding and Peng. This is an open-access article distributed under the terms of the Creative Commons Attribution License (CC BY). The use, distribution or reproduction in other forums is permitted, provided the original author(s) and the copyright owner(s) are credited and that the original publication in this journal is cited, in accordance with accepted academic practice. No use, distribution or reproduction is permitted which does not comply with these terms.
*Correspondence: Xiongbiao Peng, pengxiongbiao@nwafu.edu.cn