Distribution of volatile organic compounds (VOCs) in the urban atmosphere of Hangzhou, East China: Temporal variation, source attribution, and impact on the secondary formations of ozone and aerosol
 Xin Wang1†
  Hongbo Fu
- 1Shanghai Key Laboratory of Atmospheric Particle Pollution and Prevention, Department of Environmental Science & Engineering, Institute of Atmospheric Sciences, Fudan University, Shanghai, China
- 2Jiangxi Key Laboratory of Environmental Pollution Control, Jiangxi Academy of Eco-Environmental Sciences and Planning, Nanchang, China
- 3Hangzhou Ecological Environmental Monitoring Center of Zhejiang Province, Hangzhou, China
- 4Tangshan Ecological Environment Publicity and Education Center, Tangshan, China
- 5Collaborative Innovation Center of Atmospheric Environment and Equipment Technology (CICAEET), Nanjing University of Information Science and Technology, Nanjing, China
- 6Institute of Eco-Chongming (SIEC), Shanghai, China
Volatile organic compounds (VOCs) significantly influence air quality, atmospheric chemistry, and human health. An observational study was performed at the urban site of Hangzhou, China, to analyze VOC characteristics, sources, chemical reactivities, and their impact on ozone (O3) and secondary organic aerosol (SOA) formation throughout the year 2021. During the observation period, alkanes (40.13%) emerging as the predominant VOC species. Seasonal variation in VOCs followed the order of winter (26.49 ppb) > spring (23.63 ppb) > summer (23.62 ppb) > autumn (20.47 ppb). The results of positive matrix factorization (PMF) revealed that solvent usage, combustion, and vehicle exhaust were the dominant VOC sources. Regional transport from nearby provinces also significantly contributed to VOC levels. These contributions varied seasonally, with southeastern air masses prevailing in both spring and autumn, eastern air masses impacting summer, and northwestern air masses affecting winter. The campaign-averaged value of total hydroxyl (OH) radicals was 19.08 s−1. NO2 accounted for the most significant contribution to the overall OH reactivity (39.11%), followed by VOCs (28.72%). Notable seasonal fluctuations in OH reactivity followed the order of winter (24.20 s−1) > spring (19.22 s−1) > autumn (18.07 s−1) > summer (14.86 s−1). The average ozone formation potential (OFP) for the measured VOCs was calculated as 75.54 ppb, with alkenes being the dominant contributor. The highest value was observed in spring (83.05 ppb), the lowest value was in autumn (60.43 ppb). The SOA formation potential, mainly contributed by the aromatics, was averaged as 2.92 μg m−3. Additionally, the top four SOA-contributing species across four seasons were toluene, benzene, m-xylene, and ethylbenzene. VOC–PM2.5 sensitivity analysis showed that VOCs exhibited higher sensitivity to PM2.5 on clean level (PM2.5 < 35 μg m−3) than on level with heavy pollution. Alkenes, oxygenated volatile organic compounds (OVOCs) and aromatics played significant roles in the transformations of O3 and SOA in Hangzhou. Therefore, controlling the concentrations of these species is crucial for reducing complex atmospheric pollution in the region. Overall, this study compiles scientific evidence on pollution sources in Hangzhou, providing the government with valuable information.
1 Introduction
In recent years, regions worldwide have been experiencing atmospheric pollution events, particularly severe haze episodes during winter and autumn and O3 pollution in the summer (Zhang et al., 2018; Yadav et al., 2019; Uttamang et al., 2020; Yu et al., 2022). Volatile organic compounds (VOCs), which are common precursors of ozone (O3) and fine particulate matter (PM2.5), are considered significant pollutants contributing to regional atmospheric composite pollution in China. They are closely associated with atmospheric pollution events such as photochemical smog and haze, which can potentially harm human health. Consequently, they have become a global focus for air pollution prevention and control. Additionally, the mechanisms underlying the impact of VOCs on the environment are not yet fully understood. Therefore, the investigation of VOCs remains a central focus for both the scientific community and relevant regulatory authorities (Xu et al., 2017; Liu et al., 2019b; Song et al., 2019).
VOCs encompass a wide range of species, each with varying chemical reactivity. Thus, researchers have focused on elucidating VOC characteristics and identifying key active substances. Studies have often highlighted alkanes as the primary VOCs, while aromatics and alkenes are typically deemed more significant contributors to ozone formation potential (OFP). However, the influence of OVOCs has been overlooked (Guo et al., 2017; Han et al., 2023). Han et al. (2023) indicated that alkanes constituted the predominant group, comprising 60.88% of the total VOC concentration, while alkenes were the largest potential contributor to OFP. However, Louie et al. (2013) reported that OVOCs significantly contributed to OFP in the Greater Bay Area, accounting for more than one-third of the total impact of VOCs. This finding underscores the importance of OVOCs in OFP calculations and their subsequent impact on atmospheric chemistry. Additionally, OVOCs are recognized for their active participation in atmospheric photochemistry, leading to the formation of secondary gaseous and particulate products through chain reactions. Given the significant contribution of OVOCs to OFP, studying the impact of OVOCs is crucial. However, considering the complex composition of atmospheric VOCs, identifying their sources is challenging.
Field measurements revealed that fluctuations in atmospheric oxidation capacity (AOC) influenced O3 levels and significantly affected the production of secondary particles year-round (Prinn, 2003). However, short-term monitoring data for VOCs, typically covering a few days to a couple of months, are more prevalent than data collected over extended periods (Mozaffar and Zhang, 2020; Yu et al., 2022). This phenomenon hinders the development of a comprehensive understanding of VOC pollution. Moreover, previous studies have predominantly concentrated on variations in AOC, with a limited understanding of the seasonal variations of AOC produced by VOCs, which are expected to be significant. Thus, it is crucial to conduct long-term investigations and assess seasonal variations in AOC. VOCs are important precursors for the formation of secondary organic aerosols (SOAs) (Chen et al., 2011; Tong et al., 2013). Numerous studies have conducted chamber experiments (Pankow et al., 2001; Dechapanya et al., 2003; Chen et al., 2011) to delineate the properties of haze and calculate SOA yields from the precursors (Seinfeld et al., 2001; de Gouw et al., 2011; Gentner et al., 2017). Model predictions typically yield values that are underestimated compared with measured values in urban areas (Ait-Helal et al., 2014; Fu et al., 2014; Han et al., 2017). Furthermore, there is limited understanding regarding the qualitative and quantitative differences between VOCs and PM2.5 (Yamada, 2013; Mo et al., 2015; Han et al., 2017). Hence, investigating the combined effects of the physical evolution and chemical reactions of VOCs on SOA formation is crucial.
Hangzhou, the political and cultural hub of Zhejiang Province, spans an expansive 16,850 square kilometers and has a population exceeding 12 million. This region has frequently suffered from severe haze episodes and photochemical pollution, primarily stemming from the substantial release of air pollutants, as documented in the Environmental and Ecological Status Bulletins in China (http://www.mee.gov.cn/hjzl/). Extensive studies have been conducted on air pollution in Hangzhou, with many of the earlier studies focusing on VOC concentrations (Wang et al., 2019). However, there remains limited understanding from previous research regarding the formation of O3 and SOA from VOCs, as well as the relationships between VOCs, PM2.5, and O3, particularly concerning long-term and seasonal variations (Ying et al., 2012; Jing et al., 2020a). Following policy adjustments and improvements to the energy infrastructure, recent mitigation efforts may have altered the characteristics of VOCs. Therefore, it is crucial to examine the specific features of local VOC pollution using an extended time series of monitoring data. This information can provide valuable insights for shaping local air pollution control strategies.
To further elucidate the characteristics of VOC pollution, source contributions, and secondary formations of O3 and SOA, high-temporal-resolution measurements of VOCs were conducted in Hangzhou from January 1st to 31 December 2019. The objectives of this research are to 1) analyze the characteristics and seasonal variations in VOCs, 2) identify the contributions of VOC sources, 3) speciate OH reactivity among seasonal variations, and 4) quantitatively assess the contributions of VOCs to the formation of PM2.5 and O3.
2 Observation and methods
2.1 Site description
The site of Zhuantang (ZT) (30.15°N, 120.08°E) is situated southwest upwind of the urban area. There are no discernible pollution sources nearby, and the observation period spans throughout 2021 (Supplementary Figure S1). Elevated roads and the Hangzhou Bypass Road are nearby, while the Changshen Highway is 500 m away. To the north of this observation point lies the West Lake Scenic Area. Parks, such as Xinshixun Science and Technology Park or Liouliang Industrial Village, are located 12–20 km away in the northwest. In the northeastern direction, Nanshingqiao Freight Railway Station, Hangzhou Station, and Hangzhou East Station are located about 20 km away. Furthermore, approximately 20 km to the southwest are industrial estates such as Jinqiao Industrial Park or Chunjian Industrial Park. In summary, the site of ZT in Hangzhou’s Xihu District, constitutes a typical urban integrated functional area. Additionally, it reflects the regional characteristics of urban air pollution in Hangzhou to a certain extent.
2.2 Sampling and chemical analysis
VOCs (29 alkanes, 11 alkenes, 1 alkyne, 17 aromatics, and 20 OVOCs) were sampled at an interval of 6 days and sampling began at 10:00 a.m. on each sampling days and ended at 10:00 a.m. on the next day using a 3.2 L SUMMA passivated stainless steel tank (ENTECH Instruments, Inc., United States) combined with ENTECH 1900 (ENTECH Instruments, Inc., United States) handheld injector and an MH1200-B automatic atmospheric sampler (Minhope Instruments Inc., Qingdao, China), which was employed for constant flow sampling lasting 24 h. The samples were then analyzed using a Superlab 2020-TT-GCMS (Panhe Scientific Instrument Co., Ltd., Shanghai, China) SUMMA tank automatic constant-flow sampling system. Ethane, ethylene, acetylene, propane, and propene were identified using an FID detector, while the remaining VOC compounds were detected using an MS detector. A PLOT column (Al/KCl, 30 m × 0.25 mm × 5 μm) was used as the FID chromatographic column, and a BD-624 column (60 m × 0.25 mm × 1.4 μm) was utilized as the MS chromatographic column. The MS column was analyzed using the full-scan depth mode (Jing et al., 2020b).
The concentrations of major pollutants such as PM2.5, CO, SO2, O3, and NOx were measured using the following instruments: PM2.5 levels were continuously monitored using a Thermo Scientific™ Model 5030i SHARP particulate matter monitor. CO concentrations were measured using a Thermo Scientific™ Model 48i analyzer, which is equipped with gas filters and NDIR technology to ensure accurate and reliable readings. To ensure excellent detection specificity and long-term stability in measuring SO2, the Thermo Scientific™ SO2 analyzer utilizes a pulsed fluorescence technique. O3 was measured using the Thermo Scientific™ 49i dual-chamber ultraviolet photometric ozone analyzer. For measuring NOx concentrations, the Thermo Scientific™ Model 42i analyzer, which employs chemiluminescence, was utilized, allowing for independent calibration. Each of the trace gas analyzers was checked every day for zero calibration, along with weekly calibration and monthly multipoint calibration. Meteorological data, including temperature, relative humidity (RH), and wind speed, were obtained from each meteorological station.
2.3 Methods
2.3.1 Positive matrix factorization model
The positive matrix factorization (PMF) model is a source–receptor statistical factor analysis method widely used for apportioning sources of air pollution. In the current study, the U.S. EPA PMF 5.0 receptor model was employed for the source apportionment of measured VOC species. The method is detailed in Paatero and Tapper (1994). The monitoring data samples can be represented as a matrix X with i rows and j columns, where i represents the number of samples, and j represents the number of measured species. Any matrix X can be decomposed into a factorial product of two matrices: the factor contribution matrix g (i × p) and the factor profile matrix f (p × j), along with a residual part not explained by the model, e. The mass of each measurement sample is calculated according to Eq. 1, where the number of source factors is p.
According to the Qtrue/Qrobust value, choosing an optimal number of factors in a model is essential. Qtrue is the actual value calculated using the PMF model, while Qrobust is the value calculated after correcting for missing values or outliers (Brown et al., 2015). Theoretically, the analysis is considered reasonable when Qtrue/Qrobust < 1.5 and tends to be 1. The objective function Q is shown in Eq. 2, where uij represents the uncertainty associated with Xij.
Two input files are required by the PMF: one for concentration values and another for uncertainty values for individual VOC species. The data’s uncertainty (Unc) is determined by the method detection limit (MDL) and the error fraction (EF) of the measurement, as presented in Eq. 3.
The EF can be set to 5 %–20% when the concentration of the measured data is higher than the MDL (Song et al., 2007; Hui et al., 2018). In this study, the EF was set to 10%. Data below the detection limit were replaced with 1/2 MDL, corresponding to an uncertainty of 5/6 MDL.
2.3.2 Backward trajectory analysis
Trajectory clustering analysis is a clustering method based on the trajectory data of moving objects. The main aim of the study is to summarize and categorize an extensive collection of data on trajectory, which share similar movement characteristics with research subjects. In this study, an Eulerian distance estimation algorithm is used to calculate the relevant trajectories based on air mass velocity. To avoid ground friction interference with air mass trajectories, the study employs MeteoInfoMap software, which provides trajectory analysis at a near-surface height of 500 m. A 24-h calculation period is used to analyze air mass trajectory and sources in Hangzhou during the year 2021. The hourly meteorological data were obtained from the Global Data Assimilation System provided by the National Oceanic and Atmospheric Administration (NOAA., ftp://arlftp.arlhq.noaa.gov/pub/archives/gdas1).
2.3.3 OH reactivity
Thousands of trace gases released into the atmosphere will eventually chemically react with hydroxyl radicals. OH is primarily produced by the photolysis of O3 and by the reaction of excited-state atomic oxygen with water vapor. The total OH reactivity is defined as the combined effect of all OH reactants on the frequency of instantaneous OH loss in the atmosphere (s−1), which is essentially the inverse of the OH chemical lifetime. The OH reactivity, as calculated using Eq. 4 in this study, depends on the concentrations of all OH-reactive trace gases and their reaction rate coefficients with OH. These factors collectively determine the inverse of the OH chemical lifetime, influencing the abundance of OH and the efficiency in the atmosphere cleaning process. Continued OH production results in a decrease in overall OH concentrations in the atmosphere as OH reactivity increases. Additionally, the chemical activity of VOCs in the air varies widely and exerts various impacts on atmospheric reactivity.
where kOH+VOCi, kOH+CO, kOH+NO, kOH+NO2, kOH+SO2, and kOH+O3 denote the reaction constants (cm3 molecule−1 s−1) of the VOC species, CO, NO, NO2, SO2, and O3, respectively, with OH radicals. These values were sourced from Atkinson and Arey (2003). [VOCi], [CO], [NO], [NO2], [SO2], and [O3] denote the concentrations of the VOC species, CO, NO, NO2, SO2, and O3, respectively (molecule cm−3).
2.3.4 OFP
The methodology employed in this paper is based on Carter’s maximum incremental reactivity (MIR) method for evaluating the OFP of VOCs (Carter, 1994; 1997) (Supplementary Table S1). MIR is commonly employed to gauge the chemical reactivity of different VOCs, while OFP is used to measure the impact of various VOCs on O3 formation. The OFP values of different VOC species can be determined using Eq. 5:
2.3.5 SOA formation potential
SOA is a significant atmospheric pollutant involved in haze formation. It is primarily produced through the oxidation and air–particle partitioning of both natural and anthropogenic VOC emissions. In this study, the potential of VOCs to form SOA is investigated using the secondary organic aerosol potential (SOAP) parameter developed by Derwent et al. (2010) (Supplementary Table S1). SOAP is typically denoted by a toluene index of 100 and is calculated by summing the SOAP values of all VOC species, as illustrated in Eq. 6. Here, VOCi represents the concentration of the measured species i, and SOAPi denotes the SOAP value of the measured species i.
2.3.6 VOC–PM2.5 sensitivity analysis
Previous studies have shown that a qualitative description of VOC and PM2.5 evolution can be obtained at every concentration interval. However, it remains challenging to conduct a quantitative analysis of the evolution patterns of VOCs and PM2.5. To assess the impact of PM2.5 concentration on VOCs, Han et al. formulated equations (Eqs. 7; 8) for sensitivity coefficients, enabling a more precise determination of their correlation (Han et al., 2017; Han et al., 2018a).
where ΔVOCs and ΔPM2.5 characterize the concentrations of VOCs and PM2.5 (μg m−3) under the specified PM2.5 concentration range, and BVOCs and BPM2.5 represent the background concentrations of VOCs and PM2.5, respectively.
In this study, PM2.5 concentrations averaging <20 μg m−3 are labeled BPM2.5, while the corresponding average VOC concentrations are denoted as BVOCs (Han et al., 2017; Han et al., 2018a). Generally, a higher value of the VOC–S coefficient suggests greater sensitivity of VOC concentration to changes in PM2.5 concentration. This implies that VOC concentration fluctuates more while the PM2.5 concentration changes less.
3 Results and discussion
3.1 Characteristics of VOCs
3.1.1 Concentrations and compositions of VOCs
The time series of meteorological factors, VOCs, NOx, SO2, CO, O3, and PM2.5 at the ZT site are depicted in Figure 1. The average temperature was 17.19°C ± 8.59°C, and the mean RH was 81.31% ± 12.43%. The wind speed ranged from 0.48 to 5.18 m s−1, with a mean value of 1.18 ± 0.63 m s−1. The mean concentrations of SO2 and CO were 4.21 ± 1.02 μg m−3 and 0.64 ± 0.17 mg m−3, with ranges of 1.02–9.83 μg m−3 and 0.16–1.30 mg m−3, respectively. The mean concentration of NOx was 33.47 ± 14.39 μg m−3. These results were comparable to those observed in Hangzhou and Shanghai, China (Mao et al., 2022; Han et al., 2023).
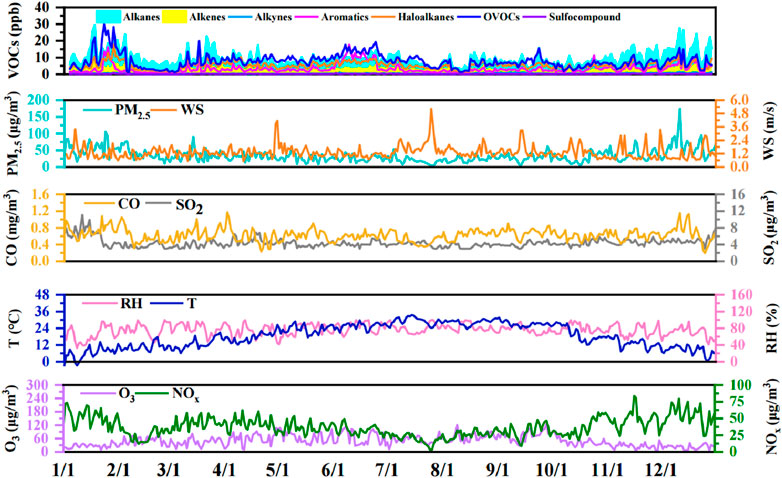
Figure 1. Time series of VOCs, PM2.5, CO, SO2, O3, NOx, and meteorological parameters (temperature [T], relative humidity [RH], and wind speed [WS]) during the observation period.
The campaign-averaged maximum and minimum concentrations were respectively obtained as 3 and 173.5 μg m−3 for PM2.5 and 2.33 and 145 μg m−3 for O3, with the average concentrations of 34.15 ± 21.35 μg m−3 and 33.67 ± 19.68 μg m−3 for PM2.5 and O3, respectively. Generally, the concentration of PM2.5 was lower than those recorded in December 2017, where the PM2.5 concentration was 52.4 μg m−3 in urban Shanghai (Liu et al., 2021a). The average O3 concentration was considerably lower than those obtained for Xi’an, China (102 μg m−3) (Song et al., 2021); Beijing-Tianjin-Hebei, China (154 μg m−3) (Yang et al., 2020); Hamburg, Germany (120.6 μg m−3) (Krug et al., 2020); and Leipzig, Germany (139.9 μg m−3) (Krug et al., 2020). As a crucial precursor of O3, the trend observed in VOC concentration exhibited an inverse correlation with that of O3. Specifically, when atmospheric VOCs accumulate to a particular threshold level, there is a gradual increase in O3 concentration via photochemical reactions, coinciding with a decrease in VOC concentration (Song et al., 2018; Yang et al., 2020).
During the whole year of 2021, the average VOC concentration was 23.60 ppb (Figure 2), comparable to the concentration of VOCs in Shanghai, China (21.36 ppb) (Han et al., 2023), but lower than those in Hangzhou, China (32.00 ppb) (Han et al., 2019), Guangzhou, China (42.7 ppb) (Zou et al., 2015), 3China (34.4 ppb) (Shao et al., 2016), Beijing, China (53.5 ppb) (Liu et al., 2020), Tianjin (30.6 ± 24.0 ppb) (Gu et al., 2020) and Delhi, India (54.59 ppb) (Kumar et al., 2018). Compared with the relevant observation performed previously in Hangzhou, this study generally presented lower VOC concentrations (Han et al., 2019; Li et al., 2023). The major VOC component was alkanes, with an average concentration of 9.47 ppb, comprising 40.13% of the total VOC (TVOC) concentration, followed by OVOCs (7.79 ppb, 33.02%), alkenes (3.02 ppb, 12.80%), aromatics (2.91 ppb, 12.33%), and alkyne (0.41 ppb, 1.72%). The significant contribution of alkanes is attributable to their extensive emission sources and prolonged atmospheric lifetimes.
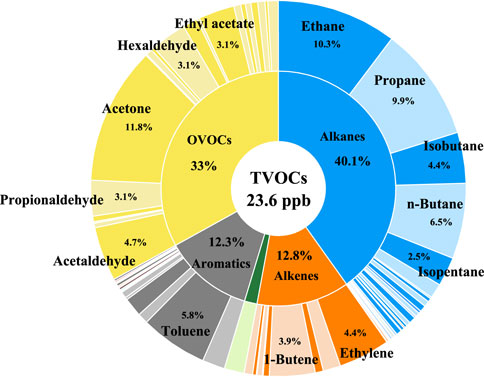
Figure 2. Contributions of the VOC categories at the ZT site (the contributions >2% were marked).
3.1.2 Seasonal variations
The VOC concentrations exhibited significant seasonal variations (Figure 3; Supplementary Figure S2). The TVOC concentrations declined in the order of winter (26.49 ppb) > spring (23.63 ppb) > summer (23.62 ppb) > autumn (20.47 ppb). Similar seasonal trends were observed for the majority of VOC components, except for OVOCs.
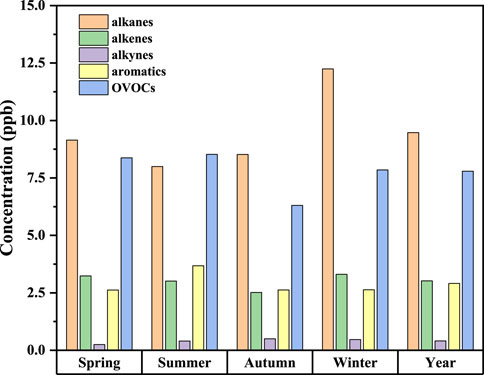
Figure 3. Seasonal variation of various types of VOCs at the ZT site.
Seasonal fluctuations in OH radicals, the distribution and intensity of emission sources, and meteorological conditions significantly contributed to notable variations in the observed levels of VOCs. The heightened dispersion and convection of pollutants, driven by deep mixing during summer and autumn, contributed to the reduction of VOCs (Modon et al., 2001; Kumar et al., 2018). Additionally, elevated temperatures and increased solar radiation can lead to greater VOC losses through photochemical degradation during the summer, resulting in the formation of simpler molecules such as CO, CO2, and other intermediates (Lai et al., 2013). The presence of increased atmospheric stability and calm conditions restricted the dispersion of pollutants, consequently leading to higher levels of VOCs during the winter season (Dumanglu et al., 2014). Apart from those, photochemical reactivity was also an important factor leading to higher levels of VOCs that cannot be ignored. OVOCs are primarily generated via the oxidation of biogenic and anthropogenic hydrocarbons and other organic compounds in the atmosphere (Finlayson-Pitts and Pitts, 2000), with additional emissions from vegetation. Therefore, the seasonal variation of OVOCs followed the order: summer > spring > winter > autumn, consistent with the findings of Gu et al. (2019).
3.2 Source apportionment
3.2.1 Special VOC ratio analysis
Various types of VOC species originate from distinct sources, and analyzing the ratio of these different species could serve as a preliminary method for distinguishing emission sources (An et al., 2014). In this study, we employed variations in the ratios of toluene/benzene (T/B), iso-pentane/n-pentane (P/P), and m, p-xylene/ethylbenzene (X/E) at the sampling sites to identify the sources of VOC emissions. The results are presented in Figure 4.
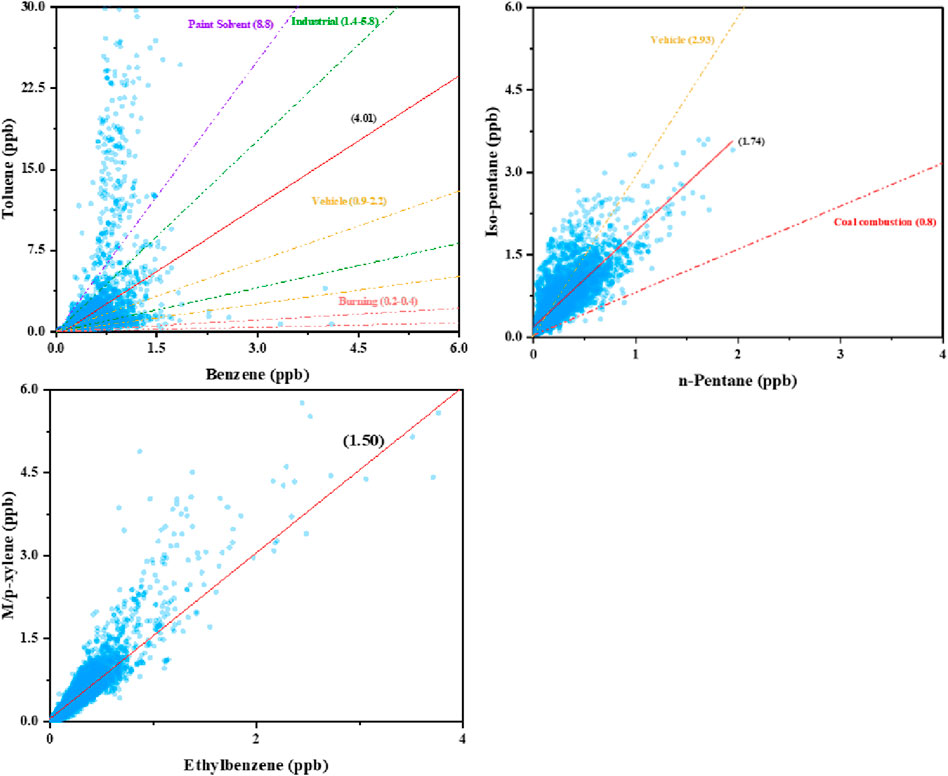
Figure 4. Specific ratios of the target VOC species for source identification. The linear correlations between toluene and benzene; m, p-xylene and ethylbenzene; and iso-pentane and n-pentane at the ZT site.
Diverse VOC sources can be identified according to distinct T/B ratios (Song et al., 2021). The mean T/B ratio was 4.01 ± 0.11, with Pearson correlation coefficients (RPearson) of 0.38. Most of the ratios (44.58% and 49.69%) fall within the ranges of 0.9–2.2 and 1.4–5.8, indicating significant impacts of vehicular emissions and industrial emissions on VOC concentrations, consistent with previous studies (Zhang et al., 2013; Shi et al., 2015; Yao et al., 2015; Deng et al., 2018; Han et al., 2023). This observation is attributable to the distribution of industrial enterprises such as Jinqiao Industrial Park and Chunjian Industrial Zone, which are located 20 km away from the sampling site in the southwest direction. Additionally, Hangzhou, as a transportation hub, hosts a substantial fleet of motor vehicles, necessitating the reinforcement of regional measures to control motor vehicle usage.
The sources originating from fossil fuels (vehicle exhaust, fuel evaporation, and coal combustion) can be further distinguished according to the P/P ratio. Iso-pentane and n-pentane, having similar atmospheric lifetimes, exhibited similar trends and demonstrated a high correlation (RPearson = 0.81), therefore featuring similar sources of emissions (Jobson et al., 1998; Yan et al., 2017). Different emission sources are distinguished by specific VOC species. Lower P/P ratios (0.56–0.80) are typically associated with coal combustion (Li et al., 2019a; Han et al., 2023), while P/P ratios in the range of 2.2–3.8 are indicative of vehicular emissions (Wang et al., 2013; Han et al., 2023). After linear straight fitting and correction, the mean P/P ratio was determined as 1.74 ± 0.02, indicating that both vehicular emissions and coal combustion were critical factors influencing the concentration of VOCs at the ZT site.
In addition to local emissions affecting VOC pollution characteristics, regional transport has been investigated as a potential source of VOCs (Nelson and Quigley, 1983; Chang et al., 2006; Vardoulakis et al., 2011). In this study, we utilized the X/E ratio to assess the influence of transport. M, p-xylene, and ethylbenzene have been observed to share similarities in emission sources, with the former demonstrating approximately three times greater reactivity toward the OH radical compared with the latter (Chang et al., 2006; Vardoulakis et al., 2011). Therefore, lower X/E ratios typically indicate more pronounced air mass aging, signifying a greater influence from external transport. The average X/E ratio was 1.50 ± 0.01, indicating significant external transport at the sampling site.
3.2.2 PMF analysis
PMF analysis enables the quantitative assessment of VOC sources (Hui et al., 2019; Han et al., 2023). In this study, the PMF model incorporated 34 VOC species, leading to the identification of five distinct factors contributing to VOC emissions: solvent usage, vehicle exhaust, industrial sources, combustion, and biogenic sources. The source profiles of these factors as resolved by the PMF model are illustrated in Figure 5.
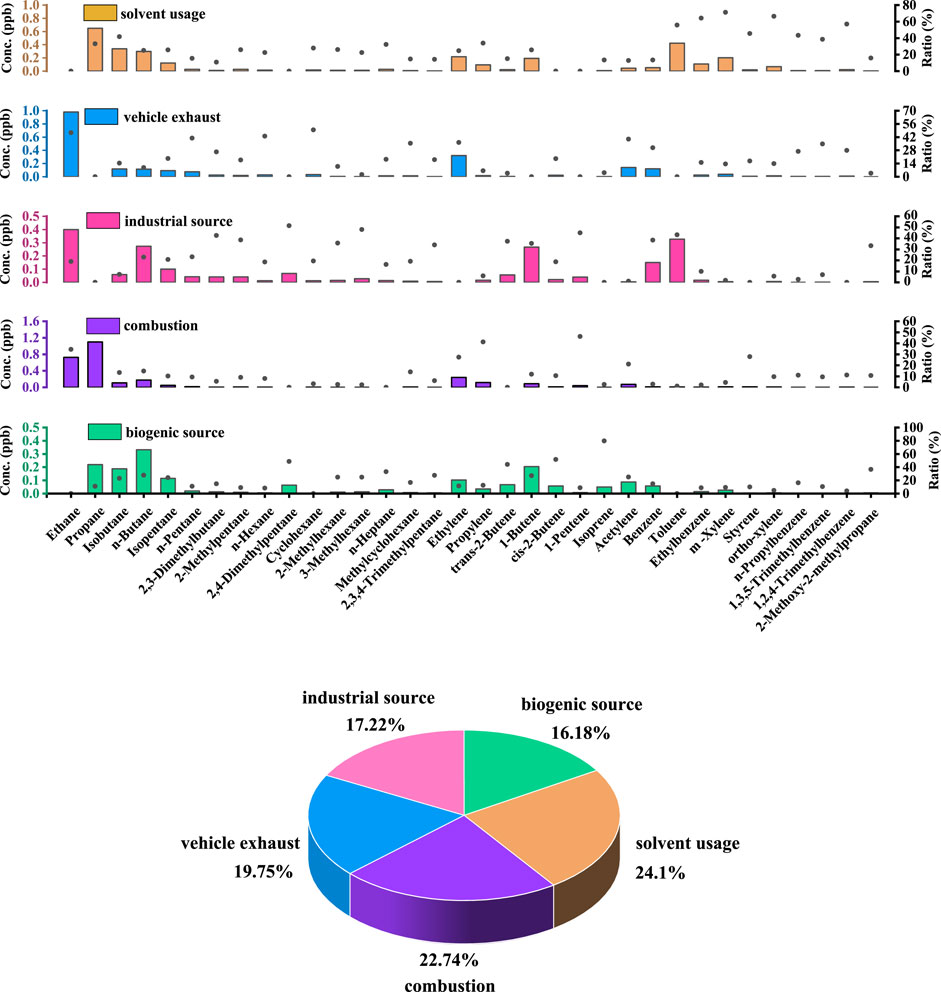
Figure 5. Source contributions to VOC concentration in the ZT site, as determined by the PMF model.
Solvent usage can be identified by the presence of certain alkanes and aromatics, such as benzene, toluene, ethylbenzene, and xylene (Wang et al., 2013; Hui et al., 2018; Song et al., 2019a). In the present study, high contributions to VOC emissions were observed from toluene (55.80%), ethylbenzene (64.11%), o-xylene (66.41%), m-/p-xylene (71.13%), and styrene (45.61%). Emission factors meeting these characteristics were identified, and paint solvent usage accounted for 24.10% of the total VOC emissions. These significant findings suggest that solvent usage was the predominant source of VOCs at the ZT site.
Vehicle exhaust emissions are characterized by high percentages of alkanes, some alkenes, and aromatics (Ling et al., 2011; An et al., 2017; Hui et al., 2018). In this study, high proportions of ethane (46.59%), n-pentane (40.96%), n-hexane (43.01%), cyclohexane (49.64%), ethylene (36.27%), acetylene (39.85%), benzene (30.66%), ethylbenzene (25.26%), and m-/p-xylene (29.79%) were observed. These compounds are commonly recognized as tracers for vehicular emissions (An et al., 2017; Hui et al., 2018). In this study, PMF analysis revealed that vehicle exhaust sources ranked as the third-largest source of VOCs, accounting for 19.75% of the VOCs at the sampling site. The consistently high results suggest that vehicle exhaust was one of the primary sources of VOCs, aligning with the abovementioned P/P ratio findings. Vehicle exhaust has been established as one of the primary contributors to local air pollution in Hangzhou (Jing et al., 2020a).
Industrial sources are characterized by high proportions of aromatics and certain proportions of alkanes, as noted in previous studies (Guo et al., 2011; Sun et al., 2016). In this study, significant contributions to VOC emissions were observed from toluene (43.11%), benzene (38.35%), 2-methylhexane (35.64%), and 3-methylhexane (47.90%). Aromatic compounds are widely utilized in industrial solvent usage and manufacturing processes (Morrow, 1990; Ling et al., 2011). Therefore, industrial sources contributed to VOC emissions at the sampling site. Industrial activities accounted for 17.22% of the VOC emissions.
Combustion factor was characterized by C2-C3 alkanes such as ethane and propane; C2-C3 alkenes such as ethene and propene; acetylene; and certain aromatics such as benzene, toluene, and ethylbenzene (Liu et al., 2008; Ling et al., 2011; Song et al., 2018). Furthermore, the proportions of propene, n-hexane, n-heptane, and toluene in previous studies were relatively small, but the impacts of compounds warrant investigation (Hui et al., 2018; Han et al., 2023). High contributions to VOC emissions were observed for ethane (34.40%), propane (55.81%), ethylene (27.37%), propylene (41.26%), and acetylene (21.12%), highlighting the combustion source. In this study, combustion accounted for 22.74% of VOCs at the sampling site, indicating a significant impact of combustion, following the solvent-related source mentioned earlier.
Biogenic sources can be identified by the presence of isoprene (Ling and Guo, 2014; Ling et al., 2019; Song et al., 2021). Isoprene significantly contributed to VOC emissions, constituting 79.68% of the total VOCs at the sampling site, acting as a tracer released from biogenic sources (Kumar et al., 2018). Emissions from biogenic sources were estimated to contribute 16.18% to the total VOCs detected.
According to the PMF analysis results from the ZT site, the primary sources of VOCs are solvent usage, combustion sources, and vehicular emissions. These findings were similar to those of a study conducted in Hangzhou in 2021 (Li et al., 2023). In terms of VOC components, the proportion of aromatics at the ZT site in Hangzhou (12.3%) exceeded those in Beijing (9.9%) and Wuhan (11.9%) (Gao et al., 2021). This suggests that solvent usage was a more significant source in the suburban areas of Hangzhou, which aligns with the actual situation of heavy solvent usage (such as adhesives, coatings, and paints) in the manufacturing industry in East China (Gao et al., 2021). The high proportion of combustion sources is attributable to local fuel combustion in Hangzhou, including natural gas and coal. Additionally, combustion processes are prevalent in the daily lives of residents and commercial settings, such as the use of gas stoves and heating equipment in households and the use of boilers for commercial purposes. As of the end of 2022, the number of motor vehicles in Hangzhou has exceeded 4 million, indicating the significant impact of vehicle exhaust on VOCs in the city. This finding aligns well with those of other studies conducted in Hangzhou (21.2%) (Jing et al., 2020b) and Nanjing (18%) (Xia et al., 2014). Therefore, controlling solvent usage, anthropogenic combustion sources, and vehicle exhaust emissions could be effective strategies for reducing VOCs in the Hangzhou region.
3.2.3 Back trajectories analysis
In addition to the direct impact of local sources, regional transport can also contribute to VOC pollution (Hui et al., 2018). To further identify the influence of long-distance transport sources, the backward trajectories during the observation period are presented in Figure 6. This figure illustrates the 24-h back trajectories of air masses originating at 500 m altitude, and five clusters were obtained through the clustering algorithm for all seasons. Overall, the trajectory direction and movement characteristics of air masses varied significantly by season, reflecting the seasonal changes in atmospheric circulation (Zhu et al., 2017). In spring, the top three transported air masses were the medium-distance air mass from the East China Sea (29.85%), the medium-distance air mass from southern Anhui Province (25.86%), and the near-distance air mass from southern Zhejiang Province (25.77%). The results indicated that the site was significantly affected by the southeast trajectory in spring. In summer, there were five clusters of trajectories observed at the site: eastern trajectories (Clusters 1 + 2), southern trajectories (Cluster 3), and southwestern trajectories (Clusters 4 + 5). The total contributions of eastern trajectories to the overall trajectory (56.98%) were significantly higher than those of the other two cluster trajectories. The eastern long-distance trajectory (Cluster 1) and the eastern short-distance trajectory (Cluster 2) accounted for 16.31% and 40.97% of VOC transportation. The southwestern long-distance trajectory (Cluster 4) and medium-distance trajectory (Cluster 5), categorized as the southwestern direction cluster, accounted for 1.08% and 24.09% of VOC transportation, respectively. The results indicated that VOC concentrations were significantly influenced by trajectories originating from the junction of eastern Zhejiang Province and Fujian Province, in addition to local emissions. In autumn, the majority of backward trajectories (52.25%) in Hangzhou originated from southeastern air masses, including those from the southern part of Zhejiang Province and mid-range air masses from the East China Sea (29.81% and 22.44%, respectively). This suggests that air masses from the southeastern direction had the greatest impact on Hangzhou during autumn. During winter, the most significant backward trajectories originated from the north of Hangzhou, accounting for 37.78%, followed by trajectories from the southeast of Hubei via Anhui, which accounted for 21.02%. In winter, the air masses affecting Hangzhou mainly originated from the north, southeast of Hubei province, and southeast of Shandong province, all originating from the northwest, with a combined contribution of 70.00%. This combination serves as the primary factor influencing atmospheric VOCs in Hangzhou during winter.
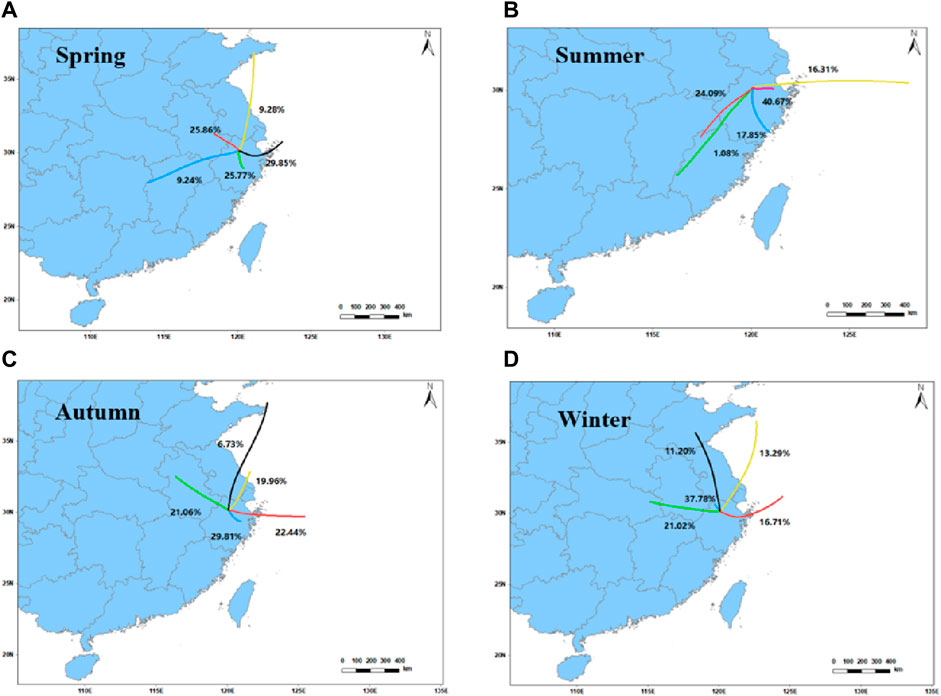
Figure 6. 24-h daily mean backward trajectory clusters for (A) spring, (B) summer, (C) autumn, and (D) winter.
3.3 Atmospheric environmental implication
3.3.1 OH reactivity
The calculated OH reactivity of trace gases was categorized into SO2, NO, NO2, O3, CO, and VOCs, as shown in Figure 7. During the observation, the total OH reactivity ranged between 11.46 and 29.70 s−1, with an average of 19.08 s−1. In this study, the assessed OH reactivity was significantly higher than those determined in Shanghai, China (13.5 s−1) (Tan et al., 2018), Beijing, China (16.4 s−1) (Tan et al., 2019), and Nashville, USA (11.3 s−1) (Kovacs et al., 2003), but comparable to those in Jinan, China (19.4 s−1) (Lyu et al., 2019), and London, United Kingdom (18.1 s−1) (Whalley et al., 2016). This study exclusively calculated the OH reactivity of the measured species, without considering the influence of unmeasured species, such as methane and monoterpenes. Previous research has shown that both unobserved primary emissions and unmeasured secondary products can contribute to unaccounted reactivity (Yang et al., 2016). Consequently, the OH reactivity value determined in this study was slightly underestimated.
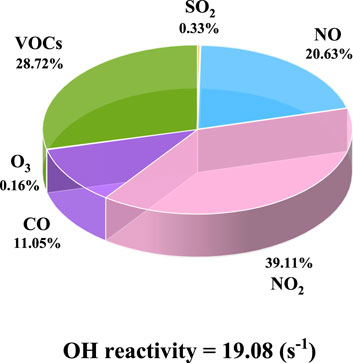
Figure 7. Contributions of different atmospheric pollutants to OH reactivity: the total OH reactivity during the observation period.
NO2 accounted for the most significant contribution to the overall OH reactivity (39.11%), followed by VOCs (28.72%), NO (20.63%), CO (11.05%), SO2 (0.33%), and O3 (0.16%), indicating the substantial impact of anthropogenic emissions in Hangzhou (Figure 7). The OH reactivity toward VOCs measured 5.48 s−1, which was lower than those observed in Heshan (18.3 s−1) and Beijing (11.2 s−1), as reported by Yang et al., in 2017. This phenomenon is attributable to the decreased presence of reactive hydrocarbons, such as aromatics and alkenes, as well as unmeasured species (e.g., 2/3-pentanone), in this study. Alkenes were the primary contributor to the total reactivity of VOCs toward OH (44.07%), followed by OVOCs (31.78%), aromatics (14.34%), alkanes (9.63%), and alkynes (0.18%). Regarding OH reactivity toward specific VOC species, the top 10 species were as follows: 1-butene, hexanal, ethanal, propionaldehyde, 1,3-butadiene, trans-2-butene, propylene, ethene, m-xylene, and toluene. Despite comprising only 29.56% of the total VOC concentrations, these species collectively accounted for 68.17% of the total reactivity of the VOCs toward OH, consistent with the findings of Yang et al. (2020).
The OH reactivity displayed notable seasonal fluctuations, as depicted in Supplementary Figure S3. Statistical analysis revealed that the average OH reactivity values followed the order of winter (24.20 s−1) > spring (19.22 s−1) > autumn (18.07 s−1) > summer (14.86 s−1). These significant variations are attributable to increased concentrations of reactive trace gases, particularly NOx and VOCs. In addition to meteorological factors, combustion during the heating season in Hangzhou produced higher concentrations of NOx and VOCs, consequently leading to higher OH reactivity. Therefore, it is imperative to consistently reinforce policies for controlling trace gases, particularly during the winter season. Regarding the seasonal variations in OH reactivity of VOCs, the highest value was observed in spring (6.20 s−1), while the lowest value was in autumn (4.30 s−1). Hover, the concentrations of key species varied significantly among the four seasons. In general, the research on specific OH reactivity reveals seasonal variations in major reactants. Therefore, OH reactivity-based control strategies should prioritize these key species.
3.3.2 Impact of VOCs on ozone formation
Atmospheric VOCs play a crucial role as O3 precursors owing to their photochemical reactivity (Kumar et al., 2018). Figure 8 displays the proportions of OFP contributions from primary VOC categories and species. In this study, the OFP measured at the ZT site was 75.54 ppb for VOCs. We show strong seasonal variability in OFP of VOCs followed the order of spring (83.05 ppb) > summer (79.42 ppb) > winter (78.44 ppb) > autumn (60.43 ppb). The O3 contribution attributed to VOCs was lower than those observed in Hangzhou, China (Jing et al., 2020a), and Delhi, India (Kumar et al., 2018). The primary contributor to the OFP was alkenes, particularly ethylene and butene, which displayed significant photochemical reactivity, accounting for 41.06% of the OFP. Additionally, OVOCs, notably acetaldehyde and propionaldehyde, exhibited pronounced photochemical reactivity, making them the second most significant contributors to OFP, consistent with the findings of Hui et al., in 2018. Aromatics accounted for 16.4% of the OFP. These findings indicate a strong correlation between the photochemical reactivity of VOCs and their role in O3 formation, consistent with previous research (Guo et al., 2017; Hui et al., 2018; Han et al., 2023). Thus, alkenes and OVOCs were key contributors to O3 formation. According to the previously discussed PMF results, emissions from vehicles and combustion, identified as primary sources at the sampling sites, should be prioritized for control measures.
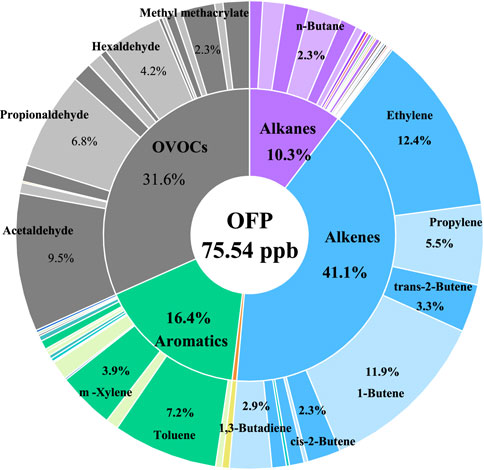
Figure 8. Contributions of VOCs to OFP at the site (the contributions >2% were marked).
3.3.3 SOA formation potential
The strong associations between VOCs and new particle formation have prompted a quantitative discussion on SOAP, with Derwent’s methodology widely endorsed as the standard reference (Derwent et al., 2010). SOAP was calculated as 2.92 μg m−3 for the VOCs measured at the sampling site. This result was higher than those obtained for Shanghai, China (1.00 μg m−3) (Han et al., 2023), and Nanjing, China (0.36 μg m−3) (Mozaffar et al., 2020). The SOAP values accounted for 8.55% of the PM2.5 concentrations (SOAP values/PM2.5 concentrations), which was lower than the result for Wangdu, China (17.84% under low-NOx conditions) (Zhang et al., 2020) and higher than the result for Nanjing, China (3.46%) (Mozaffar et al., 2020). Aromatics were identified as the primary contributors to SOA, comprising 92.73%, consistent with the findings for Jinan, China (Zhang et al., 2017). The top five VOC species at the sampling site were toluene, benzene, m-xylene, ethylbenzene, and ortho-xylene (Figure 9). Additionally, the top four SOA-contributing species across all four seasons were toluene, benzene, m-xylene and ethylbenzene. Toluene was identified as the most abundant VOC species for SOA formation, with a SOAP value of 1.37 μg m−3. Hence, to enhance SOA reduction outcomes, prioritizing the control of aromatic compound concentrations in Hangzhou is essential, alongside the development of more efficient strategies to curb industrial emissions.
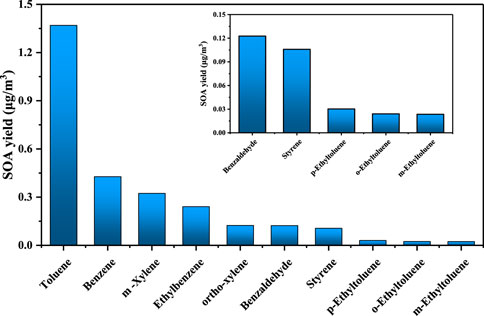
Figure 9. SOAP analysis of different VOC species at the site.
3.3.4 Variations in VOCs and PM2.5
Given the close relationship between VOCs and SOA, VOC concentrations respond sensitively to varying levels of PM2.5 pollution. Therefore, the term “VOCs-PM2.5 sensitivity” (VOCs-SPM2.5) was employed to elucidate its potential impact on the atmospheric PM2.5 abundance. Atmospheric pollution here can be categorized into different levels according to the mass concentration of PM2.5: clean level (PM2.5 < 35 μg m−3), slight pollution level (35 < PM2.5 < 75 μg m−3), medium pollution level (75 < PM2.5 < 120 μg m−3), and heavy pollution level (120 < PM2.5 < 180 μg m−3) (Han et al., 2017; Wang et al., 2022; Han et al., 2023). The changes in VOCs-SPM2.5 with PM2.5 concentration at the sampling site are depicted in Figure 10. The low values of VOCs-SPM2.5 generally remained stable with increasing PM2.5 concentration, while the high values exhibited a declining trend. At the clean level, VOCs-SPM2.5 displayed significant variability, spanning from 0.25 to 3.69. However, under the polluted level, particularly during heavy pollution level, the range of VOCs-SPM2.5 was narrower, with values oscillating between 0.20 and 0.61. Notably, VOCs-SPM2.5 values consistently decreased, while the PM2.5 to BPM2.5 ratios increased under clean and slightly polluted level. This trend suggests that VOC concentrations were highly responsive to PM2.5 levels during the above two episodes.
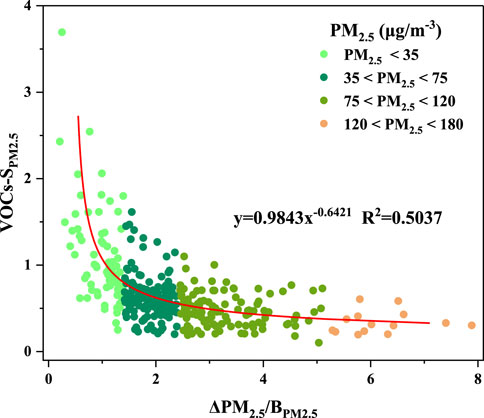
Figure 10. VOCs-S in each PM2.5 domain in the ZT site.
4 Conclusion
In this study, a field observation campaign was conducted at an urban site in Hangzhou throughout the year 2021. The results revealed an average total VOC concentration of 23.60 ppb. The average concentrations of O3 and PM2.5 were 33.67 ± 19.68 μg m−3 and 34.15 ± 21.35 μg m−3, respectively. Alkanes were the dominant VOC species, constituting 40.13% of the VOC community. During the observation period, the highest VOC concentration was observed in winter (26.49 ppb), followed by spring (23.63 ppb), summer (23.62 ppb), and autumn (20.47 ppb). This phenomenon was attributed to increased atmospheric stability and calm conditions, which limited pollutant dispersion, resulting in higher levels of VOCs during winter.
Special ratios and PMF were employed to examine local sources. The results showed that solvent usage, combustion, and vehicle exhaust were the major VOC sources, accounting for 24.10%, 22.74%, and 19.75%, respectively. According to the 24-h backward trajectory analysis in Hangzhou, the VOC concentration was significantly affected by southeastern air masses prevailing in spring and autumn, eastern air masses dominating in summer, and northwestern air masses being significant in winter.
The OH reactivity, formation potentials of O3, and SOA induced by the studied VOCs were also explored. The campaign-averaged value of total OH reactivity was 19.08 s−1, with NO2 being the dominant contributor. The OH reactivity of VOCs was 5.48 s−1, with alkenes being the dominant contributor (44.07%). The average OFP value was 75.54 ppb, and alkenes and OVOCs played pivotal roles in O3 formation. The SOAP averaged 2.92 μg m−3. Aromatics, particularly toluene, were found to be the most abundant VOC species for SOA formation, with a SOAP value of 1.37 μg m−3. VOCs-PM2.5 sensitivity analysis showed that VOCs exhibited greater sensitivity to PM2.5 on clean level than on level with heavy pollution. Overall, this study provides valuable information into the characteristics of VOCs and contributes to addressing the secondary pollution issue in Hangzhou, China.
Data availability statement
The original contributions presented in the study are included in the article/Supplementary Material, further inquiries can be directed to the corresponding authors.
Author contributions
XW: Writing–original draft, Writing–review and editing, Data curation, Investigation, Methodology, Software, Visualization. YH: Writing–original draft, Writing–review and editing, Methodology. XT: Supervision, Writing–review and editing. JS: Data curation, Investigation, Writing–review and editing. BZ: Supervision, Writing–review and editing. HF: Conceptualization, Funding acquisition, Validation, Writing–review and editing.
Funding
The author(s) declare that financial support was received for the research, authorship, and/or publication of this article. This work was supported by National Key R&D Program of China (grant No. 2022YFC3701102), National Natural Science Foundation of China (grant Nos. 22376029, 22176038, 91744205 and 21777025), and Natural Science Foundation of Shanghai City (grant No. 22ZR1404700).
Conflict of interest
The authors declare that the research was conducted in the absence of any commercial or financial relationships that could be construed as a potential conflict of interest.
Publisher’s note
All claims expressed in this article are solely those of the authors and do not necessarily represent those of their affiliated organizations, or those of the publisher, the editors and the reviewers. Any product that may be evaluated in this article, or claim that may be made by its manufacturer, is not guaranteed or endorsed by the publisher.
Supplementary material
The Supplementary Material for this article can be found online at: https://www.frontiersin.org/articles/10.3389/fenvs.2024.1418948/full#supplementary-material
References
Ait-Helal, W., Borbon, A., Sauvage, S., Gouw, J., Colomb, A., Gros, V., et al. (2014). Volatile and intermediate volatility organic compounds in suburban Paris: variability, origin and importance for SOA formation. Atmos. Chem. Phys. Dis. 14 (4), 10439–10464. doi:10.5194/acp-14-10439-2014
An, J., Zhu, B., Wang, H., Li, Y., Lin, X., and Yang, H. (2014). Characteristics and source apportionment of VOCs measured in an industrial area of Nanjing, Yangtze River Delta, China. Atmos. Environ. 97, 206–214. doi:10.1016/j.atmosenv.2014.08.021
An, J. L., Wang, J. X., Zhang, Y. X., and Zhu, B. (2017). Source apportionment of volatile organic compounds in an urban environment at the yangtze river delta, China. Arch. Environ. Con. Tox. 72 (3), 335–348. doi:10.1007/s00244-017-0371-3
Atkinson, R., and Arey, J. (2003). Atmospheric degradation of volatile organic compounds. Chem. Rev. 103, 4605–4638. doi:10.1021/cr0206420
Borbon, A., Gilman, J. B., Kuster, W. C., Grand, N., Chevaillier, S., Colomb, A., et al. (2013). Emission ratios of anthropogenic volatile organic compounds in northern mid-latitude megacities: observations versus emission inventories in Los Angeles and Paris. J. Geophys. Res. Atmos. 118 (4), 2041–2057. doi:10.1002/jgrd.50059
Brown, S. G., Eberly, S., Paatero, P., and Norris, G. A. (2015). Methods for estimating uncertainty in PMF solutions: examples with ambient air and water quality data and guidance on reporting PMF results. Sci. Total Environ. 518, 626–635. doi:10.1016/j.scitotenv.2015.01.022
Carter, W. P. L. (1994). Development of ozone reactivity scales for volatile organic compounds. Air & waste 44 (7), 881–899. doi:10.1080/1073161x.1994.10467290
Chang, C. C., Wang, J. L., Liu, S. C., and Candice, L. S. C. (2006). Assessment of vehicular and non-vehicular contributions to hydrocarbons using exclusive vehicular indicators. Atmos. Environ. 40, 6349–6361. doi:10.1016/j.atmosenv.2006.05.043
Chen, X., Hopke, P. K., and Carter, W. P. L. (2011). Secondary organic aerosol from ozonolysis of biogenic volatile organic compounds: chamber studies of particle and reactive oxygen species formation. Environ. Sci. Technol. 45, 276–282. doi:10.1021/es102166c
Dechapanya, W., Eusebi, A., Kimura, Y., and Allen, D. T. (2003). Secondary organic aerosol formation from aromatic precursors. 1. Mechanisms for individual hydrocarbons. Environ. Sci. Technol. 37, 3662–3670. doi:10.1021/es0209058
De Gouw, J. A., Middlebrook, A. M., Warneke, C., Ahmadov, R., Atlas, E. L., Bahreini, R., et al. (2011). Organic aerosol formation downwind from the Deepwater Horizon oil spill. Science 331 (6022), 1295–1299. doi:10.1126/science.1200320
Deng, C. X., Jin, Y. J., Zhang, M., Liu, X. W., and Yu, Z. M. (2018). Emission characteristics of VOCs from on-road vehicles in an urban tunnel in eastern China and predictions for 2017–2026. Aerosol Air Qual. Res. 18 (12), 3025–3034. doi:10.4209/aaqr.2018.07.0248
Derwent, R. G., Jenkin, M. E., Utembe, S. R., Shallcross, D. E., Murrells, T. P., and Passant, N. R. (2010). Secondary organic aerosol formation from a large number of reactive man-made organic compounds. Sci. Total Environ. 408 (16), 3374–3381. doi:10.1016/j.scitotenv.2010.04.013
Dumanoglu, Y., Kara, M., Altiok, H., Odabasi, M., Elbir, T., and Bayram, A. (2014). Spatial and seasonal variation and source apportionment of volatile organic compounds (VOCs) in a heavily industrialized region. Atmos. Environ. 98, 168–178. doi:10.1016/j.atmosenv.2014.08.048
Finlayson-Pitts, B. J., and Pitts, J. N. J. (2000) Chemistry of the upper and lower atmosphere. Theory, experiments, and applications. New York: Academic Press.
Fu, P., Kawamura, K., Chen, J., and Miyazaki, Y. (2014). Secondary production of organic aerosols from biogenic VOCs over Mt. Fuji, Japan. Environ. Sci. Technol. 48, 8491–8497. doi:10.1021/es500794d
Gao, M., Teng, W., Du, Z., Nie, L., An, X., Liu, W., et al. (2021). Source profiles and emission factors of VOCs from solvent-based architectural coatings and their contributions to ozone and secondary organic aerosol formation in China. Chemosphere 275, 129815. doi:10.1016/j.chemosphere.2021.129815
Gentner, D. R., Jathar, S. H., Gordon, T. D., Bahreini, R., Day, D. A., Haddad, El, et al. (2017). Review of urban secondary organic aerosol formation from gasoline and diesel motor vehicle emissions. Environ. Sci. Technol. 51 (3), 1074–1093. doi:10.1021/acs.est.6b04509
Gu, Y., Liu, B., Li, Y., Zhang, Y., Bi, X., Wu, J., et al. (2020). Multi-scale volatile organic compound (VOC) source apportionment in Tianjin, China, using a receptor model coupled with 1-hr resolution data. Environ. Pollut. 265, 115023. doi:10.1016/j.envpol.2020.115023
Gu, Y. Y., Li, Q. Q., Wei, D., Gao, L. R., Tan, L., Su, G. J., et al. (2019). Emission characteristics of 99 NMVOCs in different seasonal days and the relationship with air quality parameters in Beijing, China. Ecotox. Environ. Safe. 169, 797–806. doi:10.1016/j.ecoenv.2018.11.091
Guo, H., Cheng, H. R., Ling, Z. H., Louie, P. K. K., and Ayoko, G. A. (2011). Which emission sources are responsible for the volatile organic compounds in the atmosphere of Pearl River Delta? J. Hazard. Mater. 188 (1-3), 116–124. doi:10.1016/j.jhazmat.2011.01.081
Guo, H., Ling, Z. H., Cheng, H. R., Simpson, I. J., Lyu, X. P., Wang, X. M., et al. (2017). Tropospheric volatile organic compounds in China. Sci. Total Environ. 574, 1021–1043. doi:10.1016/j.scitotenv.2016.09.116
Guo, H., Wang, T., and Louie, P. K. (2004). Source apportionment of ambient non-methane hydrocarbons in Hong Kong: application of a principal component analysis/absolute principal component scores (PCA/APCS) receptor model. Environ. Pollut. 129 (3), 489–498. doi:10.1016/j.envpol.2003.11.006
Han, D., Gao, S., Fu, Q., Cheng, J., Chen, X., Xu, H., et al. (2018). Do volatile organic compounds (VOCs) emitted from petrochemical industries affect regional PM2.5? Atmos. Res. 209, 123–130. doi:10.1016/j.atmosres.2018.04.002
Han, D. M., Wang, Z., Cheng, J. P., Wang, Q., Chen, X. J., and Wang, H. L. (2017). Volatile organic compounds (VOCs) during non-haze and haze days in Shanghai: characterization and secondary organic aerosol (SOA) formation. Environ. Sci. Pollut. Res. 24, 18619–18629. doi:10.1007/s11356-017-9433-3
Han, L., Chen, L., Li, K., Bao, Z., Zhao, Y., Zhang, X., et al. (2019). Source apportionment of volatile organic compounds (VOCs) during ozone polluted days in Hangzhou, China. Atmosphere 10 (12), 780. doi:10.3390/atmos10120780
Han, Y., Wang, T., Li, R., Fu, H. B., Duan, Y. S., Gao, S., et al. (2023). Measurement report: volatile organic compound characteristics of the different land-use types in Shanghai: spatiotemporal variation, source apportionment and impact on secondary formations of ozone and aerosol. Atmos. Chem. Phys. 23, 2877–2900. doi:10.5194/acp-23-2877-2023
Huang, C., Wang, H. L., Li, L., Wang, Q., Lu, Q., Gouw, De, et al. (2015). VOC species and emission inventory from vehicles and their SOA formation potentials estimation in Shanghai, China. Atmos. Chem. Phys. 15 (19), 11081–11096. doi:10.5194/acp-15-11081-2015
Hui, L., Liu, X., Tan, Q., Feng, M., An, J., Qu, Y., et al. (2018). Characteristics, source apportionment and contribution of VOCs to ozone formation in Wuhan, Central China. Atmos. Environ. 192, 55–71. doi:10.1016/j.atmosenv.2018.08.042
Hui, L., Liu, X., Tan, Q., Feng, M., An, J., Qu, Y., et al. (2019). VOC characteristics, sources and contributions to SOA formation during haze events in Wuhan, Central China. Sci. Total Environ. 650, 2624–2639. doi:10.1016/j.scitotenv.2018.10.029
Jing, S. A., Gao, Y. Q., Shen, J. D., Wang, Q., Peng, Y. R., Li, Y. J., et al. (2020a). Characteristics and reactivity of ambient VOCs in urban Hangzhou, China. Environ. Sci. 41 (12), 5306–5315. doi:10.13227/j.hjkx.202004021
Jing, S. A., Ye, X. H., Gao, Y. Q., Peng, Y. R., Li, Y. J., Wang, Q., et al. (2020b). Characteristics and reactivity during a typical photochemical pollution episode. Environ. Sci. 14 (7), 3076–3084. doi:10.13227/j.hjkx.201911187
Jobson, B. T., Parrish, D. D., Goldan, P., Kuster, W., Fehsenfeld, F. C., Blake, D. R., et al. (1998). Spatial and temporal variability of nonmethane hydrocarbon mixing ratios and their relation to photochemical lifetime. J. Geophys. Res. Atmos. 103, 13557–13567. doi:10.1029/97jd01715
Kovacs, T. A., Brune, W. H., Harder, H., Martinez, M., Simpas, J. B., Frost, G. J., et al. (2003). Direct measurements of urban OH reactivity during Nashville SOS in summer 1999. J. Environ. Monit. 5 (1), 68–74. doi:10.1039/b204339d
Krug, Y., Wang, Y. H., Zhou, P. T., Yao, D., Ji, D. S., Sun, J., et al. (2020). Atmospheric reactivity and oxidation capacity during summer at a suburban site between Beijing and Tianjin. Atmos. Chem. Phys. 20, 8181–8200. doi:10.5194/acp-20-8181-2020
Kumar, A., Singh, D., Kumar, K. S., Singh, B. B., and Jain, V. K. (2018). Distribution of VOCs in urban and rural atmospheres of subtropical India: temporal variation, source attribution, ratios, OFP and risk assessment. Sci. Total Environ. 613-614, 492–501. doi:10.1016/j.scitotenv.2017.09.096
Lai, C., Chuang, K., and Chang, J. (2013). Source apportionment of volatile organic compounds at an international airport. Aerosol Air Qual. Res. 13, 689–698. doi:10.4209/aaqr.2012.05.0121
Li, B., Ho, S. S. H., Li, X., Guo, L., Feng, R., and Fang, X. (2023). Pioneering observation of atmospheric volatile organic compounds in Hangzhou in eastern China and implications for upcoming 2022 Asian Games. J. Environ. Sci. 124, 723–734. doi:10.1016/j.jes.2021.12.029
Li, M., Zhang, Q., Zheng, B., Tong, D., Lei, Y., Liu, F., et al. (2019a). Persistent growth of anthropogenic non-methane volatile organic compound (NMVOC) emissions in China during 1990-2017: drivers, speciation and ozone formation potential. Atmos. Chem. Phys. 19, 8897–8913. doi:10.5194/acp-19-8897-2019
Li, Q., Su, G., Li, C., Liu, P., Zhao, X., Zhang, C., et al. (2020a). An investigation into the role of VOCs in SOA and ozone production in Beijing, China. China. Sci. Total Environ. 720, 137536. doi:10.1016/j.scitotenv.2020.137536
Lin, H., Wang, M., Duan, Y., Fu, Q., Ji, W., Cui, H., et al. (2020b). O3 sensitivity and contributions of different NMHC sources in O3 formation at urban and suburban sites in Shanghai. Atmosphere 11 (3), 295. doi:10.3390/atmos11030295
Ling, Z. H., and Guo, H. (2014). Contribution of VOC sources to photochemical ozone formation and its control policy implication in Hong Kong. Environ. Sci. Policy. 38, 180–191. doi:10.1016/j.envsci.2013.12.004
Ling, Z. H., Guo, H., Cheng, H. R., and Yu, Y. F. (2011). Sources of ambient volatile organic compounds and their contributions to photochemical ozone formation at a site in the Pearl River Delta, southern China. Environ. Pollut. 159 (10), 2310–2319. doi:10.1016/j.envpol.2011.05.001
Ling, Z. H., He, Z. R., Wang, Z., Shao, M., and Wang, X. M. (2019). Sources of methacrolein and methyl vinyl ketone and their contributions to methylglyoxal and formaldehyde at a receptor site in Pearl River Delta. J. Environ. Sci. 79, 1–10. doi:10.1016/j.jes.2018.12.001
Liu, Y., Shao, M., Fu, L. L., Lu, S. H., Zeng, L. M., and Tang, D. G. (2008). Source profiles of volatile organic compounds (VOCs) measured in China: Part I. Atmos. Environ. 42 (25), 6247–6260. doi:10.1016/j.atmosenv.2008.01.070
Liu, Y., Song, M., Liu, X., Zhang, Y., Hui, L., Kong, L., et al. (2020). Characterization and sources of volatile organic compounds (VOCs) and their related changes during ozone pollution days in 2016 in Beijing, China. Environ. Pollut. 257, 113599. doi:10.1016/j.envpol.2019.113599
Liu, Y., Wang, H., Jing, S., Gao, Y., Peng, Y., Lou, S., et al. (2019b). Characteristics and sources of volatile organic compounds (VOCs) in Shanghai during summer: implications of regional transport. Atmos. Environ. 215, 116902. doi:10.1016/j.atmosenv.2019.116902
Liu, Y., Wang, H., Jing, S., Peng, Y., Gao, Y., Yan, R., et al. (2021). Strong regional transport of volatile organic compounds (VOCs) during wintertime in Shanghai megacity of China. Atmos. Environ. 244, 117940. doi:10.1016/j.atmosenv.2020.117940
Louie, P. K., Ho, J. W., Tsang, R. C., Blake, D. R., Lau, A. K., Yu, J. Z., et al. (2013). VOCs and OVOCs distribution and control policy implications in Pearl River Delta region, China. Atmos. Environ. 76, 125–135. doi:10.1016/j.atmosenv.2012.08.058
Lyu, X., Wang, N., Guo, H., Xue, L., Jiang, F., Zeren, Y., et al. (2019). Causes of a continuous summertime O3 pollution event in Jinan, a central city in the North China Plain. Atmos. Chem. Phys. 19 (5), 3025–3042. doi:10.5194/acp-19-3025-2019
Lyu, X. P., Chen, N., Guo, H., Zhang, W. H., Wang, N., Wang, Y., et al. (2016). Ambient volatile organic compounds and their effect on ozone production in Wuhan, Central China. Sci. Total Environ. 541, 200–209. doi:10.1016/j.scitotenv.2015.09.093
Mao, M., Rao, L. X. T., Jiang, H., He, S. Q., and Zhang, X. L. (2022). Air pollutants in metropolises of eastern coastal China. Int. J. Environ. Res. Pubilc Health 19 (22), 15332. doi:10.3390/ijerph192215332
Mo, Z., Shao, M., Lu, S., Qu, H., Zhou, M., Sun, J., et al. (2015). Process-specific emission characteristics of volatile organic compounds (VOCs) from petrochemical facilities in the Yangtze River Delta, China. China. Sci. Total Environ. 533, 422–431. doi:10.1016/j.scitotenv.2015.06.089
Monod, A., Sive, B. C., Avino, P., Chen, T., Blake, D. R., and Rowland, F. S. (2001). Monoaromatic compounds in ambient air of various cities: a focus on correlations between the xylenes and ethylbenzene. Atmos. Environ. 35, 135–149. doi:10.1016/s1352-2310(00)00274-0
Morrow, N. L. (1990). The industrial production and use of 1,3-butadiene. Environ. Health Perspect. 86, 7–8. doi:10.2307/3430925
Mozaffar, A., Zhang, Y. L., Fan, M. Y., Cao, F., and Lin, Y. C. (2020). Characteristics of summertime ambient VOCs and their contributions to O3 and SOA formation in a suburban area of Nanjing, China. Atmos. Res. 240, 104923. doi:10.1016/j.atmosres.2020.104923
Nelson, P. F., and Quigley, S. M. (1983). The m, p-xylenes: ethylbenzene ratio. A technique for estimating hydrocarbon age in ambient atmospheres. Atmos. Environ. 17 (3), 659–662. doi:10.1016/0004-6981(83)90141-5
Paatero, P., and Tapper, U. (1994). Positive matrix factorization: a non-negative factor model with optimal utilization of error estimates of data values. Environmetrics 5 (2), 111–126. doi:10.1002/env.3170050203
Pankow, J. F., Seinfeld, J. H., Asher, W. E., and Erdakos, G. B. (2001). Modeling the formation of secondary organic aerosol. 1. Application of theoretical principles to measurements obtained in the α-pinene/, β-pinene/, sabinene/, δ3-carene/, and cyclohexene/ozone systems. Environ. Sci. Technol. 35, 1164–1172. doi:10.1021/es001321d
Prinn, R. G. (2003). The cleansing capacity of the atmosphere. Annu. Rev. Environ. Resour. 28 (1), 29–57. doi:10.1146/annurev.energy.28.011503.163425
Qin, J., Wang, X., Yang, Y., Qin, Y., Shi, S., Xu, P., et al. (2021). Source apportionment of VOCs in a typical medium-sized city in North China Plain and implications on control policy. J. Environ. Sci. 107, 26–37. doi:10.1016/j.jes.2020.10.005
Seinfeld, J. H., Erdakos, G. B., Asher, W. E., and Pankow, J. F. (2001). Modeling the formation of secondary organic aerosol (SOA). 2. The predicted effects of relative humidity on aerosol formation in the α-pinene/, β-pinene/, sabinene/, Δ3-carene/, and cyclohexene/ozone systems. Environ. Sci. Technol. 35, 1806–1817. doi:10.1021/es001765+
Shao, P., An, J. L., Xin, J. Y., Wu, F. K., Wang, J. X., Ji, D. S., et al. (2016). Source apportionment of VOCs and the contribution to photochemical ozone formation during summer in the typical industrial area in the Yangtze River Delta, China. Atmos. Res. s176-s177, 64–74. doi:10.1016/j.atmosres.2016.02.015
Shi, J., Deng, H., Bai, Z., Kong, S., Wang, X., Hao, J., et al. (2015). Emission and profile characteristic of volatile organic compounds emitted from coke production, iron smelt, heating station and power plant in Liaoning Province, China. Sci. Total Environ. 515, 101–108. doi:10.1016/j.scitotenv.2015.02.034
Song, M., Liu, X., Zhang, Y., Shao, M., Lu, K., Tan, Q., et al. (2019). Sources and abatement mechanisms of VOCs in southern China. Atmos. Environ. 201, 28–40. doi:10.1016/j.atmosenv.2018.12.019
Song, M., Tan, Q., Feng, M., Qu, Y., Liu, X., An, J., et al. (2018). Source apportionment and secondary transformation of atmospheric nonmethane hydrocarbons in Chengdu, Southwest China. J. Geophys. Res. Atmos. 123 (17), 9741–9763. doi:10.1029/2018jd028479
Song, M. D., Li, X., Yang, S. D., Yu, X. N., Zhou, S. X., Yang, Y. M., et al. (2021). Spatiotemporal variation, sources, and secondary transformation potential of volatile organic compounds in Xi’an China. Atmos. Chem. Phys. 21, 4939–4958. doi:10.5194/acp-21-4939-2021
Song, Y., Shao, M., Liu, Y., Lu, S., Kuster, W., Goldan, P., et al. (2007). Source apportionment of ambient volatile organic compounds in Beijing. Environ. Sci. Technol. 41 (12), 4348–4353. doi:10.1021/es0625982
Sun, J., Wu, F. K., Hu, B., Tang, G. Q., Zhang, J. K., and Wang, Y. S. (2016). VOC characteristics, emissions and contributions to SOA formation during hazy episodes. Atmos. Environ. 141, 560–570. doi:10.1016/j.atmosenv.2016.06.060
Tan, Z., Lu, K., Jiang, M., Su, R., Dong, H., Zeng, L., et al. (2018). Exploring ozone pollution in Chengdu, southwestern China: a case study from radical chemistry to O3-VOC-NOx sensitivity. Sci. Total Environ. 636, 775–786. doi:10.1016/j.scitotenv.2018.04.286
Tan, Z., Lu, K., Jiang, M., Su, R., Wang, H., Lou, S., et al. (2019). Daytime atmospheric oxidation capacity in four Chinese megacities during the photochemically polluted season: a case study based on box model simulation. Atmos. Chem. Phys. 19 (6), 3493–3513. doi:10.5194/acp-19-3493-2019
Tong, L., Liao, X., Chen, J., Xiao, H., Xu, L., Zhang, F., et al. (2013). Pollution characteristics of ambient volatile organic compounds (VOCs) in the southeast coastal cities of China. Environ. Sci. Pollut. Res. 20 (4), 2603–2615. doi:10.1007/s11356-012-1187-3
Uttamang, P., Campbell, P. C., Aneja, V. P., and Hanna, A. F. (2020). A multi-scale model analysis of ozone formation in the Bangkok Metropolitan Region, Thailand. Atmos. Environ. 229, 117433. doi:10.1016/j.atmosenv.2020.117433
Vardoulakis, S., Solazzo, E., and Lumbreras, J. (2011). Intra-urban and street scale variability of BTEX, NO2 and O3 in Birmingham, UK: implications for exposure assessment. Atmos. Environ. 45 (29), 5069–5078. doi:10.1016/j.atmosenv.2011.06.038
Wang, M., Shao, M., Lu, S. H., Yang, Y. D., and Chen, W. T. (2013). Evidence of coal combustion contribution to ambient VOCs during winter in Beijing. Chin. Chem. Lett. 24 (9), 829–832. doi:10.1016/j.cclet.2013.05.029
Wang, Q., Zuo, X., Xia, M., Xie, H., He, F., Shen, S., et al. (2019). Field investigation of temporal variation of volatile organic compounds at a landfill in Hangzhou, China. Environ. Sci. Pollut. Res. 26, 18162–18180. doi:10.1007/s11356-019-04917-5
Wang, S., Zhao, Y., Han, Y., Li, R., Fu, H., Gao, S., et al. (2022). Spatiotemporal variation, source and secondary transformation potential of volatile organic compounds (VOCs) during the winter days in Shanghai, China. Atmos. Environ. 286, 119203. doi:10.1016/j.atmosenv.2022.119203
Whalley, L. K., Stone, D., Bandy, B., Dunmore, R., Hamilton, J. F., Hopkins, J., et al. (2016). Atmospheric OH reactivity in central London: observations, model predictions and estimates of in situ ozone production. Atmos. Chem. Phys. 16 (4), 2109–2122. doi:10.5194/acp-16-2109-2016
Xiong, Y., and Du, K. (2020). Source-resolved attribution of ground-level ozone formation potential from VOC emissions in Metropolitan Vancouver, BC. Sci. Total Environ. 721, 137698. doi:10.1016/j.scitotenv.2020.137698
Xu, Z., Huang, X., Nie, W., Chi, X., Xu, Z., Zheng, L., et al. (2017). Influence of synoptic condition and holiday effects on VOCs and ozone production in the Yangtze River Delta region, China. Atmos. Environ. 168, 112–124. doi:10.1016/j.atmosenv.2017.08.035
Yadav, R., Sahu, L., Tripathi, N., Pal, D., Beig, G., and Jaaffrey, S. (2019). Investigation of emission characteristics of NMVOCs over urban site of western India. Environ. Pollut. 252, 245–255. doi:10.1016/j.envpol.2019.05.089
Yamada, H. (2013). Contribution of evaporative emissions from gasoline vehicles toward total VOC emissions in Japan. Sci. Total Environ. 449, 143–149. doi:10.1016/j.scitotenv.2013.01.045
Yan, Y. L., Peng, L., Li, R. M., Li, Y. H., Li, L. J., and Bai, H. L. (2017). Concentration, ozone formation potential and source analysis of volatile organic compounds (VOCs) in a thermal power station centralized area: a study in Shuozhou, China. Environ. Pollut. 223, 295–304. doi:10.1016/j.envpol.2017.01.026
Yang, M., Li, F., Huang, C., Tong, L., Dai, X., and Xiao, H. (2023). VOC characteristics and their source apportionment in a coastal industrial area in the Yangtze River Delta, China. J. Environ. Sci. 127, 483–494. doi:10.1016/j.jes.2022.05.041
Yang, Y., Shao, M., Keßel, S., Li, Y., Lu, K., Lu, S., et al. (2017). How the OH reactivity affects the ozone production efficiency: case studies in Beijing and Heshan, China. Atmos. Chem. Phys. 17, 7127–7142. doi:10.5194/acp-17-7127-2017
Yang, Y., Shao, M., Wang, X., Nölscher, A. C., Kessel, S., Guenther, A., et al. (2016). Towards a quantitative understanding of total OH reactivity: a review. Atmos. Environ. 134, 147–161. doi:10.1016/j.atmosenv.2016.03.010
Yang, Y., Wang, Y. H., Zhou, P. T., Yao, D., Ji, D. S., Sun, J., et al. (2020). Atmospheric reactivity and oxidation capacity during summer at a suburban site between Beijing and Tianjin. Atmos. Chem. Phys. 20, 8181–8200. doi:10.5194/acp-20-8181-2020
Yao, Z., Wu, B., Shen, X., Cao, X., Jiang, X., Ye, Y., et al. (2015). On-road emission characteristics of VOCs from rural vehicles and their ozone formation potential in Beijing, China. Atmos. Environ. 105, 91–96. doi:10.1016/j.atmosenv.2015.01.054
Ying, F., Bao, Z., Yang, C. J., Yao, L., Zhu, L. Z., and Jiao, L. (2012). Analysis of volatile organic compounds (VOCs) and their atmospheric chemical reactivity in ambient air around urban traffic roads in Hangzhou. Acta Sci. Circumstantiae 32 (12), 3056–3064.
Yu, S., Wang, S., Xu, R., Zhang, D., Zhang, M., Su, F., et al. (2022). Measurement report: intra-and interannual variability and source apportionment of volatile organic compounds during 2018-2020 in Zhengzhou, central China. Atmos. Chem. Phys. 22 (22), 14859–14878. doi:10.5194/acp-22-14859-2022
Zhang, F., Shang, X. N., Chen, H., Xie, G. Z., Fu, Y., Wu, D., et al. (2020b). Significant impact of coal combustion on VOCs emissions in winter in a North China rural site. Sci. Total Environ. 720, 137617. doi:10.1016/j.scitotenv.2020.137617
Zhang, G., Wang, N., Jiang, X., and Zhao, Y. (2017). Characterization of ambient volatile organic compounds (VOCs) in the area adjacent to a petroleum refinery in Jinan, China. Aerosol Air Qual. Res. 17 (4), 944–950. doi:10.4209/aaqr.2016.07.0303
Zhang, G., Xu, H., Qi, B., Du, R., Gui, K., Wang, H., et al. (2018). Characterization of atmospheric trace gases and particulate matter in Hangzhou, China. Atmos. Chem. Phys. 18 (3), 1705–1728. doi:10.5194/acp-18-1705-2018
Zhang, Y., Wang, X., Zhang, Z., Lu, S., Shao, M., Lee, F. S. C., et al. (2013). Species profiles and normalized reactivity of volatile organic compounds from gasoline evaporation in China. Atmos. Environ. 79, 110–118. doi:10.1016/j.atmosenv.2013.06.029
Zhu, L., Payne, V. H., Walker, T. W., Worden, J. R., Jiang, Z., Kulawik, S. S., et al. (2017). PAN in the eastern Pacific free troposphere: a satellite view of the sources, seasonality, interannual variability, and timeline for trend detection. J. Geophys. Res. Atmos. 122 (6), 3614–3629. doi:10.1002/2016jd025868
Keywords: volatile organic compounds, source appointment, ozone formation potential, SOA formations potential, atmospheric pollution
Citation: Wang X, Han Y, Tu X, Shen J, Zhang B and Fu H (2024) Distribution of volatile organic compounds (VOCs) in the urban atmosphere of Hangzhou, East China: Temporal variation, source attribution, and impact on the secondary formations of ozone and aerosol. Front. Environ. Sci. 12:1418948. doi: 10.3389/fenvs.2024.1418948
Received: 18 April 2024; Accepted: 06 May 2024;
Published: 30 May 2024.
Edited by:
Dianming Wu, East China Normal University, ChinaReviewed by:
Changlun Tong, Zhejiang University, ChinaZirui Liu, Chinese Academy of Sciences (CAS), China
Copyright © 2024 Wang, Han, Tu, Shen, Zhang and Fu. This is an open-access article distributed under the terms of the Creative Commons Attribution License (CC BY). The use, distribution or reproduction in other forums is permitted, provided the original author(s) and the copyright owner(s) are credited and that the original publication in this journal is cited, in accordance with accepted academic practice. No use, distribution or reproduction is permitted which does not comply with these terms.
*Correspondence: Hongbo Fu, fuhb@fudan.edu.cn; Xiang Tu, tuxiang527@163.com
†These authors have contributed equally to this work and share first authorship