Assessment of Climate Change and Atmospheric CO2 Impact on Winter Wheat in the Pacific Northwest Using a Multimodel Ensemble
 Mukhtar Ahmed
 Claudio O. Stöckle
 Roger Nelson
 Stewart Higgins
- 1Biological Systems Engineering, Washington State University, Pullman, WA, United States
- 2Department of Agronomy, Pir Mehr Ali Shah Arid Agriculture University, Rawalpindi, Pakistan
Simulations of crop yields under climate change are subject to uncertainties whose quantification is important for effective use of projected results for adaptation and mitigation strategies. In the US Pacific Northwest (PNW), studies based on single crop models and weather projections downscaled from a few general circulation models (GCM) have indicated mostly beneficial effects of climate change on winter wheat production for most of the twenty-first century. In this study we evaluated the uncertainty in the projection of winter wheat yields at seven sites in the PNW using five crop growth simulation models (CropSyst, APSIM, DSSAT, STICS, and EPIC) and daily weather data downscaled from 14 GCMs for 2 representative concentration pathways (RCP) of atmospheric CO2 (RCP4.5 and 8.5). All crop models were calibrated for high, medium, and low precipitation dryland sites and one irrigated site using 1979–2010 as the baseline period. All five models were run from years 2000 to 2100 to evaluate the effect of future conditions (precipitation, temperature and atmospheric CO2) on winter wheat grain yield. Simulations of future climatic conditions and impacts were organized into three 31-year periods centered around the years 2030, 2050, and 2070. All models predicted a decrease of the growing season length and crop transpiration, and increase in transpiration-use efficiency, biomass production, and yields, but with substantial variation that increased from the 2030s to 2070s. Most of the uncertainty (up to 85%) associated with predictions of yield was due to variation among the crop models. Maximum uncertainty due to GCMs was 15% which was less than the maximum uncertainty associated with the interaction between the crop model effect and GCM effect (25%). Large uncertainty associated with the interaction between crop models and GCMs indicated that the effect of GCM on yield varied among the five models. The mean of the ensemble of all crop models and GCMs provided a robust indication of positive effects of future environmental conditions on winter wheat yield during this century at all sites studied, with greater beneficial effect under water stressed conditions than under well-watered conditions, and under RCP8.5 than RCP4.5.
Introduction
Climate change is a major concern for crop productivity. The chief elements of climate change include rising temperature, modified frequency, and severity of extreme events, and elevated atmospheric concentration of CO2 (Rosenzweig and Tubiello, 2007). Concentrations of CO2 are now significantly higher than in earlier years and they have been increasing continuously and rapidly (Siegenthaler et al., 2005). Agriculture is one of the sensitive sectors to climate variability and change (Slingo et al., 2005; Osborne et al., 2013). Climate change has affected crop growth, development and yield over the past few decades across the globe directly or indirectly (Nicholls, 1997; Lobell and Asner, 2003; Challinor and Wheeler, 2008a; Teixeira et al., 2013). Direct effects are due to increased CO2 fertilization which leads to higher photosynthetic rate and water use efficiency (Challinor and Wheeler, 2008b). Indirect effects include crop responses to variability in temperature and precipitation. Higher seasonal temperature increases the risk of water stress, limits photosynthesis, and reduces light interception by accelerating crop phenological development (Tubiello et al., 2007).
Wheat is the third largest crop globally, which has shown particular sensitivity to climate change (Porter and Semenov, 2005), yet increased wheat yield has also been reported for some regions of the world because of increased growth rates and a shift of the grain filling period to a wetter part of the season (Xiao et al., 2010).
Mechanistic process-based crop models are common tools for assessing the impact of climate change on crop productivity, incorporating physiological responses of crop growth and development to environmental and management variables. Different crop models have been used to study climate change impact on crop production across the globe but with mixed results (Lobell and Burke, 2010). The assessment of climate change impacts on agriculture often has been conducted using a combination of weather downloaded from general circulation models (GCM) and crop responses evaluated with cropping systems models (CSM), often one crop model and a few GCM projections. This approach has been applied to the US Pacific Northwest (PNW) with projections suggesting mostly beneficial effects of climate change on wheat production, especially winter varieties (Thomson et al., 2002; Stöckle et al., 2010). However, recent studies (e.g., Asseng et al., 2013; Martre et al., 2015; Ruane et al., 2016) have shown large variation in both GCM and CSM projections, which can introduce significant uncertainty in assessments of climate change impact on agriculture.
Based on results of a 27-wheat model comparison study, Asseng et al. (2013) reported that crop models were able to produce acceptable yield estimates compared to observations from single-year experiments for four diverse sites when properly calibrated. However, when changes in precipitation combined with increases in temperature and atmospheric CO2 concentration were imposed on the same sites, a large variation in yield projections was obtained. Thus, Asseng et al. (2013) recommended the use of crop model ensembles, particularly when limited information about the crops and cropping systems involved is available, suggesting that at least five models should be used for reliable assessment of yield impacts for temperature increases up to 3°C and 540 ppm of CO2, with fewer models needed for lower temperature increases and vice versa. Similar results have been reported for maize models (Bassu et al., 2014) and rice models (Li et al., 2015), where model ensembles appeared to perform better than individual models when compared with observations. Martre et al. (2015) concluded that there was no additional advantage of a model ensemble including more than 10 models. Bassu et al. (2014), in a study involving 23 maize models, concluded that a single model may not be able to simulate well absolute yields while an ensemble of 8–10 models is more likely to perform better if a small amount of information is available for calibration. Li et al. (2015) evaluated 13 rice models against experimental information and found that individual models were not consistent in reproducing observed yields, but an ensemble of five models properly calibrated was able to approximate measured yields within the uncertainty of well-controlled experiments.
Studies such as those of Asseng et al. (2013), Bassu et al. (2014), and Li et al. (2015) that include a large number of crop models for a given crop species are possible by the direct involvement of modelers and user groups. The customary use of large crop model ensembles as a standard practice in climate change assessments would be time consuming and costly (at least for now), and will require significant cooperation. In the meantime, securing adequate information on some key crop characteristics such as crop phenology, canopy cover [e.g., maximum leaf area index (LAI)], and rooting depth along with the use of a few models, well-documented and tested under a large range of conditions around the world, appears to be a reasonable approach.
With the interest of corroborating or disputing previous findings regarding climate change impacts on wheat production in the PNW, USA, in this study we evaluated the uncertainties in yield projections related to crop-climate models using 5 CSMs and 14 GCMs. Our primary focus was on the usefulness of applying a multimodel ensemble in the examination of future climate change in the IPNW. Toward this end, we excluded consideration of rotational effects and other effects related to farm management decisions.
Materials and Methods
The impacts on winter wheat productivity at six dryland and one irrigated sites were evaluated using five well-established CSM (CropSyst, APSIM-Wheat, DSSAT CERES Wheat, EPIC, and STIC) and downscaled weather projections from 14 GCMs and 2 RCPs (RCP4.5 and 8.5).
Crop Models
CropSyst
CropSyst is a multi-year, multi-crop, daily time-step cropping system model developed as an analytical tool to study the effect of climate, soil, and management on the productivity and environmental impact of cropping systems (Stöckle et al., 2003). The model can simulate crop development, growth and yield in response to weather, atmospheric CO2 concentration, and management (crop rotations, fertilization, irrigation, tillage), and soil processes such as soil water dynamics, nitrogen budgets, soil erosion by water, and salinity. Details on the use, parametrization and execution of CropSyst are given on the website (http://modeling.bsyse.wsu.edu/CS_Suite_4/CropSyst/index.html).
APSIM
The APSIM (Agricultural Production Systems Simulator) is a modeling framework developed by the Agricultural Production Systems Research Unit (APSRU) in Australia (Keating et al., 2003). APSIM was developed to simulate biophysical processes in farming systems, in particular where there is interest in the economic and ecological outcomes of management practice in the face of climatic risk (Keating et al., 2003). It was constructed on a modular modeling framework based on biophysical processes in farming systems with many plant, soil and management modules for a diverse range of crops, pastures and trees, soil processes including water balance, nitrogen and phosphorus transformations, soil pH, erosion, and a full range of management controls. Details of the model are included on the APSIM web site (https://www.apsim.info/Documentation.aspx). The APSIM-Wheat model version 6.1 (Wang et al., 2002; Keating et al., 2003) was used in this study.
DSSAT_CERES_Wheat
The CERES wheat model included in the DSSAT (Decision Support System for Agrotechnology Transfer) family of models is a complex model used to integrate knowledge about crops, soil, climate, and management for making appropriate decisions under a wide range of climatic conditions. It can be used to design optimum crop management practices, precision agriculture, and pest management. Similarly, it can be used to quantify responses to climate change and variability impacts on crop yield and to study long term sustainability, environmental pollution and genomics (Hoogenboom et al., 2012; http://dssat.net/).
EPIC
The EPIC (Environmental Policy Integrated Climate) model is a field scale soil and crop model originally designed to quantify the effects of erosion on soil productivity (Williams et al., 1984). It is a complete agroecosystem model that can simulate crop growth under different rotations while simulating detailed soil management operations. EPIC version 0810 was used in this study. Additional information on the EPIC model can be found at http://epicapex.tamu.edu/epic/.
STICS
The STICS crop growth model was developed by INRA, France (Brisson et al., 2003). The model can simulate carbon, water and nitrogen dynamics as well as a number of different environmental and agricultural variables in response to weather, soil, crop, and management practices. STICS is a generic model that can simulate various kinds of crops and environmental conditions. Options for plant parameters associated with detailed ecophysiological characteristics are adjusted to define a specific crop. Additional parameters are used to simulate physical and biological processes occurring in the soil-crop system and define soils, crop management and climate. In this work, we used STICS version v8.4. The detailed description of all parameters used in the model is available in the document freely downloadable with the model from http://www6.paca.inra.fr/stics_eng/.
A general description of the approaches used by each of the five crop models is presented in Table 1.
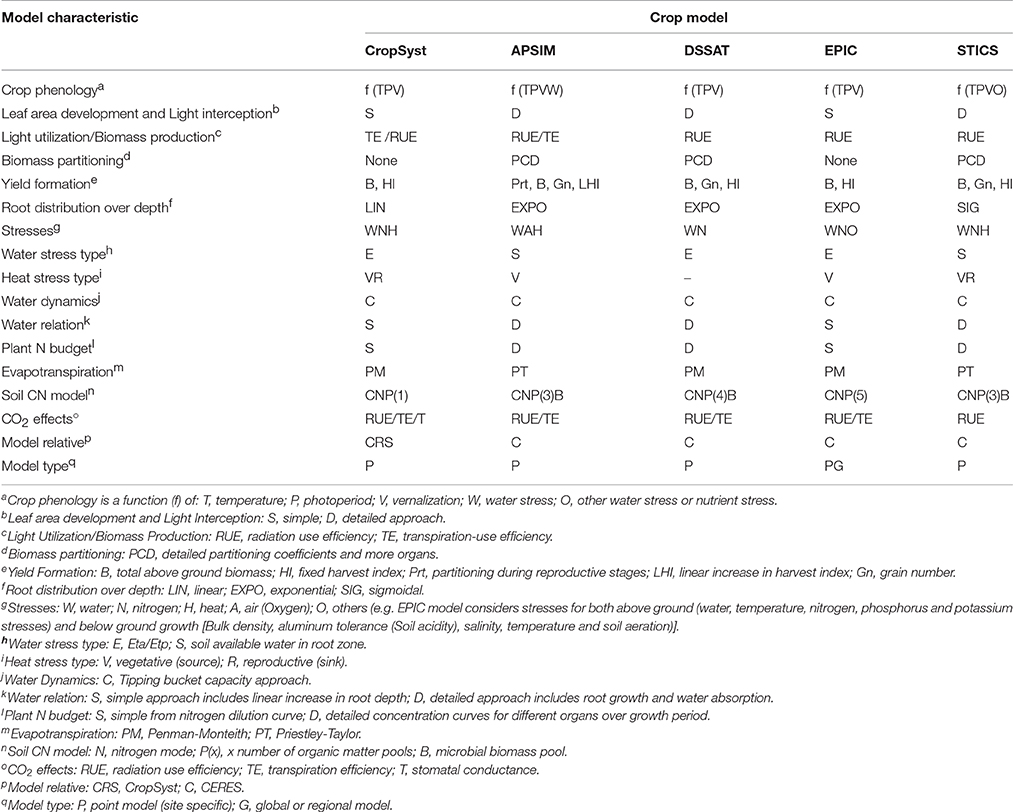
Table 1. Modeling approaches of five models used for a study of climate change effects on crop performance in the Pacific Northwest.
General Circulation Models (GCMs)
Many GCMs have been evaluated for use in climate change studies (Randall et al., 2007; Flato et al., 2013). The fourteen GCMs listed in Table 2 were used in this study due to their suitability for use in North America (Rupp et al., 2013; Sheffield et al., 2013). The methodology used for generation of the weather data for these GCMs is found in Abatzoglou (2013) and Abatzoglou and Brown (2012). Specific datasets are available at http://thredds.northwestknowledge.net:8080/thredds/reacch_climate_MET_catalog.html.
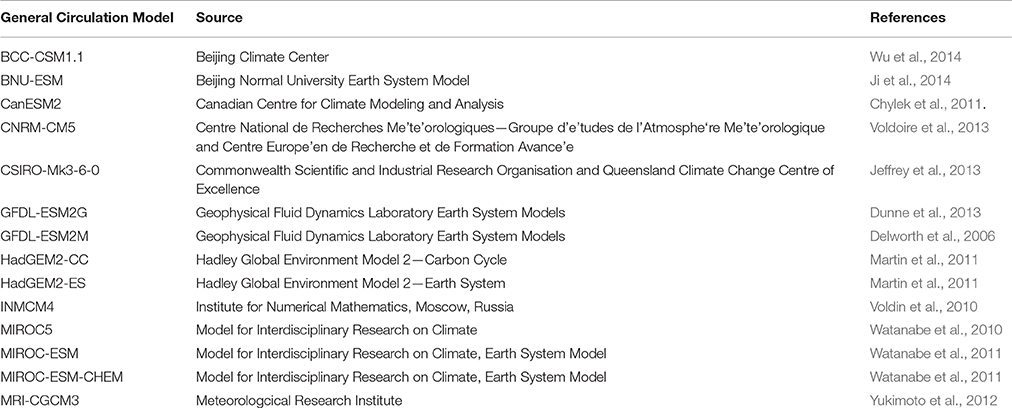
Table 2. General circulation models used to study dryland crop response to future climate change in the Inland Pacific Northwest.
Emission Scenarios
Representative concentration pathways (RCP) are climate change research scenarios that contain trajectories of emissions, GHG concentrations and land-use patterns based on alternative responses of future socio-economic, technological, energy use, and emissions patterns (Van Vuuren et al., 2011). Four RCPs have been developed that provide distinct trajectories of radiative forcing and GHG concentrations (Moss et al., 2010). For this research, we used RCP4.5 which stabilizes at a radiative forcing of 4.5 W m−2 and 650 ppm CO2-equiv in the year 2100, and RCP8.5 which develops a radiative forcing of 8.5 W m−2 and 1,370 ppm CO2-equiv at 2100 (Moss et al., 2010). RCP4.5 is characterized by policies that, among other things, reduce energy use, reduce fossil fuel use, increase renewable and nuclear energy, employ CO2 capture and storage, expand forests, and reduce beef consumption by a world population of 8.7 billion in 2100 (Thomson et al., 2011). RCP8.5 is characterized by minimal climate change policies, global population of 12 billion in 2100, slow income growth, high energy demand mostly from fossil fuels and declines in forested area (Riahi et al., 2011).
Study Sites
Seven diverse agro-ecological sites were selected for CSM and GCM models ensemble study. These sites are in the main winter wheat production region in the IPNW. Average annual precipitation ranges from 125 to 700 mm on moving from west to east (Schillinger et al., 2010). Basic features of the study sites are summarized in Table 3.
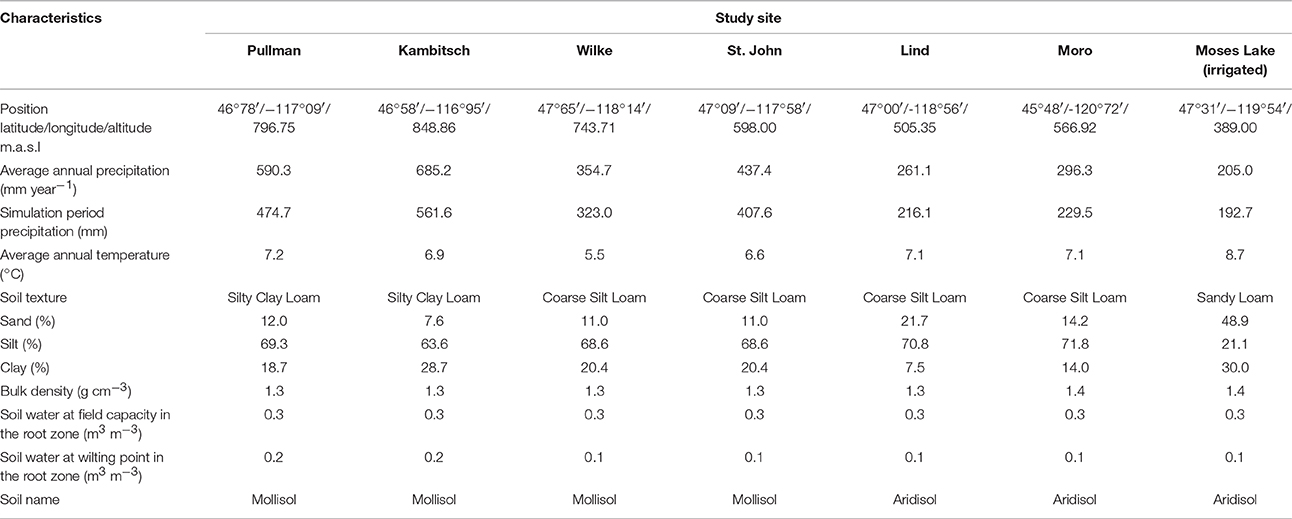
Table 3. Characteristics of seven study sites used for a study of climate change effects on crop performance in the Pacific Northwest.
Model Simulation Targets
To establish reasonable historical baselines for all five CSMs, four study sites were selected: Pullman (high precipitation), Wilke (intermediate precipitation), Lind (low precipitation), and Moses Lake (irrigated). Baseline simulations (1979–2010) were conducted for all models to meet targets for crop phenology (emergence, anthesis, and maturity dates), maximum LAI, biomass at maturity, and yield derived from literature and extension reports focused on winter wheat in the study region (Papendick, 1996; Schillinger et al., 2006; Schillinger, personal communication; WSU Extension variety trials). The model parameters used were as suggested for winter wheat by the respective models, with adjustments to phenology, and minor adjustments to leaf area development and biomass production parameters within the range provided by each model so as to conform to the targets, with the same set of parameters (except for phenology) used in all sites.
Although, winter wheat in the region is rotated with other cereals and legumes, to avoid adding complexity to the comparison of models and to focus on the simulated responses of wheat to climate variation and atmospheric CO2, continuous winter wheat was simulated. The profile soil water content was reset to a set low value at the end of the summer each year, so that cumulative effects were not a factor. To focus our concern only on CSM and GCM, we removed the confounding effects of crop rotation and carryover. Table 4 shows targets and baseline results after parameter adjustments.
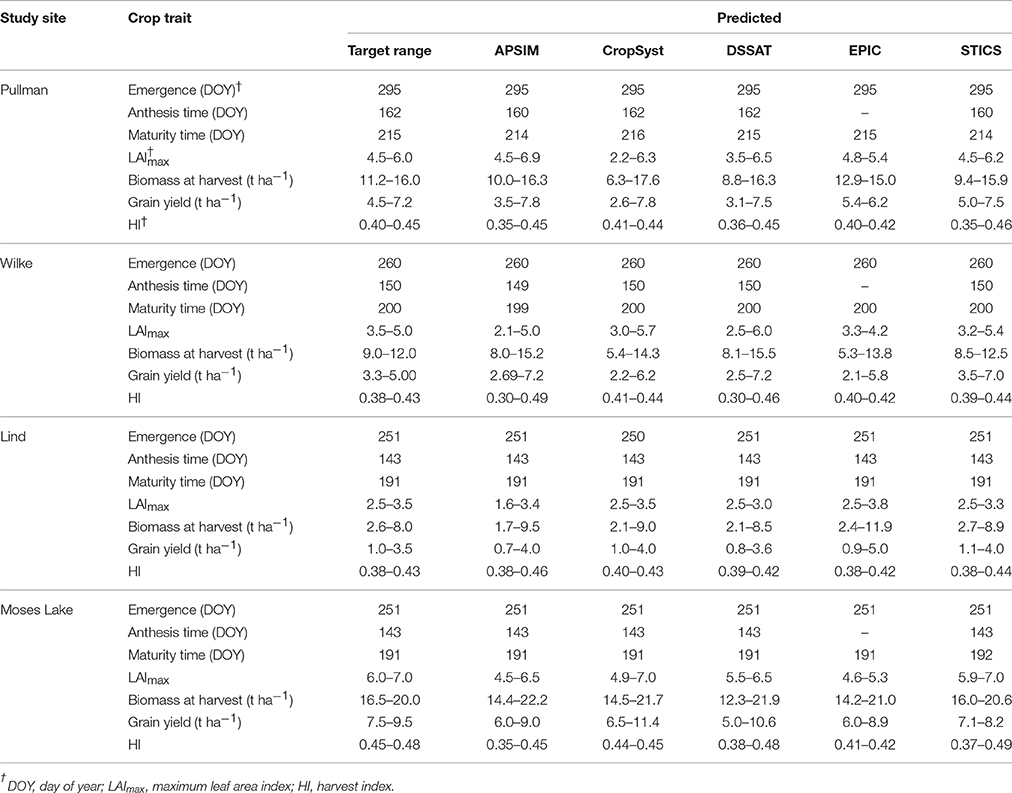
Table 4. Target results for a series of five cropping system models used in a study of climate change effects on crop performance at several locations in the Pacific Northwest.
Simulations and Analysis
In total, 140 simulations were generated for each study site (14 GCMs × 5 crop models × 2 RCPs), with outputs separated into three time periods (2030s, 2015–2045; 2050s, 2035–2065; and 2070s, 2055–2085). PROC ANOVA in SAS, Version 9.2 (SAS Institute Inc., 2010), was used to obtain the sums of squares for targeted effects, and an Uncertainty Index (UI) was calculated by dividing the treatment sums of squares by the total sums of squares (Holzkämper et al., 2015). The resulting UI is a measure of the proportion of the total variation explained by the effect of interest.
The cumulative probability distributions (CPDs) for yield changes (see Section Results) were generated using a multi-step process. First the average yield was calculated for the historic period within location for each CSM. Then the average yield over all GCMs was calculated within location, CSM and year. The percentage change between this average projected yield (within location, CSM, and year) and its respective baseline yield was calculated, [percent change = ((future yield/baseline yield)−1) × 100]. This last calculation resulted in 41 percentage yield changes, one for each year within a given time period, location and CSM. The mean and standard deviation of these 41 values were used to generate the normal density distribution for the values and the CPD by applying the NORMDIST function in Microsoft Excel. The maximum value on the normal density distribution thus represents the percentage yield change with the highest probability of occurrence and corresponds to the inflection point on the CPD. Rather than present both the normal and cumulative curves, we present only the cumulative curve with its inflection point identified.
Results and Discussion
Baseline Period (1979–2010)
Three sites, Kambitsch, Moro and St. John, were not used for parameter adjustments/calibration. The relative performance of the five crop models using historical weather at these three sites is shown in Table 5. The results showed that the simulated LAI fluctuated within a relatively narrow range, while biomass and grain yields showed more variation among the models, except at the driest site, Moro, where better agreement existed. Nevertheless, most models were still within a narrow range of biomass and yield values at Kambitsch and St. John.
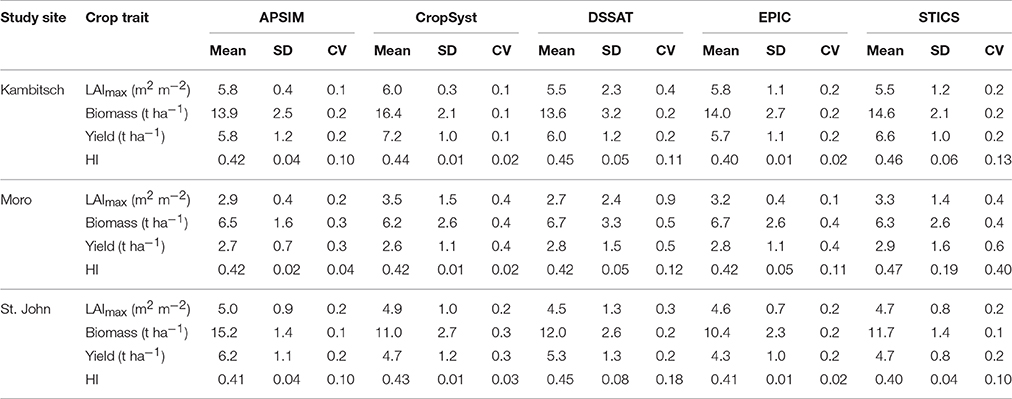
Table 5. Performance of five crop models under historical weather conditions (1979–2010) in simulating mean maximum leaf area index (LAImax), above-ground biomass, grain yield and harvest index (HI) with standard deviation and coefficient of variation at three sites not used for model calibration in the Pacific Northwest.
Probability Distribution of Crop-Climate Model Projections
The CPD of future winter wheat yield changes projected by the 14 GCMs for the five CSMs and three sites (Pullman, Lind, and Moses Lake) are presented in Figures 1–3, where the thicker line is the mean of the CSMs ensemble. All CSMs projected a positive impact of climate change and atmospheric CO2 concentration on future winter wheat yields, but with significant variation. This variation was larger for RCP8.5 (more warming and higher atmospheric CO2) than RCP4.5, and increased significantly with increasing time periods. The most probable yield change for the CSMs in Pullman (Figure 1), identified by the inflection point on the curves, ranged from 19 to 26% (RCP4.5) and from 17 to 28% (RCP8.5) for the 2030s, with the range increasing to 28 to 39% (RCP4.5) and 27 to 49% (RCP8.5) for the 2070s. The range of yield increases spanned by the CPD curves tended to increase from the 2030s to the 2070s, indicating increasing spread among GCM projections later in the century. The most probable yield change of the ensemble of all CSMs and CGMs indicated a 23% (2030s), 30% (2050s), and 41% (2070s) increase in projected vs. baseline yields for RCP8.5 (Figure 1). A similar pattern of increasing yield gains was obtained for RCP4.5.
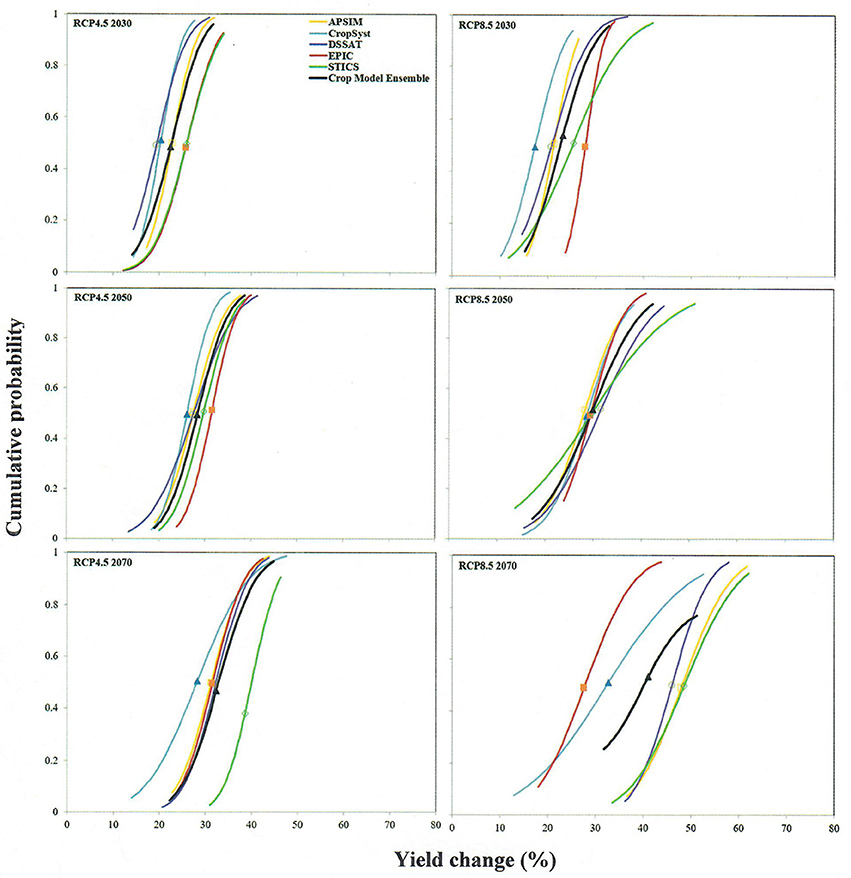
Figure 1. Cumulative probability distribution for simulated winter wheat yield changes during three 31 year time periods, centered on 2030, 2050, and 2070, relative to the baseline period (1979–2010) under two representative concentration pathways (RCP4.5 and 8.5) and five crop models with ensembles of crop models at high rainfall site Pullman. Symbols on curves are at the curve's inflection point and represent the most probable yield change.
Figure 2 shows the CPDs for Lind, the site with the lowest precipitation. Inflection points ranged from 25 to 34% yield increase for RCP4.5 in the 2030s, and from 21 to 27% for RCP8.5 in the 2030s. By the 2070s, the range had increased to 45–62% under RCP4.5 and 61–66% under RCP8.5. The tighter clustering of models under RCP8.5 late in the century in Lind was probably due to the dominant effect of water stress, and the high percent yield increase was likely due to the direct effect of CO2 having a higher relative impact under more limited water supply. The crop-climate model ensemble at Lind projected increased yield under both RCPs but the effect was greater under RCP8.5 than RCP4.5 (Figure 2). The percentage yield increase under RCP8.5 was substantial, jumping from 23% in the 2030s to 64% in the 2070s (Figure 2).
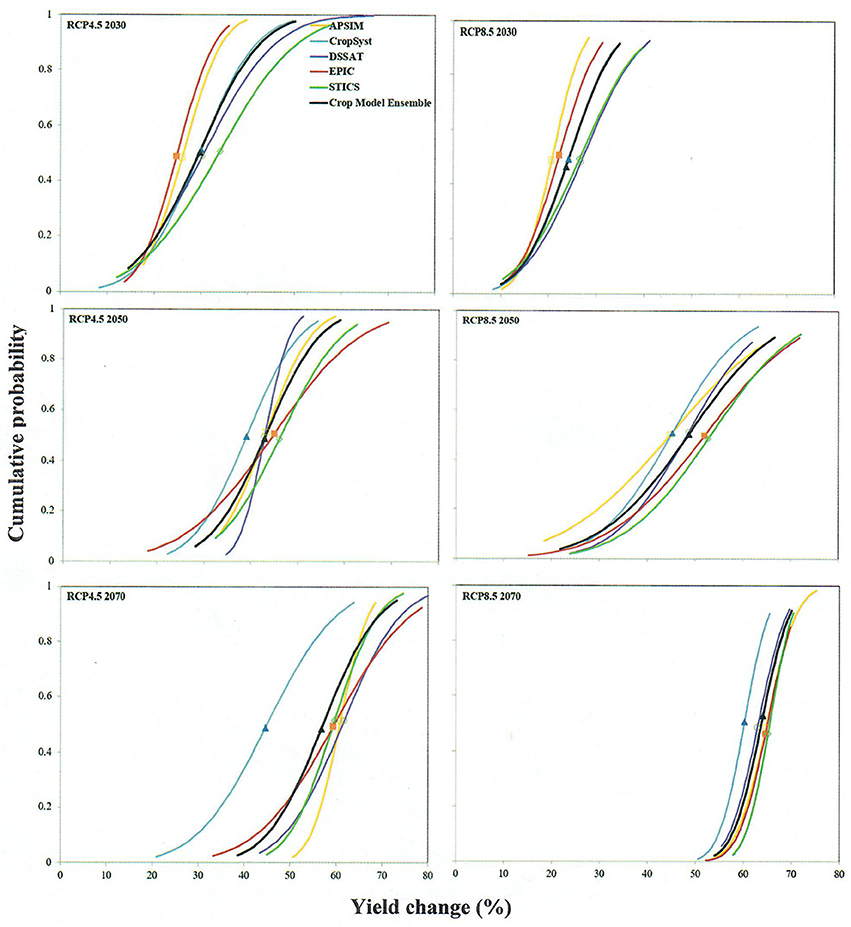
Figure 2. Cumulative probability distribution for simulated winter wheat yield changes during three 31-year time periods, centered on 2030, 2050, and 2070, relative to the baseline period (1979–2010) under two representative concentration pathways (RCP4.5 and 8.5) and five crop models with ensembles of crop models at low rainfall site Lind. Symbols on curves are at the curve's inflection point and represent the most probable yield change.
At the wettest site, Moses Lake, the ensemble of all crop model and GCMs projected a wheat yield increase for both RCP4.5 and RCP8.5 (Figure 3) but the increase was not as large as at the rainfed sites. The ensemble yield change under RCP8.5 went from 15% in the 2030s to 24% in the 2070s. This smaller increase was due to a lower direct effect of CO2 when water was not a limiting factor. The effect of the different CO2 responses among models is perhaps evident in these responses under irrigation. Free-Air CO2 Enrichment (FACE) experiments have demonstrated well-watered wheat yield increases of 7–9% when CO2 was elevated from 350 to 550 ppm (Tubiello et al., 1999), and ~10% when CO2 was elevated from 365 to 645 ppm (Manderscheid and Weigel, 2007). Photosynthetic response to CO2 follows a typical saturation response, and biomass gain of wheat shows a similar response saturating (plateau response) at about 25% gain (compared to 370 ppm) when CO2 exceeds 1,000 ppm (Reuveni and Bugbee, 1997). For the conditions during the 2070s and RCP8.5, atmospheric CO2 concentration fluctuated from 570 to 801 ppm, while baseline conditions were set at 360 ppm. Thus, it is unlikely that yield gains greater than ~15% should be obtained with these CO2 concentrations for the 2070s, particularly when the effect of warming is considered. However, the 50% CPD of most models and the ensemble exceeded this figure, implying that not only differences in temperature responses but also in CO2 responses contribute to the spread of projections among CSMs.
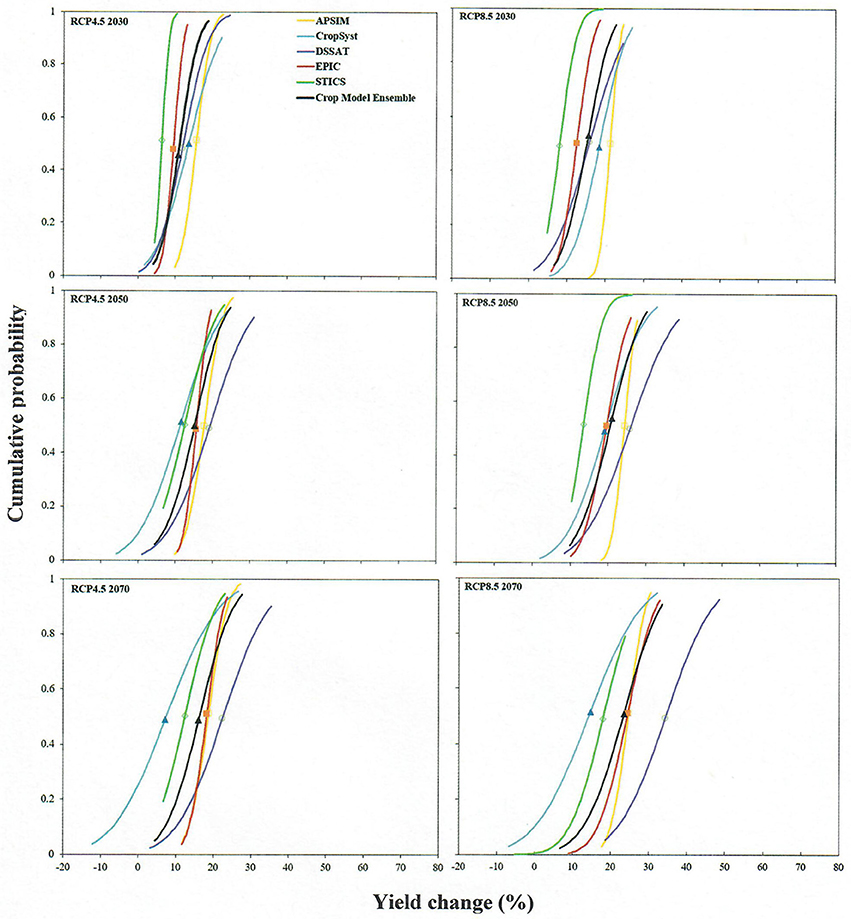
Figure 3. Cumulative probability distribution for simulated winter wheat yield changes during three 31-year time periods, centered on 2030, 2050, and 2070, relative to the baseline period (1979–2010) under two representative concentration pathways (RCP4.5 and 8.5) and five crop models with ensembles of crop models at an irrigated site, Moses Lake, WA. Symbols on curves are at the curve's inflection point and represent the most probable yield change.
In all crop-climate model ensembles, the most probable yield increase was shifted rightward with time, indicating a high probability of yield increase. Although results for only the wettest (Moses Lake, Pullman), and the driest (Lind) sites are presented here, all seven sites evaluated showed similar responses, modulated mainly by the extent of water limitations. Overall, the behavior of all CSMs was similar in terms of direction of change in process components leading to yield estimations but with variations in magnitude, as shown in Table 6 for the 2070s period and RCP8.5 compared to baseline values. The growing season was shorter during the 2070s at all sites as predicted by all CSMs, with the percentage reduction being largest at Lind and smallest under irrigation at Moses Lake. These differences reflect the different magnitude of projected temperature changes in these contrasting environments. All CSMs predicted increased biomass at all sites late in the century under RCP8.5. This increase was due in part to the CO2 fertilization effect and to the warmer winter temperatures. Not surprisingly, with more biomass, all CSMs predicted higher LAI at all locations (Table 6). As expected under higher atmospheric CO2 concentrations (Ainsworth and Rogers, 2007) and warmer temperatures (shorter growing season), all CSMs projected a decrease in transpiration, fluctuating from 0.4 to 11%. On the other hand, consistent with increased biomass and decreased transpiration, transpiration use efficiency increased at all locations and with all CSMs (Table 6), being greatest in the driest location, Lind, and least in the wettest.

Table 6. Percent changes with respect to baseline (1979–2009) values of selected process components contributing to changes in winter wheat yield during the 2070 period (2055–2085) and representative concentration pathway 8.5.
Partitioning of Projection Uncertainties
Substantial uncertainty/variation was found among GCM and CSM projections. We present here results of the uncertainty analysis for yield only (Table 7). The UI revealed that the uncertainty attributable to CSMs was substantially larger than that from GCMs at all study sites during all three time periods. This is in agreement with previous finding by Asseng et al. (2013). The maximum UI for CSM was over 0.85 during the 2030s at Pullman whereas the maximum UI for GCM was 0.15 during the 2070s at Moses Lake. At a majority of locations, the UI associated with GCM tended to increase with time, but the UI for CSM tended to decrease with time at most locations (Table 7). Although the largest proportion of uncertainty was associated with CSM, the relatively large UI associated with the interaction of GCM and CSM indicated that the amount of uncertainty associated with GCM depended on which of the five models was under consideration.
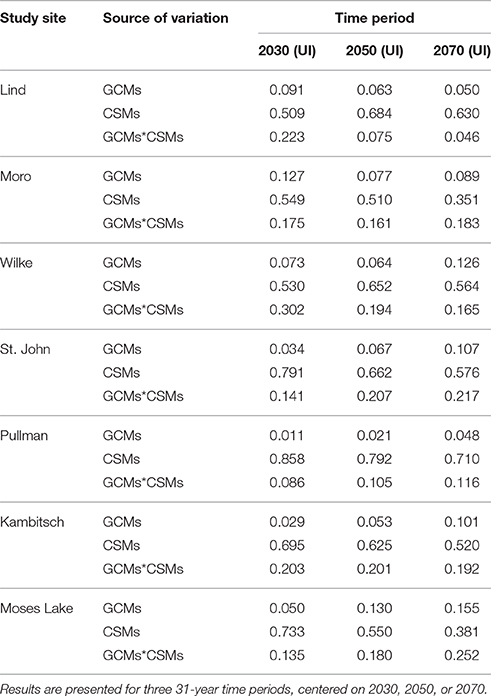
Table 7. Uncertainty Index (UI) for projected winter wheat yield at seven sites in the Pacific Northwest modeled under 14 general circulation models (GCMs) averaged over 2 representative concentrations pathways in each of 5 cropping system models (CSMs).
Model (CSM and GCM) Ensemble Projection of Winter Wheat Biomass Production and Yield
An ensemble of all GCMs and CSMs showed a consistent trend of beneficial effects of climate change on biomass production and wheat yields in all sites studied under the two RCP scenarios (Figure 4). The model ensemble depicted increasing trends for biomass and grain yields under RCP4.5 at the seven study sites, but the increasing trend was more prominent at low rainfall sites (Lind and Moro) than at the wetter sites, Pullman, Kambitsch, and Moses Lake. A somewhat steeper increasing trend was observed under RCP8.5 for all sites. Over the twenty-first century, the benefit to yield of climate change appeared to be positively correlated to water stress. The driest site, Lind, saw a benefit of over 3 t ha−1 under RCP 8.5 whereas the least water-stressed sites, Pullman, Kambitsch and Moses Lake, experienced yield increases of at most about 2 t ha−1 (Figure 4). Also, there was a trend for biomass and yields to plateau toward the end of the century, more so for wetter sites.
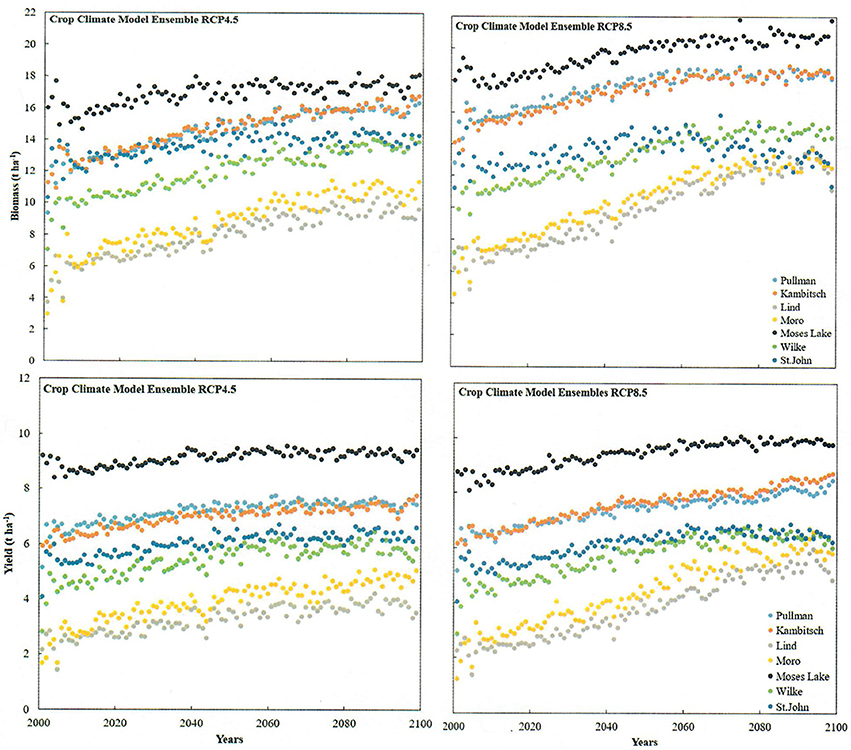
Figure 4. Winter wheat biomass (t ha−1) and grain yield (t ha−1) trends by the crop climate model ensemble approach using two representative concentration pathways (RCP4.5 and 8.5) at seven diverse agroecological sites in the Inland Pacific Northwest.
There is certainly large uncertainty (Table 7) associated with each trajectory in Figure 4, implying many possible pathways toward future crop performance in the region. But the overall beneficial trend resulting from the combination of climate change and elevated CO2 appears strong and in agreement with previous studies conducted in the region (Thomson et al., 2002; Stöckle et al., 2010). Overall, positive effects have been also projected for the northern Great Plains of the US (Izaurralde et al., 2003). Similar findings indicating increased suitability for wheat production under climate change of high northern Europe latitudes have been reported (Eckersten et al., 2001; Richter and Semenov, 2005; Balkovič et al., 2014). The winter wheat producing region of China is also expected to move northward (Sun et al., 2015).
Many additional factors will affect crop production in the future. Weeds, insect pests and diseases (Rosenzweig and Tubiello, 1996; Scott et al., 2014; Junk et al., 2016) will all influence crops, and these influences will all be impacted one way or another by climate change. Additionally, management decisions made by farmers in response to climate change will certainly affect future crop production.
Conclusions
In this study we assessed climate change impacts on winter wheat crop yield in the PNW using five CSMs and 14 GCMs. It was found that the uncertainty due to the variability of GCM and CSM projections can be substantial with the uncertainty attributed to CSMs being larger than that attributed to GCMs. Nevertheless, despite substantial variations, all CSMs consistently projected decrease in growing season length and transpiration and increase in transpiration-use efficiency, biomass, and yields. Overall, the mean of the ensemble of all CSMs and GCMs provided a robust indication of positive effects of future environmental conditions on winter wheat yield during this century at all sites studied, with greater beneficial effect under water stressed conditions than under well-watered, less stressed conditions.
Author Contributions
MA conduct simulations, data reduction, draft manuscript; CS project conception and supervision, manuscript revision, RN programming, project realization; SH advise analyses, manuscript revision.
Conflict of Interest Statement
The authors declare that the research was conducted in the absence of any commercial or financial relationships that could be construed as a potential conflict of interest.
Acknowledgments
This research was supported by the United States Department of Agriculture's National Institute of Food and Agriculture, Award #2011-68002-30191, Regional Approaches to Climate Change for Pacific Northwest Agriculture.
References
Abatzoglou, J. T. (2013). Development of gridded surface meteorological data for ecological applications and modelling. Int. J. Climatol. 33, 121–131. doi: 10.1002/joc.3413
Abatzoglou, J. T., and Brown, T. J. (2012). A comparison of statistical downscaling methods suited for wildfire applications. Int. J. Climatol. 32, 772–780. doi: 10.1002/joc.2312
Ainsworth, E. A., and Rogers, A. (2007). The response of photosynthesis and stomatal conductance to rising [CO2]: mechanisms and environmental interactions. Plant Cell Environ. 30, 258–270. doi: 10.1111/j.1365-3040.2007.01641.x
Asseng, S., Ewert, F., Rosenzweig, C., Jones, J. W., Hatfield, J. L., Ruane, A. C., et al. (2013). Uncertainty in simulating wheat yields under climate change. Nat. Clim. Change 3, 827–832. doi: 10.1038/nclimate1916
Balkovič, J., van der Velde, M., Skalský, R., Xiong, W., Folberth, C., Khabarov, N., et al. (2014). Global wheat production potentials and management flexibility under the representative concentration pathways. Global Planet. Change 122, 107–121. doi: 10.1016/j.gloplacha.2014.08.010
Bassu, S., Brisson, N., Durand, J.-L., Boote, K., Lizaso, J., Jones, J. W., et al. (2014). How do various maize crop models vary in their responses to climate change factors? Global Change Biol. 20, 2301–2320. doi: 10.1111/gcb.12520
Brisson, N., Gary, C., Justes, E., Roche, R., Mary, B., Ripoche, D., et al. (2003). An overview of the crop model stics. Eur. J. Agron. 18, 309–332. doi: 10.1016/S1161-0301(02)00110-7
Challinor, A. J., and Wheeler, T. R. (2008a). Crop yield reduction in the tropics under climate change: processes and uncertainties. Agric. Forest Meteorol. 148, 343–356. doi: 10.1016/j.agrformet.2007.09.015
Challinor, A. J., and Wheeler, T. R. (2008b). Use of a crop model ensemble to quantify CO2 stimulation of water-stressed and well-watered crops. Agric. Forest Meteorol. 148, 1062–1077. doi: 10.1016/j.agrformet.2008.02.006
Chylek, P., Li, J., Dibey, M. K., Wang, M., and Lesins, G. (2011). Observed and model simulated 20th century arctic temperature variability: Canadian Earth System Model Can ESM2. Atmos. Chem. Phys. Discuss. 11, 22893–22907. doi: 10.5194/acpd-11-22893-2011
Delworth, T. L., Broccoli, A. J., Rosati, A., Stouffer, R. J., Balaji, V., Beesley, J. A., et al. (2006). GFDL's CM2 global coupled climate models. Part I: formulation and simulation characteristics. J. Clim. 19, 643–674. doi: 10.1175/JCLI3629.1
Dunne, J. P., John, J. G., Shevliakova, E., Stouffer, R. J., Krasting, J. P., Malyshev, S. L., et al. (2013). GFDL's ESM2 global coupled climate-carbon earth system models. Part II: carbon system formulation and baseline simulation characteristics. J. Clim. 26, 2247–2267. doi: 10.1175/JCLI-D-12-00150.1
Eckersten, H., Blombäck, K., Kätterer, T., and Nyman, P. (2001). Modelling CN water and heat dynamics in winter wheat under climate change in southern Sweden. Agric. Ecosyst. Environ. 86, 221–235. doi: 10.1016/S0167-8809(00)00284-X
Flato, G. J., Marotzke, B., Abiodun, P., Braconnot, S. C., Chou, W., Collins, P., et al. (2013). “Evaluation of climate models,” in Climate Change 2013: The Physical Science Basis. Contribution of Working Group I to the Fifth Assessment Report of the Intergovernmental Panel on Climate Change, eds T. F. Stocker, D. Qin, G. K. Plattner, M. M. B. Tignor, S.K. Allen, J. Boschung et al. (Cambridge; New York, NY: Cambridge University Press).
Holzkämper, A., Calanca, P., Honti, M., and Fuhrer, J. (2015). Projecting climate change impacts on grain maize based on three different crop model approaches. Agric. Forest Meteorol. 214–215, 219–230. doi: 10.1016/j.agrformet.2015.08.263
Hoogenboom, G., Jones, J. W., Wilkens, P. W., Porter, C. H., Boote, K. J., Hunt, L. A., et al. (2012). Decision Support System for Agrotechnology Transfer (DSSAT) Version 4.5. University of Hawaii, Honolulu.
Izaurralde, R. C., Rosenberg, J. J., Brown, R. A., and Thomson, A. M. (2003). Integrated assessment of Hadley Center (HadCM2) climate-change impacts on agricultural productivity and irrigation water supply in the conterminous United States Part II. Regional agricultural production in 2030 and 2095. Agric. Forest Meteorol. 117, 97–122. doi: 10.1016/S0168-1923(03)00024-8
Jeffrey, S. L., Rotstayn, M., Collier, S., Dravitzki, C., Hamalainen, C., Moeseneder, K., et al. (2013). Australia's CMIP5 submission using the SCIRO-Mk3.6 model. Aust. Meteorol. Oceanogr. J. 63, 1–13. doi: 10.22499/2.6301.001
Ji, D. L., Wang, J., Feng, Q., Wu, H., Chang, Q., Zhang, J., et al. (2014). Description and basic evaluation of Beijing Normal University Earth System Model (BNU-ESM) version 1. Geosci. Model Dev. 7, 2039–2064. doi: 10.5194/gmd-7-2039-2014
Junk, J., Kouadio, L., Delfosse, P., and El Jarroudi, M. (2016). Effects of regional climate change on brown rust disease in winter wheat. Clim. Change 135:439–451. doi: 10.1007/s10584-015-1587-8
Keating, B. A., Carberry, P. S., Hammer, G. L., Probert, M. E., Robertson, M. J., Holzworth, D., et al. (2003). An overview of APSIM, a model designed for farming systems simulation. Eur. J. Agron. 18, 267–288. doi: 10.1016/S1161-0301(02)00108-9
Li, T., Hasegawa, T., Yin, X., Zhu, Y., Boote, K., Adam, M., et al. (2015). Uncertainties in predicting rice yield by current crop models under a wide range of climatic conditions. Glob. Change Biol. 21, 1328–1341. doi: 10.1111/gcb.12758
Lobell, D. B., and Asner, G. P. (2003). Climate and management contributions to recent trends in U.S. Agric. Yields Sci. 299, 1032. doi: 10.1126/science.1077838
Lobell, D. B., and Burke, M. B. (2010). On the use of statistical models to predict crop yield responses to climate change. Agric. Forest Meteorol. 150, 1443–1452. doi: 10.1016/j.agrformet.2010.07.008
Manderscheid, R., and Weigel, H. J. (2007). Drought stress effects on wheat are mitigated by atmospheric CO2 enrichment. Agron. Sustain. Dev. 27, 79–87. doi: 10.1051/agro:2006035
Martin, G. M., Bellouin, N., Collins, W. J., Culverwell, I. D., Halloran, P. R., Hardiman, S. C., et al. (2011). The HadGEM2 family of Met Office Unified Model climate configurations. Geosci. Model Dev. 4, 723–757. doi: 10.5194/gmd-4-723-2011
Martre, P., Wallach, D., Asseng, S., Ewert, F., Jones, J. W., Rötter, R. P., et al. (2015). Multimodel ensembles of wheat growth: many models are better than one. Glob. Change Biol. 21, 911–925. doi: 10.1111/gcb.12768
Moss, R. H., Edmonds, J. A., Hibbard, K. A., Manning, M. R., Rose, S. K., van Vuuren, D. P., et al. (2010). The next generation of scenarios for climate change research and assessment. Nature 463, 747–756. doi: 10.1038/nature08823
Nicholls, N. (1997). Increased Australian wheat yield due to recent climate trends. Nature 387, 484–485. doi: 10.1038/387484a0
Osborne, T., Rose, G., and Wheeler, T. (2013). Variation in the global-scale impacts of climate change on crop productivity due to climate model uncertainty and adaptation. Agric. Forest Meteorol. 170, 183–194. doi: 10.1016/j.agrformet.2012.07.006
Papendick, R. I. (1996). Farming systems and conservation needs in the Northwest Wheat Region. Am. J. Alternative Agric. 11, 52–57. doi: 10.1017/S0889189300006767
Porter, J. R., and Semenov, M. A. (2005). Crop responses to climatic variation. Philos. Trans. R. Soc. B 360, 2021–2035. doi: 10.1098/rstb.2005.1752
Randall, D. A., Wood, R. A., Bony, S., Colman, R., Fichefet, T., Fyfe, J., et al. (2007). “Cilmate models and their evaluation,” in Climate Change 2007: The Physical Science Basis. Contribution of Working Group I to the Fourth Assessment Report of the Intergovernmental Panel on Climate Change, eds S. Solomon, D. Qin, M. Manning, Z. Chen, M. Marquis, K. B. Averyt, et al. (Cambridge; New York, NY: Cambridge University Press).
Reuveni, J., and Bugbee, A. (1997). Very high CO2 reduces photosynthesis, dark respiration, and yield in wheat. Ann. Bot. Lond. 80, 539–546. doi: 10.1006/anbo.1997.0489
Riahi, K., Rao, S., Krey, V., Cho, C., Chirkov, V., Fischer, G., et al. (2011). RCP8.5 – A scenario of comparatively high greenhouse gas emissions. Clim. Change 109, 33–57. doi: 10.1007/s10584-011-0149-y
Richter, G. M., and Semenov, M. A. (2005). Modelling impacts of climate change on wheat yields in England and Wales: assessing drought risks. Agric. Syst. 84, 77–97. doi: 10.1016/j.agsy.2004.06.011
Rosenzweig, C., and Tubiello, F. (2007). Adaptation and mitigation strategies in agriculture: an analysis of potential synergies. Mitig. Adapt. Strat. Glob. Change 12, 855–873. doi: 10.1007/s11027-007-9103-8
Rosenzweig, C., and Tubiello, F. N. (1996). Effects of changes in minimum and maximum temperature on wheat yields in the central USA simulation study. Agric. Forest Meteorol. 80, 215–230. doi: 10.1016/0168-1923(95)02299-6
Ruane, A. C., Hudson, N. I., Asseng, S., Camarrano, D., Ewert, F., Martre, P., et al. (2016). Multi-wheat-model ensemble responses to interannual climate variablility. Environ. Modell. Softw. 81, 86–101. doi: 10.1016/j.envsoft.2016.03.008
Rupp, D. E., Abatzoglou, J. T., Hegewisch, K. C., and Mote, P. W. (2013). Evaluation of CMIP5 20th century climate simulations for the Pacific Northwest USA. J. Geophys. Res. Atmos. 118, 10884–10906. doi: 10.1002/jgrd.50843
Schillinger, W. F., Papendick, R. I., Guy, S. O., Rasmussen, P. E., and Van Kessel, C. (2006). “Chapter 11: Dryland cropping in the Western United States,” in Dryland Agriculture, 2nd Edn., Agronomy Monograph No. 23, eds G. A. Petersen, P. W. Unger, and A. Payne (Madison, WI: ASA/CSSA/SSSA), 365–393.
Schillinger, W. F., Papendick, R. I., and McCool, D. K. (2010). “Soil and water challenges for Pacific Northwest agriculture,” in Soil and Water Conservation Advances in the United States, eds T. M. Zobeck and W. F. Schillinger (Madison, WI: SSSA), 47–79.
Scott, J. K., B. L., Webber, H., Murphy, N., Ota, K. J., and Driticos, and, B., Loechel (2014). AdaptNRM Weeds and Climate Change: Supporting Weed Management Adaptation. Available at: www.AdaptNRM.org
Sheffield, J., Barrett, A. P., Colle, B., Fernando, D. N., Fu, R., Geil, K. L., et al. (2013). North American climate in CMIP5 experiments. Part I: evaluation of historical simulations of continental and regional climatology. J. Clim. 26, 9209–9245. doi: 10.1175/JCLI-D-12-00592.1
Siegenthaler, U., Stocker, T. F., Monnin, E., Lüthi, D., Schwander, J., Stauffer, B., et al. (2005). Stable carbon cycle–climate relationship during the late pleistocene. Science 310, 1313–1317. doi: 10.1126/science.1120130
Slingo, J. M., Challinor, A. J., Hoskins, B. J., and Wheeler, T. R. (2005). Introduction: food crops in a changing climate. Philos. Trans. R. Soc. B 360, 1983–1989. doi: 10.1098/rstb.2005.1755
Stöckle, C. O., Donatelli, M., and Nelson, R. (2003). CropSyst, a cropping systems simulation model. Eur. J. Agron. 18, 289–307. doi: 10.1016/S1161-0301(02)00109-0
Stöckle, C. O., Nelson, R. L., Higgins, S., Brunner, J., Grove, G., Boydston, R., et al. (2010). Assessment of climate change impact on eastern Washington agriculture. Clim. Change 102, 77–102. doi: 10.1007/s10584-010-9851-4
Sun, Z., Jia, S. F., Lv, A. F., Yang, K. J., Svensson, J., and Gao, Y. C. (2015). Impacts of climate change on growth period and planting boundaries of winter wheat in China under RCP 4.5 scenario. Earth Syst. Dynam. Discuss. 6, 2181–2210. doi: 10.5194/esdd-6-2181-2015
Teixeira, E. I., Fischer, G., van Velthuizen, H., Walter, C., and Ewert, F. (2013). Global hot-spots of heat stress on agricultural crops due to climate change. Agric. Forest Meteorol. 170, 206–215. doi: 10.1016/j.agrformet.2011.09.002
Thomson, A. M., Brown, R. A., Ghan, S. J., Izaurralde, R. C., Rosenberg, N. J., and Leung, L. R. (2002). Elevation dependence of winter wheat production in Eastern Washington State with climate change: a methodological study. Clim. Change 54, 141–164. doi: 10.1023/A:1015743411557
Thomson, A. M., Calvin, K. V., Smith, S. J., Kyle, G. P., Volke, A., Patel, P., et al. (2011). RCP4.5: a pathway for stabilization of radiative forcing by 2100. Clim. Change 109, 77–94. doi: 10.1007/s10584-011-0151-4
Tubiello, F. N., Rosenzweig, C., Kimball, B. A., Pinter, P. J., Wall, G. W., Hunsaker, D. J., et al. (1999). Testing CERES-Wheat with free-air carbon dioxide enrichment (FACE) experiment data: CO2 and water interactions. Agron. J. 91, 247–255. doi: 10.2134/agronj1999.00021962009100020012x
Tubiello, F. N., Soussana, J.-F., and Howden, S. M. (2007). Crop and pasture response to climate change. Proc. Natl. Acad. Sci. U.S.A. 104, 19686–19690. doi: 10.1073/pnas.0701728104
Van Vuuren, D. P., Edmonds, J., Kainuma, M., Riahi, K., Thomson, A., Hibbard, K., et al. (2011). The representative concentration pathways: an overview. Clim. Change 109:5–31. doi: 10.1007/s10584-011-0148-z
Voldin, E. M., Dianskii, N. A., and Gusev, A. V. (2010). Simulating present-day climate with the INMCM4.0 coupled model of the atmospheric and oceanic general circulations. Atmos. Ocean. Phys. 46, 414–431. doi: 10.1134/S000143381004002X
Voldoire, A., Sanchez-Gomez, E., Salas y Mélia, D., Decharme, B., Cassou, C., Sénési, S., et al. (2013). The CNRM-CM5.1 global climate model: description and basic evaluation. Clim. Dyn. 40, 2091–2121. doi: 10.1007/s00382-011-1259-y
Wang, E., Robertson, M. J., Hammer, G. L., Carberry, P. S., Holzworth, D., Meinke, H., et al. (2002). Development of a generic crop model template in the cropping system model APSIM. Eur. J. Agron. 18, 121–140. doi: 10.1016/S1161-0301(02)00100-4
Watanabe, M., Suzuki, T., O'ishi, R., Komuro, Y., Watanabe, S., Emori, S., et al. (2010). Improved climate simulation by MIROC5: mean states, variability, and climate sensitivity. J. Clim. 23, 6312–6335. doi: 10.1175/2010JCLI3679.1
Watanabe, S., Hajima, T., Sudo, K., Nagashima, T., Takemura, T., Okajima, H., et al. (2011). MIROC-ESM 2010: model description and basic results of CMIP5-20c3m experiments. Geosci. Model Dev. 4, 845–872. doi: 10.5194/gmd-4-845-2011
Williams, J. R., Jones, C. A., and Dyke, P. T. (1984). A modeling approach to determining the relationship between erosion and soil productivity. Trans. ASAE 27, 129–144. doi: 10.13031/2013.32748
Wu, T., Song, L., Li, W., Wang, Z., Zhang, H., Xin, X., et al. (2014). An overview of BCC climate system model development and application for climate change studies. J. Meteor. Res 28, 34–56. doi: 10.1007/s13351-014-3041-7
Xiao, G., Zhang, Q., Li, Y., Wang, R., Yao, Y., Zhao, H., et al. (2010). Impact of temperature increase on the yield of winter wheat at low and high altitudes in semiarid northwestern China. Agric. Water Manage. 97, 1360–1364. doi: 10.1016/j.agwat.2010.04.002
Keywords: climate change, CO2 fertilization, crop-climate models, multimodel ensemble, uncertainty, winter wheat
Citation: Ahmed M, Stöckle CO, Nelson R and Higgins S (2017) Assessment of Climate Change and Atmospheric CO2 Impact on Winter Wheat in the Pacific Northwest Using a Multimodel Ensemble. Front. Ecol. Evol. 5:51. doi: 10.3389/fevo.2017.00051
Received: 20 January 2017; Accepted: 08 May 2017;
Published: 29 May 2017.
Edited by:
Urs Feller, University of Bern, SwitzerlandReviewed by:
Henry Allen Walker, Environmental Protection Agency, United StatesQingwu Xue, Texas A&M Agrilife Research, United States
Copyright © 2017 Ahmed, Stöckle, Nelson and Higgins. This is an open-access article distributed under the terms of the Creative Commons Attribution License (CC BY). The use, distribution or reproduction in other forums is permitted, provided the original author(s) or licensor are credited and that the original publication in this journal is cited, in accordance with accepted academic practice. No use, distribution or reproduction is permitted which does not comply with these terms.
*Correspondence: Claudio O. Stöckle, stockle@wsu.edu