Impacts of Urban Areas and Their Characteristics on Avian Functional Diversity
 Emily Oliveira Hagen1,2*
  Juan D. Ibáñez-Álamo
 Owen L. Petchey
 Karl L. Evans
- 1Plant-Soil Interactions, Agroscope, Institute for Sustainability Sciences, Zürich, Switzerland
- 2Department of Environmental System Sciences, Institute of Agricultural Sciences, ETH Zurich, Zürich, Switzerland
- 3Swiss Federal Institute for Forest, Snow and Landscape Research (WSL), Birmensdorf, Switzerland
- 4Landscape Ecology Group, Department of Environmental System Sciences, Institute of Terrestrial Ecosystems, ETH Zurich, Zürich, Switzerland
- 5Behavioral and Physiological Ecology Group, Centre for Ecological and Evolutionary Studies, University of Groningen, Groningen, Netherlands
- 6Department of Wetland Ecology, Estación Biológica de Doñana (CSIC), Seville, Spain
- 7Department of Evolutionary Biology and Environmental Studies, University of Zurich, Zürich, Switzerland
- 8Department of Animal and Plant Sciences, The University of Sheffield, Sheffield, United Kingdom
Urban development is rapidly expanding across the globe and is a major driver of environmental change. Despite considerable improvements in our understanding of how species richness responds to urbanization, there is still insufficient knowledge of how other measures of assemblage composition and structure respond to urban development. Functional diversity metrics provide a useful approach for quantifying ecological function. We compare avian functional diversity in 25 urban areas, located across the globe, with paired non-urban assemblages using a database of 27 functional traits that capture variation in resource use (amount and type of resources and how they are acquired) across the 529 species occurring across these assemblages. Using three standard functional diversity metrics (FD, MNTD, and convex hull) we quantify observed functional diversity and, using standardized effect sizes, how this diverges from that expected under random community assembly null models. We use regression trees to investigate whether human population density, amount of vegetation and city size (spatial extent of urban land), bio-region and use of semi-natural or agricultural assemblages as a baseline modulate the effect of urbanization on functional diversity. Our analyses suggest that observed functional diversity of urban avian assemblages is not consistently different from that of non-urban assemblages. After accounting for species richness avian functional diversity is higher in cities than areas of semi-natural habitat. This creates a paradox as species responses to urban development are determined by their ecological traits, which should generate assemblages clustered within a narrow range of trait space. Greater habitat diversity within cities compared to semi-natural areas dominated by a single habitat may enhance functional diversity in cities and explain this paradox. Regression trees further suggest that smaller urban areas, lower human population densities and increased vegetation all enhance the functional diversity of urban areas. A city's attributes can thus influence the functional diversity of its biological assemblages, and their associated ecological functions. This has important implications for the debate regarding how we should grow the world's cities whilst maintaining their ecological function.
Introduction
Globally, urban land cover is predicted to triple in extent from 2000 to 2030, with nine-fold rates of increase in some biodiversity hotspots (Seto et al., 2012). Urbanization drives significant habitat loss and fragmentation, pollution (chemical, noise, light, and heat) and other changes in selection pressures that radically restructure biotic communities (Grimm et al., 2008; Pautasso et al., 2011). At local scales this restructuring typically generates a unimodal pattern in native species richness along urbanization gradients, with richness peaking at intermediate levels of urbanization intensity (e.g. Tratalos et al., 2007). Studies documenting these unimodal patterns have primarily been conducted in highly developed regions (Marzluff, 2017). Richness may decline more linearly with increasing urbanization in regions where anthropogenic impact outside cities is more limited, due to a sharper contrast between the occurrence of semi-natural vegetation outside cities and its rarity inside urban areas (Luck and Smallbone, 2010; Norton et al., 2016). Urban development also restructures biotic communities at larger spatial scales, such as the entire urban area. Analyses conducted at city scale suggest that cities typically contain fewer species than equivalent sized rural areas, but such studies are much rarer than those focusing on local scale responses to urbanization and there is limited understanding of factors driving variation in biodiversity across cities (Norton et al., 2016; Lepczyk et al., 2017).
The restructuring of biotic communities in urban areas is strongly associated with the loss of species with limited tolerance to urban development, i.e. urban avoiders, and increased abundances of more tolerant species (Blair, 1996; Sol et al., 2014; Fischer et al., 2015). These shifts in community composition are non-random, with urban environments filtering species according to their ecological and life-history traits, for example, across numerous taxonomic groups, specialized species tend to respond negatively to urbanization (Clark et al., 2007; Evans et al., 2011; Sol et al., 2014). This filtering process occurs across all three stages of the biotic urbanization process, i.e. arrival, adaptation and spread (Evans et al., 2010). These ecological and life-history traits that filter species' responses to urban development also determine how species contribute to and modulate ecosystem processes and services (Luck et al., 2009; Villéger et al., 2010; Dehling et al., 2016). As an example urbanization can alter avian communities in a manner that changes seed dispersal functions which promote invasive plant species over closely related native species (Caughlin et al., 2012). The non-random urban filtering of biotic communities can thus alter the nature and diversity of functions performed by species retained within urban communities. Functional diversity indices are powerful tools that go beyond simple measurements of biodiversity, allowing the quantification and comparison of functional diversity among communities (Pla et al., 2012). Assessing whether observed functional diversity differs from that expected by chance provides a metric of the dispersion of traits across the functional trait space, with increasing clustering or over-dispersion of traits indicating stronger biotic or abiotic filtering of the focal community (Botta-Dukát and Czúcz, 2016). Assessing functional diversity responses to land use changes can thus help to understand community assembly patterns and shifts in community function. Despite this, very little attention has been paid to the functional significance of biotic homogenization in cities, even in well studied groups such as birds (McKinney, 2008; Marzluff, 2017). Initial studies assessing variation in functional diversity at a local scale within a city suggests that functional diversity declines in more urbanized locations, and that habitat composition can influence the functional diversity of avian communities at local scales (Schütz and Schulze, 2015). Negligible work has been conducted, however, to assess how the functional diversity of urban assemblages at the scale of entire cities compares to that of rural areas, and how these patterns are influenced by the characteristics of those cities. Indeed, many characteristics of cities such as their size and amount of green-space, are likely to influence a wide range of biodiversity metrics but such research has until recently been limited by lack of sufficient data (Aronson et al., 2014; Norton et al., 2016).
Our overall goal is to assess how urbanization influences functional diversity, another crucial aspect of biodiversity, which complements the current focus on more traditional measures of biodiversity, such as species richness. In addition, the quantification and investigation of the patterns of trait distribution, allows the observation of non-random compositional shifts that ultimately could affect ecosystem functions and related services therein. We use data from paired urban and rural, i.e. non-urban, assemblages across three continents and focus on assessments at large spatial extents, i.e. city level analyses. In doing so we distinguish between impacts that arise when comparing urban areas to surrounding rural environments, i.e. sites dominated by semi-natural habitats, and those comparing urban areas to agricultural ones in which natural vegetation is more limited. In addition, we assess how key features of urban areas (their size, human population density, and amount of vegetation) modify the impact of urbanization on avian functional diversity. Our analyses thus help to develop further understanding of how urbanization influences trait dispersion, its significance for community function and how to manage urban development to limit adverse impacts on functional diversity.
Methods
Avian Assemblage Data
Our general approach is to extract data on assemblage composition from peer-reviewed studies that adopt equivalent methods to survey avian assemblages in an urban location and a nearby paired rural site. We do not use data from studies only conducted in urban areas, as whilst the composition of surrounding rural assemblages could be estimated by extracting data from species distribution maps these distributional data are a summary of intensive survey effort accumulated over a substantial time period. Survey effort would thus be much greater for rural sites thus potentially biasing estimates of their functional diversity and increasing it relative to urban sites with less intensive sampling effort. We take habitat definitions from the original papers, but all urban areas are distinguished from rural areas by the dominance of impervious surfaces in the former. We do not place any additional restrictions on the definition of urban areas as one of our objectives is to assess how variation in the characteristics of urban areas influences functional diversity, and we thus wish to maximize variation in the type of urban areas included in our analyses. We distinguish between non-urban areas dominated by semi-natural habitats (such as woodland, referred to as semi-natural assemblages) and those dominated by agricultural habitats.
Our literature search was conducted in April 2012 using Web of Knowledge and combinations of the terms “avian*” “bird*,” “urban,*” “cit*” (truncated to include papers using the term city or cities) and “assemblage*.” Additional urban ornithological literature has accumulated since our initial search, but our database is representative of the current spatial distribution of ornithological research (Marzluff, 2017). We excluded studies whose survey design was likely to under-record the urban avian community due to a primary focus on certain species or taxonomic groups. We also excluded studies from bio-regions for which there was only one study available. We did this because the construction of a regional species pool is a crucial step when comparing observed values of functional diversity metrics to null models (see below) and the regional species pool should be composed of a greater set of species than those in a single community. Our criteria were met by 32 papers that described the assemblages of 25 cities (Figure 1). Four cities (Montpellier, in the Western Palearctic; and Oxford, Palo Alto, and Tucson in North America) were represented by more than one study and we combined these studies to construct a single urban assemblage for each city, together with its paired natural or agricultural assemblage. In addition, for four urban assemblages (Western Palearctic: Montpellier; South America: La Paz, Esquel, Palermo) we had paired data for both a semi-natural and agricultural assemblage. Our data comprised 529 bird species in 29 paired urban to non-urban assemblages, of which 19 were for natural assemblages (Table S1).
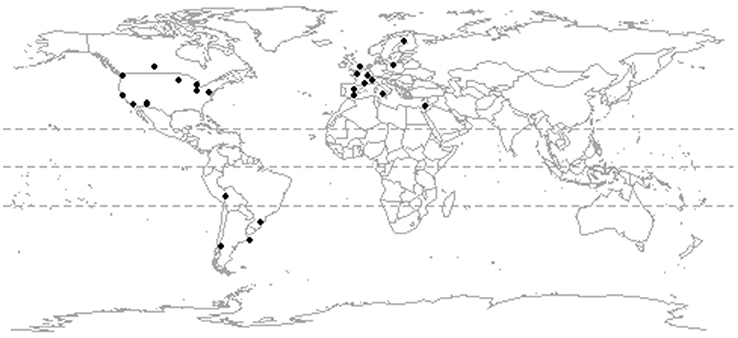
Figure 1. The location of 25 study sites for which data were available on the composition of paired urban and rural assemblages.
Avian Trait Data
Our functional diversity metrics are based on the approach developed by Petchey et al. (2007) for British birds and subsequently used in other studies of avian functional diversity (e.g. Mendez et al., 2012; Trindade-Filho et al., 2012). We expand the suite of traits beyond those used by Petchey et al. (2007) to ensure applicability to the full suite of species in our much more globally distributed assemblages, e.g. nectar was added as an additional food source. We also included nest site as an additional trait axis. Our trait database (Supplementary Material - Data Sheet 1) thus contains 27 traits that capture inter-specific variation across six trait axes that describe the quantity and type of resources acquired by each species, and the methods used to obtain them (Table 1; Table S2). When possible we used data that was specific to the location or region represented in our assemblage composition data (e.g. if a species is distributed across the northern hemisphere but within our data was only present in European assemblages we only used trait data from European populations). We used mean values for continuous traits. Binary traits were classified according to species' typical behaviors, with the primary dietary components classified when taking both adult and nestlings into account (e.g. if a species feeds primarily on seeds as an adult but invertebrates as a nestling, we coded both plants and insects as primary food sources).
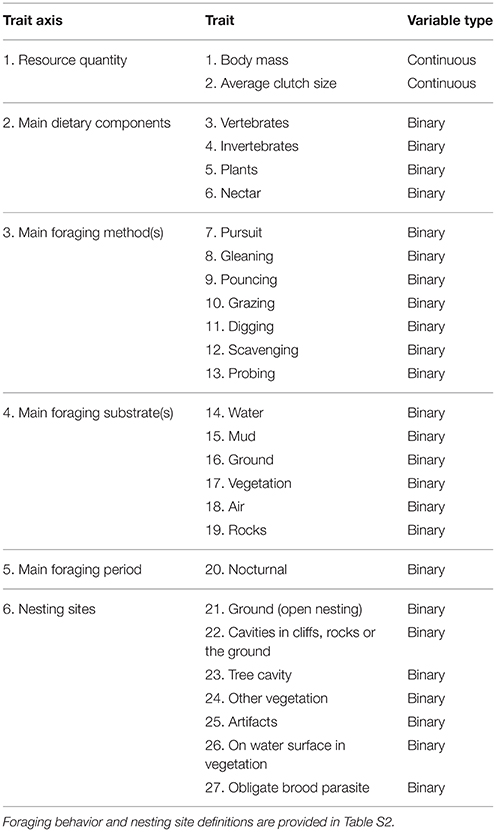
Table 1. The 6 trait axes and 27 specific traits used to characterize avian functional diversity.
Body mass data was obtained from Dunning (2007), and the Handbook of the Birds of the World (hereafter HBW; del-Hoyo et al., 1992-2011) was the primary source for all other traits, although Natuhara and Imai (1996) provided much additional data on nest sites. If data were unavailable from these sources we used regional field guides and handbooks (see Table S3 for list), but data remained unavailable for 140 trait values (0.9% of the total). These missing values were for 20 species for which we used a family mean value calculated only using data for species from the same bio-region, and that occurred at similar latitudes to the location represented in our dataset that contained the species with missing trait data.
Functional Diversity Metrics
We measured functional diversity using three metrics that require information on species presence/absence; alternative metrics that use data on species' relative abundances could not be used as such data were not provided sufficiently frequently by our focal studies. Our two continuous traits (body mass and clutch size) were standardized to vary from zero to one and thus match the range of values of the binary traits. Trait matrices for each community were converted into distances matrices using the Gower distance method, which can deal with both continuous and binary data to calculate pair-wise dissimilarities (Gower, 1971). Using these distances matrices, we calculated (i) functional diversity (FD; Petchey and Gaston, 2002), (ii) mean nearest taxon distance in functional space (MNTD; Webb, 2000), and (iii) convex hull volume (CHV; Cornwell et al., 2006). We select these metrics due to their complementary nature and recommendations of Trisos et al. (2014). FD describes the functional relationships shared by species, and theoretically can reveal the net effects of major assembly processes (Mayfield and Levine, 2010; Trisos et al., 2014). FD and MNTD are particularly good at detecting over-dispersion in trait distribution across an assemblage, a pattern that is compatible with strong effects of inter-specific competition. In contrast, CHV is more sensitive to detecting trait clustering, a pattern that is more indicative of strong filtering generating a community with highly similar trait values (Mouchet et al., 2010; Aiba et al., 2013). We also use MNTD as it is one of the most commonly used measures of community relatedness, thus aiding comparison with other studies (Kraft et al., 2007). Full details regarding the calculation of functional diversity metrics are provided in Supplementary Material. All analyses were done in R v.3.3.1 (R Core Team, 2015).
We compare observed functional diversity with that of random assemblages, to assess how functional diversity varies between our focal assemblages when taking into account differences in their species richness. The spatial definition of the pool of species on which null models are based can strongly determine conclusions regarding community assembly processes (Chalmandrier et al., 2013; Herben et al., 2013). Therefore, we constructed a specific trait matrix for the regional pool of species occurring within each of our main bio-regions (the Western Palearctic, North America and South America). The comparison of the patterns of observed and expected functional diversity was performed by calculating a standardized effect index (SES) as proposed by Mendez et al. (2012).
Where Observed is the observed value of functional diversity, σe is the standard deviation of 1,000 simulations of expected functional diversity for the focal community, and Expected is the mean of the functional diversity of the simulations. This standardized effect index allows comparison between the differences of observed and expected functional diversity across studies and facilitates the visualization of outlier assemblies. The standardized effect size is a z-score of the absolute functional diversity values and measures the number of standard deviations that the observed index is above or below the mean index of the simulated communities. SES values lower than zero are compatible with environmental filtering (trait convergence) influencing community structure, whilst SES greater than zero are compatible with effects of limiting similarity (i.e. trait divergence, Figure 1 in Petchey and Gaston, 2007). Nevertheless, in an analysis of species relatedness patterns in communities, Mayfield and Levine (2010) suggest that competitive exclusion could generate clustering, over-dispersion or no pattern on species traits. Other mechanisms can also contribute to trait clustering or over-dispersion, complicating inferences regarding assembly processes. Resource mismatch and specialization, for example, can generate signals of trait over-dispersion (Pontarp and Petchey, 2016). Consequently, our focus is on how trait distribution responds to environmental variables.
Our 27 traits are separated into six axes: resource quantity, main dietary components, foraging methods, foraging substrates, foraging periods and nesting sites (Table 1). We calculate our three functional diversity metrics using all 27 traits in combination. However, we also calculate our three functional diversity metrics separately for the five trait axes that contained multiple traits, i.e. resource quantity, dietary components, foraging method, foraging substrate and nesting site. This enables us to test how urbanization separately influences different functional diversity axes. This decreases the likelihood of not detecting an effect of urbanization on overall functional diversity due to opposing effects on different trait axes that cancel each other out, and thus mask an effect on functional diversity calculated across all trait axes (Trisos et al., 2014). This analysis of separate trait axes also provides additional information to test specific hypotheses derived from the literature regarding how urbanization filters avian communities, e.g. that urbanization promotes birds with particular foraging niches or nest site attributes (Evans et al., 2011; Sol et al., 2013).
We also conduct two additional checks to explore factors that may influence estimates of urban functional diversity. It is plausible that urban bird survey data incorporate some species that migrate through cities but are not an established part of the avifauna, despite being established in nearby non-urban areas. This could create a bias that increases estimates of urban functional diversity. We assess this by calculating our three functional diversity metrics with and without including migratory species (coded per city based on range maps from HBW Alive - www.hbw.com). These two sets of functional diversity metrics were strongly and positively correlated (FD r = 0.91, MNTD r = 0.86, CHV r = 0.83; P < 0.0001 in all cases), and we thus consider this potential bias to have negligible influence on our results. Whilst urban areas can contain a number of migratory species that do not breed there we expect that the studies from which we extract data were typically conducted in a manner to avoid incorporating such species. In addition, cities often contain water-bodies that support a range of wetland birds, whilst our focal non-urban areas are typically dominated by a single terrestrial habitat type. There is thus also the potential for the greater diversity of waterbirds in urban areas to enhance estimates of urban functional diversity. We conducted a second robustness check by assessing the correlation between functional diversity metrics including and excluding waterbirds. These metrics are strongly and positively correlated (FD r = 0.99, MNTD r = 0.98, CHV r = 0.96; P < 0.0001 in all cases) suggesting that increased species richness of waterbirds in urban areas is not driving the patterns in functional diversity that we report.
City Characteristics
We use three metrics that describe key features of the urban landscape that are likely to influence the composition of avian assemblages. The spatial extent of an urban area can influence assemblages by changing selection pressures, such as the magnitude of the urban heat island effect and contributing to large scale habitat fragmentation impacts by changing the degree of connectivity between central urban locations and surrounding rural areas (Norton et al., 2016). City size is difficult to measure from an ecological perspective as a city's administrative boundaries often do not coincide with the boundary between areas dominated by built up land and less urbanized locations. We thus defined the spatial extent of our focal cities using an urban cluster methodology that manually delimited a polygon that encompassed all areas dominated by impervious surfaces within each focal city using Google Earth Pro software, and using aerial imagery from as close as possible to the year(s) in which avian data were collected for that urban area (Figure S1). The defined urban area could thus be much smaller or larger than administrative city size and more accurately captured the spatial extent of a city than other commonly used metrics of city size, such as the extent of administrative boundaries or human population size.
We use human population density as an alternative measure of urbanization intensity (Gaston, 2010). This metric captures the potential for human disturbance, and is directly relevant to addressing policy questions regarding how to meet the growing need to house people in urban areas whilst minimizing impacts on biodiversity. Indeed, human population density is often associated with assemblage species richness and composition, including at fine spatial scales within urban areas (Evans et al., 2006; Fontana et al., 2011). We thus obtained data on human population density within each of our urban areas for the year 2000 using data at the 1km resolution from the Global Human Settlement Layer (GHSL) project, supported by European Commission [European Commission, Joint Research Centre (JRC); Columbia University, Center for International Earth Science Information Network (CIESIN), 2015]. The density values were obtained by a bilinear interpolation of values stored at the raster image provided by the dataset for each study point.
Numerous studies have documented strong associations between the structure and composition of urban bird assemblages and the amount of green-space within the survey location, which provides an additional measure of urbanization intensity (Marzluff, 2017). Indices derived from remote sensing images that measure the proportions of reflected light in different wavelengths (such as the Normalized Difference Vegetation Index, NDVI, and Enhanced Vegetation Index, EVI) provide robust estimates of the amount of vegetation and correlate positively with avian species richness in urban areas (Bino et al., 2008; Silva et al., 2015). We use EVI rather than NDVI as the former provides a better correction for bare ground and residual atmospheric contamination effects and more accurately captures spatial variation when vegetation is abundant (Xiangming et al., 2003). We used EVI data collected at a 30 × 30 m pixel resolution from Moderate Resolution Imaging Spectroradiometer (MODIS) satellite images, retrieved from the Oak Ridge National Laboratory data server (ORNL DAAC, 2011). Within each city, we use EVI data from a 16.25 km2 grid that is centered on the ornithological survey area used in each study, and use the MODIS landmasks to correct for the presence of water features (Table S4). We calculate EVI as the mean of all EVI estimates during spring and summer (defined as March to August for studies in the northern hemisphere, and September to February in the southern hemisphere) for each city using remote sensing data from the year closest to that of the ornithological surveys.
Statistical Analysis of Urbanization Effects
All analyses were conducted in R 3.3.1. We start by using paired tests to compare species richness and functional diversity metrics of our paired assemblages. We conduct separate tests for urban assemblages paired with semi-natural sites and those paired with agricultural sites. Species richness and observed FD, MNTD, and CHV data met the assumptions of parametric tests and we thus analyzed these data using paired t-tests. Paired data on SES values from FD, MNTD and CHV data were, however, analyzed using a Wilcoxon signed rank test as the data did not meet the assumptions of parametric tests. We conduct these tests using our global data-sets but also conduct separate tests for data from each of our three regions in case heterogeneity in the direction of effects across regions influences the detection of patterns at a global scale, i.e. positive and negative effects in different regions canceling each other out in a global analysis. We interpret the results of these regional tests cautiously due to low sample sizes in some cases. Similarly, to assess if heterogeneity in the impacts of urbanization on different trait axes influences the detection of a global pattern in functional diversity measured across all six trait axes in combination we conduct separate paired tests for each functional diversity trait axis. These single trait axes analyses are only conducted for FD and MNTD functional diversity metrics as the code for calculating CHV does not perform well when only using binary traits that comprise most of our single trait axes (Table 1). Our heterogeneity analyses provide robustness tests but find negligible impact of heterogeneity in the direction of effects across regions or different trait axes (see Section Results). Consequently, our further analyses (regression trees, see below) only focus on global patterns using functional diversity metrics constructed across all six trait axes.
We then explore how the magnitude of divergence in the functional diversity of our global paired urban and rural assemblages is associated with key features of the paired assemblages using a regression tree approach. Regression trees deal better with non-linearity and interactions between explanatory variables than regression based generalized linear or additive models; regression trees can also find interactions missed by other methods (Zuur et al., 2007). We calculate an index of divergence in functional diversity between paired urban and non-urban assemblages by subtracting the non-urban functional diversity metric from the urban functional diversity metric. We do this using (i) observed FD, MNTD, and CHV (which does not take species richness of the assemblages into account), and (ii) SES values based on FD, MNTD and CHV (which focuses on how observed functional diversity varies relative to expected functional diversity given the number of species present in each assemblage). We use five predictor variables: EVI as a measure of the amount of urban vegetation, urban human population density (km−2), city size (km2), non-urban habitat type (agriculture or semi-natural habitat), and region (Western Palearctic, North America and South America). Prior to analysis city size and human population density were log10 transformed to reduce the skew in their distributions. Regression trees were constructed using the package “Tree” (Ripley, 2016). The tree fitting function adopts a pre-pruning strategy which has a number of control settings which limit how much the tree grows. Our trees were pre-pruned using the default settings, i.e. a minimum number of 5 observations per branch and the within-node deviance being at least 0.01 times that of the root node for the node to be split (Ripley, 2016). The pre-pruning approach can lead to over-fitting with terminal branches explaining relatively little additional variation (Zuur et al., 2007). We thus adopt a conservative approach that also uses a post-pruning strategy and only retain final branches if they contribute an additional 5% explanatory capacity. Whilst this threshold is somewhat subjective, when sample sizes are limited it is more appropriate than alternative P-value based post-pruning rules (Alvarez-Iglesias et al., 2017). The explanatory capacity was calculated using McFadden's pseudo R2 (McFadden, 1974) for trees with and without each terminal branch. This post-pruning strategy led to the removal of one branch from each of two trees (SES FD and SES CHV).
Results
Our data comprise a total of 529 species, of which 141 species occurred at sites in the Western Palearctic (urban sites: 106 species; non-urban sites: 135 species), 199 species in North America (urban: 163; non-urban: 172) and 207 in South America (urban: 130; non-urban: 169). The majority of species co-occurred in urban and non-urban sites, but species also occurred exclusively in each habitat type. A greater number of species were restricted to non-urban areas than urban ones (globally: 142 exclusively non-urban species, 66 exclusively urban species; Western Palearctic: 35 exclusively non-urban, 6 exclusively urban; North America: 36 exclusively non-urban, 27 exclusively urban; South America: 77 exclusively non-urban, 38 exclusively urban). Species that, within our dataset, were exclusively found in urban sites included a small number of classical urban exploiters, such as feral pigeon Columba livia, but primarily comprised a wide range of native species: e.g. mallard Anas platyrhynchos, peregrine Falco peregrinus, burrowing owl Athene cunicularia, hooded crow Corvus cornix, bronzed cowbird Molothrus aeneus and black-and-rufous warbling finch Poospiza nigrorufa. Non-native species were rare in urban assemblages (mean species richness ± standard error: 1.4 ± 0.3).
Paired Analyses
Urban assemblages tended to comprise fewer species than assemblages at natural sites, which also tended to support more species than agricultural sites (Figure 2). However, there were no significant differences in species richness when comparing paired urban and natural assemblages, or paired urban and agricultural assemblages at the global scale or for individual regions, i.e. the Western Palearctic, North America and South America (Table 2).
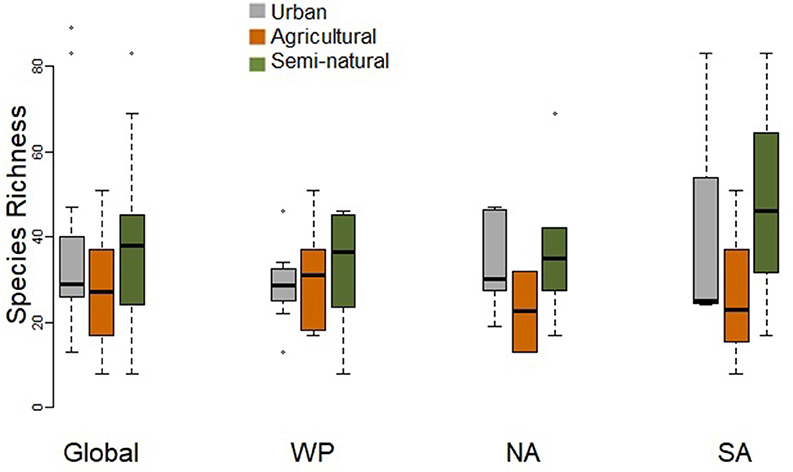
Figure 2. Box-plot comparing species richness of paired urban and non-urban assemblages (in either natural or agricultural habitats) at the global scale and for the Western Palearctic (WP), North America (NA), and South America (SA). Paired t-tests did not find any significant differences (Table 2).
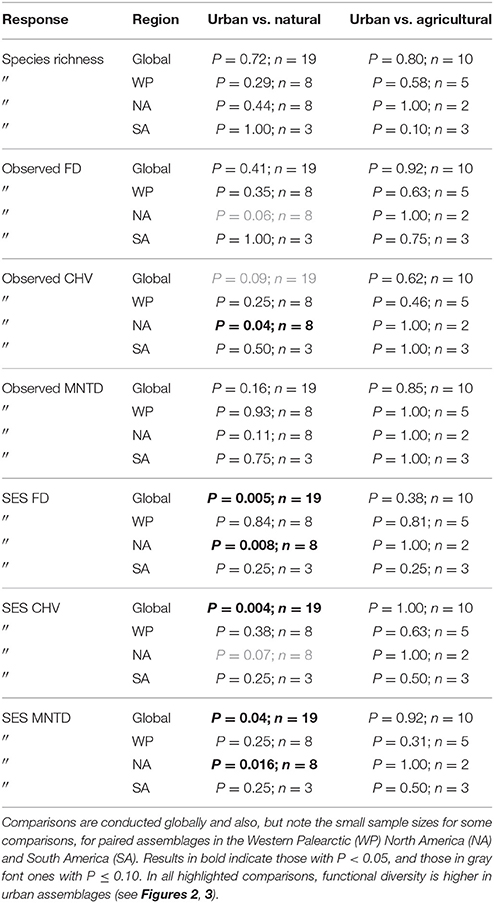
Table 2. Results of paired tests for differences in species richness, observed functional diversity metrics, and standardized effect size (SES) functional diversity metrics that take species richness into account between paired urban avian assemblages and those in natural habitats, and between paired urban and agricultural assemblages.
When comparing observed functional diversity of paired urban and non-urban assemblages the only significant difference was between CHV of urban and natural assemblages in North America, with higher CHV in urban assemblages (P = 0.04; Table 2; Figure 3). The same pattern was observed, but with P-values just above the significance threshold (α = 0.05) in North America for FD (P = 0.06). There was no evidence that the lack of significant differences in observed functional diversity at the global scale was due to significant heterogeneity in the direction in which each single trait axes responded to urban development (Table 3; Figure 4).
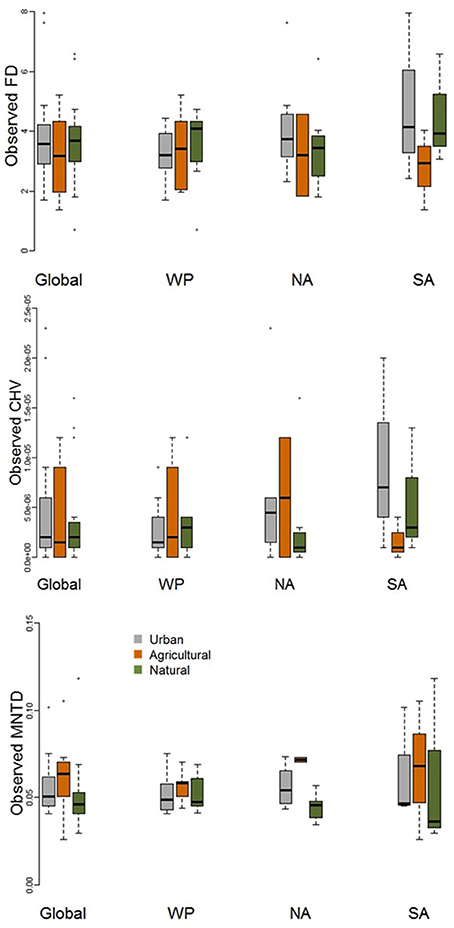
Figure 3. Boxplot comparing observed functional diversity metrics (FD, MNTD, and CHV) for urban avian assemblages and their paired natural and agricultural assemblages at the global scale and for the Western Palearctic (WP), North America (NA), and South America (SA). See Table 2 for statistical results.
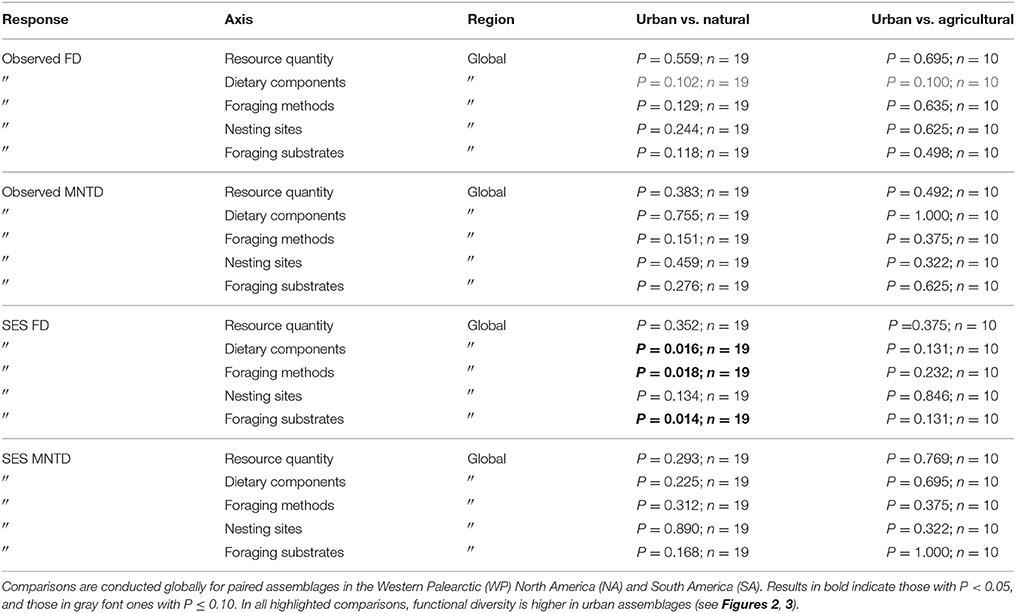
Table 3. Results of paired tests for differences in species richness, observed functional diversity metrics, and standardized effect size (SES) functional diversity metrics that take species richness into account between paired urban avian assemblages and those in natural habitats, and between paired urban and agricultural assemblages.
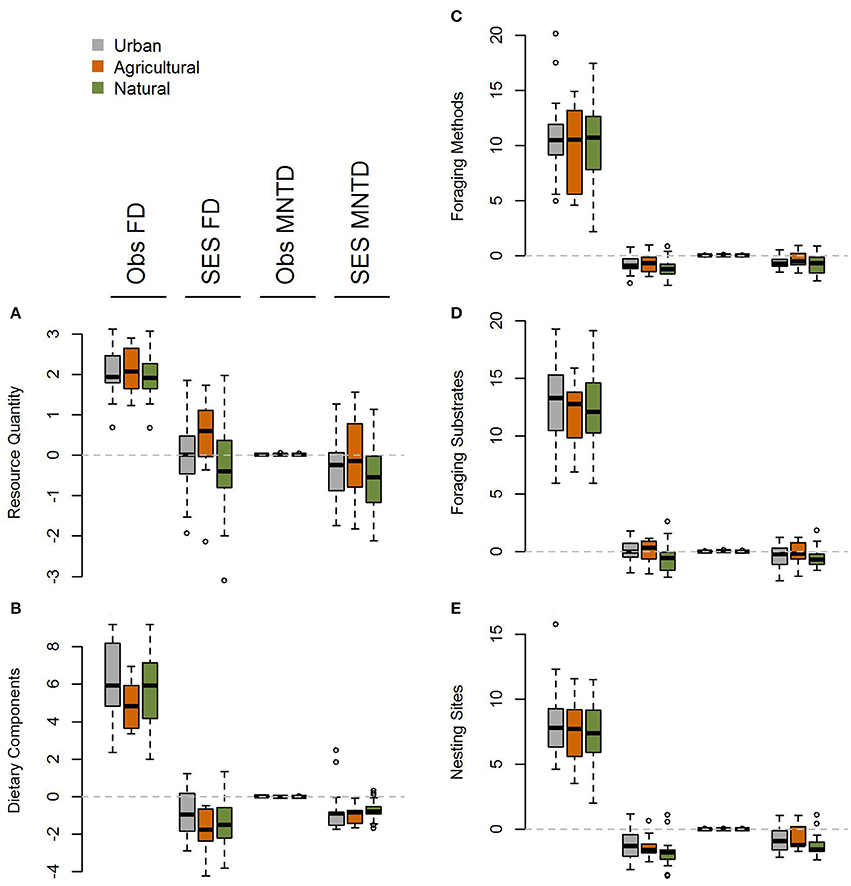
Figure 4. Boxplot comparing single trait axis functional diversity metrics at the global scale for (A) resource quantity, (B) dietary components, (C) foraging methods, (D) foraging substrates, and (E) nesting sites for observed and standardized effect size FD and MNTD metrics in urban assemblages and paired natural and agricultural assemblages. There is no evidence for heterogeneity in the impacts of urbanization across different functional trait axes.
When comparing standardized effect sizes (SES) of functional diversity, i.e. taking species richness into account, there was a globally statistically significant pattern of higher functional diversity in urban assemblages than ones in natural habitats (FD P = 0.005; CHV P = 0.004; MNTD P = 0.04; Table 2; Figure 4). Identical and statistically significant patterns occurred in North America (Table 2; Figure 5). A similar and marked trend occurred in South America (Figure 5), but the sample size was small and the trend was not statistically significant (Table 2). Analyses of single trait axes SES metrics suggested that for FD the higher functional diversity of urban assemblages was driven by three single trait axes: dietary components (P = 0.02), foraging methods (P = 0.02) and foraging substrates (P = 0.01; Table 3; Figure 4). Similar patterns were exhibited by single trait axes for resource quantity and nesting sites, albeit well above the α = 0.05 significance threshold (Table 3; Figure 4). Global comparisons of single trait MNTD metrics did not find any evidence of heterogeneity in the responses of single trait axes between paired urban and non-urban assemblages, either natural or agricultural ones (Table 3; Figure 4).
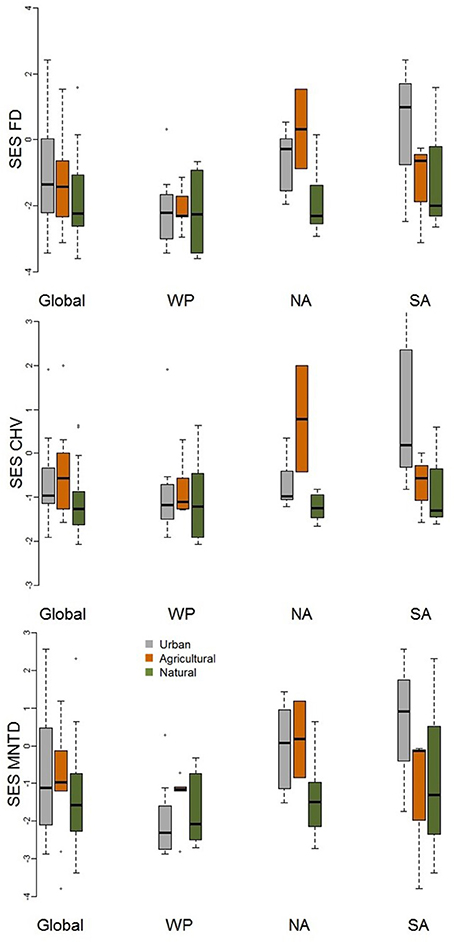
Figure 5. Boxplot comparing standardized effect size functional diversity metrics (FD, MNTD, and CHV) that take species richness into account for urban avian assemblages and their paired natural and agricultural assemblages at the global scale and for the Western Palearctic (WP), North America (NA), and South America (SA). See Table 2 for statistical results.
Regression Trees
We used regression trees to assess how the difference in functional diversity of urban and non-urban assemblages is related to the features of each city (amount of vegetation, size, and human population density), the nature of the non-urban assemblages (semi-natural or agricultural sites) and region. These regression trees explained large amounts of the variation in the divergence in observed functional diversity (FD 54%, CHV 40%, MNTD 43%) and SES metrics of functional diversity (FD 47.6%, CHV 28.4%, MNTD 50.7%). The regression trees of observed and standardized effect size functional diversity metrics varied with the functional diversity metric that was used. All six trees provide evidence, however, that the characteristics of urban areas were associated with the magnitude of divergence between the functional diversity of urban and non-urban avian assemblages (Figure 6).
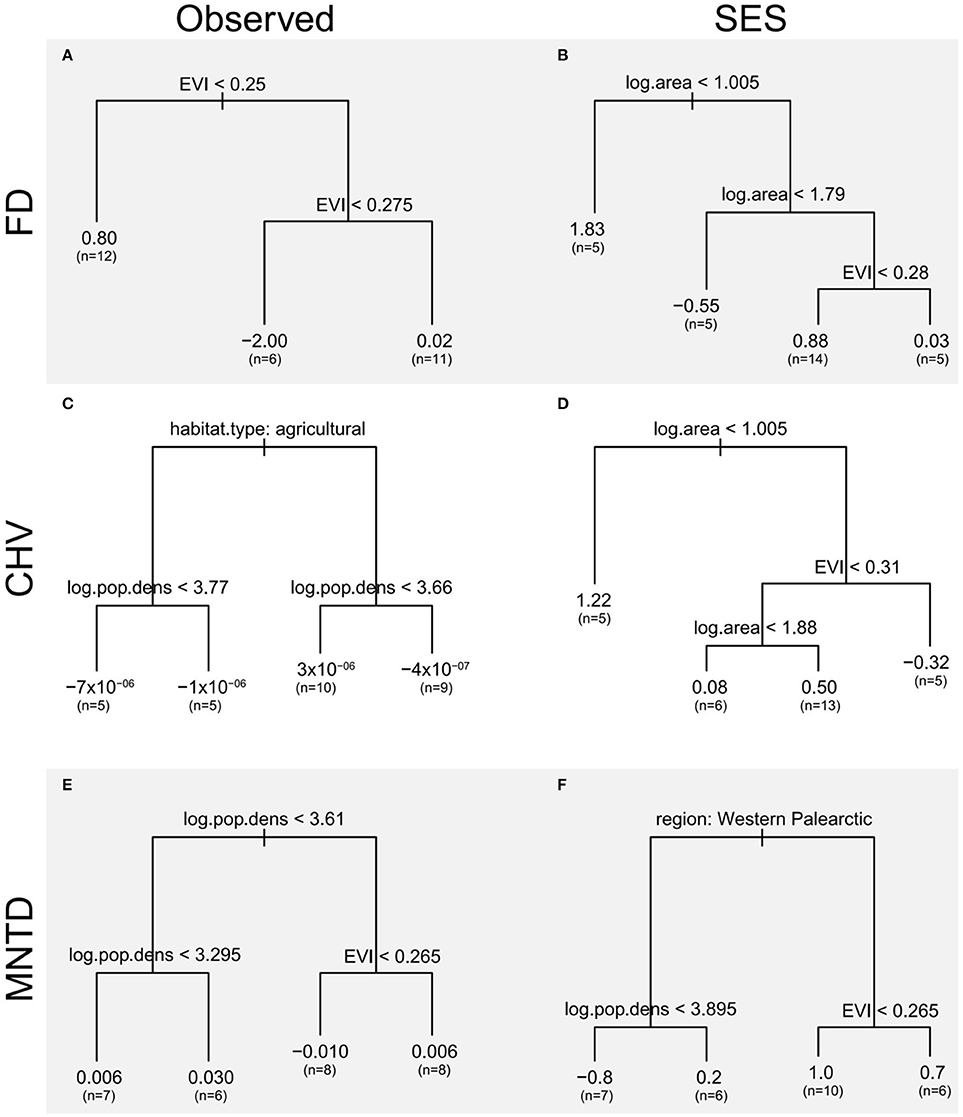
Figure 6. Regression trees of differences in the functional diversity between urban and non-urban avian assemblages as a function of city traits EVI, a measure of the amount of vegetation, log area, log10 of the spatial extent of the urban area (km2) and log.pop.density, log10 of the human population density (km−2), nature of the non-urban assemblages (natural habitat or agricultural land) and bio-region. Regression trees are presented for (A,B) FD, (C,D) CHV, and (E,F) MNTD functional diversity metrics using observed values and standardized effect size metrics (SES) that take species richness into account. The left-hand branch of each tree is followed when the condition stated at the top of the branch is met. The length of each branch is proportional to the deviance explained by each split, the values at the end of each branch are the group mean and (in parentheses) the number of observations contributing to each branch.
The regression tree for observed FD only retains EVI as a predictor and splits urban assemblages into three groups with contrasting amounts of vegetation. Cities with the highest EVI values (>0.275) have bird assemblages with functional diversity metrics that are closest to those of non-urban assemblages. The influence of EVI on differences in the observed functional diversity of urban and non-urban assemblages is, however, not consistent as urban avian functional diversity is higher than non-urban ones in cities with the lowest EVI values (<0.25), and cities with intermediate EVI values (0.25–0.275) have lower functional diversity than non-urban sites.
The regression tree for observed CHV shows that observed functional diversity in urban bird assemblages is lower than that in paired assemblages from agricultural sites (left hand branch). When urban assemblages are compared to those in natural sites (right hand branch) the direction of the differences between urban and natural sites depends on the human population density within the city. Cities with lower human population density (log10 population density <3.66) have higher observed functional diversity than assemblages in semi-natural sites, but in more densely populated cities observed functional diversity is lower than in semi-natural sites.
The regression tree for observed MNTD shows that when cities have high human population densities (log10 population density > 3.61) the differences between the functional diversity of their avian assemblages and those in non-urban assemblages depends on the amount of vegetation. In cities with less vegetation (EVI < 0.265) observed functional diversity is lower in urban areas than paired non-urban assemblages. In contrast, when cities contain more vegetation (EVI > 0.265) observed functional diversity is higher in urban areas than non-urban sites.
Regression trees using standardized effect sizes (which takes species richness into account) of the FD and CHV metrics find a number of splits which reveal that differences in the functional diversity of urban and non-urban assemblages are influenced by complex interactions between city size and EVI. The first branch of the regression tree for both these metrics show that urban functional diversity is higher than that of non-urban assemblages when cities are small. The subsequent interactions between EVI and city size do not reveal any consistent patterns. The regression tree for the standardized effect size of MNTD show that the higher functional diversity of urban avian assemblages, compared to non-urban assemblages, is greater for cities in North and South America than the Western Palearctic. The length of this branch indicates that this split contributes greatly to the tree's overall explanatory power.
Discussion
Our results are only applicable to cities with similar characteristics to those within our dataset, which is dominated by urban clusters with spatial extents between 4 and 3,500 km2 (52% of cities lower than 100 km2 and 16% above 1,000 km2), with low to intermediate population densities, between 875 and 16,300 people km−2 (80% of the cities between 1,000 and 10,000 people km−2). Whilst our results thus cannot inform discussions of the impacts of megacities on functional diversity, they are relevant to the small and medium sized urban areas in which most of the projected future urban growth is predicted to occur (United Nations Human Settlements Programme, 2006).
Within each of our bio-regions fewer species occurred exclusively in urban assemblages than non-urban assemblages. This is compatible with the ecological literature demonstrating that some species are excluded from urban areas, and thus urbanization is a potent driver of species loss at regional and global scales (Blair, 2001; McKinney, 2006; Ibáñez-Álamo et al., 2016). Although there was a trend toward lower urban species richness, the difference was not statistically significant perhaps due to relatively small sample sizes, especially within some regions. A number of studies show that species richness can be maintained even in highly modified landscapes as specialized species are replaced by a similar number of more generalist and less sensitive species (Mayfield et al., 2010; Litteral and Shochat, 2017). Indeed, the urban locations in our study contain diverse avian assemblages and their species richness at our focal city level scale could be maintained by persistence of rarer species within remnants of high quality habitats within the urban area.
Globally, urban and non-urban assemblages did not exhibit significant differences in their observed functional diversity, and there was no evidence that this was due to heterogeneity of responses between different regions or between different functional trait axes. These results were consistent when comparing urban assemblages with those in semi-natural or agricultural areas. Notably, however, when taking into account the number of species within an assemblage, we found consistent evidence across each of our three functional diversity metrics that avian functional diversity is higher in cities than areas of natural habitat. At first sight this seems a remarkable result that is highly unexpected given the plethora of studies showing that urbanization acts as a strong filter of biotic communities favoring species with a particular set of ecological and life history traits (Blair, 1996; Evans et al., 2011; Sol et al., 2014; Fischer et al., 2015) and negative effects of urbanization on avian taxonomic and evolutionary diversity (e.g. Marzluff et al., 2001; Chace and Walsh, 2006; McKinney, 2008; Ibáñez-Álamo et al., 2016) the other two major components of biodiversity. One would thus expect urban assemblages to be characterized by functional trait clustering that reduces functional diversity. Divergent responses of different biodiversity metrics to environmental change are, however, not uncommon (e.g. Devictor et al., 2010) including in an urbanized context (Morelli et al., 2016).
One potential explanation for enhanced functional diversity in urban areas is greater numbers of non-native species, that contribute unique traits—but this seems unlikely given their rarity in our focal urban assemblages. Our analysis focuses at a large spatial scale, i.e. entire urban areas which typically contain a wide diversity of different habitat types, primarily as a consequence of human planting and management decisions (Forman, 2014). We compare urban avian assemblages with those from rural semi-natural or agricultural areas that are typically dominated by a single habitat type, which is likely to support species that are specialized on that single habitat type and thus exhibit stronger clustering of their functional traits. Consequently, greater habitat diversity within cities compared to similarly sized areas of semi-natural or agricultural vegetation may explain the apparent paradox of higher functional diversity, when taking species richness into account, in urban areas. Whilst more work is required to test this hypothesis it suggests that maintaining high levels of habitat diversity across urban areas will be important for maximizing their functional diversity.
Increases in urban functional diversity, when taking species richness into account, appears to be driven by traits related to foraging behavior as we only found significant differences for the three functional axes related to such function (i.e. dietary components, foraging methods and foraging substrates; Table 3). Whilst this finding contrasts with a global comparison in which diet type was not significantly different between urban exploiters and avoiders (Sol et al., 2014), several more local studies have found that urbanized and non-urbanized species differ in their diet or foraging behavior (e.g. Blair, 1996; Kark et al., 2007). This finding is also consistent with studies demonstrating that urbanization induces shifts in ecological functions linked to foraging, such as seed dispersal (Caughlin et al., 2012). Direct or indirect provision of anthropogenic food sources (such as garden bird food, garbage or nectar from ornamental plants) may also influence the distribution of foraging traits within urban bird assemblages, as such sources can supply additional resources that help to retain some (occasionally specialized) species in urban areas (Pauw and Louw, 2012).
Our results provide strong evidence that cities' characteristics determine how avian functional diversity compares to that of paired non-urban assemblages. The most notable pattern that emerges when taking species richness into account is the effect of city size, with elevated functional diversity being much more marked in smaller cities. This pattern does not arise when using observed functional diversity metrics, presumably because of species-area effects which increase the total number of species in larger urban areas (Norton et al., 2016). Regression trees that use observed functional diversity metrics provide evidence that cities with lower human population densities, and that contain more vegetation, have higher functional diversity. These results provide a novel extension of previous work on factors influencing urban biodiversity (e.g. Pellissier et al., 2012; Aronson et al., 2014; Bellocq et al., 2017; Chen and Wang, 2017) and extends the work of a study conducted within a single city at a finer spatial scale that found higher avian functional diversity in locations with greater vegetation cover (Schütz and Schulze, 2015). Crucially we demonstrate that less densely populated cities with a greater amount of vegetation will enhance functional diversity at the city scale. This information can guide policy makers and city planners who seek to increase avian functional diversity and associated ecological functions.
Conclusions
We demonstrate that urban areas can retain significant amounts of functional diversity, adding to previous work indicating that they can support a large and diverse range of species including endangered ones (Müller et al., 2013; Aronson et al., 2014; Threlfall et al., 2016). Remarkably, urban areas can contain significantly higher avian functional diversity than natural habitats, a pattern that is probably a reflection of greater habitat diversity in the urban areas facilitating the occurrence of species with a greater range of functional types than more specialized species that occur within a single natural habitat. Crucially, we provide some preliminary evidence that smaller cities, with lower human population densities and more green space can support greater avian functional diversity. This has important implications for the debate regarding how we should grow the world's cities.
Author Contributions
KE designed the study with assistance from EO, JI, and OP. EO and JI conducted literature reviews and EO trait data collection, with JI and KE contributing to checking the accuracy of the trait matrix. EO, OP, and OH conducted the analysis. EO and KE wrote the paper with assistance from all authors.
Funding
The University of Zurich supported the research during the Master studies of EO. KE was funded by a Biodiversity and Ecosystem Service Sustainability (BESS) programme grant (NE/J015369/1) funded by the UK Natural Environment Research Council (NERC) and the Biotechnology and Biological Sciences Research Council (BBSRC) as part of the UK's Living with Environmental Change (LWEC) programme. JI was funded by a postdoctoral contract (TAHUB-104) from the program “Andalucía Talent Hub” (co-funded by the European's Union Seventh Framework Program Marie Skłodowska-Curie actions-COFUND- and the regional Government of Andalucía).
Conflict of Interest Statement
The authors declare that the research was conducted in the absence of any commercial or financial relationships that could be construed as a potential conflict of interest.
Acknowledgments
We thank the University of Zürich for the financial and scientific support during the Masters of EO. We also thank the Swiss Ornithological Institute—Vogelwarte for the access to their library during the trait sampling phase. In addition, we thank Cristopher Trisos for the helpful inputs that greatly improved the analysis.
Supplementary Material
The Supplementary Material for this article can be found online at: https://www.frontiersin.org/article/10.3389/fevo.2017.00084/full#supplementary-material
References
Aiba, M., Katabushi, M., Takafumi, H., Matsuzaki, S.-I. S., Sasaki, T., and Hiura, T. (2013). Robustness of trait distribution metrics for community assembly studies under the uncertainties of assembly processes. Ecology 92, 2873–2885. doi: 10.1890/13-0269.1
Alvarez-Iglesias, A., Hinde, J., Fergusson, J., and Newell, J. (2017). An alternative pruning based approach to unbiased recursive partitioning. Comput. Stat. Data Anal. 106, 90–102. doi: 10.1016/j.csda.2016.08.011
Aronson, M. F. J., La Sorte, F. A., Nilon, C. H., Katti, M., Goddard, M. A., Lepczyk, C. A., et al. (2014). A global analysis of the impacts of urbanization on bird and plant diversity reveals key anthropogenic drivers. Proc. R. Soc. B Biol. Sci. 281:20133330. doi: 10.1098/rspb.2013.3330
Bellocq, M., Leveau, L., and Filloy, J. (2017). “Urbanization and bird communities: Spatial and temporal patterns emerging from southern South America,” in Ecology and Conservation of Birds in Urban Environments, eds E. Murgui and M. Hedblom (Cham: Springer International Publishing), 35–54.
Bino, G. N. L., Darawshi, S., Hal, N. V. D., Reich-Solomon, A., and Kark, S. (2008). Accurate prediction of bird species richness patterns in an urban environment using Landsat-derived NDVI and spectral unmixing. Int. J. Remote Sens. 29, 3675–3700. doi: 10.1080/01431160701772534
Blair, R. B. (1996). Land use and avian species diversity along an urban gradient. Ecol. Appl. 6, 506–519. doi: 10.2307/2269387
Blair, R. B. (2001). “Birds and butterflies along urban gradients in two ecoregions of the united states: is urbanization creating a homogeneous fauna?,” in Biotic Homogenization, eds J. L. Lockwood and M. L. Mckinney (Boston, MA: Springer), 33–56.
Botta-Dukát, Z., and Czúcz, B. (2016). Testing the ability of functional diversity indices to detect trait convergence and divergence using individual-based simulation. Methods Ecol. Evol. 7, 114–126. doi: 10.1111/2041-210X.12450
Caughlin, T., Wheeler, J. H., Jankowski, J., and Lichstein, J. W. (2012). Urbanized landscapes favored by fig-eating birds increase invasive but not native juvenile strangler fig abundance. Ecology 93, 1571–1580. doi: 10.1890/11-1694.1
Chace, J. F., and Walsh, J. J. (2006). Urban effects on native avifauna: a review. Landsc. Urban Plan. 74, 46–69. doi: 10.1016/j.landurbplan.2004.08.007
Chalmandrier, L., Münkemüller, T., Gallien, L., Bello, F. D., Mazel, F., Lavergne, S., et al. (2013). A family of null models to distinguish between environmental filtering and biotic interactions in functional diversity patterns. J. Vegetation Sci. 24, 853–864. doi: 10.1111/jvs.12031
Chen, S., and Wang, S. (2017). “Bird diversities and their responses to urbanization in China,” in Ecology and Conservation of Birds in Urban Environments, eds E. Murgui and M. Hedblom (Cham: Springer International Publishing), 55–74. doi: 10.1007/978-3-319-43314-1_4
Clark, P. J., Reed, J. M., and Chew, F. S. (2007). Effects of urbanization on butterfly species richness, guild structure, and rarity. Urban Ecosyst. 10, 321–337. doi: 10.1007/s11252-007-0029-4
Cornwell, W. K., Schwilk, L. D. W., and Ackerly, D. D. (2006). A trait based test for habitat filtering: convex hull volume. Ecology 87, 1465–1471. doi: 10.1890/0012-9658(2006)87[1465:ATTFHF]2.0.CO;2
Dehling, D., Jordano, P., Schaefer, H., Bohning-Gaese, K., and Schleuning, M. (2016). Morphology predicts species' functional roles and their degree of specialization in plant–frugivore interactions. Proc. R. Soc. B 283:20152444. doi: 10.1098/rspb.2015.2444
del-Hoyo, J., Elliott, A., Sargatal, J., Christie, D. A., and Juana, E. D. (1992-2011). Handbook of Birds of the World. Barcelona: Lynx Edicions.
Devictor, V., Mouillot, D., Meynard, C., Jiguet, F., Thuiller, W., and Mouquet, N. (2010). Spatial mismatch and congruence between taxonomic, phylogenetic and functional diversity: the need for integrative conservation strategies in a changing world. Ecol. Lett. 13, 1030–1040. doi: 10.1111/j.1461-0248.2010.01493.x
Dunning, J. B. J. (eds.). (2007). CRC Handbook of Avian Body Masses, 2nd Edn. Boca Raton: CRC Press.
Evans, K., Chamberlai, D. E., Hatchwell, B. J., Gregoryz, R. D., and Gaston, K. J. (2011). What makes an urban bird? Glob. Chang. Biol. 17, 32–44. doi: 10.1111/j.1365-2486.2010.02247.x
Evans, K. L., Hatchwell, B. J., Parnell, M., and Gaston, K. J. (2010). A conceptual framework for the colonisation of urban areas: the blackbird Turdus merula as a case study. Biol. Rev. 85, 643–667. doi: 10.1111/j.1469-185x.2010.00121.x
Evans, K. L., Van Rensburg, B. J., Gaston, K. J., and Chown, S. L. (2006). People, species richness and human population growth. Global Ecol. Biogeogr. 15, 625–636. doi: 10.1111/j.1466-8238.2006.00253.x
Fischer, J. D., Schneider, S. C., Ahlers, A. A., and Miller, J. R. (2015). Categorizing wildlife responses to urbanization and conservation implications of terminology. Conserv. Biol. 29, 1246–1248. doi: 10.1111/cobi.12451
Fontana, S., Sattler, T., Bontadina, F., and Moretti, M. (2011). How to manage the urban green to improve bird diversity and community structure. Landsc. Urban Plan. 101, 278–285. doi: 10.1016/j.landurbplan.2011.02.033
European Commission, Joint Research Centre (JRC); Columbia University, Center for International Earth Science Information Network (CIESIN). (2015). GHS Population Grid, derived from GPW4, Multitemporal (1975, 1990, 2000, 2015). European Commission, Joint Research Centre (JRC) [Dataset]. Available online at: http://data.europa.eu/89h/jrc-ghsl-ghs_pop_gpw4_globe_r2015a
Gower, J. C. (1971). A general coefficient of similarity and some of its properties. Biometrics 27, 857–874. doi: 10.2307/2528823
Grimm, N. B., Faeth, S. H., Golubiewski, N. E., Redman, C. L., Wu, J., Bai, X., et al. (2008). Global change and the ecology of cities. Science 319, 756–760. doi: 10.1126/science.1150195
Herben, T., Nováková, Z., and Klimešová, J. (2013). Comparing functional diversity in traits and demography of Central European vegetation. J. Vegetation Sci. 24, 910–920. doi: 10.1111/jvs.12054
Ibáñez-Álamo, J. D., Rubio, E., Benedetti, Y., and Morelli, F. (2016). Global loss of avian evolutionary uniqueness in urban areas. Glob. Change Biol. 23, 2990–2998. doi: 10.1111/gcb.135
Kark, S., Iwaniuk, A., Schalimtzek, A., and Banker, E. (2007). Living in the city: can anyone become an ‘urban exploiter’? J. Biogeogr. 34, 638–651. doi: 10.1111/j.1365-2699.2006.01638.x
Kraft, N. J. B., Cornwell, W. K., Webb, C. O., and Ackerly, D. D. (2007). Trait evolution, community assembly, and the phylogenetic structure of ecological communities. Am. Nat. 170, 271–283. doi: 10.1086/519400
Lepczyk, C. A., La Sorte, F. A., Aronson, M. F. J., Goddard, M. A., MacGregor-Fors, I., Nilon, C. H., et al. (2017). “Global patterns and drivers of urban bird diversity,” in Ecology and Conservation of Birds in Urban Environments, eds E. Murgui and M. Hedblom (Cham: Springer International Publishing), 13–33.
Litteral, J., and Shochat, E. (2017). “The role of landscape-scale factors in shaping urban bird communities,” in Ecology and Conservation of Birds in Urban Environments, eds E. Murgui and M. Hedblom (Cham: Springer International Publishing), 135–159.
Luck, G. W., Harrington, R., Harrison, P. A., Kremen, C., Berry, P. M., Bugter, R., et al. (2009). Quantifying the contribution of organisms to the provision of ecosystem services. Bioscience 59, 223–235. doi: 10.1525/bio.2009.59.3.7
Luck, G. W., and Smallbone, L. T. (2010). “Species diversity in urban landscapes: patterns, drivers and implications,” in Urban Ecology, ed K. J. Gaston (Cambridge: Cambridge University Press, British Ecological Society), 88–119.
Marzluff, J. M. (2017). A decadal review of urban ornithology and a prospectus for the future. Ibis 159, 1–13. doi: 10.1111/ibi.12430
Marzluff, J. M., Bowman, R., and Donnelly, R. (2001). “A historical perspective on urban bird research: trends, terms and approaches,” in Avian Ecology and Conservation in an Urbanizing World, eds J. M. Marzluff, R. Bowman, and R. Donnelly (Boston, MA: Kluwer Academic), 1–17.
Mayfield, M. M., Bonser, S. P., Morgan, J. W., Aubin, I., McNamara, S., and Vesk, P. A. (2010). What does species richness tell us about functional trait diversity? Predictions and evidence for responses of species and functional trait diversity to land-use change. Glob. Ecol. Biogeogr. 19, 423–431. doi: 10.1111/j.1466-8238.2010.00532.x
Mayfield, M. M., and Levine, J. M. (2010). Opposing effects of competitive exclusion on the phylogenetic structure of communities. Ecol. Lett. 13, 1085–1093. doi: 10.1111/j.1461-0248.2010.01509.x
McFadden, D. (1974). “Conditional logit analysis of qualitative choice behavior,” in Frontiers in Econometrics, ed P. Zarembka (New York, NY: Academic Press), 105–142.
McKinney, M. (2008). Effects of urbanization on species richness: a review of plants and animals. Urban Ecosyst. 11, 161–176. doi: 10.1007/s11252-007-0045-4
McKinney, M. L. (2006). Urbanization as a major cause of biotic homogenization. Biol. Conserv. 127, 247–260. doi: 10.1016/j.biocon.2005.09.005
Mendez, V., Gill, J. A., Burton, N. H. K., Austin, G. E., Petchey, O. L., and Davies, R. G. (2012). Functional diversity across space and time: trends in wader communities on British estuaries. Divers. Distribut. 18, 356–365. doi: 10.1111/j.1472-4642.2011.00868.x
Morelli, F., Benedetti, Y., Ibañez-Álamo, J. D., Jokimäki, J., Mänd, R., Tryjanowski, P., et al. (2016). Evidence of evolutionary homogenization of bird communities in urban environments across Europe. Glob. Ecol. Biogeogr. 25, 1284–1293. doi: 10.1111/geb.12486
Mouchet, M. A., Villéger, S., Mason, N. W. H., and Mouillot, D. (2010). Functional diversity measures: an overview of their redundancy and their ability to discriminate community assembly rules. Funct. Ecol. 24, 867–876. doi: 10.1111/j.1365-2435.2010.01695.x
Müller, N., Ignatieva, M., Nilon, C. H., Werner, P., and Zipperer, W. C. (2013). “Patterns and trends in Urban biodiversity and landscape design,” in Urbanization, Biodiversity and Ecosystem Services: Challenges and Opportunities. A Global Assessment, eds T. Elmqvist, M. Fragkias, J. Goodness, B. Güneralp, P. J. Marcotullio, R. I. Mcdonald, S. Parnell, M. Schewenius, M. Sendstad, K. C. Seto, and C. Wilkinson (Dordrecht; Heidelberg; London; NewYork, NY: Springer), 123–174.
Natuhara, Y., and Imai, C. (1996). Spatial structure of avifauna along urban-rural gradients. Ecol. Res. 11, 1–9. doi: 10.1007/BF02347814
Norton, B. A., Evans, K. L., and Warren, P. H. (2016). Urban biodiversity and landscape ecology: patterns, processes and planning. Curr. Lands. Ecol. Rep. 1, 178–192. doi: 10.1007/s40823-016-0018-5
ORNL DAAC (2011). MODIS Subsetted Land Products, Collection 5. Available online at: http://daac.ornl.gov/MODIS/modis.html (accessed 11, 2012).
Pautasso, M., Böhning-Gaese, K., Clergeau, P., and Cueto, V. R. (2011). Global macroecology of bird assemblages in urbanized and semi-natural ecosystems. Glob. Ecol. Biogeogr. 20, 426–436. doi: 10.1111/j.1466-8238.2010.00616.x
Pauw, A., and Louw, K. (2012). Urbanization drives a reduction in functional diversity in a guild of nectar-feeding birds. Ecol. Soc. 17:27. doi: 10.5751/es-04758-170227
Pellissier, V., Cohen, M., Boulay, A., and Clergeau, P. (2012). Birds are also sensitive to landscape composition and configuration within the city centre. Landsc. Urban Plan. 104, 181–188. doi: 10.1016/j.landurbplan.2011.10.011
Petchey, O. L., Evans, K. L., Fishburn, I. S., and Gaston, K. J. (2007). Low functional diversity and no redundancy in British avian assemblages. J. Anim. Ecol. 76, 977–985. doi: 10.1111/j.1365-2656.2007.01271.x
Petchey, O. L., and Gaston, K. J. (2002). Functional diversity (FD), species richness and community composition. Ecol. Lett. 5, 402–411. doi: 10.1046/j.1461-0248.2002.00339.x
Petchey, O. L., and Gaston, K. J. (2007). Dendrograms and measuring functional diversity. Oikos 116, 1422–1426. doi: 10.1111/j.0030-1299.2007.15894.x
Pla, L., Casanoves, F., and Di Rienzo, J. (2012). “Introduction,” in Quantifying Functional Biodiversity (Dordrecht: Springer), 1–8.
Pontarp, M., and Petchey, O. L. (2016). Community trait overdispersion due to trophic interactions: concerns for assembly process inference. Proc. R. Soc. B. 283:20161729. doi: 10.1098/rspb.2016.1729
R Core Team (2015). R: A Language and Environment for Statistical Computing. Vienna: R Foundation for Statistical Computing.
Ripley, B. (2016). Tree: Classification and Regression Trees. R package version 1.0-37. Available online at: https://CRAN.R-project.org/package=tree
Schütz, C., and Schulze, C. H. (2015). Functional diversity of urban bird communities: effects of landscape composition, green space area and vegetation cover. Ecol. Evol. 5, 5230–5239. doi: 10.1002/ece3.1778
Seto, K., Güneralp, B., and Hutyra, L. (2012). Global forecasts of urban expansion to 2030 and direct impacts on biodiversity and carbon pools. Proc. Natl. Acad. Sci. U.S.A. 109, 16083–16088. doi: 10.1073/pnas.1211658109
Silva, C., García, C., Estay, S., and Barbosa, O. (2015). Bird richness and abundance in response to Urban form in a Latin American City: Valdivia, Chile as a case study. PLoS ONE 10:e0138120. doi: 10.1371/journal.pone.0138120
Sol, D., Gonzalez-Lagos, C., Moreira, D., Maspons, J., and Lapiedr, O. (2014). Urbanisation tolerance and the loss of avian diversity. Ecol. Lett. 17, 942–950. doi: 10.1111/ele.12297
Sol, D., Lapiedra, O., and Gonzalez-Lagos, C. (2013). Behavioural adjustments for a life in the city. Anim. Behav. 85, 1101–1112. doi: 10.1016/j.anbehav.2013.01.023
Threlfall, C. G., Ossola, A., Hahs, A. K., Williams, N. S. G., Wilson, L., and Livesley, S. J. (2016). Variation in vegetation structure and composition across urban green space types. Front. Ecol. Evol. 4:66. doi: 10.3389/fevo.2016.00066
Tratalos, J., Fuller, R. A., Evans, K. L., Davies, R. G., Newson, S. E., Greenwood, J. J. D., et al. (2007). Bird densities are associated with household densities. Glob. Chang. Biol. 15, 1685–1695. doi: 10.1111/j.1365-2486.2007.01390.x
Trindade-Filho, J., Sobral, F. L., Cianciaruso, M. V., and Loyola, R. D. (2012). Using indicator groups to represent bird phylogenetic and functional diversity. Biol. Conserv. 146, 155–162. doi: 10.1016/j.biocon.2011.12.004
Trisos, C. H., Petchey, O. L., and Tobias, J. A. (2014). Unraveling the interplay of community assembly processes acting on multiple niche axes across spatial scales. Am. Nat. 184, 593–608. doi: 10.1086/678233
United Nations Human Settlements Programme (2006). State of the World's Cities 2006/7. London: Earthscan.
Villéger, S., Miranda, J. R., Hernández, D. F., and Mouillot, D. (2010). Contrasting changes in taxonomic vs. functional diversity of tropical fish communities after habitat degradation. Ecol. Appl. 20, 1512–1522. doi: 10.1890/09-1310.1
Webb, C. O. (2000). Exploring the phylogenetic structure of ecological communities: an example for rain forest trees. Am. Nat. 156, 145–155. doi: 10.1086/303378
Keywords: bird community, habitat loss, functional diversity, land sparing and land sharing, species trait, urbanization, urban and non-urban comparison
Citation: Oliveira Hagen E, Hagen O, Ibáñez-Álamo JD, Petchey OL and Evans KL (2017) Impacts of Urban Areas and Their Characteristics on Avian Functional Diversity. Front. Ecol. Evol. 5:84. doi: 10.3389/fevo.2017.00084
Received: 15 March 2017; Accepted: 12 July 2017;
Published: 28 July 2017.
Edited by:
Amanda D. Rodewald, Cornell University, United StatesReviewed by:
Alexander Charles Lees, Manchester Metropolitan University, United KingdomRubén Ortega-Álvarez, National Autonomous University of Mexico, Mexico
Copyright © 2017 Oliveira Hagen, Hagen, Ibáñez-Álamo, Petchey and Evans. This is an open-access article distributed under the terms of the Creative Commons Attribution License (CC BY). The use, distribution or reproduction in other forums is permitted, provided the original author(s) or licensor are credited and that the original publication in this journal is cited, in accordance with accepted academic practice. No use, distribution or reproduction is permitted which does not comply with these terms.
*Correspondence: Emily Oliveira Hagen, emily.o.hagen@outlook.com