Population Dynamics and Transcriptomic Responses of Chorthippus albonemus (Orthoptera: Acrididae) to Herbivore Grazing Intensity
 Xinghu Qin1,2,3
  Jingchuan Ma1,3
  Xunbing Huang1,3 Robert L. Kallenbach4 T. Ryan Lock4
  Md. Panna Ali5
  Zehua Zhang1,3*
- 1State Key Laboratory for Biology of Plant Diseases and Insect Pests, Institute of Plant Protection, Chinese Academy of Agricultural Sciences, Beijing, China
- 2School of Biology, University of St Andrews, East Sands, St Andrews, United Kingdom
- 3Scientific Observation and Experimental Station of Pests in Xilingol Rangeland, Ministry of Agriculture, Institute of Plant Protection, Chinese Academy of Agricultural Sciences, Xilinhot, China
- 4Division of Plant Sciences, University of Missouri, Columbia, MO, United States
- 5Entomology Division, Bangladesh Rice Research Institute (BRRI), Gazipur, Bangladesh
Livestock grazing can trigger outbreaks of insect pests in steppe ecosystems of Inner Mongolia in China. However, the physiological responses of the grasshopper Chorthippus albonemus to grazing are not well-understood. Here we investigated the effects of sheep grazing on the population dynamics and transcriptomic response of C. albonemus. We collected the insects three times (about 20 days apart) in 1.33-ha plots in which there were no grazing, light grazing, moderate grazing, heavy grazing, or overgrazing. Our results showed that continuous grazing significantly decreased plant biomass and influenced plant succession. Total insect species diversity significantly declined along the grazing intensity gradient and over time. Results of the first two collections of C. albonemus indicated that moderate grazing significantly increased the abundance of C. albonemus. However, abundance was significantly decreased in plots that were overgrazed, possibly because of food stress and environmental pressures. Under moderate grazing, betA and CHDH genes were significantly upregulated in C. albonemus. In response to higher grazing intensity, upregulated genes included those involved in serine-type peptidase activity, anatomical structure development, and sensory organ development; downregulated genes included those involved in the structural constituents of the ribosome and ribosome processes. Genes strongly upregulated in response to heavy grazing pressure included adaptive genes such as those encoding ankyrin repeat domain-containing protein and HSP. These findings improve our understanding of the role of the transcriptome in C. albonemus population response to livestock grazing and may provide useful targets for grasshopper control.
Introduction
Grasslands provide many essential ecosystem services, are important for socioeconomic development, and support a diverse range of plants and animals (Kang et al., 2007). However, these ecosystems are especially sensitive to anthropogenic activity, especially livestock grazing. Grasshopper is one of the most dominant taxa in Inner Mongolian Plateau and an important component of the grassland ecosystem (Zhou et al., 2011). Some grasshoppers like Chorthippus albonemus, Oedaleus asiaticus feed widely on plants in the Gramineae family (e.g., Stipa bungeana, Leymus secalinus) and occasionally on Artemisia frigid and Artemisia scoparia, having great influences on the grassland plant composition. Although some grasshopper species have disappeared on heavily grazed grasslands, others such as C. albonemus remain prosperous (Shuhua et al., 2014). Because of heavy livestock grazing and other anthropogenic practices, grasshopper outbreaks have increased in frequency, causing considerable losses in grass yields and posing a threat to animal husbandry (Cease et al., 2012; Chen et al., 2012). In addition, the large-scale degradation of grassland ecosystems in areas with fragile environmental conditions has led to frequent dust storms (Tao, 2004).
Livestock grazing has a significant effect on plant composition and microenvironments in natural grassland habitats (Joern, 2005; Branson et al., 2006), and grassland degradation and desertification resulting from long-term livestock grazing strongly affects grasshopper diversity and abundance (Hao et al., 2015). Numerous studies have investigated the relationship between livestock grazing and grasshopper community composition in grassland ecosystems around the world (Hao et al., 2015; Joubert et al., 2016), with some studies reporting that livestock grazing has positive effects on grasshopper diversity (Jerrentrup et al., 2014; Zhong et al., 2014; Joubert et al., 2016), and others reporting negative effects (Quinn and Walgenbach, 1990; Onsager, 2000). Several recent studies have demonstrated that livestock grazing decreases grasshopper diversity and increases the abundance of the main pest species. One study showed that grasshopper abundance was lowest and diversity was highest in plant communities with intermediate levels of biomass and plant species richness (Hao et al., 2015). Another study found that heavy livestock grazing promotes grasshopper outbreaks by lowering the nitrogen content of plants (Cease et al., 2012). Environmental fluctuations and habitat degradation caused by anthropogenic disturbances alter plant diversity, food quality, plant structure, microenvironment, and C: N: P stoichiometry in grassland habitats (Kruess and Tscharntke, 2002; Torrusio et al., 2002; Gebeyehu and Samways, 2003; Zhang et al., 2011), which in turn exert strong directional selection on grasshoppers. Rapid local adaptation by grasshoppers may involve physiological changes. In addition, alterations in the grasshopper transcriptome may improve survival, change its behavior, and increase the likelihood that it will form swarms. Therefore, a better understanding of the effect of environmental disturbances on the transcriptomic response of grasshoppers is crucial for grassland conservation and protection.
According to the intermediate disturbance hypothesis (IDH), ecological disturbances strongly influence patterns of species diversity, with maximum diversity observed at intermediate levels of disturbance (MacKey and Currie, 2001). According to this hypothesis, each habitat has a distinct level of species diversity and susceptibility to anthropogenic disturbances. The IDH is supported by studies of a variety of species and ecosystems (Flöder and Sommer, 1999; Molino and Sabatier, 2001; Roxburgh et al., 2004; Yuan et al., 2016), including a temperate grassland ecosystem (Yuan et al., 2016). However, numerous empirical studies have described a variety of diversity-disturbance relationships (MacKey and Currie, 2001; Cadotte, 2007; Randall Hughes et al., 2007; Hall et al., 2012). Some researchers believe that the IDH should be abandoned on empirical and theoretical grounds (Randall Hughes et al., 2007; Fox, 2013), whereas other researchers believe the data support the extension and refinement of the IDH (Randall Hughes et al., 2007) and suggest that the IDH forms the basis for the competition-colonization trade-off theory (Sheil and Burslem, 2013). According to Fox (2013), temporal variation can promote coexistence if the average per-capita growth rates depends non-additively on temporal variation (Fox, 2013). However, according to Sheil and Burslem (2013), the IDH does not claim that all stages are necessarily present in a succession, nor does the IDH apply to mobile organisms (Sheil and Burslem, 2013).
As such, do mobile organisms such as grasshoppers conform to IDH? How do mobile organisms perform along temporal scale under different disturbance intensity? What's the molecular events underlining this abundance-disturbance relationship? These questions are still not clear and are interesting extensions for IHD. Insects are important parts of the grassland ecosystem stability; however, little is known about their temporal and physiological responses to heavy grazing. In this study, we chose grassland insect community to test the above hypothesis, and used a mobile organism, Chorthippus albonemus as a model species to demonstrate the effect of grazing disturbance on grasshopper abundance and transcriptomic response. This gives us an opportunity to examine not just the assumptions and predictions of diversity, but also the details of temporal patterns and its underlying mechanisms from ecological and molecular perspective.
Materials and Methods
Study Site
The study site is located at an altitude of 1,121 m in the eastern Eurasian steppe at the grassland ecological protection and sustainable utilization research station of the Institute of Grassland Research, Chinese Academy of Agricultural Sciences, Inner Mongolia, China (116°32′E, 44°15′N). The site has a semiarid continental climate with a mean annual temperature of −0.1°C and annual precipitation of 350–450 mm. The coldest month is January (mean temperature: −22.0°C, minimum: −41°C), the hottest month is July (mean temperature: 18.3°C, maximum: 38.5°C), and the annual accumulated temperature is ~2,100–2,400°C.
The major soil types of the study site are calcic chestnut and calcic chernozem. The vegetation is typical of this region and is dominated by two perennial grasses, Leymus chinensis and Stipa grandis. Other common species include the perennial plants Cleistogenes squarrosa and A. frigida and the annual plants Chenopodium glaucum and Salsola collina. The study site was not grazed from 2007 to 2014. Sheep grazing began in 2014, the same year as insect collection. The C. albonemus investigation and transcriptome were conducted in 2015, from early July to middle August.
Experimental Design
A relatively flat area with homogenous soil conditions was enclosed in 2014, and a total of sixteen 1.33-ha enclosures (100 × 125 m) were constructed with 1.5-m high iron netting to prevent the movements of sheep in and out of the enclosures. Fifteen enclosures were randomly assigned to five treatments: control, light grazing, moderate grazing, heavy grazing, and overgrazing with three replicates per treatment (one enclosure held the meteorological station). According to local grazing management practices, the number of sheep in the control, light grazing, moderate grazing, heavy grazing, and overgrazing plots were 0, 4, 8, 12, 16 per enclosure, which corresponding to 0, 2, 6, 9, 12 individuals per hectare, respectively (Schönbach et al., 2011). Sheep were allowed to graze in the enclosures from June 10, 2014 to September 10, 2015. All animals used in the experiment were provided by the Chinese Academy of Agricultural Sciences.
Vegetation Survey
Vegetation was sampled at maximum biomass in early August 2015. In five randomly selected quadrats (1 × 1 m) within each plot, we evaluated the following attributes of each plant species: cover (estimated visually), height (determined by using measuring tape), density (number of plants/quadrat), and biomass (g/m2). Above-ground biomass was measured by clipping standing plant material to 1 cm above ground level using shears. The litter was combed out, and the plants were separated by species, stored temporarily in paper envelopes, and then dried in the laboratory for 48 h at 80°C to obtain the dry weight. Plant samples were not taken within about 10 m of the enclosure wall to avoid the effect of heat from the galvanized iron netting.
Insect Survey
We evaluated insect diversity from 2014 to 2015. In Xiwu Banner, Inner Mongolia, C. albonemus occurs from late June to late August. According to its life cycle dynamics, samples were collected three times from early July to mid-August (every 20 days) in 2015 corresponding to C. albonemus's early, middle, and late stages. We used the sweep method, which collects all insects, in each of the 15 plots to estimate insect species richness and abundance. In each plot, 200 nets were used to collect insects, and each collection was replicated three times. Insects were collected at least 10 m from the plot boundary to minimize edge effects. We checked the nets visually to ensure that we gathered all insects. The insects were collected only under favorable conditions (sunny days with minimal cloud cover, calm or no wind) from 09:00 to 15:00 h, and the plots were randomly sampled. The contents of the nets were preserved in Ziploc bags. All individuals identified as C. albonemus were counted.
C. albonemus Tissue Collection for Transcriptome Analysis
Grasshoppers were randomly selected from samples collected in late July in each of the five grazing intensity treatments for a total of 20 samples (2 females and 2 males per treatment × 5 treatments = 20 samples). Grasshoppers were frozen in liquid nitrogen (Air Liquide, Voyageur 12) and stored at −80°C until RNA extraction.
Preparation and Sequencing of cDNA Libraries
For each of the five grazing treatments, equal amounts of body tissue (head, thorax, abdomen, legs, and ovaries) from the four individuals were combined and homogenized. Total RNA was extracted using TRIzol reagent (Invitrogen, CA, USA) following the manufacturer's instructions. RNA quality (degradation and contamination) was determined by agarose gel electrophoresis, and purity was determined by using a NanoDrop™ 2000 spectrophotometer (Thermo Fisher Scientific). RNA concentration was determined by using a Qubit H 2.0 Fluorometer (Life Technologies), and RNA integrity was determined by using an Agilent 2100 Bioanalyzer (Agilent Technologies). RNA was extracted using RNAprep pure Tissue Kit (TIANGEN Biotech Co., Ltd., China). The RNA samples were enriched for mRNA using magnetic beads conjugated to oligo (dT) and fragmented into 400- to 600-bp fragments, which were used as a template for first-strand and second-strand cDNA synthesis. The double-stranded cDNA was then purified using AMPure XP beads. After end repair of the double-stranded cDNA, a poly A tail was added, followed by the ligation of sequencing adapters. The cDNA fragments were then selected based on size (150–200 bp) using AMPure XP beads and amplified by PCR. The PCR products were purified using AMPure XP beads to generate the cDNA libraries, which were sequenced using the Illumina HiSeq 2000 platform and the NGS Fast DNA Library Prep Set for Illumina. The paired-end method was used, and the sequencing read length was 200 bp.
The G+C content was measured for each sequencing cycle to determine whether the A+T and G+C levels differed. Using the Illumina HiSeq™ 2000 platform, the relationship between the sequencing error rate (e) and base quality (Qphred) can be described as follows:
The relationship between base call accuracy and Phred score was calculated using Illumina Casava version 1.8.
To produce clean reads for subsequent assembly and analyses, adapter sequences and low-quality data were removed from the raw data as follows: (1) remove/trim the adapters, (2) discard data for which the percentage of Ns (bases that could not be identified) exceeds 10%, and (3) discard low-quality data (for which the percentage of Qphred < 5 bases exceeds 50%).
Transcript Assembly
Transcript assembly was carried out using Trinity software version v2012-10-05 (Iyer et al., 2011) at min kmercov = 2; default settings were used for the remaining parameters. The assembly process was previously described (Grabherr et al., 2011). The sequences assembled by Trinity were used as reference sequences for the subsequent analysis. Trinity combined reads with a certain length of overlap to form longer fragments without N (contigs), which were subjected to further sequence clustering to form longer sequences without N. For each gene, the longest assembled sequence [more than one assembled sequence (transcript) for each gene] was regarded as a unigene.
Annotation
BLAST searches against the NCBI non-redundant-redundant (NR) and nucleotide sequence (NT) databases, SWISS-PROT, PFAM, KEGG, and KOG were performed with a cut-off of 1e-5. GO terms were assigned using Blast2GO version 2.5 (Götz et al., 2008) by searching the NR database.
Reference Transcriptome Assembly and Annotation
Data from each treatment were combined for the reference assembly. Supplementary Table 8 lists the software and parameters used for non-reference transcriptome assembly and analysis.
Gene Expression Analysis
Clean reads for each sample were mapped onto the reference transcriptome using RSEM software (Li and Dewey, 2011). The read count for each gene was converted to FPKM using the estimation method (Mortazavi et al., 2008). To verify the expression profile of each sample, an FPKM density plot was generated. To analyze read count data and identify differentially expressed genes under different grazing intensity treatments, FPKM in the different grazing intensity plots were compared using DEGSeq and a cutoff value of p adj < 0.005 (Mortazavi et al., 2008).
GO Enrichment Analysis
GO enrichment analysis of the differentially expressed genes was carried by using the GOseq procedure, which is based on the Wallenius non-central hypergeometric distribution (Young et al., 2010), to adjust for gene length bias.
KEGG Pathway Analysis of Differentially Expressed Genes
To identify the main biochemical and signal transduction pathways in which differentially expressed genes were involved, pathway enrichment analysis was performed using the KEGG database. KEGG items were mapped using hypergeometric test (Young et al., 2010). FDR corrections were performed for correcting q-value using Benjamini and Hochberg (Shringarpure, 2012). Downstream products of differentially expressed genes were evaluated to identify the substrate associated with the response to grazing intensity. The differentially expressed genes were filtered with q < 0.005 & |log2 (foldchange)| > 1 (Supplementary Table 8).
Statistical Analyses
Principal component analysis was used to evaluate relationships between grasshopper number, vegetation variation, and grazing intensity using the program CANOCO 4.5 (Ter Braak and Smilauer, 2002). Experimental plots were sampled for grass-biomass per species data. The Monte Carlo permutation test was used (number of permutations 999, full model) to indicate the main factors and correlation. The principal component analysis plot (Figure 1) was constructed using CanoDraw 4.5. Other figures were constructed using Microsoft Excel and Origin 8.0. Transcriptomic analyses parameters were listed in Supplementary Table 8.
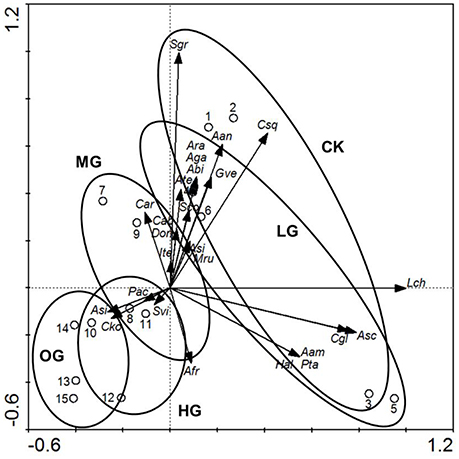
Figure 1. The ordination triplot of sample plots-plant species-grazing intensities. Arrows indicate plant species biomass. Ellipses indicate livestock grazing intensities. Open circles with numbers indicate plot numbers within grazing intensity. CK, control (no grazing); LG, light grazing (3 sheep/hectare); MG, moderate grazing (6 sheep/ hectare); HG, heavy grazing (9 sheep/ hectare); OG, overgrazing (12 sheep/ hectare). Plant name abbreviations are listed in Supplementary Table 9.
Results
Changes in Vegetation
The dominant plant species, grass cover (%), plant height (cm), and plant biomass (g) differed significantly (P < 0.05) between the following five grazing intensity levels: control (no grazing), light grazing (3 sheep/hectare), moderate grazing (6 sheep/hectare), heavy grazing (9 sheep/hectare), and overgrazing (12 sheep/hectare). In addition, grazing intensity influenced plant succession (Figure 1). Plant species that were dominant in the control plots (L. chinensis, S. grandis, and C. squarrosa) decreased significantly in biomass with increased grazing intensity (Figure 1). The shift in dominant plants occurred under moderate grazing intensity, with L. chinensis, S. grandis, and C. squarrosa replaced by Carex korshinskyi and Artemisia sieversiana as the dominant plant species in the heavy grazing and overgrazing plots. Compared with the control (no grazing) plots, species richness increased in the light grazing and moderate grazing plots and then decreased significantly in the heavy grazing and overgrazing plots (Figure 1).
Insect Species Richness and C. albonemus Temporal Variation
The total insect species diversity significantly declined along the grazing intensity gradient and over time (from 2014 to 2015), showing a significant linear relationship with sheep density (Figure 2A). C. albonemus abundance also varied according to grazing intensity (Figures 2B,C), demonstrating that grazing had a significant impact on the temporal dynamics of C. albonemus. In the five grazing intensities, C. albonemus abundance was generally lowest in the early sample (early July) and highest in the middle sample (late July; Figure 2). A quadratic correlation was observed between abundance and grazing intensity in the early and middle samples (early sample: df = 14, F = 8.47, P = 0.0051; middle sample: df = 13, F = 3.79, P = 0.0561). The abundance of C. albonemus was greatest in the moderate and heavy grazing plots in the early sample, and was greatest in the moderate grazing plots in the middle sample. In contrast, a negative linear relationship was observed between C. albonemus abundance and grazing intensity in the late sample (middle August; df = 14, F = 7.78, P = 0.0153). These results demonstrate that heavy grazing and overgrazing decreased the C. albonemus population size.
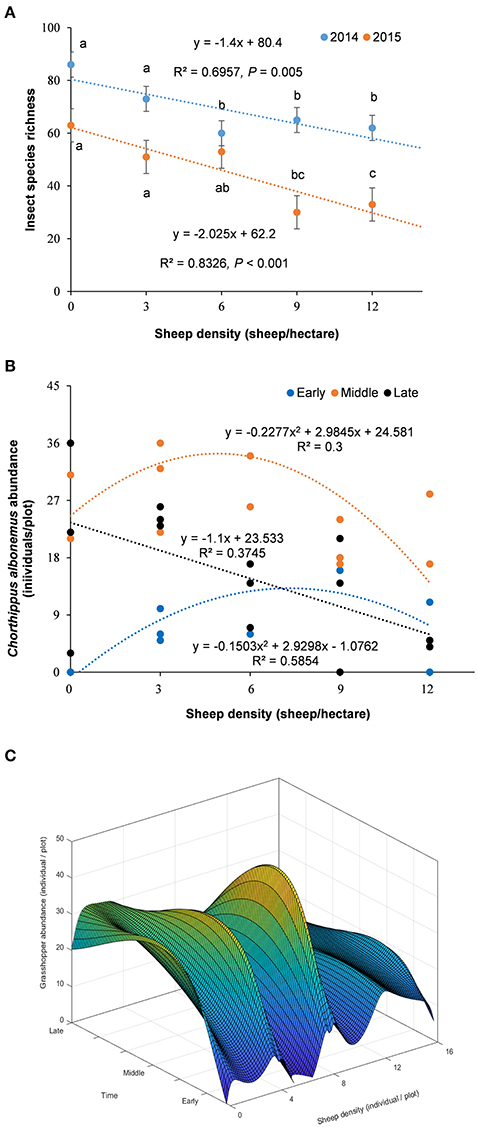
Figure 2. (A) Variation in total insect species richness across a grazing intensity gradient. Results are expressed as mean ± SE. The comparisons with different letters are for within-year at the significance of P < 0.05. (B) Chorthippus albonemus abundance under different grazing intensities. (C) Temporal dependent disturbance-abundance relationship. Early, early July; Middle, late July; Late, middle August.
Reference Transcriptome Assembly and Annotation
Sequencing of the C. albonemus adult transcriptome yielded more than 42,359,852 clean reads from the 43,962,497 raw reads, and a total of 154,164,934 nucleotides (transcripts; Supplementary Tables 1, 2). A set of 190,722 transcripts and 132,710 unique sequences were generated, with N50 values of 1,548 and 1,286, respectively (Supplementary Tables 2, 3; Supplementary Figure 1). As expected, half of the sequences annotated in the NCBI non-redundant protein sequence database matched those of insect species, including Tribolium castaneum (15.4%), Acyrthosiphon pisum (6.9%), and Pediculus humanus (6.5%; Supplementary Figure 2). Of the 39,090 (29.45%) unique sequences that were annotated through BLAST searches against the seven indicated databases (NR, NT, SWISS-PROT, PFAM, KEGG, KOG, and GO), 28,999 (21.85%) were annotated using the Gene Ontology (GO) database, and 4,530 were annotated using the nucleotide database (NT; Supplementary Table 4). In the EuKaryotic Orthologous Groups (KOG) database, 13,712 annotated genes were assigned to 26 groups; most of the annotated genes were categorized into the following groups: R, general functional prediction only (4,602 genes); T, signal transduction mechanisms (1,606 genes); and O, posttranslational modification, protein turnover, and chaperones (1,081 genes; Supplementary Table 5). The Kyoto Encyclopedia of Genes and Genomes (KEGG) Pathway database was used to annotate 8,600 genes, most of which were categorized as being involved in signal transduction (939 genes), translation (650 genes), or carbohydrate metabolism (550 genes; Figure 3A). The transcriptome data of C. albonemus was submitted to the NCBI Sequence Read Archive (SRA) database (ID: SRP058368).
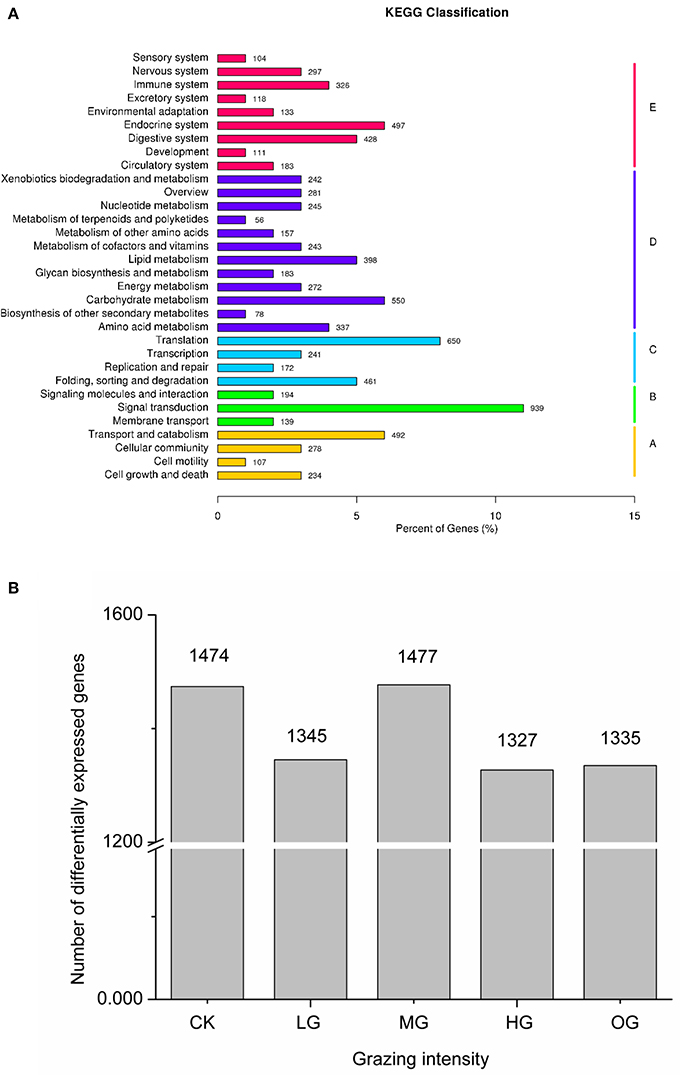
Figure 3. (A) KEGG classification. The X-axis indicates the percentage of genes accounting for the KEGG items, and the Y-axis indicates the KEGG items. A, B, C, D, E indicate cellular processes, environmental information processing, genetic information processing, metabolism, organismal systems, respectively. (B) Number of differentially expressed genes of Chorthippus albonemus in response to different levels of grazing intensity. CK, indicates control (no grazing); LG, light grazing; MG, moderate grazing; HG, heavy grazing; OG, overgrazing.
Transcript Levels of C. albonemus along a Grazing Intensity Gradient
Transcript levels of C. albonemus differed according to grazing intensity, as assessed by fragments per kilobase per million (FPKM) mapped reads. The FPKM distributions of the five grazing intensity plots were similar, with the histogram showing a peak on either side of zero. The highest transcript level was observed in the heavy grazing plots (Supplementary Figure 3). The highest number of differentially expressed genes was observed in the moderate grazing plots (Figure 3B), and the lowest number in the heavy grazing and overgrazing plots. Results of gene cluster analyses showed similar gene expression patterns in grasshoppers collected in the control plots (no grazing) and moderate grazing plots, with greater numbers of genes identified (Figure 4A). Gene expression patterns were similar between the heavy grazing and overgrazing plots, and more downregulated genes were observed in C. albonemus collected in these plots. Analysis of genes involved in stress response associated with grazing pressure and grasshopper population dynamics showed the upregulation of certain genes with increased grazing intensity (Figures 4B,C), such as polyprotein-like protein, ankyrin repeat domain-containing protein, eupolytin, and late trypsin (Supplementary Data 1). Genes that were downregulated with increased grazing intensity (Figures 4D,E) included yellow-g protein, cadherin-related tumor suppressor-like protein, ribosomal protein S5, and cuticle protein (Supplementary Data 1). To identify the biological functions of these gene products, the differentially expressed genes were mapped to the GO and KEGG databases. More than 20 pathways were enriched by grazing treatment (P < 0.05) including galactose metabolism, lysosome, starch and sucrose metabolism, and other glycan degradation (Table 1).
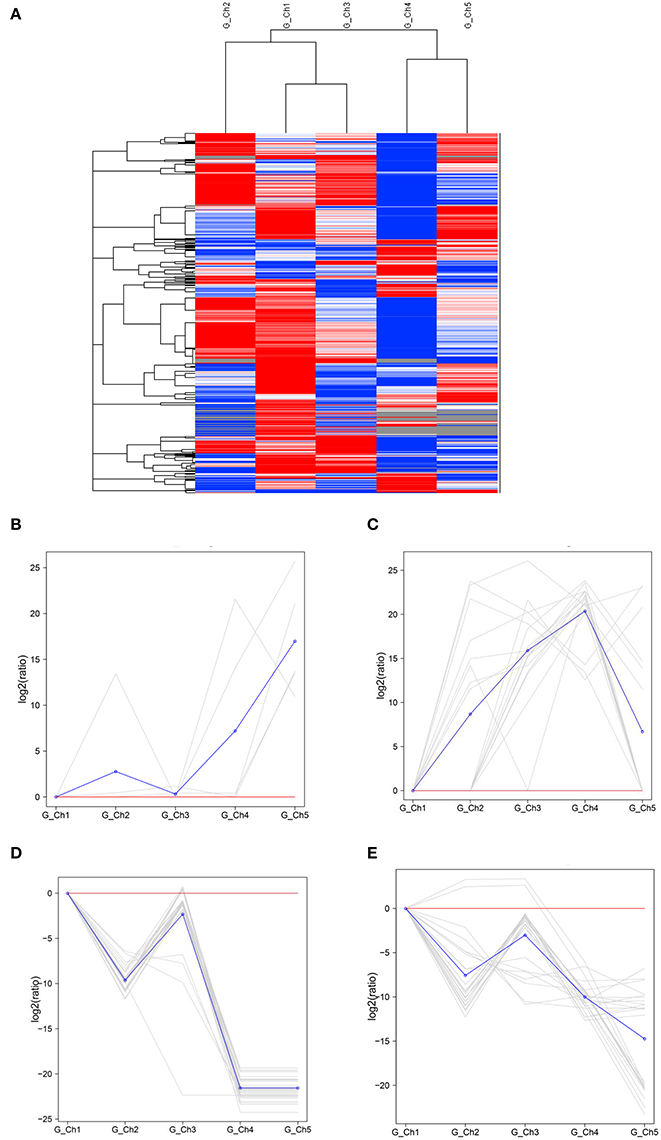
Figure 4. Gene expression patterns of Chorthippus albonemus in response to different levels of grazing intensity. (A) Clusters of differentially expressed genes. Red indicates upregulated genes, blue indicates downregulated genes, and white indicates no difference in gene expression. Differences in color intensity indicate higher or lower expression [log10 (FPKM+1)]. Two patterns were observed for upregulated gene expression, involving (B) a cluster of five genes and (C) a cluster of 16 genes. Two patterns were observed for downregulated gene expression, involving (D) a cluster of 30 genes and (E) a cluster of 23 genes. The gray lines indicate gene expression under different grazing intensities relative to the no grazing control [gene log2 (ratios)], and the blue lines indicate average relative expression of all genes in the cluster. Significant differential expression was set at q < 0.005, |log2 fold change| >1. G_Ch1 to G_Ch5 indicate grazing intensity, namely, no grazing (G_Ch1), light grazing (G_Ch2), moderate grazing (G_Ch3), heavy grazing (G_Ch4), and overgrazing (G_Ch5), respectively.
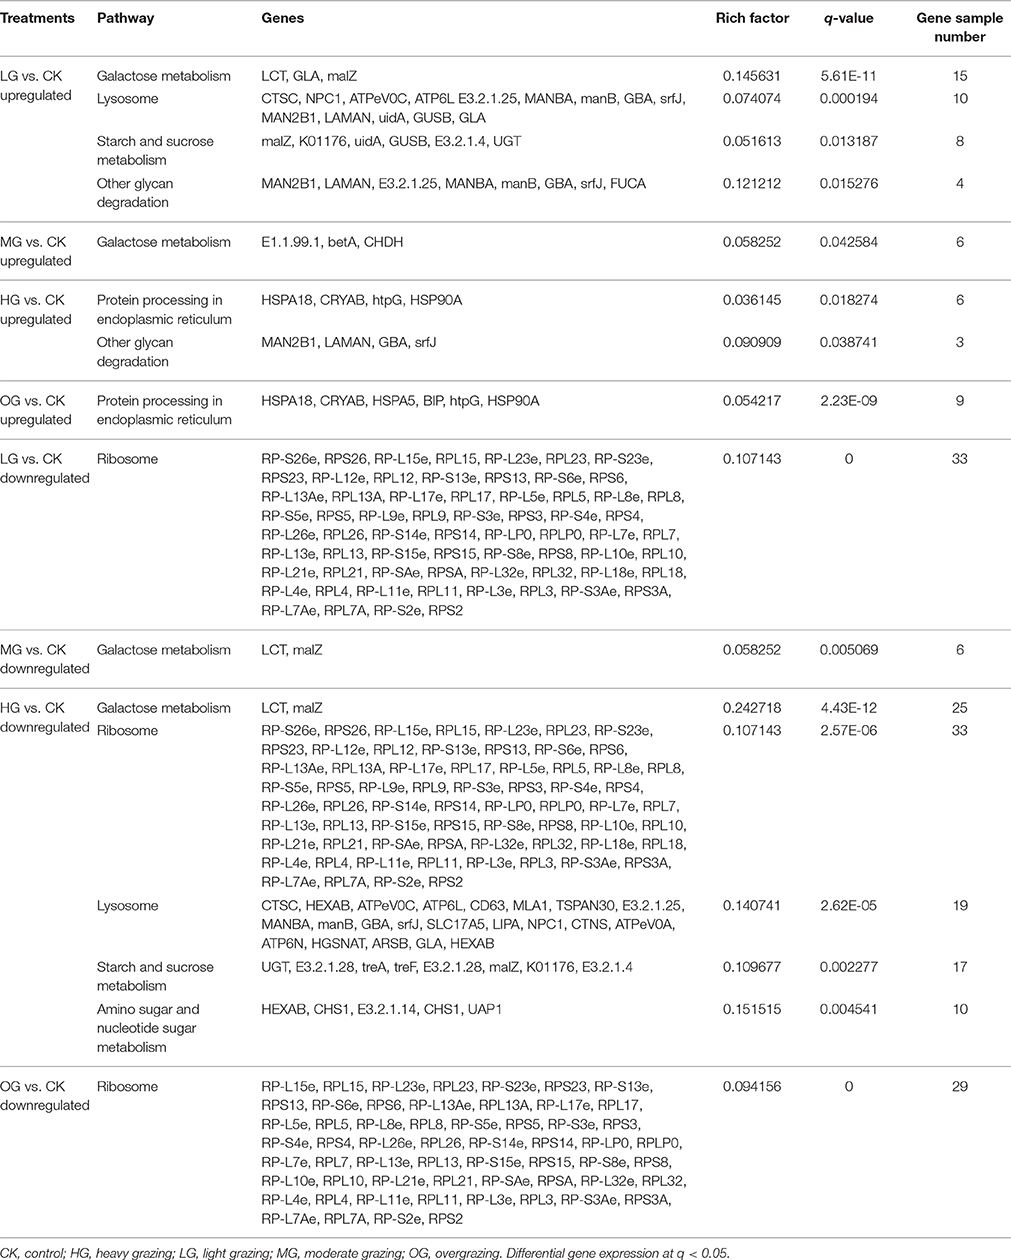
Table 1. KEGG pathways in Chorthippus albonemus affected by grazing intensity.
Gene Ontology Annotation
A total of 28,999 unigenes of C. albonemus were subcategorized into 50 GO classes (Supplementary Table 6). Most of these transcripts were assigned to biological processes (47.65%), cellular components (29.89%), or molecular function (22.46%). In the biological processes category, many of the transcripts appear to be involved in cellular processes (16,580 genes, 22.04%). In the cellular components category, many of the transcripts appear to be involved in cell biology (8,967 genes, 19.00%). In the molecular function category, many of the transcripts appear to be involved in binding (16,593 genes, 46.81%; Supplementary Table 6). Compared with gene expression in the control plots (no grazing), the highest number of upregulated genes were observed in the light grazing plots. They included genes involved in serine-type, peptidase activity, serine hydrolase activity, peptidase activity acting on L-amino acid peptides, and hydrolase activity (Supplementary Table 7). Genes upregulated in the moderate grazing plots were involved in chitin binding, chitin metabolic processes, glucosamine-containing compound metabolic processes, carbohydrate derivative binding, and amino sugar metabolic processes. Genes upregulated in the heavy grazing plots included those involved in serine-type endopeptidase activity, serine-type peptidase activity, serine hydrolase activity, multicellular organism reproduction, and lipid transporter activity. Genes upregulated in the overgrazing plots included those involved in structural constituents of eye lens, single-organism developmental processes, anatomical structure development, sensory organ development, and developmental process metabolism. Compared with gene expression in the control plots, downregulated genes in the moderate grazing plots belonged to only two categories: structural constituents of cuticle and structural molecule activity (Supplementary Table 7). Downregulated genes in other grazing treatments were involved in structural constituents of ribosome, ribosome biogenesis, ribonucleoprotein complex biogenesis, translation, ribosome, chitin binding, and chitin metabolic processes (Supplementary Table 7).
KEGG Pathway Enrichment
KEGG pathway analysis provided insight into the transcriptional responses to grazing intensity. Upregulated genes in the light grazing plot were primarily involved in galactose metabolism, lysosome, starch, and sucrose metabolism, and other glycan degradation (Table 1). Only three genes involved in galactose metabolism (E1.1.99.1, betA, CHDH) were significantly upregulated in the moderate grazing intensity plot. Genes encoding proteins that are processed in the endoplasmic reticulum (e.g., MAN2B1, HSP) were significantly enriched in the high grazing and overgrazing plots (Table 1). Most of the downregulated genes in plots other than the moderate grazing plots were associated with ribosomes; they included RP-S26e, RPS26, RP-L15e, RPL15, RP-L23e, RPL23, RP-S23e, and RPS23, RP-L12e (q < 0.05; Table 1). Downregulated genes in the moderate grazing plots included LCT and malZ, which are associated with galactose metabolism (q < 0.05). Other downregulated genes in heavy grazing plots included those involved in lysosomes, starch and sucrose metabolism, and amino sugar and nucleotide sugar metabolism.
Discussion
Livestock grazing has increasingly caused pest outbreaks and biodiversity losses in the steppe ecosystems of Inner Mongolia (Kang et al., 2007). Previous studies have described the effects of livestock grazing on grasshopper abundance, with some grasshopper species significantly increasing their abundance in grazing areas (Batáry et al., 2007; Cease et al., 2012; Gao et al., 2014; Jerrentrup et al., 2014; Hao et al., 2015). Although C. albonemus is a rare species in Central and South China, it is one of the main pest species in the Tibetan Plateau (Zhou et al., 2006). Grasshopper species composition, diversity, and abundance in grasslands have previously been described (Sun et al., 2015). However, no systematic studies have addressed the temporal dynamics and physiological responses of C. albonemus to grazing intensity in Inner Mongolia. In this study, we investigated population dynamics of C. albonemus and molecular mechanisms involved in habitat adaptation by evaluating its transcriptomic response to sheep grazing. We investigated diversity-disturbance relationships by combining various levels of biodiversity (plant community composition, population dynamics, and intraspecific responses to levels of disturbance). Insect species diversity didn't conform to IDH. But C. albonemus population dynamics showed a unimodal distribution similar to IDH pattern, with population size increasing significantly in plots with a moderate level of grazing in early and late July. However, a negative linear relationship between grazing intensity and population size was observed in the last sample (middle August). We propose that resource-dependent competition and physiological compensation are the main processes that account for these results.
Previous empirical studies have described various disturbance-diversity/abundance relationships, including polynomial and negative linear relationships, as shown in our study. Factors that influence these relationships include interspecific competition (Menge and Sutherland, 1987), trophic cascades (Polis, 1994), environmental fluctuations, and negative frequency dependence or stabilizing mechanisms (Chesson, 1994, 2000). Our results showed that total plant species diversity decreased as grazing intensity increased, whereas C. albonemus abundance rose during the early and middle stages of plant succession and declined during late succession. These diversity-disturbance relationships reflect different species responses to temporal changes in resources and environment (Roxburgh et al., 2004). A species may peak at intermediate disturbance levels because of a trade-off between competitive ability and colonizing ability. Although, total insect diversity decreased as grazing intensity increased in our study, C. albonemus abundance was highest at intermediate levels of disturbance, which might be described by resource-dependent competition: food resource partitioning and frequency-dependent predation due to plant composition change and species diversity decline, as well as fluctuations in population densities and environmental factors in space and time (Chesson, 1994, 2000; Figure 2C). The linear relationship indicates resource-dependent competitive exclusion (Armstrong and McGehee, 1980) and temporal stability (Lehman and Tilman, 2000), in which long-term species diversity depends on the average values of fluctuating environmental variables (i.e., food and microthermal).
Two-dimensional grasshopper abundance variations (Figure 2C) and the responses of two organismal levels suggest that C. albonemus abundance exhibited temporal disturbance (temporal variations in plant abundance and resource-dependent competition) and molecular responses (trophic cascades and physiological compensation).
From an ecological point of view, grazing resulted in rapid plant succession, with some dominant species decreasing in abundance, and other plant species becoming dominant. In addition, grazing creates a more suitable environment for grasshoppers by altering habitat structure and food availability (Kang and Chen, 1995). Furthermore, disturbance decreases total insect species diversity, thereby weakening competition (Chesson, 2000). Hence, resource-dependent competition is one mechanism underlying the grasshopper population fluctuations.
The physiological responses of C. albonemus were rapid, as demonstrated by the transcriptome analysis. Previous studies have shown that grasshopper life history traits can be strongly affected by plant nutritional status (Scriber and Slansky, 1981). Grasses contain more carbohydrates, which is especially important for grasshopper survival (Joern and Behmer, 1997). Heavy livestock grazing has been shown to lower plant nitrogen content, which is avoided by grasshoppers and decreases performance (Cease et al., 2012). However, our results show that higher grazing intensity decreases the abundance of preferred grasses and increases food stress, as demonstrated by the upregulation of genes involved in stress resistance, such as HSP and ankyrin repeat domain-containing protein. These gene patterns are consistent with C. albonemus population performance and dynamics, which can be explained by physiological compensation for changes of food quantity and nutritional pressure.
Management practices can strongly influence the health of grassland ecosystems (Ammann et al., 2007). Continuous grazing significantly decreases plant biomass and influences plant succession. In our study, we found that heavy grazing decreased the biomass of the dominant plants species L. chinensis, S. grandis, and C. squarrosa, which are the main foods of local herbivores and insects. A decrease in plant biomass, in turn, affects the temporal dynamics of insects (Huntly, 1991). The abundance of C. albonemus was found to be lowest in the overgrazing plots and highest in the moderate grazing plots (Figure 2), which is consistent with the results of previous studies of other grasshopper species (Kang and Chen, 1995; Cease et al., 2012; Hao et al., 2015). These results indicate that moderate grazing improves the habitat suitability for C. albonemus, increasing survival and the possibility of outbreaks. However, heavy grazing intensity increases the mortality of late-stage grasshopper and likely lowers the fecundity of adults because of the shortage of food.
The molecular mechanisms underlying the rapid population response and adaptation of C. albonemus to sheep grazing were investigated by analyzing the transcriptome, which revealed 1,477 differentially expressed genes across five grazing treatments. The highest transcript level was observed in grasshoppers collected in the heavy grazing plots (Supplementary Figure 3), and the highest number of differentially expressed genes was observed in grasshoppers collected in the moderate grazing plots (Figure 3B). The differentially expressed genes included adaptive genes such as polyprotein-like protein, ankyrin repeat domain-containing protein, eupolytin, late trypsin, yellow-g protein, cadherin-related tumor suppressor-like protein, ribosomal protein S5, and cuticle protein. Polyproteins have been reported to play a role in virus resistance in plants (Ponz et al., 1988; Reddy et al., 2001), but have not been well-studied in grasshoppers. Cuticular protein genes, which were upregulated in the high grazing and overgrazing plots, may play an important role in stress resistance, as demonstrated by changes in body cuticle that occur in response to environmental stress and poor food quality (Zhang et al., 2008). Furthermore, the upregulated genes were primarily involved in serine-type peptidase activity and chitin metabolic processes, whereas the downregulated genes were primarily involved in the structural constituents of cuticle, structural molecule activity, and the ribosome.
As an important part of rapid adaptation, transcriptomic response in grasshopper needs timely, and effective genes and pathways for regulation. Signatures indicate that galactose metabolism, lysosome, starch and sucrose metabolism, protein processing in endoplasmic reticulum are the key pathways involved in response to grazing, of which, LCT, GLA, malZ, betA, CHDH in galactose metabolism, CTSC, NPC1, ATPeV0C, ATP6L E3.2.1.25, MANBA, manB, GBA, srfJ, MAN2B1, LAMAN, uidA, GUSB, GLA in lysosome, malZ, K01176, GUSB, E3.2.1.4, UGT in starch and sucrose metabolism, and HSPA18, CRYAB, HSPA5, BIP, htpG, HSP90A in protein processing etc. are the key genes responsible for the regulation of the physiological change. These transcriptomic signatures illustrate the molecular basis of response to grazing pressure in C. albonemus.
Conclusions
In this study, we used large enclosures to study the effects of sheep grazing in the grasslands of Inner Mongolia on C. albonemus population dynamics and gene expression. We found that grazing affected habitat quality by decreasing plant abundance and quality and influencing plant succession. These effects point to resource-dependent competition explaining the unimodal disturbance-abundance dynamics with physiological compensation. Our results show that transcriptional changes in the grassland pest C. albonemus underlie its adaptation to livestock grazing. The identification of differentially expressed genes involved in adaptability may provide new targets for the control of grasshopper populations to improve grassland management.
Data Accessibility
The transcriptome data of C. albonemus were uploaded to the NCBI Sequence Read Archive database and have been released (ID: SRP058368).
Ethics Statement
All experimental protocols and animal studies were approved by the Institute of Plant Protection, Chinese Academy of Agricultural Sciences. We confirm that all experiments were carried out in accordance with the relevant guidelines and regulations.
Author Contributions
XQ, ZZ, and JM designed the experiments. XQ, JM, and XH performed the experiments. XQ and JM analyzed the data. XQ wrote the manuscript, and TL, RK, and MA revised the manuscript. All authors reviewed the manuscript and approved the final version submitted for publication.
Conflict of Interest Statement
The authors declare that the research was conducted in the absence of any commercial or financial relationships that could be construed as a potential conflict of interest.
The handling Editor declared a shared affiliation, though no other collaboration, with several of the authors XQ, XH, JM, ZZ.
Acknowledgments
We thank Novogene Bioinformatics Technology Co. for their bioinformatics sequencing. We thank Dr. Hunter for useful suggestions and comments. We thank Bai Xiu Hua and An Dong for their valuable assistance. This research was supported the earmarked fund for the China Agriculture Research System (CARS-34-07B), Innovation Project of Chinese Academy of Agricultural Sciences, National Nature Science Foundation of China (31672485), and the Postgraduate Study Abroad Scholarship Program from the China Scholarship Council.
Supplementary Material
The Supplementary Material for this article can be found online at: https://www.frontiersin.org/articles/10.3389/fevo.2017.00136/full#supplementary-material
References
Ammann, C., Flechard, C., Leifeld, J., Neftel, A., and Fuhrer, J. (2007). The carbon budget of newly established temperate grassland depends on management intensity. Agric. Ecosyst. Environ. 121, 5–20. doi: 10.1016/j.agee.2006.12.002
Armstrong, R. A., and McGehee, R. (1980). Competitive exclusion. Am. Nat. 115, 151–170. doi: 10.1086/283553
Batáry, P., Orci, K. M., Báldi, A., Kleijn, D., Kisbenedek, T., and Erdos, S. (2007). Effects of local and landscape scale and cattle grazing intensity on Orthoptera assemblages of the Hungarian Great Plain. Basic Appl. Ecol. 8, 280–290 doi: 10.1016/j.baae.2006.03.012
Branson, D. H., Joern, A., and Sword, G. A. (2006). Sustainable management of insect herbivores in grassland ecosystems: new perspectives in grasshopper control. Bioscience 56, 743–755. doi: 10.1641/0006-3568(2006)56[743:SMOIHI]2.0.CO;2
Cadotte, M. W. (2007). Competition–colonization trade-offs and disturbance effects at multiple scales. Ecology 88, 823–829. doi: 10.1890/06-1117
Cease, A. J., Elser, J. J., Ford, C. F., Hao, S., Kang, L., and Harrison, J. F. (2012). Heavy livestock grazing promotes locust outbreaks by lowering plant nitrogen content. Science 335, 467–469. doi: 10.1126/science.1214433
Chen, Y., Li, Y., Zhao, X., Awada, T., Shang, W., and Han, J. (2012). Effects of grazing exclusion on soil properties and on ecosystem carbon and nitrogen storage in a sandy rangeland of Inner Mongolia, Northern China. Environ. Manage. 50, 622–632. doi: 10.1007/s00267-012-9919-1
Chesson, P. (1994). Multispecies competition in variable environments. Theor. Popul. Biol. 45, 227–276. doi: 10.1006/tpbi.1994.1013
Chesson, P. (2000). Mechanisms of maintenance of species diversity. Annu. Rev. Ecol. Syst. 31, 343–366. doi: 10.1146/annurev.ecolsys.31.1.343
Flöder, S., and Sommer, U. (1999). Diversity in planktonic communities: an experimental test of the intermediate disturbance hypothesis. Limnol. Oceanogr. 44, 1114–1119. doi: 10.4319/lo.1999.44.4.1114
Fox, J. W. (2013). The intermediate disturbance hypothesis should be abandoned. Trends Ecol. Evol. 28, 86–92. doi: 10.1016/j.tree.2012.08.014
Gao, H., Gao, Y., and He, X. (2014). Impacts of grazing and mowing on reproductive behaviors of Stipa grandis and Stipa krylovii in a semi-arid area. J. Arid. Land. 6, 97–104. doi: 10.1007/s40333-013-0196-5
Gebeyehu, S., and Samways, M. J. (2003). Responses of grasshopper assemblages to long-term grazing management in a semi-arid African savanna. Agric. Ecosyst. Environ. 95, 613–622. doi: 10.1016/S0167-8809(02)00178-0
Götz, S., García-Gómez, J. M., Terol, J., Williams, T. D., Nagaraj, S. H., Nueda, M. J., et al. (2008). High-throughput functional annotation and data mining with the Blast2GO suite. Nucleic Acids Res. 36, 3420–3435. doi: 10.1093/nar/gkn176
Grabherr, M. G., Haas, B. J., Yassour, M., Levin, J. Z., Thompson, D. A., Amit, I., et al. (2011). Full-length transcriptome assembly from RNA-Seq data without a reference genome. Nat. Biotechnol. 29, 644–652. doi: 10.1038/nbt.1883
Hall, A. R., Miller, A. D., Leggett, H. C., Roxburgh, S. H., Buckling, A., and Shea, K. (2012). Diversity–disturbance relationships: frequency and intensity interact. Biol. Lett. 8, 768–771. doi: 10.1098/rsbl.2012.0282
Hao, S., Wang, S., Cease, A., and Kang, L. (2015). Landscape level patterns of grasshopper communities in Inner Mongolia: interactive effects of livestock grazing and a precipitation gradient. Landsc. Ecol. 30, 1657–1668. doi: 10.1007/s10980-015-0247-8
Huntly, N. (1991). Herbivores and the dynamics of communities and ecosystems. Annu. Rev. Ecol. Syst. 22, 477–503. doi: 10.1146/annurev.es.22.110191.002401
Iyer, M. K., Chinnaiyan, A. M., and Maher, C. A. (2011). ChimeraScan: a tool for identifying chimeric transcription in sequencing data. Bioinformatics 27, 2903–2904. doi: 10.1093/bioinformatics/btr467
Jerrentrup, J. S., Wrage-Mönnig, N., Röver, K. U., and Isselstein, J. (2014). Grazing intensity affects insect diversity via sward structure and heterogeneity in a long-term experiment. J. Appl. Ecol. 51, 968–977. doi: 10.1111/1365-2664.12244
Joern, A. (2005). Disturbance by fire frequency and bison grazing modulate grasshopper assemblages in tallgrass prairie. Ecology 86, 861–873. doi: 10.1890/04-0135
Joern, A., and Behmer, S. T. (1997). Importance of dietary nitrogen and carbohydrates to survival, growth, and reproduction in adults of the grasshopper Ageneotettix deorum (Orthoptera: Acrididae). Oecologia 112, 201–208. doi: 10.1007/s004420050301
Joubert, L., Pryke, J. S., and Samways, M. J. (2016). Positive effects of burning and cattle grazing on grasshopper diversity. Insect Conserv. Divers. 9, 290–301. doi: 10.1111/icad.12166
Kang, L., and Chen, Y. (1995). Dynamics of grasshopper communities under different grazing intensities in Inner Mongolian steppes. Insect Sci. 2, 265–281. doi: 10.1111/j.1744-7917.1995.tb00048.x
Kang, L., Han, X., Zhang, Z., and Sun, O. J. (2007). Grassland ecosystems in China: review of current knowledge and research advancement. Philos. Trans. R. Soc. Lond. B Biol. Sci. 997–1008. doi: 10.1098/rstb.2007.2029
Kruess, A., and Tscharntke, T. (2002). Grazing intensity and the diversity of grasshoppers, butterflies, and trap-nesting bees and wasps. Conserv. Biol. 16, 1570–1580. doi: 10.1046/j.1523-1739.2002.01334.x
Lehman, C. L., and Tilman, D. (2000). Biodiversity, stability, and productivity in competitive communities. Am. Nat. 156, 534–552. doi: 10.1086/303402
Li, B., and Dewey, C. N. (2011). RSEM: accurate transcript quantification from RNA-Seq data with or without a reference genome. BMC Bioinform. 12:323. doi: 10.1186/1471-2105-12-323
MacKey, R. L., and Currie, D. J. (2001). The diversity–disturbance relationship: is it generally strong and peaked? Ecology 82, 3479–3492. doi: 10.1890/0012-9658(2001)082[3479:TDDRII]2.0.CO;2
Menge, B. A., and Sutherland, J. P. (1987). Community regulation: variation in disturbance, competition, and predation in relation to environmental stress and recruitment. Am. Nat. 130, 730–757. doi: 10.1086/284741
Molino, J.-F., and Sabatier, D. (2001). Tree diversity in tropical rain forests: a validation of the intermediate disturbance hypothesis. Science 294, 1702–1704. doi: 10.1126/science.1060284
Mortazavi, A., Williams, B. A., McCue, K., Schaeffer, L., and Wold, B. (2008). Mapping and quantifying mammalian transcriptomes by RNA-Seq. Nat. Methods 5, 621–628. doi: 10.1038/nmeth.1226
Onsager, J. A. (2000). Suppression of grasshoppers in the Great Plains through grazing management. J. Range Manag. 592–602. doi: 10.2307/4003152
Polis, G. A. (1994). Food webs, trophic cascades and community structure. Austral. Ecol. 19, 121–136. doi: 10.1111/j.1442-9993.1994.tb00475.x
Ponz, F., Glascock, C. B., and Bruening, G. (1988). An inhibitor of polyprotein processing with the characteristics of a natural virus resistance factor. Mol. Plant Microbe Interact 1, 25–31. doi: 10.1094/MPMI-1-025
Quinn, M. A., and Walgenbach, D. (1990). Influence of grazing history on the community structure of grasshoppers of a mixed-grass prairie. Environ. Entomol. 19, 1756–1766. doi: 10.1093/ee/19.6.1756
Randall Hughes, A., Byrnes, J. E., Kimbro, D. L., and Stachowicz, J. J. (2007). Reciprocal relationships and potential feedbacks between biodiversity and disturbance. Ecol. Lett. 10, 849–864. doi: 10.1111/j.1461-0248.2007.01075.x
Reddy, M. S., Ghabrial, S. A., Redmond, C. T., Dinkins, R. D., and Collins, G. B. (2001). Resistance to Bean pod mottle virus in transgenic soybean lines expressing the capsid polyprotein. Phytopathology 91, 831–838. doi: 10.1094/PHYTO.2001.91.9.831
Roxburgh, S. H., Shea, K., and Wilson, J. B. (2004). The intermediate disturbance hypothesis: patch dynamics and mechanisms of species coexistence. Ecology 85, 359–371. doi: 10.1890/03-0266
Schönbach, P., Wan, H., Gierus, M., Bai, Y., Müller, K., Lin, L., et al. (2011). Grassland responses to grazing: effects of grazing intensity and management system in an Inner Mongolian steppe ecosystem. Plant Soil 340, 103–115. doi: 10.1007/s11104-010-0366-6
Scriber, J., and Slansky, F. Jr. (1981). The nutritional ecology of immature insects. Annu. Rev. Entomol. 26, 183–211. doi: 10.1146/annurev.en.26.010181.001151
Sheil, D., and Burslem, D. (2013). Defining and defending Connell's intermediate disturbance hypothesis: a response to Fox. Trends Ecol. Evol. 28, 571–572. doi: 10.1016/j.tree.2013.07.006
Shringarpure, S. (2012). Statistical Methods for Studying Genetic Variation in Populations. DTIC Document, Pittsburgh, PA.
Shuhua, W., Yu, Z., Rong, Z., Liyuan, G., Wenguang, H., and Yu, Z. (2014). Biological and ecological characteristics of Chorthippus albonemus Cheng et Tu (Orthoptera: Arcypteridae). Chin. J. Appl. Entomol. 6, 1633–1640. doi: 10.7679/j.issn.2095-1353.2014.192
Sun, T., Liu, Z., Qin, L., and Long, R. (2015). Grasshopper (Orthoptera: Acrididae) community composition in the rangeland of the northern slopes of the Qilian Mountains in Northwestern China. J. Insect Sci. 15:6. doi: 10.1093/jisesa/ieu171
Tao, W. (2004). Progress in sandy desertification research of China. J. Geogr. Sci. 14, 387–400. doi: 10.1007/BF02837482
Ter Braak, C. J., and Smilauer, P. (2002). CANOCO Reference Manual and CanoDraw for Windows User's Guide: Software for Canonical Community Ordination (Version 4.5). Available online at: http://www.canoco.com
Torrusio, S., Cigliano, M. M., and De Wysiecki, M. L. (2002). Grasshopper (Orthoptera: Acridoidea) and plant community relationships in the Argentine pampas. J. Biogeogr. 29, 221–229. doi: 10.1046/j.1365-2699.2002.00663.x
Young, M. D., Wakefield, M. J., Smyth, G. K., and Oshlack, A. (2010). Gene ontology analysis for RNA-seq: accounting for selection bias. Genome Biol. 11:R14. doi: 10.1186/gb-2010-11-2-r14
Yuan, Z., Jiao, F., Li, Y., and Kallenbach, R. L. (2016). Anthropogenic disturbances are key to maintaining the biodiversity of grasslands. Sci. Rep. 6:22132. doi: 10.1038/srep22132
Zhang, G., Han, X., and Elser, J. J. (2011). Rapid top–down regulation of plant C: N: P stoichiometry by grasshoppers in an Inner Mongolia grassland ecosystem. Oecologia 166, 253–264. doi: 10.1007/s00442-011-1904-5
Zhang, J., Goyer, C., and Pelletier, Y. (2008). Environmental stresses induce the expression of putative glycine-rich insect cuticular protein genes in adult Leptinotarsa decemlineata (Say). Insect Mol. Biol. 17, 209–216. doi: 10.1111/j.1365-2583.2008.00796.x
Zhong, Z., Wang, D., Zhu, H., Wang, L., Feng, C., and Wang, Z. (2014). Positive interactions between large herbivores and grasshoppers, and their consequences for grassland plant diversity. Ecology 95, 1055–1064. doi: 10.1890/13-1079.1
Zhou, H., Zhou, L., Zhao, X., Liu, W., Li, Y., Gu, S., et al. (2006). Stability of alpine meadow ecosystem on the Qinghai-Tibetan Plateau. Chin. Sci. Bull. 51, 320–327. doi: 10.1007/s11434-006-0320-4
Zhou, W., Zhao, C.-Z., Wang, K.-M., Wang, X.-P., and Li, L.-L. (2011). Community characteristics of grasshopper and its relationship with plant community in upper reaches of heihe river. Bull. Soil Water Conserv. 1:009. Available online at: http://en.cnki.com.cn/Article_en/CJFDTOTAL-STTB201101009.htm
Keywords: insect diversity, population dynamics, transcriptome, Chorthippus albonemus, livestock grazing
Citation: Qin X, Ma J, Huang X, Kallenbach RL, Lock TR, Ali MP and Zhang Z (2017) Population Dynamics and Transcriptomic Responses of Chorthippus albonemus (Orthoptera: Acrididae) to Herbivore Grazing Intensity. Front. Ecol. Evol. 5:136. doi: 10.3389/fevo.2017.00136
Received: 15 September 2017; Accepted: 23 October 2017;
Published: 06 November 2017.
Edited by:
Su Wang, Beijing Academy of Agricultural and Forestry Sciences, ChinaReviewed by:
Bin Tang, Hangzhou Normal University, ChinaDavide Valenti, Università degli Studi di Palermo, Italy
Copyright © 2017 Qin, Ma, Huang, Kallenbach, Lock, Ali and Zhang. This is an open-access article distributed under the terms of the Creative Commons Attribution License (CC BY). The use, distribution or reproduction in other forums is permitted, provided the original author(s) or licensor are credited and that the original publication in this journal is cited, in accordance with accepted academic practice. No use, distribution or reproduction is permitted which does not comply with these terms.
*Correspondence: Zehua Zhang, zhangzehua@caas.cn