Population Wide Decline in Somatic Growth in Harbor Seals—Early Signs of Density Dependence
 Karin C. Harding
 Maëlle Salmon2
  Jonas Teilmann
 Rune Dietz
- 1Department of Biological and Environmental Sciences, University of Gothenburg, Gothenburg, Sweden
- 2Département de Biologie, Ecole Normale Supérieure, Paris, France
- 3Marine Mammal Research, Department of Bioscience, Aarhus University, Roskilde, Denmark
- 4Swedish Museum of Natural History, Stockholm, Sweden
The harbor seal populations of Danish and Swedish waters have had turbulent population dynamics during the last century. They were severely depleted by hunting in the beginning of the twentieth century, followed by rapid recovery due to protective measures. They were victims to two mass mortalities caused by Phocine Distemper Virus (PDV) epidemics. Long term monitoring and intensive sampling during the last decades now allow analysis of population level phenomena in response to shifting population size. We compare somatic growth curves from several seal populations including 2,041 specimens with known age, length and population size at birth. Asymptotic body lengths of female harbor seals were 148 cm in all four regions in 1988, when seal abundances had been kept low by hunting for decades. Males were 158 cm, being 10 cm longer. However, in 2002 the asymptotic lengths of seals differed among regions. While seals in the Kattegat showed similar asymptotic lengths as in 1988, seals in the Skagerrak were significantly shorter, where both male and female asymptotic lengths declined by 7 cm. We estimate the area of available feeding grounds in the two sea regions and find the density of seals per square kilometer feeding ground to be three times greater in the Skagerrak compared to the Kattegat. Thus, the shorter body length of seals in the Skagerrak can be an early signal of density dependence. Hampered body growth is known to trigger a suite of changes in life history traits, including delayed age at sexual maturity, higher juvenile mortality and lowered fecundity. These mechanisms all point at a possible “smooth route toward carrying capacity” with gradually reduced population growth rate as the main response to high population density. Recent aerial surveys confirm declining rates of population increase in the Skagerrak.
Introduction
Understanding the processes behind population trends is the essence of population ecology. Like most mammals, populations of pinnipeds generally adopt exponential population growth at low numbers, which has been repeatedly confirmed in most populations after overexploitation during the twentieth century (Roman et al., 2015). The recovery of the northern elephant seal (Mirounga angustirostris) from about 100 up to 100,000 in seventy years is one such success story (Lowry et al., 2014). However, what happens after this phase of exponential growth is debated, and an increasingly pressing question, since many earlier depleted marine mammal stocks now are at historically high abundances.
Several populations of seals that have recovered from over-harvesting are again declining for various reasons. Examples include Scottish harbor seals (Phoca vitulina, Lonergan et al., 2007), Canadian harbor seals (Bowen et al., 2003), Alaskan harbor seals (Jemison et al., 2006), Icelandic harbor seals (Haukson, 2006), and Steller sea lions (Eumetopias jubatus, Atkinson et al., 2008). In most cases no single conclusive mechanism can be identified, but analyses suggest that combinations of factors such as predation, interspecific competition, or disease may contribute to the declines. In an interesting study competition for food, with other marine mammals, and with large fish species is suggested as a contributory factor to declining body conditions in harp seals (Pagophilus groenlandicus) (Bogstad et al., 2015).
Life history theory predicts that genotypes will express phenotypic plasticity in life history traits in response to variation or clines in environmental conditions (e.g., Stearns and Koella, 1986). Most mammals have (in contrast to for example fish) determinate growth, i.e., the plasticity in growth is only expressed during the first years of life, but once sexual maturity is reached, body lengths do not increase much and completely stops in older adults (e.g., Härkönen and Heide-Jørgensen, 1990). Thus, the nutritive conditions during the juvenile stage is vital to final adult body length in mammals (Frisch, 1990). Changes in population wide average body lengths have also been detected in harp seals (Kjellqwist et al., 1995), South African fur seal (Arctocephalus pusillus, Guinet et al., 1998), ringed seals (Pusa hispida, Kingsley and Byers, 1998), and sea otters (Enhydra lutris kenyoni, Von Biela et al., 2009). However, sometimes biased samples are suspected to blur results. For example, animals of different reproductive status have different behavior and can cause systematic biases in samples collected on breeding grounds. During favorable conditions mammals are expected to grow fast, become large as subadults, mature early, and show high fertility and survival rates in all age classes. During periods with strong competition for food energetic constraints lead to what we term a “low nutrition syndrome” with restrained somatic growth, later age at sexual maturity, reduced age specific fertility and reduced juvenile survival rates (e.g., Kjellqwist et al., 1995). Adult survival is often the last parameter to be affected in long-lived, K-selected species (e.g., Gaillard et al., 1998).
Quantification of somatic growth parameters of individuals can inform on the status of a population in relation to the carrying capacity of its habitat given that the range in phenotypic plasticity of vital parameters can be determined. Changes in mean size of adults or “asymptotic length” have been used in evaluations of the status of populations in relation to ecosystem condition (Kjellqwist et al., 1995; Guinet et al., 1998; Laidre et al., 2006). However, such studies are rare since the analysis requires repeated large-scale sampling at contrasting population densities of the same population. In the current study we present unique data on body length variation from repeated sampling of several large harbor seal populations. The harbor seals in Kattegat and Skagerrak, have increased from 2,500 animals in the late 1970s (Heide-Jørgensen and Härkönen, 1988) to about 25,000 in 2015 (Bäcklin et al., 2016). Two major mass mortality events caused by Phocine Distemper Virus (PDV) occurred during the last 45 years. The first in 1988 at a population size of 10 000 seals and the second in 2002 at a size of 18,000 seals (Dietz et al., 1989; Härkönen et al., 2006; Olsen et al., 2014). Thousands of harbor seal carcasses were carefully measured, sampled and aged, and we take advantage of these repeated events to quantify the range in plasticity in asymptotic length of harbor seal populations among regions and sampling years. Annual aerial censuses have been performed and make it possible to estimate the population size at birth for each cohort of seals retrospectively. We discuss pinniped phenotypic plasticity in body condition and how it can be used to understand population dynamics and as a signal of ecosystem state.
Materials and Methods
Scientists and local authorities cooperated to collect all carcasses that drifted ashore in Swedish and Danish regions affected by the 1988 and 2002 PDV epidemics. Trained field workers took samples and measured the standard length (American Society of Mammalogists, 1967) and determined the sex of each seal. The lower jaws were collected, and seals were age determined from growth layer groups in the cementum of decalcified, thin sectioned (14 μm) and stained (toluidine blue) canine teeth following the method of Dietz et al. (1991). For estimates of asymptotic length, we selected age classes 1–15 years where we had a good representation of all age classes. We omitted seals younger than one year old, since data were not collected in all populations for this age group, and seals older than 15 years as they would not be present in the 2002 sample due to acquired immunity of the surviving seals from the first epizootic of PDV (Härkönen et al., 2007).
Seals were collected from three populations in 1988: the Skagerrak, the Kattegat, and the Limfjord, and from four populations in 2002 also including the Western Baltic (Figure 1, Table 1). Data from the Limfjord in 1988 were only available in aggregated form (Nørgaard and Larsen, 1991, Table 1) and could not be included in all analysis. Two different growth curves are used in the literature on marine mammals and we applied both to compare their performance; the Gompertz function (Ricker, 1979) and von Bertalanffy (von Bertalanffy, 1938). We obtained close to identical results for both functions and present results from the Gompertz function (Equation 1) in the following.
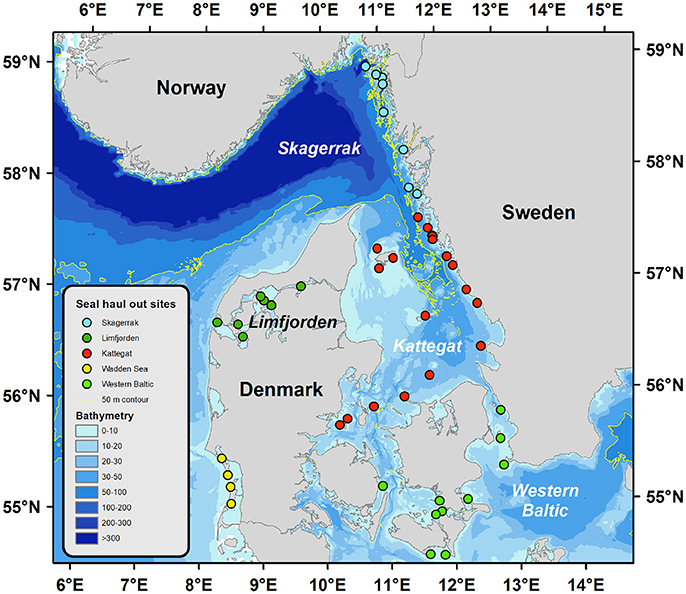
Figure 1. Geographical locations of the harbor seal populations indicated by circles in different colors. Bathymetry is dramatically different for the different regions, which imply smaller areas of suitable feeding grounds (1–50 m) for young seals in Skagerrak and Limfjorden compared to Kattegat and Western Baltic which could partly explain the reduction in somatic growth with increasing population size observed in Limfjorden and Skagerrak. The Wadden sea population was not included in the current study.
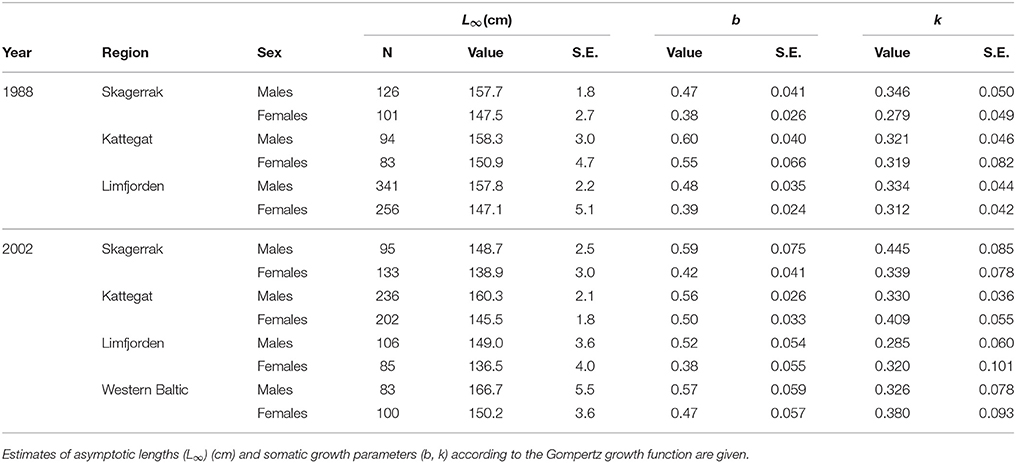
Table 1. Number of harbor seals (N) with known sex, age, and body length included in the study.
The asymptotic adult body length is denoted L∞, and is estimated from data on age (t) and standard length (Lt). Here (b) is the constant of integration and (k) the growth rate constant, which determines the shape of the Gompertz curve. We applied mixed regression models defined in a frequentist framework following English et al. (2011) and Karaman et al. (2013).
Analysis 1: Age—Length Relations Among Regions and Years
In the first analysis we investigate the relation between age and body length and give somatic growth curves for samples collected in both epidemic years and in all regions. For each seal i of region (Ri), age (ti), sex (Si), and sampling year (Yi) we have;
where
with aRi, aSi, and aYi being the fixed effects of region, sex and sampling year, respectively. We added random effects of the groups on the growth constants b and k, where each group corresponds to one combination of region, sex and sampling year. We had 14 such “region-sex-year groups” as shown in Table 1. The mixed regression approach should be statistically more appropriate compared to fitting one growth model at a time for each group of seals.
Analysis 2: Body Length—Population Abundance
In a second analysis we used published data on harbor seal abundance (Heide-Jørgensen and Härkönen, 1988; Olsen et al., 2010; Teilmann et al., 2010; Härkönen et al., 2011) to investigate if body lengths were correlated to seal abundance at the time of birth. We fitted Gompertz growth models to data (from each seal i born at a population density Di) from Kattegat and Skagerrak separately, and made growth depend on population density;
where
with random effects of the group (sex and sampling year) on the parameters b and k. In both analyses, models were fitted and parameter significance was assessed using the p-value of the Student t-test output by the R function nlme (Pinheiro et al., 2016). Plots were made using R packages ggplot2 (Wickham, 2009) and viridis (Garnier, 2016).
Results
Analysis 1: Age—Length Relations Among Regions and Years
Two thousand forty-one seals with known age and length were collected in the different regions (Table 1). In the first model we could include seals (1–15 years) for which we had complete information about age, body length, region, sex and sampling year, and this summed up to 1,433 seals (Table 2). We selected females from the Kattegat, sampled in both 1988 and 2002, as the reference group since no significant differences were found between these groups. The asymptotic length of females in Kattegat was 147.8 cm in both years of sampling (Table 2). The asymptotic length of males was 10.1 cm longer than the asymptotic length of females for all regions and years. Females in the Skagerrak in 1988 were not significantly different from the reference group (i.e., seals were the same size in 1988 in both the Kattegat and the Skagerrak). The asymptotic lengths of both male and female seals in the Western Baltic sampled in 2002 was 5.43 cm longer than in the Kattegat. The asymptotic length of seals of the Limfjord in 2002 was 11.4 cm shorter compared to the Kattegat (both sexes) (Table 2, Figure 2). (Note that the model does not include seals sampled in 1988 in the Western Baltic nor from the Limfjord.) The mean asymptotic length in the Skagerrak in sampling year 2002 was 7.06 cm shorter than in 1988 for both sexes (Table 2, Figure 3). There were no significant differences in asymptotic lengths between the two sampling years in the Kattegat for females or males. The corresponding fitted values are shown in Table S1.
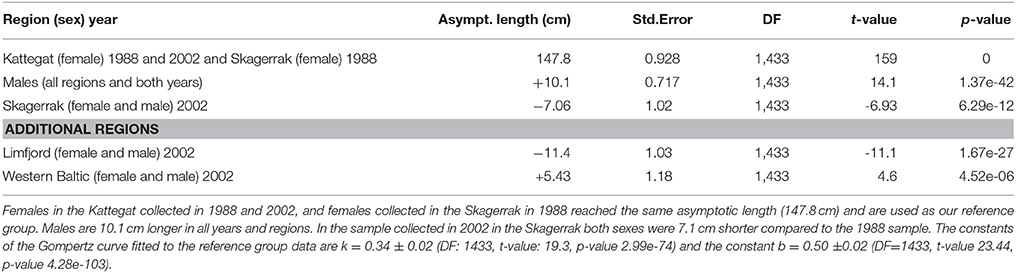
Table 2. Fixed effects in Analysis 1: comparing growth curves among regions and sampling years with a mixed regression model.
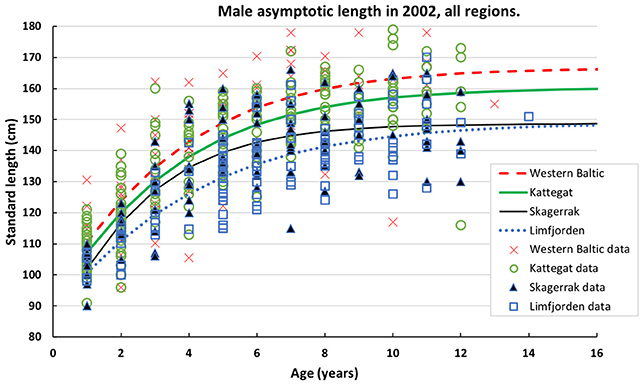
Figure 2. Data on standard length of male harbor seals at age sampled in 2002 in four populations of harbor seals. Data are fitted by the Gompertz function (Table 2).
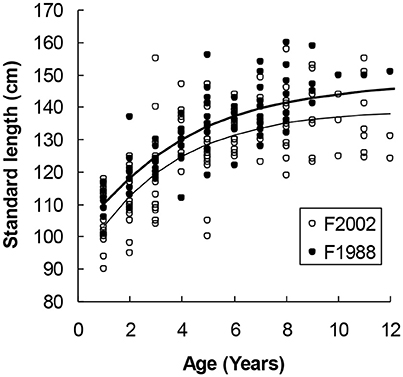
Figure 3. Female harbor seals in Skagerrak followed a steeper growth curve in the sample collected in 1988 (upper curve) as compared with 2002 (lower curve). The difference in asymptotic length (7.06 cm) was statistically significant (Table 2).
Analysis 2: Body Length Span—Phenotypic Plasticity to Population Size
We fitted two separate models for seals in the Skagerrak and the Kattegat, including an effect of the population size at birth. Population abundance at birth was estimated by an exponential function fitted to aerial survey data for each region and each year. We thus obtained estimates of population size at birth for 412 seals with known lengths and ages in the Skagerrak and 589 seals in the Kattegat. There is a significant effect of population size in the Skagerrak, where the asymptotic length decreases with 6.1 cm with each unit of log population size at birth (Table 3, Table S2, Figure S1). The effect of population size was not significant in the Kattegat.
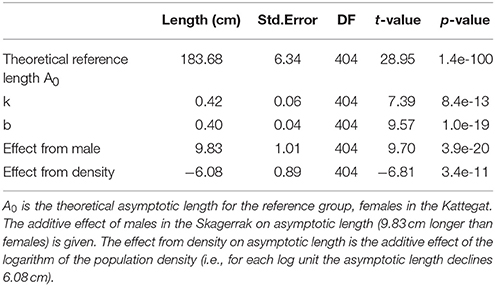
Table 3. Fixed effects from Analysis 2 for the Skagerrak only, testing for density dependence.
Density of Seals by Area
We estimate the area of potential feeding ground for subadult seals in the different sea regions by comparing bathymetric maps. The Skagerrak has a larger total surface area of about 32,200 km2 compared to 21,800 km2 in the Kattegat (Figure 1). However, common diving depths for feeding pups and subadult harbor seals are typically <50 m (Blanchet et al., 2016). The Kattegat is a shallow sea and 20,170 km2 of the sea bed is <50 m deep, whereas only 8,890 km2 are shallower than 50 m in the Skagerrak (Figure 1). We estimate seal density to have increased from 0.39 to 0.54 seal/ km2 in the Kattegat between the two epizootic events. The density increased from 0.26 to 1.18 seals/ km2 during the same time period in the Skagerrak. Seal density in the Limfjord increased from 0.66 to 1.66 seals per km2. Thus, density was twice as high in the Skagerrak and three times higher in the Limfjord compared to Kattegat, which might have led to competition for food especially in pups and subadult seals, which have not fully developed their diving capacity (Bekkby and Bjørge, 2000). The Western Baltic population is a low-density population with about 0.03 seals/km2.
Discussion
Harbor seals in exponentially growing populations before 1988 attained asymptotic lengths close to 158 cm for males and 148 cm for females in all three regions. Comparing the 1988 and 2002 samples, the mean asymptotic lengths of seals in the Skagerrak were significantly reduced for both sexes. Seals born in cohorts during low seal abundance attained greater adult asymptotic lengths as compared with cohorts born at higher population sizes of seals in the Skagerrak. Such a pattern was not seen for the Kattegat seals. Seals from the small and semi enclosed Limfjord were also shorter in 2002 compared to the seals sampled in 1988. The abundance of seals in the Limfjord has fluctuated around a total abundance of 1,500 seals over the past decades, suggesting that this population has reached the carrying capacity of the system (Olsen et al., 2010; Teilmann et al., 2010). These findings strongly suggest that somatic growth in harbor seals is density dependent and that a change in asymptotic length of seals can indicate that a population is approaching the carrying capacity of its habitat. Seals in the Western Baltic collected in 2002 were the longest with males at 167 cm and females at 150 cm. The Western Baltic population is relatively small and seals can exploit large shallow areas. Here population size is probably influenced by other factors such as availability to haul out sites, human induced mortality from by-catches and disturbances at breeding sites.
Whereas the upper bound in phenotypic plasticity mainly results from genetic constraints, the lower bound is also affected by physiological or physical limitations, of which some are specific for marine mammals. Since harbor seal females expend a constant proportion of their energy reserves during lactation (Bowen et al., 2001), small females transfer considerably less stored fat to their pups as compared to larger females. However, all females forage in the end of the lactation period to compensate for energetic losses, where small females forage more intensively than bigger females (Bowen et al., 2001). The energetic stress is thus greater in small females, which may be compensated by ingestion during good years. Small females transfer less energy to their pups during bad years with limited food supplies. Similarly to Canadian harbor seals (Bowen et al., 2001), survival rates of lean (with a weight of 17 kg in early October) harbor seal pups in the Skagerrak was found to be 0.63 over the winter as compared with 0.96 for heavy pups (weighing 32 kg in early October) (Harding et al., 2005). This difference could be explained by increasing thermal stress with decreasing body size of pups (Harding et al., 2005). Thermal stress can impose a selection pressure against small body size in harbor seals in addition to factors such as reduced diving capacity and smaller energy reserves.
We estimated seal density in relation to sea floor area suitable for feeding (shallower than 50 m). In the Kattegat no signs of density dependence on asymptotic growth were seen, and this sea region is also shallower with a large area of approximately 20,170 km2 of sea beds between 1 and 50 m. In comparison, approximately 8,890 km2 of potentially suitable feeding habitat in the same depth interval is available in the Skagerrak.
Pups born in high density populations became shorter as adults which is likely due to that initially restrained growth cannot be fully compensated for later in life. Restrained somatic growth also result in delayed age at sexual maturity (ASM), and lowered fecundity among harp seals (Kjellqwist et al., 1995), and sea otters (Von Biela et al., 2009), but similar changes have also been demonstrated in other seal species including crabeater seals (Lobodon carcinophagus, Harding and Härkönen, 1995), ringed seals (Harwood et al., 2000; Krafft et al., 2006), and fur seals (Guinet et al., 1998). All these factors combined will eventually contribute to lessen the rate of population increase until the population levels corresponding to the carrying capacity of the system is reached. This is supported by recent data, where population growth rate in the Skagerrak has declined from 11% per year prior to 2002 to 6.5 % in the period 2003–2015 (Bäcklin et al., 2016).
Potential Biases
A general problem is to get samples which are representative of studied populations. We analyzed data from seals that died during the 1988 and 2002 PDV epidemics, where the disease to some degree could have affected the condition of the animals. However, the duration of illness in an individual seal was only about 2 weeks between clinical signs of the infection and death at both epidemic events (Dietz et al., 1989; Harding et al., 2002), and this time span is too short to affect the body length of seals. Their somatic growth period typically occur during five to seven years. Furthermore, the period of illness was so short that most dead seals were found in good nutritional condition as judged from their blubber layers (Härkönen and Heide-Jørgensen, 1990). Evidence indicate that survivors and victims to PDV were not different in terms of body condition or other parameters of health, but differed in their risk of exposure to the virus since mortality rates varied among age classes. Age groups that spent most time on land during the peak of the epizootic were over-represented among the victims (Härkönen et al., 2007). This resulted in fewer sub adults in our samples, but not to a systematic bias in sampling seals of different length within each age class. Thus the length-by-age samples used in this study are most likely representative of the population. Mortality rates were 24–66% of the populations that were sampled (Härkönen et al., 2006). Thus, a very large proportion of the populations were sampled and should reflect the actual body length variation in the population well. Finally, in the comparison we omitted seals older than 15 years as they would not be present in the 2002 sample due to achieved immunity of the surviving seals from mortality in the first epizootic of PDV (Härkönen et al., 2007).
The simple estimate of seal density as “population size per square kilometer of shallow sea beds” is approximate and just gives an order of magnitude, it is not an exact measure of feeding competition. Future studies should estimate functional seal density in greater detail by including data on diving behavior from subadult seals and by quantifying the bathymetry, productivity and prey species composition of different sea regions.
Conclusions
A long-term monitoring program of population abundance and distribution in combination with an ambitious documentation of the two mass mortality events allowed reconstruction of somatic growth curves for harbor seals at different population sizes for the same sea regions. Harbor seal pups born at high abundance conditions in the Skagerrak attained shorter final adult lengths. In the Kattegat we found no difference in length between years. We propose that this finding is related to seal density in relation to areas of suitable feeding grounds. Seal density in the Skagerrak increased to twice the density in the Kattegat, supporting the suggestion of density dependence in body growth.
Nutritional stress has been shown to result in restrained somatic growth and delayed age at sexual maturity in marine mammals. Smaller adult females also produce smaller pups at weaning, with reduced chances for surviving their first year. Consequently, the decline in somatic growth is linked to a suite of other life history changes, ultimately slowing population growth rate. We recommend systematic monitoring of data on length and age during high mortality events, to inform on the status of populations, and to give early warning on changes in relation to the environment and density dependent factors important for managing seal populations.
Author Contributions
KH: Collected data and wrote the paper; MS: Performed the statistical analysis; TH: Collected the data and outlined the idea for the paper; RD: Collected data and constructed graphs; JT: Wrote the paper and contributed to the analysis. All authors contributed to writing and data interpretation.
Conflict of Interest Statement
The authors declare that the research was conducted in the absence of any commercial or financial relationships that could be construed as a potential conflict of interest.
The reviewer MF declared a shared affiliation, with no collaboration, with two of the authors (JT and RD) to the handling Editor.
Acknowledgments
This study was financed by the Swedish Environmental Protection Agency (Viltforskningsanslaget), the Danish Nature Agency and the Center for Marine Evolutionary Biology (CeMeb) at the University of Gothenburg, Sweden. MS was financed by ENS. We thank all people working in the field, and Lasse Fast Jensen for providing original data from 1988 from the Limfjord, and Elisabeth Margurite Lundqvist for logistic support. Emre Karaman and Sinéad English were generously making their code available and provided valuable discussions. We thank the BONUS program BaltHealth which has received funding from BONUS (Art. 185), funded jointly by the EU, Innovation Fund Denmark (grants 6180-00001B and 6180-00002B), Forschungszentrum Jülich GmbH, German Federal Ministry of Education and Research (grant FKZ 03F0767A), Academy of Finland (grant 311966) and Swedish Foundation for Strategic Environmental Research (MISTRA).
Supplementary Material
The Supplementary Material for this article can be found online at: https://www.frontiersin.org/articles/10.3389/fevo.2018.00059/full#supplementary-material
References
American Society of Mammalogists (1967). Standard measurements of seals. J. Mammal. 48, 459–462. doi: 10.2307/1377778
Atkinson, S., Demaster, D. P., and Calkins, D. G. (2008). Anthropogenic causes of the western Steller sea lion Eumetopias jubatus population decline and their threat to recovery. Mamm. Rev. 38, 1–18. doi: 10.1111/j.1365-2907.2008.00128.x
Bäcklin, B.-M., Moraeus, C., Strömberg, A., Karlsson, O., and Härkönen, T. (2016). Havet 2015/2016. Available online at: http://www.havsmiljoinstitutet.se/
Bekkby, T., and Bjørge, A. (2000). Diving behaviour of harbour seal Phoca vitulina pups from nursing to independent feeding. J. Sea Res. 44, 267–275. doi: 10.1016/S1385-1101(00)00048-4
Blanchet, M.-A., Lydersen, C., and Kovacs, K. M. (2016). Making it throught the first year: Ontogeny of movment and diving behavior in harbor seals fram Svalbard, Norway. Mar. Mamm. Sci. 32, 1340–1369. doi: 10.1111/mms.12341
Bogstad, B., Gjøsæter, H., Haug, T., and Lindstrøm, U. (2015). A review of the battle for food in the Barents Sea: cod vs. marine mammals. Front. Ecol. Evol. 3:29. doi: 10.3389/fevo.2015.00029
Bowen, W. D., Ellis, S. L., Iverson, S. J., and Boness, D. J. (2003). Maternal and newborn life-history traits during periods of contrasting population trends: implications for explaining the decline of harbour seals (Phoca vitulina), on Sable Island. J. Zool. Lond. 261, 155–163. doi: 10.1017/S0952836903004047
Bowen, W. D., Iverson, S. J., Boness, D. J., and Oftedal, O. T. (2001). Foraging effort, food intake and lactation performance depend on maternal mass in a small phocid seal. Funct. Ecol. 15, 325–334. doi: 10.1046/j.1365-2435.2001.00530.x
Dietz, R., Heide-Jørgensen, M.-P., and Härkönen, T. (1989). Mass deaths of harbor seals. Ambio 18, 258–264.
Dietz, R., Heide-Jørgensen, M. P., Härkönen, T., Teilmann, J., and Valentin, N. (1991). Age determination of European harbour seals. Sarsia 76, 17–21. doi: 10.1080/00364827.1991.10413461
English, S., Bateman, A. W., and Clutton-Brock, T. H. (2011). Lifetime growth in wild meerkats: incorporating life history and environmental factors into a standard growth model. Oecologia 169, 143–153. doi: 10.1007/s00442-011-2192-9
Frisch, R. E. (1990). The right weight: body fat, menarche and ovulation. Bailliere's Clin. Obst. Gynaecol. 4, 419–439.
Gaillard, J.-M., Festa-Bianchet, M., and Yoccoz, N. G. (1998). Population dynamics of large herbivores: variable recruitment with constant adult survival. Trends Ecol. Evol. 13, 58–63 doi: 10.1016/S0169-5347(97)01237-8
Garnier, S. (2016). viridis: Default Color Maps from 'matplotlib'. R package version 0.3.4. Available online at: https://CRAN.R-project.org/package=viridis
Guinet, C., Roux, J. P., Bonnet, M., and Mison, V. (1998). Effect of body size, body mass, and body condition on reproduction of female South African fur seals (Arctocephalus pusillus) in Namibia. Can. J. Zool. 76, 1418–1424. doi: 10.1139/z98-082
Harding, K. C., and Härkönen, T. (1995). Estimating age at sexual maturity in crabeater seals Lobodon carcinophagus. Can. J. Fish. Aquat. Sci. 52, 2347–2352. doi: 10.1139/f95-827
Harding, K. C., Härkönen, T., and Caswell, H. (2002). The 2002 European seal plague: Epidemiology and population consequences. Ecol. Lett. 5, 727–732. doi: 10.1046/j.1461-0248.2002.00390.x
Harding, K., Fujiwara, M., Axberg, Y., and Härkönen, T. (2005). Mass dependent energetics and survival in harbour seal pups. Funct. Ecol. 19, 129–135. doi: 10.1111/j.0269-8463.2005.00945.x
Härkönen, T., Dietz, R., Reijnders, P., Teilmann, J., Harding, K., Hall, A., et al. (2006). A review of the 1988 and 2002 phocine distemper virus epidemics in European harbour seals. Dis. Aquat. Org. 68, 115–130. doi: 10.3354/dao068115
Härkönen, T., Harding, K., Rasmussen, T. D., Teilmann, J., and Dietz, R. (2007). Age- and sex-specific mortality patterns in an emerging wildlife epidemic: the phocine distemper in european harbour seals. PLoS ONE 2:887. doi: 10.1371/journal.pone.0000887
Härkönen, T., and Heide-Jørgensen, M. P. (1990). Comparative life histories of East Atlantic and other harbour seal populations. Ophelia 32, 211–235. doi: 10.1080/00785236.1990.10422032
Härkönen, T., Karlsson, O., and Bäcklin, B.-M. (2011). Sälpopulationer och sälhälsa. Havet 2011, 95–96. Available online at: http://www.havsmiljoinstitutet.se/publikationer/havet/havet-2011
Harwood, L. A., Smith, T. G., and Melling, H. (2000). Variation in reproduction and body condition of the ringed seal (Phoca hispida) in western Prince Albert Sound, NT, Canada, as assessed through a harvest-based sampling program. Arctic 53, 422–431. doi: 10.14430/arctic872
Haukson, E. (2006). Growth and reproduction in the Icelandic common seal (Phoca vitulina, L. 1758). Mar. Biol. Res. 2, 59–73. doi: 10.1080/17451000600650038
Heide-Jørgensen, M.-P., and Härkönen, T. (1988). Rebuilding seal stocks in the Kattegat-Skagerrak. Mar. Mamm. Sci. 4, 231–246. doi: 10.1111/j.1748-7692.1988.tb00204.x
Jemison, L. A., Pendleton, G. W., Wilson, C. A., and Small, R. J. (2006). Long-term trends in harbor seal numbers at Tugidak Island and Nanvak Bay, Alaska. Mar. Mamm. Sci. 22, 339–360. doi: 10.1111/j.1748-7692.2006.00021.x
Karaman, E., Narinc, D., Firat, M. Z., and Aksoy, T. (2013). Nonlinear mixed effects modeling of growth in Japanese quail. Poultry Sci. 92, 1942–1948. doi: 10.3382/ps.2012-02896
Kingsley, M., and Byers, T. (1998). “Failure of reproduction in ringed seals (Phoca hispida) in Amundsen Gulf, Northwest Territories, 1984–1987,” in Ringed seals in the North Atlantic, eds M. P. Heide-Jorgensen and C. Lydersen (Tromsø: The North Atlantic Marine Mammal Commission. NAMMCO Scientific Publications No. 1), 197–210.
Kjellqwist, S. A., Haug, T., and Øritsland, T. (1995). Trends in age-composition, growth and reproductive parameters of Barents Sea harp seals, Phoca groenlandica. ICES J. Mar. Sci. 52, 197–208. doi: 10.1016/1054-3139(95)80035-2
Krafft, B. A., Kovacs, K. M., Frie, A. K., Haug, T., and Lydersen, C. (2006). Growth and population parameters of ringed seals (Pusa hispida) from Svalbard, Norway 2002-2004. ICES J. Mar. Sci. 63, 1136–1144. doi: 10.1016/j.icesjms.2006.04.001
Laidre, K. L., Estes, J. A., Tinker, M. T., Bodkin, J., Monson, D., and Schneider, K. (2006). Patterns of growth and body condition in sea otters from the Aleutian archipelago before and after the recent population decline. J. Anim. Ecol. 75, 978–989. doi: 10.1111/j.1365-2656.2006.01117.x
Lonergan, M., Duck, C. D., Thompson, D., Mackey, B. L., Cunningham, L., and Boyd, I. L. (2007). Using sparse survey data to investigate the declining abundance of British harbour seals. J. Zool. Lond. 271, 261–269. doi: 10.1111/j.1469-7998.2007.00311.x
Lowry, M. S., Condit, R., Hatfield, S. G., Allen, S. G., Berger, R., Morris, P. A., et al. (2014). Abundance, distribution, and population growth of the Northern Elephant Seal (Mirounga angustirostris) in the United States from 1991 to 2010. Aquat. Mamm., 40, 20–31. doi: 10.1578/AM.40.1.2014.20
Nørgaard, N., and Larsen, B. H. (1991). Age determination of harbour seals (Phoca vitulina) by cementum growth layers, x-ray of teeth, and body length. Danish Rev. Game Biol. 14, 17–32.
Olsen, M. T., Andersen, L. W., Dietz, R., Teilmann, J., and Härkönen, T. (2014). Integrating genetic data and population viability analyses for the identification of harbour seal (Phoca vitulina) populations and management units. Mol. Ecol. 23, 815–831. doi: 10.1111/mec.12644
Olsen, M. T., Andersen, S. M., Teilmann, J., Dietz, R., Edrén, S. M. C., Linnet, A., et al. (2010). Status of the harbour seal (Phoca vitulina) in southern Scandinavia. NAMMCO Sci. Publ. 8, 77–94. doi: 10.7557/3.2674
Pinheiro, J., Bates, D., DebRoy, S., and Sarkar D, R Core Team,. (2016). nlme: Linear and Nonlinear Mixed Effects Models. R package version 3.1-128. Available online at: http://CRAN.R-project.org/package=nlme
Ricker, W. E. (1979). “Growth rates and models,” in Fish Physiology: Bioenergetics and Growth, eds W. S. Hoar, D. J. Randall, and J. F. Brett (Orlando, FL: Academic Press Inc), 667–743.
Roman, J., Dunphy-Daly, M. M., Johnston, D. W., and Read, A. J. (2015). Lifting baselines to address the consequences of conservation success. Trends Ecol. Evol. 30, 299–302. doi: 10.1016/j.tree.2015.04.003
Stearns, S. C., and Koella, J. C. (1986). The evolution of phenotypic plasticity in life-history traits: predictions of reaction norms for age and size at maturity. Evolution 40, 893–913. doi: 10.1111/j.1558-5646.1986.tb00560.x
Teilmann, J., Riget, F., and Härkönen, T. (2010). Optimising survey design in Scandinavian harbour seals: Population trend as an ecological quality element. ICES J. Mar Sci. 67, 952–958. doi: 10.1093/icesjms/fsq001
von Bertalanffy, L. (1938). A quantitative theory of organic growth (inquiries on growth laws. II). Hum. Biol. 10, 181–213.
Von Biela, V. R., Gill, V. A., Bodkin, J. L., and Burns, J. M. (2009). Phenotypic plasticity in age at first reproduction of female northern sea otters (Enhydra lutris kenyoni). J. Mammal. 90, 1224–1231. doi: 10.1644/08-MAMM-A-379.1
Keywords: phenotypic plasticity, density dependent growth, asymptotic growth model, Gompertz growth function, Phoca vitulina
Citation: Harding KC, Salmon M, Teilmann J, Dietz R and Harkonen T (2018) Population Wide Decline in Somatic Growth in Harbor Seals—Early Signs of Density Dependence. Front. Ecol. Evol. 6:59. doi: 10.3389/fevo.2018.00059
Received: 14 February 2018; Accepted: 20 April 2018;
Published: 11 May 2018.
Edited by:
Dennis Murray, Trent University, CanadaReviewed by:
Pablo Almaraz, Instituto de Ciencias Marinas de Andalucía (ICMAN), SpainMorten Frederiksen, Aarhus University, Denmark
Copyright © 2018 Harding, Salmon, Teilmann, Dietz and Harkonen. This is an open-access article distributed under the terms of the Creative Commons Attribution License (CC BY). The use, distribution or reproduction in other forums is permitted, provided the original author(s) and the copyright owner are credited and that the original publication in this journal is cited, in accordance with accepted academic practice. No use, distribution or reproduction is permitted which does not comply with these terms.
*Correspondence: Karin C. Harding, karin.harding@bioenv.gu.se