Pollinator Community Assembly Tracks Changes in Floral Resources as Restored Hedgerows Mature in Agricultural Landscapes
 Claire Kremen
 Leithen K. M'Gonigle
 Lauren C. Ponisio
- 1Department of Environmental Science, Policy, and Management, University of California, Berkeley, Berkeley, CA, United States
- 2Department of Biological Sciences, Simon Fraser University, Burnaby, BC, Canada
- 3Department of Entomology, University of California, Riverside, Riverside, CA, United States
Intensive agriculture reduces wild pollinator abundance, diversity and pollination services, while depending critically on wild pollinators for crop pollination. Floral enhancements such as hedgerows (native, perennial flowering trees and shrubs) can enhance pollinator colonization, persistence, occupancy, and species richness within intensive agricultural landscapes. However, little is known about the specific features of hedgerows that promote pollinator communities in such landscapes. Understanding how pollinator communities respond to local changes in site conditions as hedgerows mature, such as the availability of floral or nesting resources, can help guide the design of more effective hedgerows that promote pollinators and/or pollination services. In an intensively-managed agricultural region of California, we found that pollinator community attributes responded principally to the enhancement of floral diversity as hedgerows mature, as well as to surrounding natural habitat. Once hedgerows matured, this relationship leveled off, suggesting either saturation of community assembly processes, or greater importance of floral density/display relative to diversity. Although we did not find any relationships between measures of pollinator community diversity and nesting resources, such resources are notably difficult to measure. Surrounding natural habitat also affected species and functional richness at hedgerows, particularly for solitary bees that nest above ground. Such species are known to be particularly sensitive to the negative effects of agriculture. Thus, hedgerows in combination with natural habitat may reverse some of the community disassembly provoked by intensive agriculture.
1. Introduction
Agricultural intensification is a global land use change (Ramankutty et al., 2018) that has large impacts on arthropod biodiversity and the ecosystem functions and services provided by arthropods within those ecosystems (Gurr et al., 2016). Native pollinators, which provide valuable pollination services to crops similar in magnitude to those of managed bees (Kleijn et al., 2015) even when managed honey bees are present (Garibaldi et al., 2013; Rader et al., 2016), have reduced abundance and diversity in larger fields that are more simplified (Kovács-Hostyánszki et al., 2017). However, these are the landscapes where pollination services are in highest demand (Koh et al., 2016). Re-diversifying such landscapes with habitat enhancements such as hedgerows or wildflower strips can support pollinator communities (Garibaldi et al., 2014), potentially increasing the supply of pollinators to adjacent crops (Blaauw and Isaacs, 2014; Morandin et al., 2016, but see Sardiñas and Kremen, 2015). Although such plantings may chiefly support generalist pollinators (Kleijn et al., 2015), some evidence suggests that well-targeted plantings can promote diverse communities of pollinators including more specialized species (Kremen and M'Gonigle, 2015; M'Gonigle et al., 2015, 2017; Ponisio et al., 2016), as well as supporting other arthropod-mediated services such as pest control (Gurr et al., 2016; Morandin et al., 2016). Habitat plantings in farmland may thus enhance both arthropod conservation and ecosystem services. However, much remains to be known about how to target farmland plantings to reverse the disturbance of agricultural intensification and promote arthropod conservation and/or ecosystem services (Williams et al., 2015; Kovács-Hostyánszki et al., 2017; Williams and Lonsdorf, 2018).
In intensively-managed production systems in California, hedgerow plantings, implemented to enhance pest control, game birds, and/or other ecosystem services, are made up of diverse, perennial native shrubs, grasses, and forbs that provide a sequence of floral resources (Bugg et al., 1998; Garbach and Long, 2017; Long et al., 2017). Our previous studies examined how these hedgerows affect pollinator populations and communities, focusing on time since restoration in two types of studies: before-after-control-impact (Kremen and M'Gonigle, 2015; M'Gonigle et al., 2015) or space-for-time substitution (Ponisio et al., 2016, 2017). These studies have demonstrated that hedgerows have a strong positive impact on pollinator occupancy rates, local and regional species richness, functional diversity, occurrence of resource specialists, and plant-pollinator network characteristics. Additional studies demonstrated that hedgerows promote spillover of individuals into adjacent fields (Morandin and Kremen, 2013), leading to enhanced pest control and pollination services (Morandin et al., 2016), although pollination improvements were not observed for all crops (Sardiñas and Kremen, 2015).
Thus, in California, hedgerows appear to promote the conservation of native pollinators in intensively-managed landscapes and, in some crops, pollination services. Existing studies have not yet examined, however, which aspects of hedgerow maturation are responsible for the observed changes in pollinator community composition. Understanding how pollinator communities respond to local changes in site conditions as hedgerows mature, such as the availability of floral or nesting resources, can help guide the design of more effective hedgerows that promote pollinators and/or pollination services.
Here, we used data collected over 9 field seasons within a 10 year period in a before-after-control-impact design, to ask how metrics of pollinator community composition change in response to local site characteristics (floral and nesting resources) and to surrounding landscape characteristics (area of natural habitat). Comparing against unmanaged field edges (controls), we asked: (1) How do floral and nesting resources change with years post-restoration and surrounding landscape characteristics? (2) How do bee community responses (abundance, species richness, diversity, evenness and functional diversity) change with local (i.e., hedgerow) and surrounding landscape characteristics, and years post-restoration? (3) How long after hedgerow planting does it take to observe consistent changes in bee community composition relative to initial conditions? We were also interested in determining whether crop-visiting bees show similar or distinct responses to the entire bee community.
We expected to find that floral and nesting resources were enhanced as hedgerows matured relative to controls and that bee community responses would track these changes, leading to greater abundance, richness, diversity and functional diversity, but lower evenness as rarer species colonized the hedgerows. Because so little natural habitat occurs in the landscape we studied (0–4.5% natural cover in regions extending 1,500 m out from our sites), we did not expect to see an effect of natural habitat on bee community metrics. Finally, we expected that inclusion of local site characteristics (e.g., floral and/or nesting resources) would substitute for hedgerow maturation (years post-restoration, or ypr), leading to its non-inclusion in final models. Further, we expected changes in bee community composition relative to initial conditions would only be consistent at least 4 years post-planting, at which point shrubs are sufficiently mature that they produce large floral displays.
2. Materials and Methods
2.1. Study Sites and Collection Methods
Located in the Central Valley of California (Yolo County), our study area is an intensively-managed landscape comprising conventional (i.e., using an array of synthetic pesticides and fertilizers, irrigation and mechanization) field crops, grape vineyards, and orchards (Figure S1). Field crops typically rotate annually; common crops in the region are safflower, tomato, wheat, grass, sunflower, melon. Common orchard crops include almond, walnut and plum. We selected five farm edges for restoration and 10 non-restored control edges. Hedgerows were planted in 2007 and 2008 with native perennial shrubs and trees (e.g., Cercis occidentalis, Ceanothus spp., Rosa californica, Heteromeles arbutifolia, Sambucus mexicana, Eriogonoum spp., Baccharis spp., Salvia spp., and others; see Table S1 for a complete list of shrub plantings by site). Hedgerow restorations were approximately 350 m long and 3–6 m wide, bordering large crop fields (ca. 30 hectare). In 2008, nine regularly-spaced small plots (1 × 8 m) were seeded with forb mixtures made up of nine locally-native annual or perennial forb species within the genera Escholtzia, Grindelia, Lupinus, Lotus, Phacelia, Trifolium spp., as described in detail in Wilkerson et al. (2014). Hedgerows were irrigated and weeded for 3 years, after which no further management was needed (except for some replanting in 2009 of species or individuals that did not take; see Figure S2 for an example of a restoration prior to and 6 years after restoration). Pollinator sampling at each restoration site began 1 year prior to restoration, except at one site where sampling began earlier in the same year that restoration occurred (see Table S2 for an overview of sampling history per site). Restoration and control sites were sampled in each year of the study to achieve a before-after-control-impact design (Underwood, 1994; Kremen and M'Gonigle, 2015).
Control sites were selected to match conditions surrounding restoration sites. For each restoration site, we selected two control sites adjacent to the same crop type (rotational field crop, orchard, pasture, or vineyard), within the same landscape context (i.e., within 1–3 km of the restoration site), but >1 km from all other study sites. Control sites were generally weedy field edges and reflect a variety of unmanaged crop field edges found in the region as the pre-restored condition (Figure S1). Such edges typically contain a variety of non-native forbs, grasses, shrubs, and trees and may at times be tilled, treated with pesticides, or left alone. The most common flowering plants at these sites are Convolvulus arvensis, Brassica spp., Lepidium latifolium, Picris echioides, and Centaurea solstitialis. Many of these species have also established at restoration sites.
We sampled pollinator communities at each restoration and control site three or more times per year from 2006 until 2014 (with a few exceptions; see Table S2). All sampling was conducted between April and August. Dates of sampling were spread evenly across this time period. Sites were selected in random order for sampling and, once all sites had been sampled, the process began again for the next sample round. Due to logistical constraints, no sampling was conducted in 2010.
Insect pollinators were netted in timed samples along a 350 m transect, pausing the timer while handling specimens and identifying the plant species from which each specimen was collected, until 1 h of netting time had elapsed. Surveys were only conducted under sunny conditions when the temperature was above 21°C and wind speed was below 2.5 m/s. While all insect visitors that contacted the reproductive parts of the flower were collected, here we focus our analyses only on wild bees (non-honey bees). Specimens were identified to species (or morpho-species for some bee specimens in the genera Lasioglossum, Nomada, and Sphecodes) by an expert taxonomist (Robbin Thorp, Professor Emeritus, UC Davis).
2.2. Functional Traits
Traits selected for assessing functional diversity were resource capture and use traits, as described previously (Kremen and M'Gonigle, 2015; Ponisio et al., 2016). Qualitative traits for bees included sociality, nesting location, nesting habit, lecty (degree of pollen specialization), and whether the species is known to pollinate crops. Following Burkle et al. (2013), we classified bees as social (including primitively social to eusocial) or solitary based on Michener (2000). Following Williams et al. (2011), we classified nesting location as above- or below-ground and nesting habit as constructing a nest (excavator) or using a pre-existing cavity (renter). Nesting location was based on Krombein et al. (1979), Michener (2000), Cane et al. (2007), and Sheffield et al. (2011), and nesting habit was based on Michener (2000). Lecty was classified as oligo (specialist) or poly (generalist) lectic, based on Krombein et al. (1979). Bee species were classified as crop visitors if they had been detected as visitors during studies conducted in the sample area on the main pollinator-dependent crops grown in the region (watermelon, tomato, sunflower, and almond, Kremen et al., 2004; Greenleaf and Kremen, 2006a,b; Klein et al., 2012; Brittain et al., 2013a,b; Sardiñas et al., 2016). We omitted the five cleptoparasitic species (13 specimens) from the functional trait analysis because such species depend on their host species for pollen and nest construction and thus cannot be scored for several of the qualitative characteristics.
Quantitative traits for bees included mean body size and floral resource specialization. For body size, we used log-transformed inter-tegular distance as a proxy for mobility (Greenleaf et al., 2007), measuring from one to five specimens under a dissecting microscope. We calculated floral resource specialization and regional abundance based on a more inclusive data set (this data set plus additional data collected in the same study area on an additional 48 hedgerow and control sites using identical sampling methods within the same set of sample years; Morandin and Kremen, 2013; Ponisio et al., 2017, C. Kremen, unpublished data). For floral resource specialization, for each bee species in our data, we calculated the metric d′, which measures the deviation of the observed interaction frequency from a null model in which all partners interact in proportion to their abundances (Blüthgen et al., 2006); thus, it is not confounded with abundance as is the total number of interaction partners (Winfree et al., 2014). It ranges from 0 for generalist species to 1 for specialist species. In contrast to lecty, measurements of d′ includes floral visits both for pollen to provision larvae and for nectar and pollen for adult food, reflecting both larval and adult diet breadth.
3. Measuring Site and Landscape Characteristics
3.1. Floral Diversity
In order to investigate how restoration affects pollinator communities via changes in floral composition, we calculated a Shannon diversity index for the plants blooming at each site. On, or within several days of, each bee survey date, we surveyed 50 1m2 quadrats for the presence of blooming plant species, and used the incidence of each blooming species among those 50 quadrats as a proxy for its abundance when calculating the Shannon diversity index (see Figure S3 for further details about quadrat placement). For each site, this metric was calculated at each sample date within a year (for pollinator community composition analyses) or across all dates within a year (for pollinator functional diversity analyses, see below).
3.2. Nesting Resources
During one of the floral diversity surveys each year, we also noted several characteristics previously associated with nesting resources for above or below-ground nesting bees (Potts et al., 2005; Sardiñas and Kremen, 2014). In each of the 50 1m2 quadrats, we estimated the percentages of the quadrat comprising exposed bare ground or covered by dead wood as indicators of below or above-ground nesting habitat, respectively. We then used the average percentage across all 50 quadrats as a metric of “percent bare ground” or “percent dead wood” at each site in each year.
3.3. Natural Cover
We used a habitat classification method developed in Karp et al. (2016) to quantify the extent of semi-natural habitat surrounding a site. This method accounts for nearby natural habitat likely having a greater impact on a focal site than natural habitat that is farther away (see also Miguet et al., 2017). It does this by weighting each cover type fragment according to its distance from the focal site, and summing the resultant distance-weighted areas. Weights are calculated using a Gaussian function with a decay rate α, such that each fragment is assigned a weight of W = e−d2/(2*α2), where d is the distance from the focal site. Reducing α lowers the weight assigned to distant fragments relative to the weight assigned to near fragments. Here, we chose a decay rate equal to α = 350 which translates to effects of natural habitat beyond 1 km being negligible, which fits within typical bee foraging movements (Greenleaf et al., 2007; Kennedy et al., 2013). To determine the area of surrounding natural habitat within a 1 km radius of each hedgerow, we classified aerial imagery data from the National Agricultural Imagery Program (NAIP, 1 m2 resolution, https://www.fsa.usda.gov/programs-and-services/aerial-photography/imagery-programs/naip-imagery/) for Yolo County using heads-up digitizing in ArcGIS (version 10.1, Environmental Systems Research Institute, Redlands, CA, USA) to identify patches of semi-natural habitat, which in this intensively-farmed landscape were restricted to riparian and riparian-scrub habitats. For samples collected prior to 2010, we developed cover scores from 2006 NAIP data, and for those collected during or after 2010, we developed cover scores from 2012 NAIP data.
3.4. Statistical Analyses
All continuous predictors were centered prior to analysis to allow direct comparison of the magnitude of effect sizes. Sample day and day2 were included as explanatory variables in all models (except where noted otherwise) to account for seasonality (M'Gonigle et al., 2015), as were random effects of site and year to account for non-independence among samples collected from the same site or within the same year.
3.4.1. Floral and Nesting Resources
To investigate whether floral or nesting resources changed as a result of restoration, we modeled floral diversity (see above), dead wood, or bare ground as a function of the number of years post-restoration (ypr) for each site in each year. Values of ypr are initially 0 for all sites and then, for hedgerow sites, increase by +1 each year following planting. For example, a site restored in 2007 would have a value of ypr = 0 in 2006 and 2007, and a value of 1 in 2008, 2 in 2009, and so on. Use of a quantitative predictor such as ypr permits greater flexibility in analyses then a classic before-after coding scheme. A before-after coding is better suited to analyzing a pulse disturbance, whereas we studied a press disturbance (the maturation of hedgerows and their effects on site characteristics and flower visitor communities).
3.4.2. Community and Functional Composition
To investigate whether pollinator community composition tracked changes in floral resources over time, we used generalized linear mixed models (GLMM) to model aggregate abundance (Negative Binomial error), species richness (Gaussian error, Chao1 estimator, transformed as (natural log+1); Chao, 2006), species diversity (Gaussian error, Shannon index) and species evenness (Gaussian error, Evar; 82 of 412 total samples had ≤ 1 species and, thus, had to be dropped, Smith and Wilson, 1996) as a function of floral diversity, natural cover, ypr, and the interactions of ypr with floral diversity and natural cover. Transformations were used when necessary to achieve normality. After constructing the full model with these terms, we used Likelihood Ratio Tests to compare successively simpler models, dropping the least significant interaction or main effect at each step (Zuur et al., 2009). We wished to determine if changes in floral diversity or natural cover could substitute for ypr or, if not, whether they interacted with ypr. We were also interested in whether changes in above or below ground nesting resources led to changes in the corresponding groups of pollinators; however, since neither resource (dead wood or bare ground) showed a significant response to restoration (see section 4), we do not present models investigating responses of above or below ground bee communities to these variables.
We also used GLMM to analyze functional diversity (Gaussian error) except that samples at each site were combined within each year. We used functional dispersion (Fdis, square-root transformed, one sample with 0 species was dropped) as our metric of functional diversity. Fdis measures how communities fill an n-dimensional trait space independently of species richness (Laliberté and Legendre, 2010). Fdis is the sum of the abundance-weighted distances of each species from the community centroid in the n-dimensional trait space, normalized by abundance. Pooling data from multiple site visits within each year ensured that samples contained enough species to calculate Fdis. The first three samples per site within each year were pooled for analysis (see Table S2), in order to maintain consistency among sites in sample effort and seasonal timing. Model structure was the same as above, except that within-season effects (e.g., sample day and day2) were excluded because they were no longer meaningful.
Finally, in order to determine how long after restoration significant changes in community and functional metrics are detectable, we replaced ypr with a categorical years-post-restoration predictor (yprF) in those original models in which ypr was retained as a significant main or interactive effect. Here, we omitted the floral diversity and natural cover co-variates, but retained seasonal and random effects, in order to focus on the temporal component.
4. Results
Across the 9 sample years and 15 sites, we collected 7,179 specimens comprising 101 bee species (including 4 morphospecies containing a total of 11 specimens). Forty-two species in the sample (41.5%) were known to visit crops common to the region, and comprised the majority of individuals in the sample (6,125 specimens, 85.3%). The subset of data used for functional diversity analysis included 5,718 specimens comprising 84 species, after removing those species for which trait data was incomplete (16 species including cleptoparasites, 44 specimens in total) and some samples to standardize sampling across sites (1,417 specimens).
Floral diversity increased linearly and significantly in response to ypr (effect size = 0.147; p < 0.001) and the amount of natural cover in the surrounding landscape (effect size = 0.21; p < 0.037). A positive interaction between ypr and the amount of natural habitat cover (effect size = 0.042; p = 0.021) meant that floral diversity increased faster with ypr for sites with greater surrounding natural habitat cover (Figure 1). Neither the amount of dead wood nor the amount of bare ground increased with ypr or surrounding natural cover.

Figure 1. Effect of restoration on floral diversity. Points show Shannon diversity values for each sample at each site in each year. Lines show model-estimated curves for different possible values of adjacent natural cover (from bottom to top, curves correspond to the 5th, 50th, and 95th quantiles for levels of natural cover observed in our data-set).
Species abundance increased significantly with floral diversity, while species evenness declined (Table 1, Figures 2a,c). Species richness, species diversity and functional dispersion increased with floral diversity and ypr, but these factors had a negative interaction, such that species richness in new and maturing hedgerows increased with increasing floral diversity, while mature hedgerows had a stable or negative response to increased floral diversity (Table 1, Figures 2b,d, 3). Surrounding natural cover also had a weak, but significant, positive effect on species richness (p = 0.046) and functional dispersion (p = 0.034) (Table 1).
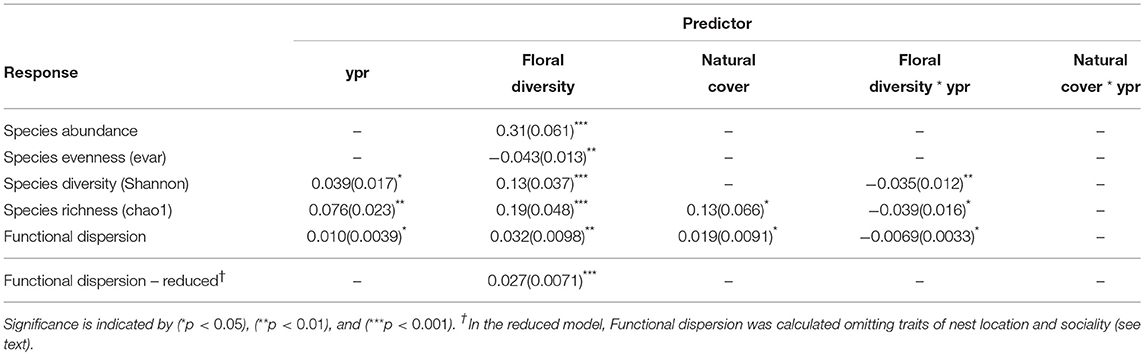
Table 1. Effect sizes and standard errors (parentheses) for GLMM results of pollinator community response to years post restoration (ypr), floral diversity and natural cover, showing the covariates retained in the final, most parsimonious model.
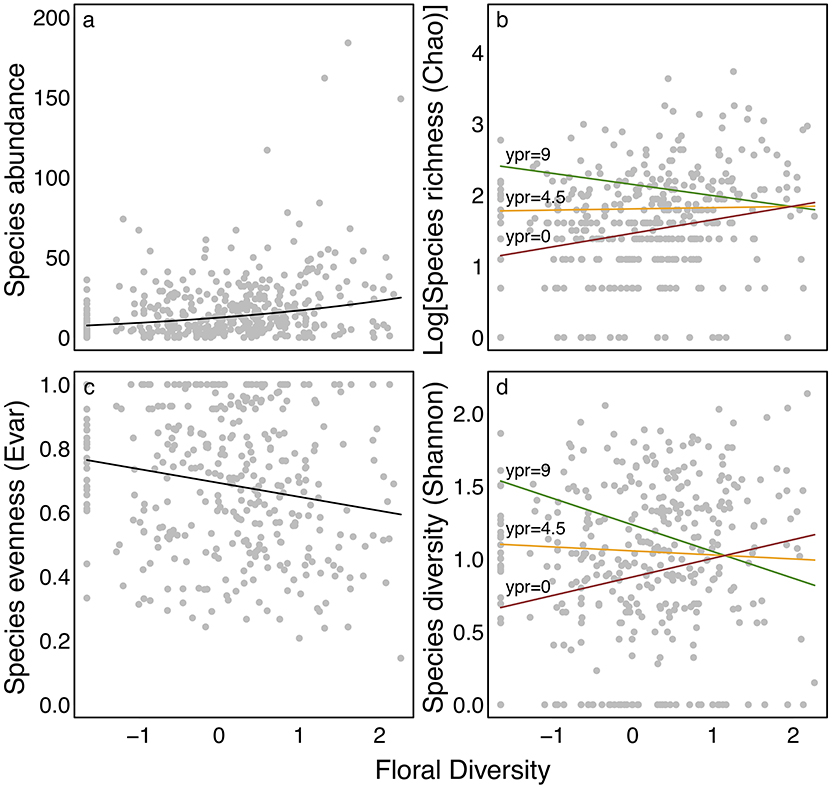
Figure 2. Effect of floral diversity on (a) abundance, (b) estimated species richness, (c) species evenness, and (d) species diversity in bees. Points show calculated values of each metric for each sample at each site within each year and lines show curves for best fit models, as presented in Table 1. Curves in (b,d) show the predicted effect of floral diversity for for restorations of different ages (ypr) with colors corresponding to 0 (the minimum; red), 4.5 (the mean; orange), and 9 (the maximum; green). All other parameters were set to their mean values.
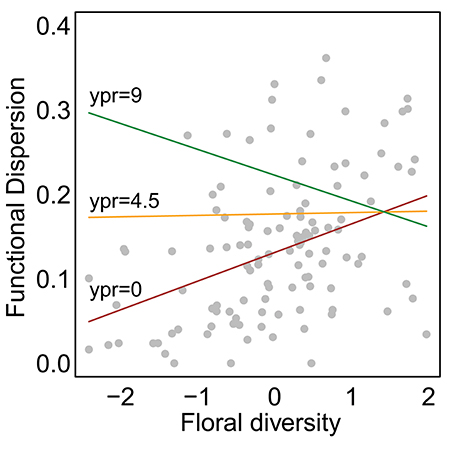
Figure 3. Effect of natural cover on trait functional dispersion. Points show calculated values for each site in each year and lines show model-estimated curves. Curves show different restoration ages (ypr) with colors corresponding to 0 (the minimum; red), 4.5 (the mean; orange), and 9 (the maximum; green). All other parameters were set to their mean values. Unlike Figure 2, data from multiple visits were pooled for each site within each year.
A consistent positive change in species richness and diversity occurred at 5 years post restoration and beyond (Figures 4A,B). Notably, there was also a significant positive change at 2 years post restoration. Since plants were young at this stage and provided few to no blooms, this increase may indicate that the sites selected for hedgerow plantings were already somewhat higher in bee richness then control sites. We found significant changes in functional dispersion only at 4 and 8 years compared to the initial community (Figure 4C).
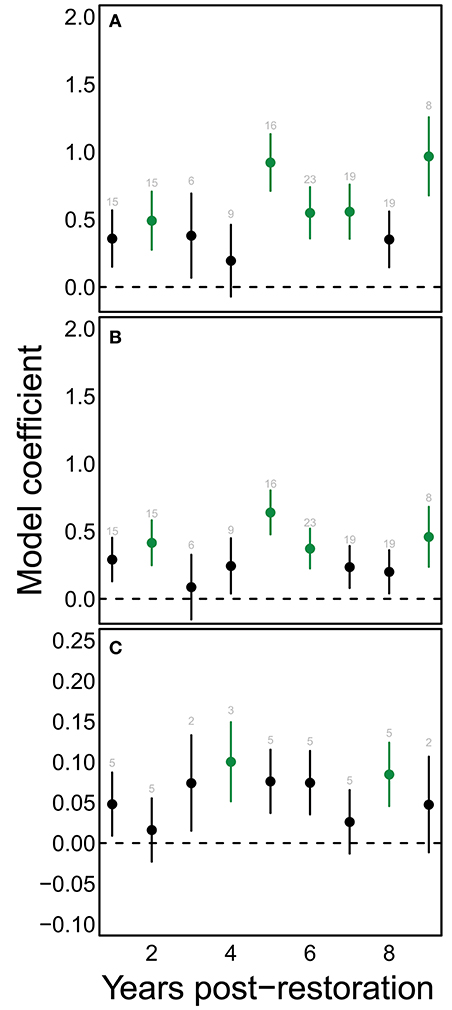
Figure 4. Restoration has significant effects on bee communities chiefly after the first 5 years of restoration. Points show mean model estimates for the effect of each value of yprF on (A) estimated species richness, (B) Shannon diversity, and (C) functional dispersion. Vertical bars denote the standard error of this estimate. Green coloring indicates values that are significantly different from the starting condition (yprF=0). Text above each point indicates the number of samples for that value on the horizontal axis.
5. Discussion
Bee species abundance and evenness tracked changes in floral diversity (Figure 2), and no other variables were explanatory. As predicted, abundance responded positively to greater floral diversity, while evenness declined, probably due to the addition of a greater number of rare species. Bee species diversity, richness, and functional diversity (as measured by functional dispersion) also responded positively to increases in floral diversity, but only in young and maturing hedgerows. In contrast, these quantities declined in response to floral diversity at the most mature hedgerows. This effect was more pronounced for functional diversity than for species diversity or richness. At sites with the highest floral diversity levels (i.e., more mature hedgerows, Figure 1), higher floral diversity may be associated with reduced densities of preferred or total floral resources, leading to reduced visitation. For example, Hegland and Boeke (2006), studying a semi-natural grassland in Norway, found that floral visitor occurrence, richness, and activity all responded more strongly to total floral density than floral diversity. Williams et al. (2015), studying the response of pollinator communities to wildflower plantings in farmland, similarly found that, when using plant mixes that provide continuous bloom, pollinator abundance and richness responded to floral display size rather than to floral diversity. Alternatively, the changes in visitor response to floral diversity with hedgerow maturation may reflect a saturating community assembly process with increased floral resources. In experimentally assembled plant communities of varying floral richness, Ebeling et al. (2008) found that pollinator community richness saturated as floral density increased over 15 percent or floral richness increased over nine species.
Floral diversity of hedgerows increased as hedgerows matured, and this pattern was stronger when hedgerows were nearer to natural habitats (Figure 1). An increase in floral diversity associated with natural habitat could occur if native or non-native plant species colonize from nearby semi-natural habitat patches. The majority of species that colonized hedgerow plantings (i.e., non-planted species that were not present in floral samples in the year prior to planting) were non-native; these species could have been present in the seed bank, or have colonized either from surrounding agricultural or semi-natural habitats. Semi-natural habitats may provide refugia for weed species; in Europe, greater complexity of the surrounding landscape had a positive effect on weed species diversity of both vegetation and seed bank within agricultural fields (Roschewitz et al., 2005). Alternatively, floral diversity at hedgerows may be responding to other factors that are correlated negatively or positively with semi-natural habitat. Since our floral diversity metric measured the diversity of what was blooming at each sampling event (as opposed to plant species diversity), changes in the floral diversity metric may reflect slight site-to-site alterations in the timing or duration of flowering, rather than addition of species. Such changes in flowering phenology might be due to micro-climate, soil type, or urban heat-island effects (Dunne et al., 2003; Neil and Wu, 2006; Dahlgren et al., 2007) that could be correlated to the proportion and distribution of nearby natural habitat.
In contrast to floral diversity, we did not observe a significant relationship between the amount of dead wood or bare ground as hedgerows matured. Because above-ground nesting bees respond positively to hedgerow additions (Kremen and M'Gonigle, 2015), we expected that hedgerows would enhance woody material and nesting sites. In contrast, the lack of change in bare ground with hedgerow maturation corroborates our earlier results comparing 8 mature hedgerow sites and 8 controls, in which we found no changes in 4 indicators of ground-nesting resources (bare exposed ground, slope variability, surface soil compaction and soil particle size) or in the nesting rates of ground-nesting bees (Sardiñas et al., 2016). It may be that the quantification of dead wood used here is not an accurate proxy for the amount of above-ground wood or the availability of above-ground nesting sites. The proxies used in our study and previously by Sardiñas et al. (2016) were recommended by Potts et al. (2005) based on a study in Israel, but these resources may be less applicable in other regions. Until better methods for estimating nesting resources are developed and validated, data on proxies for nesting site resources should be carefully interpreted.
Finally, contrary to our expectations, local and landscape site characteristics did not entirely replace years post restoration as an explanatory variable, since bee species diversity, richness, and functional diversity still responded positively to this variable. The length of time since planting may be a proxy for other unmeasured variables that are enhanced with time, such as nesting resources, which we may have failed to measure adequately. Examining the response to years post restoration in more detail (Figure 4) shows that bee community responses to shrub-based habitat enhancements take time—as we expected, consistent increases in species richness and other metrics relative to non-restored conditions generally occurred after five or more years had passed since restoration. The more variable behavior of functional diversity may reflect a weaker ability to detect changes in this metric, because of lower resolution in the metric (fewer functional types than species), and lower power (annual vs. per sample calculation of functional dispersion metric). The bee community responses that we observed over the 9 years following planting may not represent saturated community responses. In other studies in which we compared these “maturing” sites with both “mature” (≫10 years) hedgerows and unrestored controls, we found that mature hedgerows displayed greater beta and functional diversity (Ponisio et al., 2016) than maturing hedgerows. However both maturing and mature hedgerows displayed substantial turnover in pollinators and plant-pollinator interactions, indicating the dynamic nature of these communities (Ponisio et al., 2017).
Crop-visiting species made up the majority of records in our sample, primarily due to the dominance of two species in bee communities, Lasioglossum (Dialictus) incompletum and Halictus tripartitus. These two species dominate not only hedgerow and control sites within agriculture but also nearby natural habitats (Forrest et al., 2015). Not surprisingly, therefore, all significant responses that we observed for the entire bee community were also observed for the subset of crop-visiting species, except for minor changes in the model for functional dispersion. Hedgerows, therefore, enhance communities of crop-visiting species and have the potential to support pollination services, although the amount of support is likely to be crop, scale, and context specific (Sardiñas and Kremen, 2015).
Bee species richness and functional diversity were both positively associated with the amount of surrounding natural cover. Natural habitat patches may supply colonists to maturing and mature hedgerows, and may specifically enrich certain functional types. To query this hypothesis, we examined the correlations between average trait states at our hedgerow and control sites (i.e., trait values weighted by relative abundances) and surrounding natural habitat. Sociality and nest location were significantly correlated to natural cover, with solitary, above-ground nesting bees more likely to be associated with natural cover. After removing sociality and nest location traits and re-calculating the functional dispersion metric, we no longer found any significant effect of surrounding natural habitat but only floral diversity (Table 1). These findings suggest that nearby natural habitat may contribute solitary and above-ground nesting colonists to hedgerow sites, and aligns with a study conducted in the same region showing that farmed land, whether organic or conventional, imposes strong filters on bee functional types, weeding out bees with above-ground nesting and solitary traits found in adjacent natural habitats (Forrest et al., 2015). Through habitat creation and subsequent community assembly, hedgerow plantings, in combination with nearby natural habitat remnants, may reverse some of the functional and community disassembly that occurs as natural habitats are converted to farmlands.
Data Availability Statement
The datasets analyzed for this study can be found in the https://github.com/leithen/hedgerow_traits.
Author Contributions
CK designed the study; CK, LM, and LP collected data; CK and LM analyzed data with LP's input. CK wrote the manuscript and all authors contributed to revisions.
Funding
This work was supported by funding from the Army Research Office (W911NF-11-1-0361 to CK), the Natural Resources Conservation Service (CIG-69-3A75-12-253, CIG-69-3A75-9-142, CIG-68-9104-6-101, and WLF-69-7482-6-277 to The Xerces Society), the National Science Foundation (DEB-0919128 to CK), the U.S. Department of Agriculture (USDA-NIFA 2012-51181-20105 to Michigan State University), USDA-NIFA and NSF predoctoral fellowships to LP and The Natural Sciences and Engineering Research Council of Canada (Discovery Grant to LM). Publication made possible in part by support from the Berkeley Research Impact Initiative (BRII) sponsored by the UC Berkeley Library.
Conflict of Interest Statement
The authors declare that the research was conducted in the absence of any commercial or financial relationships that could be construed as a potential conflict of interest.
Acknowledgments
We thank the growers and land owners that allowed us to work on their property and Dr. Robbin Thorp (Professor Emeritus, University of California, Davis) for identifying our bee specimens. We would also like to thank T. Shih, M. VanDyke, K. Ullman, C. Locke, H. Wallis, S. Kaiser, K. Cutler, H. Sardiñas, and the many field and lab assistants that have helped over 10 years of data collection and specimen processing.
Supplementary Material
The Supplementary Material for this article can be found online at: https://www.frontiersin.org/articles/10.3389/fevo.2018.00170/full#supplementary-material
References
Blaauw, B. R., and Isaacs, R. (2014). Flower plantings increase wild bee abundance and the pollination services provided to a pollination-dependent crop. J. Appl. Ecol. 51, 890–898. doi: 10.1111/1365-2664.12257
Blüthgen, N., Menzel, F., and Blüthgen, N. (2006). Measuring specialization in species interaction networks. BMC Ecol. 6:9. doi: 10.1186/1472-6785-6-9
Brittain, C., Kremen, C., and Klein, A. M. (2013a). Biodiversity buffers pollination from changes in environmental conditions. Global Change Biol. 19, 540–547. doi: 10.1111/gcb.12043
Brittain, C., Williams, N., Kremen, C., and Klein, A. M. (2013b). Synergistic effects of non-Apis bees and honey bees for pollination services. Proc. R. Soc. B 280:20122767. doi: 10.1098/rspb.2012.2767
Bugg, R. L., Anderson, J. H., Thomsen, C. D., and Chandler, J. (1998). “Farmscaping in California: hedgerows, roadside plantings and wild plants for biointensive pest management,” in Enhancing Biological Control: Habitat Management to Promote Natural Enemies of Agricultural Pests, eds C. H. Pickett and R. L. Bugg (Berkeley, CA: University of California Press), 339–374.
Burkle, L. A., Marlin, J. C., and Knight, T. M. (2013). Plant-pollinator interactions over 120 years: loss of species, co-occurrence, and function. Science 339, 1611–1615. doi: 10.1126/science.1232728
Cane, J. H., Griswold, T., and Parker, F. D. (2007). Substrates and materials used for nesting by North American Osmia bees (hymenoptera: Apiformes: Megachilidae. Ann. Entomol. Soc. Am. 100, 350–358. doi: 10.1603/0013-8746(2007)100[350:SAMUFN]2.0.CO;2
Chao, A. (2006). “Species estimation and applications,” in Encyclopedia of Statistical Sciences (John Wiley & Sons). doi: 10.1002/0471667196.ess5051
Dahlgren, J. P., von Zeipel, H., and Ehrlén, J. (2007). Variation in vegetative and flowering phenology in a forest herb caused by environmental heterogeneity. Am. J. Bot. 94, 1570–1576. doi: 10.3732/ajb.94.9.1570
Dunne, J. A., Harte, J., and Taylor, K. J. (2003). Subalpine meadow flowering phenology responses to climate change: integrating experimental and gradient methods. Ecol. Monograph. 73, 69–86. doi: 10.1890/0012-9615(2003)073[0069:SMFPRT]2.0.CO;2
Ebeling, A., Klein, A. M., Schumacher, J., Weisser, W. W., and Tscharntke, T. (2008). How does plant richness affect pollinator richness and temporal stability of flower visits? Oikos 117, 1808–1815. doi: 10.1111/j.1600-0706.2008.16819.x
Forrest, J. R. K., Thorp, R. W., Kremen, C., and Willams, N. M. (2015). Contrasting patterns in species and functional-trait diversity of bees in an agricultural landscape. J. Appl. Ecol. 52, 706–715. doi: 10.1111/1365-2664.12433
Garbach, K., and Long, R. F. (2017). Determinants of field edge habitat restoration on farms in California's sacramento valley. J. Environ. Manage. 189, 134–141. doi: 10.1016/j.jenvman.2016.12.036
Garibaldi, L. A., Carvalheiro, L. G., Leonhardt, S. D., Aizen, M. A., Blaauw, B. R., Isaacs, R., et al. (2014). From research to action: enhancing crop yield through wild pollinators. Front. Ecol. Environ. 12, 439–447. doi: 10.1890/130330
Garibaldi, L. A., Steffan-Dewenter, I., Winfree, R., Aizen, M. A., Bommarco, R., Cunningham, S. A., et al. (2013). Wild pollinators enhance fruit set of crops regardless of honey bee abundance. Science 339, 1608–1611. doi: 10.1126/science.1230200
Greenleaf, S. S., and Kremen, C. (2006a). Wild bee species increase tomato production and respond differently to surrounding land use in Northern California. Biol. Cons. 133, 81–87. doi: 10.1016/j.biocon.2006.05.025
Greenleaf, S. S., and Kremen, C. (2006b). Wild bees enhance honey bees' pollination of hybrid sunflower. Proc. Natl. Acad. Sci. U.S.A. 103, 13890–13895. doi: 10.1073/pnas.0600929103
Greenleaf, S. S., Williams, N. M., Winfree, R., and Kremen, C. (2007). Bee foraging ranges and their relationship to body size. Oecologia 153, 589–596. doi: 10.1007/s00442-007-0752-9
Gurr, G. M., Lu, Z., Zheng, X., Xu, H., Zhu, P., Chen, G., et al. (2016). Multi-country evidence that crop diversification promotes ecological intensification of agriculture. Nat. Plants. 2:16014. doi: 10.1038/nplants.2016.14
Hegland, S. J., and Boeke, L. (2006). Relationships between the density and diversity of floral resources and flower visitor activity in a temperate grassland community. Ecol. Entomol. 31, 532–538. doi: 10.1111/j.1365-2311.2006.00812.x
Karp, D. S., Moses, R., Gennet, S., Jones, M. S., Joseph, S., M'Gonigle, L. K., et al. (2016). Agricultural practices for food safety threaten pest control services for fresh produce. J. Appl. Ecol. 53, 1402–1412. doi: 10.1111/1365-2664.12707
Kennedy, C. M., Lonsdorf, E., Neel, M. C., Williams, N. M., Ricketts, T. H., Winfree, R., et al. (2013). A global quantitative synthesis of local and landscape effects on wild bee pollinators in agroecosystems. Ecol. Lett. 16, 584–599. doi: 10.1111/ele.12082
Kleijn, D., Winfree, R., Bartomeus, I., Carvalheiro, L. G., Henry, M., Isaacs, R., et al. (2015). Delivery of crop pollination services is an insufficient argument for wild pollinator conservation. Nat. Commun. 6:7414. doi: 10.1038/ncomms8414
Klein, A. M., Brittain, C., Hendrix, S. D., Thorp, R., Williams, N., and Kremen, C. (2012). Wild pollination services to California almond rely on semi-natural habitat. J. Appl. Ecol. 49, 723–732. doi: 10.1111/j.1365-2664.2012.02144.x
Koh, I., Lonsdorf, E. V., Williams, N. M., Brittain, C., Isaacs, R., Gibbs, J., et al. (2016). Modeling the status, trends, and impacts of wild bee abundance in the United States. Proc. Natl. Acad. Sci. U.S.A. 113, 140–145. doi: 10.1073/pnas.1517685113
Kovács-Hostyánszki, A., Espíndola, A., Vanbergen, A. J., Settele, J., Kremen, C., and Dicks, L. V. (2017). Ecological intensification to mitigate impacts of conventional intensive land use on pollinators and pollination. Ecol. Lett. 20, 673–689. doi: 10.1111/ele.12762
Kremen, C., and M'Gonigle, L. K. (2015). Small-scale restoration in intensive agricultural landscapes supports more specialized and less mobile pollinator species. J. Appl. Ecol. 52, 602–610. doi: 10.1111/1365-2664.12418
Kremen, C., Williams, N. M., Bugg, R. L., Fay, J. P., and Thorp, R. W. (2004). The area requirements of an ecosystem service: crop pollination by native bee communities in California. Ecol. Lett. 7, 1109–1119. doi: 10.1111/j.1461-0248.2004.00662.x
Krombein, K. V., Hurd, J. P. D., Smith, D. R., and Burks, B. D. (1979). Catalog of Hymenoptera in America North of Mexico. Washington, DC: Smithsonian Institution Press.
Laliberté, E., and Legendre, P. (2010). A distance-based framework for measuring functional diversity from multiple traits. Ecology 91, 299–305. doi: 10.1890/08-2244.1
Long, R. F., Garbach, K., and Morandin, L. A. (2017). Hedgerow benefits align with food production and sustainability goals. Calif. Agricult. 71, 117–119. doi: 10.3733/ca.2017a0020
M'Gonigle, L. K., Ponisio, L. C., Cutler, K., and Kremen, C. (2015). Habitat restoration promotes pollinator persistence and colonization in intensively-managed agriculture. Ecol. Appl. 25, 1557–1565. doi: 10.1890/14-1863.1
M'Gonigle, L. K., Williams, N. M., Lonsdorf, E., and Kremen, C. (2017). A tool for selecting plants when restoring habitat for pollinators. Conserv. Lett. 10, 105–111. doi: 10.1111/conl.12261
Miguet, P., Fahrig, L., and Lavigne, C. (2017). How to quantify a distance-dependent landscape effect on a biological response. Methods Ecol. Evol. 8, 1717–1724. doi: 10.1111/2041-210X.12830
Morandin, L. A., and Kremen, C. (2013). Hedgerow restoration promotes pollinator populations and exports native bees to adjacent fields. Ecol. Appl. 23, 829–839. doi: 10.1890/12-1051.1
Morandin, L. A., Long, R. F., and Kremen, C. (2016). Pest control and pollination cost-benefit analysis of hedgerow restoration in a simplified agricultural landscape. J. Econ. Entomol. 109, 1020–1027. doi: 10.1093/jee/tow086
Neil, K., and Wu, J. (2006). Effects of urbanization on plant flowering phenology: a review. Urban Ecosyst. 9, 243–257. doi: 10.1007/s11252-006-9354-2
Ponisio, L. C., Gaiarsa, M. P., and Kremen, C. (2017). Opportunistic attachment assembles plant-pollinator networks. Ecol. Lett. 20, 1261–1272. doi: 10.1111/ele.12821
Ponisio, L. C., M'Gonigle, L. K., and Kremen, C. (2016). On-farm habitat restoration counters biotic homogenization in intensively managed agriculture. Global Change Biol. 22, 704–715. doi: 10.1111/gcb.13117
Potts, S. G., Vulliamy, B., Roberts, S., O'Toole, C., Dafni, A., Ne'eman, G., et al. (2005). Role of nesting resources in organising diverse bee communities in a Mediterranean landscape. Ecol. Entomol. 30, 78–85. doi: 10.1111/j.0307-6946.2005.00662.x
Rader, R., Bartomeus, I., Garibaldi, L. A., Garratt, M. P. D., Howlett, B. G., Winfree, R., et al. (2016). Non-bee insects are important contributors to global crop pollination. Proc. Natl. Acad. Sci. U.S.A. 113, 146–151. doi: 10.1073/pnas.1517092112
Ramankutty, N., Mehrabi, Z., Waha, K., Jarvis, L., Kremen, C., Herrero, M., et al. (2018). Trends in global agricultural land use: implications for environmental health and food security. Annu. Rev. Plant. Biol. 69, 789–815. doi: 10.1146/annurev-arplant-042817-040256
Roschewitz, I., Gabriel, D., Tscharntke, T., and Thies, C. (2005). The effects of landscape complexity on arable weed species diversity in organic and conventional farming. J. Appl. Ecol. 42, 873–882. doi: 10.1111/j.1365-2664.2005.01072.x
Sardiñas, H. S., and Kremen, C. (2014). Evaluating nesting microhabitat for ground-nesting bees using emergence traps. Basic Appl. Ecol. 15, 161–168. doi: 10.1016/j.baae.2014.02.004
Sardiñas, H. S., and Kremen, C. (2015). Pollination services from field-scale agricultural diversification may be context-dependent. Agric. Ecosyst. Environ. 207, 17–25. doi: 10.1016/j.agee.2015.03.020
Sardiñas, H. S., Ponisio, L. C., and Kremen, C. (2016). Hedgerow presence does not enhance indicators of nest-site habitat quality or nesting rates of ground-nesting bees. Restoration Ecol. 24, 499–505. doi: 10.1111/rec.12338
Sheffield, C. S., Ratti, C., Packer, L., and Griswold, T. (2011). Leafcutter and mason bees of the genus Megachile Latreille (hymenoptera: Megachilidae) in Canada and Alaska. Can. J. Arthropod. Identif. 18, 1–107. doi: 10.3752/cjai.2011.18
Underwood, A. J. (1994). On beyond BACI: sampling designs that might reliably detect environmental disturbances. Ecol. Appl. 4, 3–15. doi: 10.2307/1942110
Wilkerson, M. L., Ward, K. L., Williams, N. M., Ullmann, K. S., and Young, T. P. (2014). Diminishing returns from higher density restoration seedings suggest trade-offs in pollinator seed mixes. Restor. Ecol. 22, 782–789. doi: 10.1111/rec.12141
Williams, N. M., Cariveau, D., Winfree, R., and Kremen, C. (2011). Bees in disturbed habitats use, but do not prefer, alien plants. Basic Appl. Ecol. 12, 332–341. doi: 10.1016/j.baae.2010.11.008
Williams, N. M., and Lonsdorf, E. V. (2018). Selecting cost-effective plant mixes to support pollinators. Biol. Cons. 217, 195–202. doi: 10.1016/j.biocon.2017.10.032
Williams, N. M., Ward, K. L., Pope, N., Isaacs, R., Wilson, J., May, E. A., et al. (2015). Native wildflower plantings support wild bee abundance and diversity in agricultural landscapes across the United States. Ecol. Appl. 25, 2119–2131. doi: 10.1890/14-1748.1
Keywords: habitat restoration, floral enhancement, pollinator, functional diversity, agro-ecosystem, bee, California, intensive agriculture
Citation: Kremen C, M'Gonigle LK and Ponisio LC (2018) Pollinator Community Assembly Tracks Changes in Floral Resources as Restored Hedgerows Mature in Agricultural Landscapes. Front. Ecol. Evol. 6:170. doi: 10.3389/fevo.2018.00170
Received: 02 July 2018; Accepted: 05 October 2018;
Published: 25 October 2018.
Edited by:
Shannon Murphy, University of Denver, United StatesReviewed by:
Jane Memmott, University of Bristol, United KingdomMary A. Jamieson, Oakland University, United States
Copyright © 2018 Kremen, M'Gonigle and Ponisio. This is an open-access article distributed under the terms of the Creative Commons Attribution License (CC BY). The use, distribution or reproduction in other forums is permitted, provided the original author(s) and the copyright owner(s) are credited and that the original publication in this journal is cited, in accordance with accepted academic practice. No use, distribution or reproduction is permitted which does not comply with these terms.
*Correspondence: Claire Kremen, ckremen@berkeley.edu
†These authors have contributed equally to this work