Movement and Biosonar Behavior During Prey Encounters Indicate That Male Sperm Whales Switch Foraging Strategy With Depth
 Saana Isojunno
 Patrick J. O. Miller
- Sea Mammal Research Unit, School of Biology, Scottish Oceans Institute, University of St Andrews, St Andrews, United Kingdom
Despite their apex predator role, relatively little is known about the foraging strategies that deep-diving marine mammals employ to target prey resources available at different depths with different costs of access. Using hidden Markov model (HMM) analysis of behavioral time series, we aimed to quantify the potential for multiple foraging strategies during 3,150 terminal echolocation (“buzz”) phases of 28 tagged male sperm whales in Northern Norway. Movement metrics included in the HMM reflected the predator's pursuit path (vertical velocity, pitch, and heading variance) and locomotion effort (overall dynamic body acceleration ODBA). We found a highly depth-dependent distribution of four buzz types: “Shallow-sparse” (median 161 m) had the highest inter-buzz intervals, “Mid-active” (372 m) were the longest duration buzzes (median 21 s) and the most active in terms of pitch variance, heading variance and ODBA, while “Deep” and “Deep descent” buzzes (1,130–1,180 m) were the shortest in duration (~7 s) and least energetic in maneuvers. Regression models for acoustic metrics with both buzz type and depth as explanatory variables revealed that maximum click rate in a buzz had a strong negative linear relationship with ambient pressure (1.2 Hz every 10 atm or 100 m). After accounting for the effects of pressure, buzz click rates were significantly higher during “Mid-active” than other types of buzzes. Within buzzes, apparent click output level (AOL, off-axis level received by the tag, dB re 1 μPa) correlated linearly with log10(inter-click-interval), as expected by acoustic gain control and increasing sensory volume with increasing click rate. These results indicate that while higher acoustic sampling rates were used to track more mobile prey, buzz clicks were produced more sparingly at high ambient pressures where the number of pneumatically produced clicks may be limited before air must be recycled, and where prey seem easier to subdue. The diverse prey base indicated by this study support the feeding requirements of large male sperm whales, and that high feeding rates of more densely distributed and perhaps more predictable resources (e.g., immobile life stages of female Gonatus fabricii) likely maintain preference for the deepest foraging habitats (> 1 km) of this generalist predator.
Introduction
Deep-diving marine mammals such as sperm whales (Physeter macrocephalus) are central-place foragers that need to balance energetic benefits of foraging at depth with the time, energetic, and physiological costs of diving to depth (Houston and Carbone, 1992). Toothed whales use echolocation clicks to search for and capture prey, which can be recorded using animal-attached acoustic recording data loggers (DTAG, Johnson and Tyack, 2003). Similar to bats, the rate and acoustic features of echolocation pulses, or “clicks” in toothed whales, indicate whether the forager is searching for or attempting to capture prey during the terminal “buzz” phase (Johnson et al., 2004; Miller et al., 2004a; Madsen et al., 2013). Thus, acoustic recording of echolocation provides measures of sensory focus and volumes (Wisniewska et al., 2012) in the context of dive behavior and ecology. Characteristics of their ecological niche can be relevant across deep-diving marine mammals that may play key role as top predators in marine food webs (Heithaus et al., 2008) and sentinel species in marine conservation (Sergio et al., 2008). By integrating both movement and acoustic data (Miller et al., 2004a), it is possible to make increasingly detailed inferences about the distribution and maneuverability, and subsequently the energetic value, of targeted prey (Madsen et al., 2005; Johnson et al., 2008; Arranz et al., 2011).
Cephalopods are an important source of biomass in marine food webs, and their availability at depth has been proposed to be one of the major drivers for the evolution of a larger body size and more extreme diving capabilities in a range of squid-eating marine mammals, such as elephant seals, beaked whales, and sperm whales (Clarke, 1996; Klages, 1996; Whitehead et al., 2003; Slater et al., 2010). Cephalopods provide a diverse food source ranging from muscular and protein rich cephalopods to neutrally buoyant ammoniac squids that are lower in energy content (Kawakami, 1980; Clarke, 1996; Santos et al., 1999, 2002). Some species of cephalopod may be relatively easy to catch as they quickly become exhausted after fast swimming (Clarke, 1996) and they may be targeted at more vulnerable stages of vertical migration (e.g., jumbo squid in Gulf of California, Davis et al., 2007) or ontogenetic stage (Simon et al., 2003). As with any generalist predator, marine mammals exploiting such a diverse resource must therefore balance the energetic value with the cost of finding and handling different prey types.
Sperm whales target mesopelagic and bathypelagic prey and can spend >70% of their time foraging (Watwood et al., 2006; Guerra et al., 2017). While cephalopods form the main component of the sperm whale diet, fish can be important regionally, such as in the high-latitude foraging grounds in in New Zealand (Gaskin and Cawthorn, 1967) and North Atlantic (Martin and Clarke, 1986). These high-latitude foraging grounds are frequented by male sperm whales, while female sperm whales remain at lower latitudes (Whitehead, 2003; Teloni et al., 2008). Despite a substantial biomass in the epipelagic zone, male sperm whales also target deeper prey in the high-latitude foraging grounds (Teloni et al., 2008; Fais et al., 2015). Teloni et al. (2008) showed that sperm whales produced more frequent and shorter buzzes during deep (>800 m) dives compared to shallow dives, indicating more sedentary and densely distributed prey at greater depths. Thus, high-latitude sperm whales provide a case study in central-place foraging where the benefit of more accessible prey at shallower depths might weigh against an elevated cost of prey handling compared to food resources available at greater depths—with larger transport costs and recovery times after prolonged diving.
Different prey types imply different challenges to the sensory-motor system during prey capture. Echolocation requires a tight coupling of both sensory and motor systems, and echolocation tactics can vary depending on a behavioral mode (e.g., between searching and pursuit of prey) and with environmental parameters (e.g., clutter and ambient noise conditions) (Schnitzler et al., 2003; Wisniewska et al., 2012; Madsen and Surlykke, 2013). Relatively fast click rates, or inversely, short inter-click-intervals (ICI), coupled with lower source levels during terminal echolocation, or “buzz,” appear to be a common feature in all studied odontocetes, and indeed most echolocating bat species, highlighting a key function in acoustic gaze control (Madsen and Surlykke, 2013). Reduced source level and increased sampling rates effectively increase the temporal resolution (data rate) to track likely evasive prey while reducing the complexity of the auditory scene and echo ambiguity (Madsen and Surlykke, 2013). Wisniewska et al. (2012) suggest that during buzzing, porpoises reduce their depth of gaze to a single target while engaging in a more reactive mode of sensory-motor operation, i.e., sensory volume is reduced relative to the motor (or stopping) volume (Wisniewska et al., 2012).
As well as the sensory-motor challenge of different prey types, sperm whale biosonar performance may be challenged by the increased hydrostatic pressure at depth (Madsen P. T. et al., 2002). Sperm whale sound production is thought to be pneumatically driven (Ridgway and Carder, 2001; Huggenberger et al., 2014), and the limited volume of gas available to a breath holding deep diver indicates that gas must be recycled (Madsen P. T. et al., 2002). Several observations of pauses in between bouts of usual clicks (also called “regular clicks” in sperm whales) and following buzzes (e.g., Wahlberg, 2002) suggest that pauses function as air-recycling events. Thus, changes in gas volume or density may influence aspects of echolocation output. The number of usual clicks produced in between recycling events (i.e., usual click train duration) has been shown to decrease with depth, consistent with gas volumes being reduced by hydrostatic pressure (Wahlberg, 2002). However, sperm whale usual click levels and frequency content appear to be relatively unaffected by pressure (Madsen P. T. et al., 2002). Nevertheless, if a certain gas volume is required to produce each click, reduced gas volume under pressure could potentially limit click and buzz production.
We investigated these ecophysiological and biomechanical trade-offs using movement and acoustic data from terminal echolocation buzzes of 28 sperm whales outfitted with data loggers near Lofoten Islands, Norway. We set out to (1) test whether the tagged whales engaged in a generalist strategy, with individuals switching between different movement tactics to capture prey, and if so, (2) test whether the movement tactics varied by depth, indicating diversity in targeted prey between depth layers, and (3) quantify the extent to which acoustic behavior during prey capture attempts is influenced by depth (hydrostatic pressure) vs. the movement tactics (indicating prey mobility and maneuverability).
To address these objectives, we first used hidden Markov models (HMMs) to classify buzzes according to their inter-buzz-intervals and movement behavior that were a-priori expected to be related to characteristics of the targeted prey resources rather than hydrostatic pressure (e.g., buzz duration was therefore excluded from the HMM). We then then tested whether the buzz classification (~targeted prey) was random with respect to depth in a second analysis step. For the third objective, we modeled echolocation performance during buzzing (maximum click rate and AOL in a buzz) with both hydrostatic pressure and the buzz movement types (~targeted prey) as explanatory variables. We expected less air to be available for sound production at depth, and thus a reduced number of clicks within a click sequence (i.e., buzz without an air-recycling pause). To test if click rates within buzzes indicate sensory volume, we also tested whether sperm whales simultaneously adjusted click rate and click output levels as expected based upon gain control to target prey at a specific range.
Methods
Data Collection
DTAG acoustic and movement data were collected aboard 28 tagged sperm whales near Lofoten, Norway in 2005, 2008–2010, and 2016–2017 during the summer months (May–July). The field protocol included (1) tagging the whale from a small rigid-hulled inflatable boat (RHIB) using a cantilevered pole (12–15 m) attached to the bow of the RHIB, (2) re-approaching the tagged whale for photo-identification, (3) visual and VHF tracking of the tagged whale, and (4) recovery of the released tag (after 6–23 h of recording). The 2008–2010 and 2016–2017 deployments were subject to controlled exposure experiments within the 3S (Sea mammals, Sonar, Safety) research project (Miller et al., 2011). Data during all of the experimental exposures, including sound exposures as well as no-sonar control approaches were excluded from this analysis which aimed to focus on baseline behavior. Data were also excluded from the beginning of the tag record until the tag boat no longer re-approached the whale for fluke photographs used in individual identification.
Animal experiments were carried out under permits issued by the Norwegian Animal Research Authority (Permit No. 2004/20607 and S-2007/61201), in compliance with ethical use of animals in experimentation. The research protocol was approved by the University of St Andrews Animal Welfare and Ethics Committee and the Woods Hole Oceanographic Institutional Animal Care and Use Committee. The sound exposure experiments were designed and conducted within the 3S (Sea mammals, Sonar, Safety) research project (Miller et al., 2011).
Depth, pitch and roll data were derived following Johnson and Tyack (2003) and decimated at 5 Hz. Both DTAG version 2 (2005–2010) and version 3 (2016–2017) was used. The hydrophones had a sensitivity between −188 and −190 dB re V/μPa, depending on the tag.
Acoustic Data Processing
DTAG audio recordings were monitored both aurally and visually using spectrograms in Adobe Audition (hereafter termed “auditing”), and the start and end time of regular and buzz click trains were marked. Buzz start time was defined as a change in amplitude and/or spectral content of clicks before a fast run (click rate >5 Hz). Buzz end time was defined as the start of a pause before the next usual click train, exceeding the ICI of the subsequent usual (i.e., regular) clicks, or start of a pause before the next surfacing. In the absence of such a clear pause, the end time of a buzz was identified as the last irregularly spaced buzz clicks (this pattern was also typical of buzzes with a clear pause). For analysis, buzzes were filtered by maximum repetition rate (section Data Filtering below).
Individual clicks within buzzes were detected automatically using a custom-written program in Matlab. To improve signal-to-noise ratio (SNR) for click detection, wave files were first band-pass filtered between 700 Hz and 40 kHz using a 256 point finite-impulse filter. Filtered energy was smoothed (Hanning window 1 ms), and click start and end times were detected based upon thresholds of the median and spread of the smoothed energy.
The received level of buzz clicks arriving on the animal attached recorder (DTAG) was used as a proxy for the relative acoustic output level or “apparent output level” (AOL, Madsen et al., 2005). DTAG attachment location will vary between individual attachments and potentially also within a tag attachment (Johnson et al., 2009) if the tag slides over the animal's body. We did not attempt to compare absolute AOLs across different tag deployments. Instead, we aimed to assess relative changes in AOL within each buzz. This approach assumes that directionality patterns of click transmissions are not correlated with AOL.
In order to measure AOL, a lower order filtering (3rd order Butterworth bandpass between 1 and 40 kHz) of the raw signal was used to reduce effects of flow noise and click rate. Peak-to-peak sound pressure levels (AOLpp) and sound exposure levels (AOLE) were measured for each click following Madsen (2005). SEL values were accumulated over each 0.5 s time bin (AOLE, 0.5s) to contrast maximum peak-to-peak levels (AOLmax, 0.5s) with time-integrated sound levels over time.
Data Filtering
Three data structures were defined for analysis: (1) click level data (“click data”), (2) binned time series for 0.5 s bins (“binned data”), and (3) summary statistics for each audited buzz (“buzz data”) (Table 1). Click data were binned in order to obtain a time-balanced sample for a fine-scale analysis of click rate while buzz data were used to compare and classify buzzes as proxies for prey capture attempts. Maximum click rate for each buzz was obtained from the binned data. Buzzes that did not reach 5 Hz in click rate (Teloni et al., 2008) were not considered to be fast runs, and were excluded from analysis (N = 7).
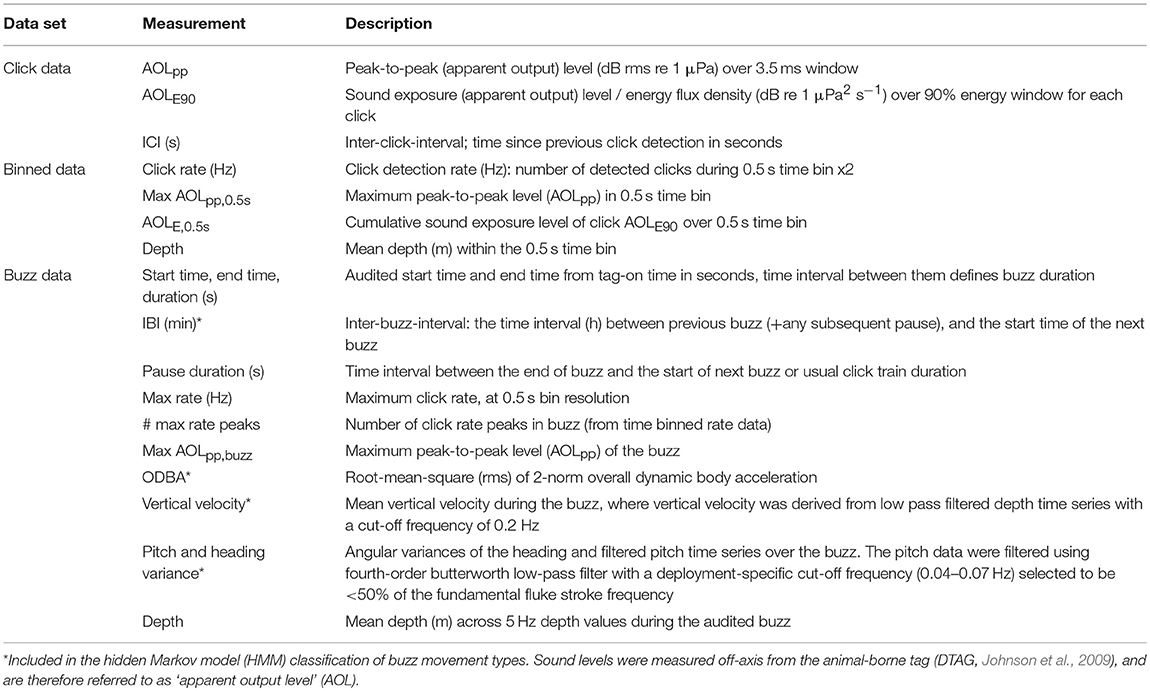
Table 1. Measurements and summary statistics.
For acoustic analysis, buzzes were filtered to include only the highest quality detections in order to account for variable SNR conditions. This more stringent filtering was also necessary to remove occasional false positives of clicks from other non-tagged whales that were included in the automated click detection. Data were first removed within each buzz on a click-by-click basis. Each 0.5 s bin was then deemed to be high quality if no more than 5% of the clicks within it were removed. Similarly, each buzz was accepted if no more than 5% of its clicks and 5% of its time bins were removed.
Clicks were removed as likely false positives when they had clearly different AOL compared to their neighboring clicks. Click AOLpp was first smoothed within each buzz using median filter with a window size of 5. The clicks were then excluded by removing those with raw AOLpp values that were more than 6 dB below or 12 dB above the smoothed median AOLpp. A lower threshold value was used for AOLpp values below the median because they were more likely to originate from other sources than the tagged whale. The thresholds were determined by inspecting the distribution of AOLpp for outliers for each tag. 98% of the AOLpp values that were below the running median AOLpp differed from it by <7 dB, on average across tags (median = 4 dB, range = 1.6–26.6). Clicks with clipped sound levels were also removed. Due to the relatively low AOL of the buzz clicks, clipping was rare (0.1% of all time bins contained any clipping). Clicks and bins with any acoustic clipping were removed from the AOL analysis.
Measurements and summary statistics are listed in Table 1. Audit start time and end time defined buzz duration.
Statistical Hypothesis Testing
Three analysis steps were designed to decompose movement classification and echolocation tactics from direct effects of depth (pressure, light) across different prey encounters. First, buzz events were classified using an unsupervised classification algorithm on summary movement variables that were a priori expected to be related to prey mobility and maneuverability rather than to the physical effects of depth (e.g., pressure or light conditions). Second, if the existence of multiple buzz movement types was supported, their vertical distribution was tested by modeling depth with the movement classification as a candidate explanatory variable. Third, we tested the importance of the movement classification vs. hydrostatic pressure as explanatory variables for echolocation performance (maximum click rate and AOL in a buzz). Pressure was included either as a linear or inverse-transformed covariate to reflect possible effects of changing air density and volume on pneumatic click production.
Finally, to quantify within-buzz variation in AOL, we modeled both maximum peak-to-peak levels (Max AOLpp, 0.5s) and time-integrated sound exposure levels (AOLE, 0.5s) in the time binned data. In order to test whether the AOL metrics were adjusted to sensory volumes and/or potential target range, we compared models with the time-binned click rate and expected transmission loss (TL = log10range) as candidate explanatory variables.
Classification of Movement During Buzzes
Buzzes were classified by fitting multivariate HMMs (Zucchini et al., 2016) to the movement data summarized for each buzz. The buzz summary metrics were modeled as a state-dependent process, and the probability of transition from one latent buzz type to the next was described by a transition probability matrix. The negative log-likelihood of the HMM was minimized using the nlm function in R (package stats). Mixture distributions are multi-modal, and therefore, the minimization is sensitive to the choice of starting values. To check for multiple minima and to ensure the algorithm did not terminate at a local minimum, each model was fitted 50 times with different initial values and the stability of the resulting likelihoods was monitored visually. Initial values for the distributional parameters were calculated from random 10% subsets of the input data, based upon a mean for one-parameter distributions, and both mean and variance for two-parameter distributions (Isojunno et al., 2017).
Movement metrics were selected to be proxies for prey density (inter-buzz-interval IBI), overall prey mobility and subsequent energy expenditure (root mean square of 2-norm overall dynamic acceleration [ODBA], standardized by its median value for each deployment), and prey mobility in three dimensions (vertical velocity, pitch variance, and heading variance) (Table 1)—variables that were a priori expected to related to prey and not be directly affected by the physical effects of depth (pressure or light conditions). Conversely, duration of the buzz was not included in the classification because duration may be directly limited by the air volume available to the whale at depth (Wahlberg, 2002). Similarly, rolling behavior was not included to avoid any confounding effects of light on body posture. A parametric family of distributions was specified for each metric. IBI was chosen a single-parameter family to allow for long tails in the positive-valued distribution. Vertical speed was specified a Gaussian distribution, and the metrics that were confined between 0 and 1 were specified beta distributions (pitch and heading variance). ODBA, which only takes positive values, was specified a gamma distribution.
Modeling Buzz Depth and Acoustic Metrics
Three models were fitted to the buzz-level data. To test for vertical stratification of the buzz classification (proxy for density and mobility of targeted prey), buzz mean depth was first modeled with the estimated buzz movement type as a factor explanatory variable. The factor covariate therefore captured the mean differences in depth across buzz types. Two acoustic metrics (maximum click rate and maximum AOLpp) were then modeled to test whether they were better explained by hydrostatic pressure (~depth) and/or the buzz type (~targeted prey). Maximum values were chosen to reflect the maximum acoustical performance within each buzz. However, to check how the maximum click rate related to the hand-off distance (the distance at which buzz was initiated), the model selection for maximum click rate was repeated with click rate at the first 0.5 s time bin (initial click rate) and the first ICI (inverse-transformed to a rate s−1) as response variables. All acoustic metrics were modeled with ambient pressure (standard atmospheres [atm]) and the buzz classification as explanatory variables.
All three models were fitted within a generalized estimating equation (GEE) where tag identifier was specified as a panel variable to estimate average effects across individuals (function geeglm in r package geepack). Information criteria (QIC) were used to select between models with first-order autoregressive correlation structure or no correlation structure (“independence” working correlation, but still accounting for residual autocorrelation). Empirical (“sandwich”) standard error estimates are reported which are robust to the working correlation assumption. Depth as a continuous positive variable was specified a gamma distribution, click rates as a counts over unit time was specified a Poisson (count) distribution, and max AOLpp was modeled as a normal variable.
Log-link was used to allow a log-linear response of the acoustic metrics to hydrostatic pressure. In addition, models with inverse-transformed hydrostatic pressure allowed the estimation of exponential relationships (as expected by Boyle's law). QIC was used to compare models without any covariates (null models) and models with all covariate combinations (one model for depth with buzz as the sole covariate, and five models for each of the two acoustic response variables, with buzz type, hydrostatic pressure and inverse hydrostatic pressure as the candidate covariates). Type III Wald tests were carried out for the full models to test the importance of movement classification in explaining variation in the acoustic metrics, after individual variability and pressure had been accounted for.
Within-Buzz Variation in AOL
Within-buzz binned data were used to investigate variation in AOL as a function of ICI, or inversely, click rate at 0.5 s temporal resolution. A positive correlation was expected under two but not necessarily mutually exclusive scenarios where output click levels are reduced (1) due to gain control at shorter ranges [automated gain control [AGC], Au 1993], indicated by shorter ICI:s, and (2) to optimize sensory volume as acoustic sampling rates are increased. AGC can be achieved by adjustments to source level, hearing sensitivity or both (transmitter vs. receiver-based AGC; Finneran et al., 2013; Supin and Nachtigall, 2013). The transient sonar equation describes the relationship between the transmitted and received levels of sonar (Urick, 1989; Au, 1993). Assuming spherical TL and frequency-dependent absorption α, the equation can be written as:
Where RL and SL are the received and source energy flux density, respectively, R is range and TS is target strength in decibels. Beaked whales (Mesoplodon) appear to maintain a relatively constant output on approach to prey (Madsen et al., 2005), while little evidence exists for the presence or lack of AGC in sperm whales. Furthermore, the extent to which sperm whales adjust their click output and rates to their targeted prey during terminal echolocation is not known.
If the ICI of buzz clicks was being adjusted to target range and click output adjusted to concomitant TL, then the sonar equation loss (Equation 1) would predict a logarithmic decrease in buzz click output level. To formalize this expectation, the expected target range was calculated assuming that ICI equals the two-way travel time (TWTT) of sound between emission and reception of echo (speed of sound assumed a constant 1,490 m/s), plus a processing delay. Processing delay was assumed to be less than the shortest ICI in the fine-filtered data (12 ms). Thus, the expected range was calculated as
On the other hand, if the whale was adjusting per-click AOL to maintain a stable sensory volume over time, a different relationship of AOL with click rate would be expected. Sound exposure level (SEL, or energy flux density) of transients can be approximated by 10 log to the time integral of the squared pressure over the pulse duration (Madsen, 2005). Because increasing number of clicks increases the total signal duration in a given time interval (higher duty cycle), the per-click AOL should therefore decrease proportionally to 10*log10(click rate) in order to maintain a constant SEL.
To statistically test the expected relationships between click rate and AOL, we modeled both Max AOLpp, 0.5s and AOLE, 0.5s with either click rate (s−1), log10(click rate), or log10(range) as linear covariates. While the time-integrated value of AOLE, 0.5s was largely expected to follow the number and AOLpp of individual clicks in a given time bin, by modeling it we could test the expectation of a constant SEL over time under the sensory volume hypothesis. To allow deployment-specific effects on AOL, tag deployment was specified as a factor covariate in every model. Within-buzz autocorrelation in AOL was modeled using 1st order autoregressive correlation structure in a linear mixed model (LMM) with buzz id as a random effect (function lme, package nlme). A LMM was chosen over the GEE approach because the focus of the analysis was within-buzz variation, i.e., variation within the panel variable. AIC was used to compare models. The model was fitted to the fine-filtered binned data, and excluded the last 3 s of each buzz in order to reduce the effect of any clicks produced at the end of the buzz that may no longer reflect prey pursuit.
Results
Data
A total of 3,715 buzzes were audited, of which 3,150 baseline buzzes (from 28 individuals, or 846 min recording time) were included in the analyses (“coarse” data-filtering, Supplementary Table 1). Further “fine” data-filtered buzzes (n = 1,891, 490 min) excluded 11 short (<2 s) buzzes, 3 shallow buzzes (average, start or end depth <20 m), almost all (n = 23/27) of the buzzes from whale sw08_152a, an unusually noisy tag where flow noise dominated energy from clicks at high repetition rates, and 8/10 buzzes from sw09_141a that was associated with other whales for most of the baseline data period. All the data are provided in the Supplementary Material (Data Sheets 1–3, and the Supplementary Table 2 file).
Classification of Buzz Events Based Upon Movement
AIC decreased for every additional state in the HMM (as is typical for HMMs), but the decrease appeared to level off after 4 states (i.e., “buzz movement types”). The 4-state HMM also produced distinct and biologically interpretable states (Supplementary Figures 1–5). We therefore selected the HMM with 4 states for further inference.
The two buzz movement types with the deepest median depths (1,178 and 1,130 m) had the lowest median total ODBA (overall dynamic body acceleration) values (1.5 and 1.6, respectively). Within these two types, the former included more descending vertical speeds (median 1.7 [0.9, 2.3]). The longest median IBI was obtained for the shallowest buzz type (161 m), and the shortest IBI for the second shallowest (372 m) which also had the highest median ODBA (4.1). Based on these results, the four buzz types are hereafter termed as “Shallow-sparse,” “Mid-active,” “Deep-descent,” and “Deep,” respectively (Table 2).
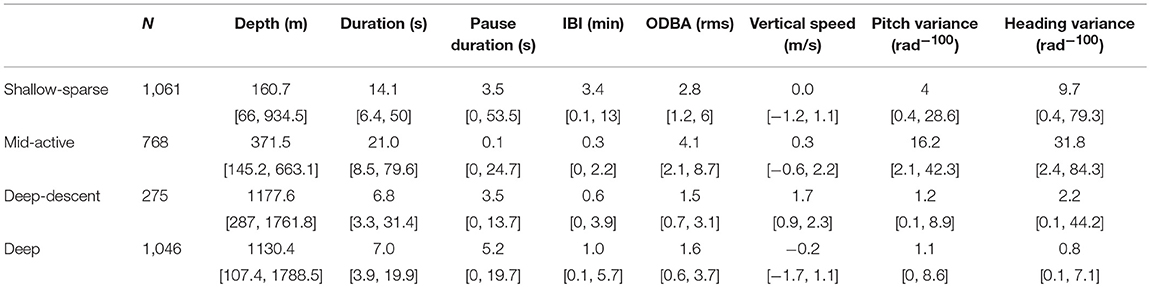
Table 2. Sample size and summary statistics (median, 95% percentiles) for each buzz type (coarse-filtered data).
Depth Distribution of Movement Types
Each buzz movement type had a distinct but a broad depth distribution (Figures 1, 2; see Supplementary Figures 11–24 for full time series). The buzz type was a significant predictor of depth across individuals in a GEE (χ2 = 62.1, p = < 0.001), and the model with buzz type outperformed the null model in terms of the QIC (quasi-information criterion; ΔQIC = 1,276). This result was robust to the exclusion of IBI from the HMM model fit (Supplementary Figure 6). Compared to depth, time of day had relatively little effect on the occurrence of buzz types with lower solar elevation slightly increasing the probability of deep-descent buzzes (Supplementary Figures 7, 8). QIC supported “independence” working correlation over an autoregressive structure.
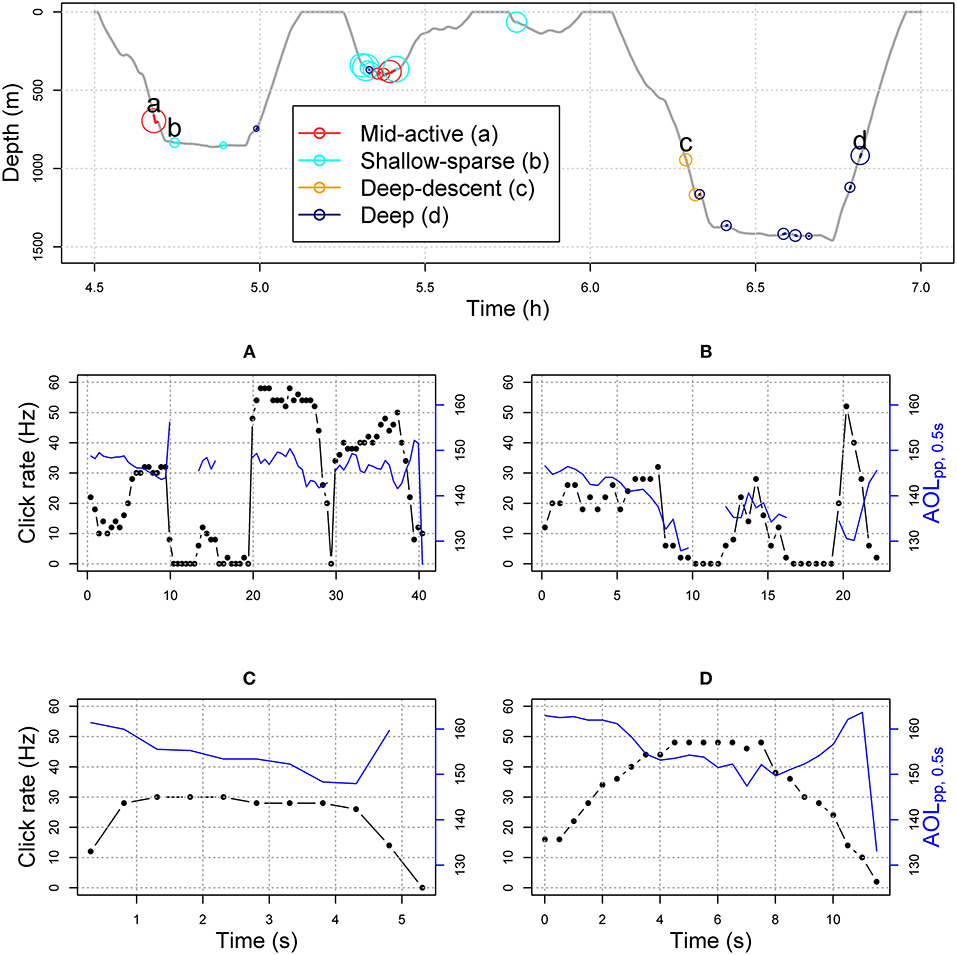
Figure 1. Top panel shows example section of dive profile (sw17_186a) with buzzes color-coded by HMM-classified predator-prey movement type (Figure 2). The solid line indicates buzz duration, and greater circle size shows greater ODBA values (overall dynamic body acceleration, Table 1). In the middle and bottom panels, connected black circles show time-binned click rate (Hz), and solid blue lines show maximum apparent output level (AOLpp, 0.5) in each 0.5 s time bin for each example buzz (A–D, labeled in the dive profile).
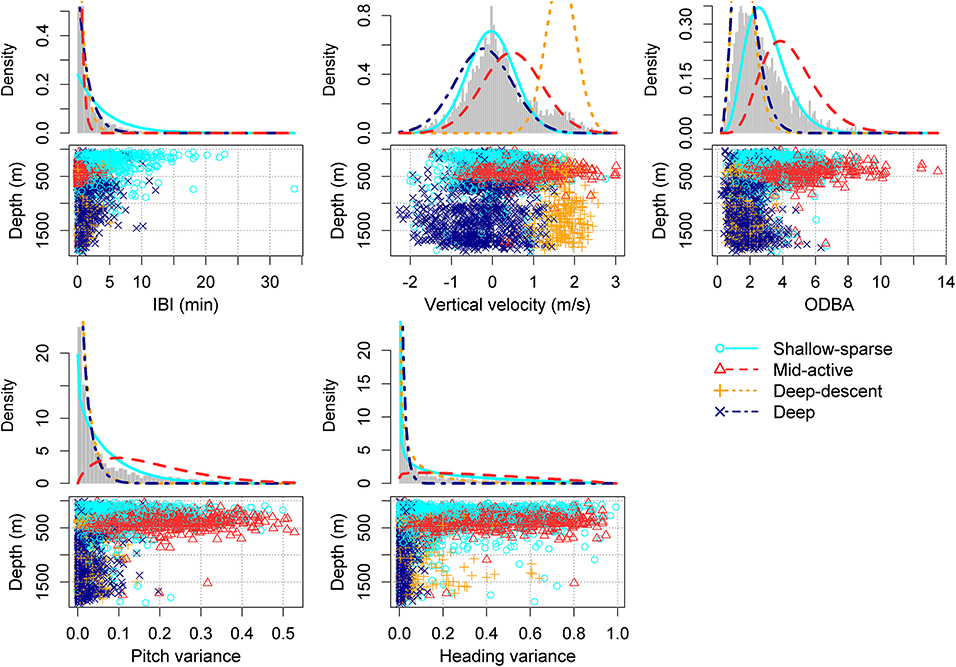
Figure 2. HMM classification of buzz summary variables, chosen to reflect predator-prey movement rather than physical effects of depth (light, or hydrostatic pressure) (Tables 2, 3). Density lines show the estimated state-dependent distributions. ODBA = overall dynamic body acceleration (Table 1). Please see Supplementary Figures 1–5 for the equivalent figure with a different number (2–5) of underlying states.
Effects of Pressure and Buzz Movement Type on Acoustic Metrics
The lowest QIC models included both ambient pressure (atm) and buzz type (HMM movement classification) as covariates in both GEEs for maximum click rate and maximum peak-to-peak click level (max AOLpp) across buzzes, and “independence” as working correlation. The same model was selected for maximum click rate and initial click rates representing hand-off distance (first binned click rate and initial inverse-transformed ICI). For the max AOLpp, inverse-transformed pressure was selected over the non-transformed covariate. While Type III Wald tests supported both covariates in the full model for click rate (p < 0.001), there was no support for buzz movement type in the full model for max AOLpp (p = 0.11) (Supplementary Table 2). These results indicate high variability in max AOLpp, which is not clearly explained by the type of movement behavior during buzz-related prey encounters. Wald tests showed somewhat weaker effects for the initial binned click rate (Supplementary Table 2) and initial inverse-transformed ICI (pressure: χ2 = 5.6, p = 0.018; buzz type: χ2 = 13.6, p = 0.004).
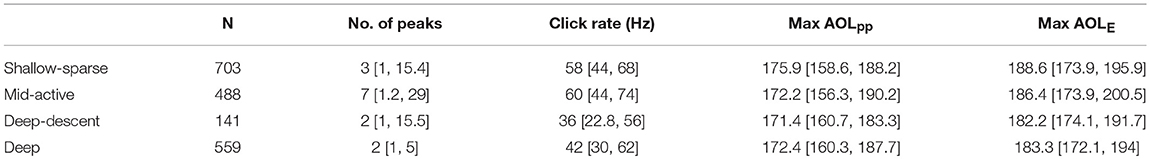
Table 3. Sample size and acoustic characteristics (median, 95% percentiles) of each buzz type (fine-filtered data).
Maximum buzz click rate was estimated to decrease by 23% for every 100 atm increase in pressure (90 m), or an average ~1.15 Hz for every 100 m increase in depth (Figure 3). A similar but more variable decrease was estimated for initial click rates (17.5 and 22.4% for initial binned rate and first 1/ICI), indicating that click rates were reduced across the entire buzz. For the “Deep” buzz type, which could also be produced at relatively shallow depths (min 81 m), the model estimated the average maximum click rate to decrease from 54.2 Hz [51.2, 57.0] at 100 m depth to 42.8 Hz [41.4, 44.2] at 1,000 m depth. While the maximum click rate was reduced during the two deep buzz types compared to the Shallow-sparse type, there wasn't strong evidence for such an effect on initial click rate. Instead, click rates were elevated by 40% at the start of the Mid-active buzz types compared to the Shallow-sparse buzzes (Supplementary Table 2).
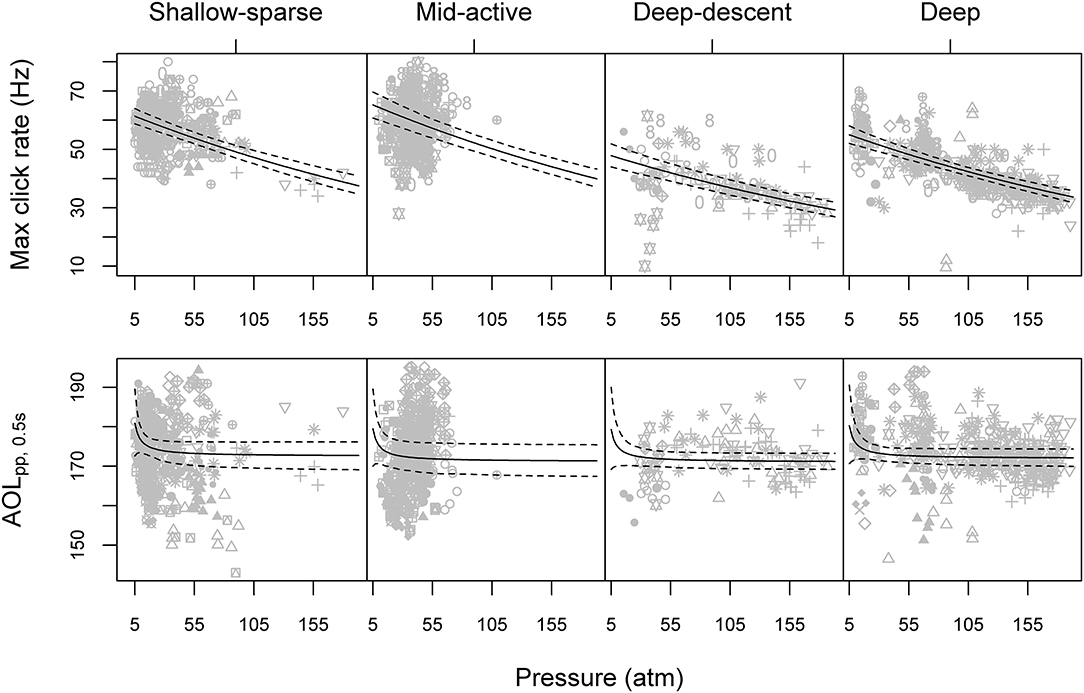
Figure 3. Maximum click rate (top row) and maximum apparent peak-to-peak sound pressure level (AOLpp, bottom row) as a function of average ambient pressure for each buzz, paneled by the HMM classification of predator-prey movement (Figure 2). Gray symbols show observed data, with different symbols indicating different tagged animals. Solid and dashed lines show model predictions and 95% parametric bootstrap confidence intervals, based on the full GEE (generalized estimating equation) models for the two acoustic metrics (Supplementary Table 2). Please see Supplementary Figure 9 for the equivalent figure with depth on the x-axis.
Max AOLpp was predicted to decrease exponentially with depth, with the most drastic decrease in level (>1 dB for every 1 atm increase in pressure) estimated when ambient pressure was ≤7 atm (60 m) (Figure 3). However, some effect of pressure on max AOLpp may have remained for deeper buzzes as well: fitting the model without the shallow (< 100 m) buzzes the effect of inverse pressure was still supported by the Type III Wald tests at 5% significance level (χ2 = 3.95, p = < 0.047).
Within-Buzz Variation in AOL
The average ± SD difference between the maximum and minimum value for max AOLpp, 0.5s within a buzz was 17.5 dB ± 8.0 (n = 58,079 fine-filtered time bins in 1,891 buzzes) (Figure 4). The model selection supported log(click rate) as a linear predictor for the maximum click level (AOLpp, 0.5s) and log(range) for the cumulative sound exposure level (AOLE, 0.5s) (Supplementary Table 3). The relationship with click rate was negative for AOLpp, 0.5s and positive for AOLE, 0.5s (Figures 4E,F). Thus, the decrease in per-click AOL did not result in a flat response for time-integrated AOL. The multiplier (slope) for log10(Range) was estimated to be 2.8 (SE = 0.06) for AOLpp, 0.5s and −3.7 (SE = 0.043) for AOLE, 0.5s, much lower than expected based on two-way spherical TL (2 × 20 dB, Equation 1). The slope parameter was estimated to be −4.0 (SE = 0.06) for log10(Click rate) in the best model for AOLpp, 0.5s. The relationship was consistent across the four buzz types (Supplementary Figure 10).
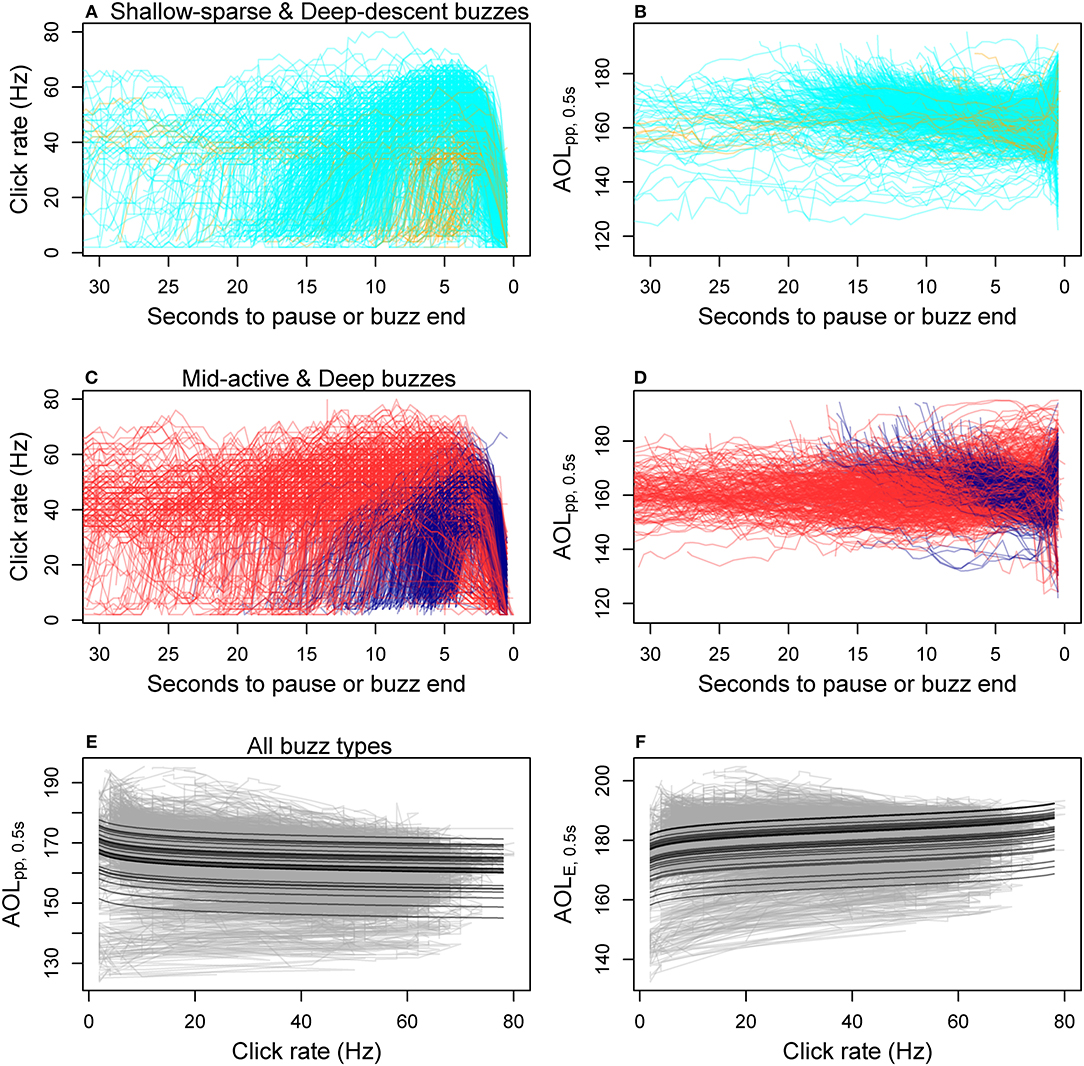
Figure 4. Within-buzz variation in click rate and two apparent output level (AOL) metrics (peak-to-peak and sound exposure level, Table 1) measured for each 0.5 s time bin. (A–D) show time series data for each fine-filtered buzz (N = 1891), color-coded by the HMM classification of predator-prey movement (cyan, Shallow-sparse; orange, Deep-descent; red, Mid-active; dark blue, Deep; Figure 2). The bottom two panels show best model fits for the two AOL metrics (E: AOLpp ~ log-transformed click rate, F: AOLE ~ log-transformed expected range), with predictions given for each tag deployment as a separate black line. Gray lines show the data time series for each buzz.
Discussion
We aimed to determine whether male sperm whales had different movement patterns during prey encounters, and whether terminal echolocation (buzzing) behavior was related to those movement patterns or pneumatic sound production under hydrostatic pressure at depth. Decomposing the effects of predator movement and depth (pressure) was essential to evaluate whether sperm whales might target different prey at different depths. There was clear evidence for a linear decrease in buzz click rates (both initial and maximum in the buzz) with depth that could not be explained by buzz movement type alone (Figure 3), suggesting a pressure effect on sound production.
Unsupervised classification that included inter-buzz-interval (IBI) and movement summary statistics, but not acoustic metrics or depth itself, resulted in a depth-dependent classification of four buzz types (Figures 1, 2). “Shallow-sparse” and “Mid-active” buzz types had the highest activity levels in terms overall movement (ODBA), while shorter IBI, lower ODBA, and fewer changes in orientation implicated a denser distribution of less mobile prey at depth (median depth >1,100 m) (“Descent-deep” and “Deep” buzz types, Table 2). After accounting for effects of pressure, click rates (at the beginning of the buzz especially) were higher during Mid-Active than other types of buzzes (Table 3), indicating that higher acoustic sampling rates were used to track prey that required more active capture movements. Our results, spanning across 12 years and 28 individual tag deployments, corroborate previous results from Teloni et al. (2008) that sperm whales engage in at least two different foraging strategies, but also illustrate potential echolocation limitations at depth and multiple movement tactics within a dive (multiple buzz types). Our results also corroborate that sperm whales engage in an active pursuit of prey (Aoki et al., 2012; Fais et al., 2016).
Evidence for Pressure-Driven Effects
Hydrostatic pressure explained a significant amount of variation in buzz click rates (both initial and maximum rates), as well as maximum AOL (peak-to-peak SPL) across buzzes, after accounting for the effect of buzz movement classification (Supplementary Table 2). The relationship between maximum click rate and hydrostatic pressure was estimated to be linear, while model selection supported the effect of inverse transformed pressure on maximum AOL (Figure 3). Such an exponential relationship would be expected if the maximum AOL was influenced by available volume of air, which is inversely proportional to ambient pressure (Boyle's law). Conversely, the linear relationship between maximum click rate and pressure indicates that air density of compressed gases, rather than their volume may be important for the adjustment of maximum echolocation rate. On the other hand, if a fixed air volume was required to produce each buzz click, an exponential decrease in the total number of clicks produced in each buzz may be expected as a function of depth. The more variable but significant decrease in the initial click rates as well as data for the total number of clicks support this second prediction (Figure 5), although the total number of clicks was not included in the formal analysis due to confounding effects with buzz duration. Furthermore, while the analysis of usual clicks was outside the scope of this work, it is likely that some of the air volume available for a buzz would have been used in the preceding series of usual clicks. Indeed, Wahlberg (2002) showed that the time interval between subsequent pauses as well as the number of usual clicks decreased exponentially at depth (up to 1,500 m).
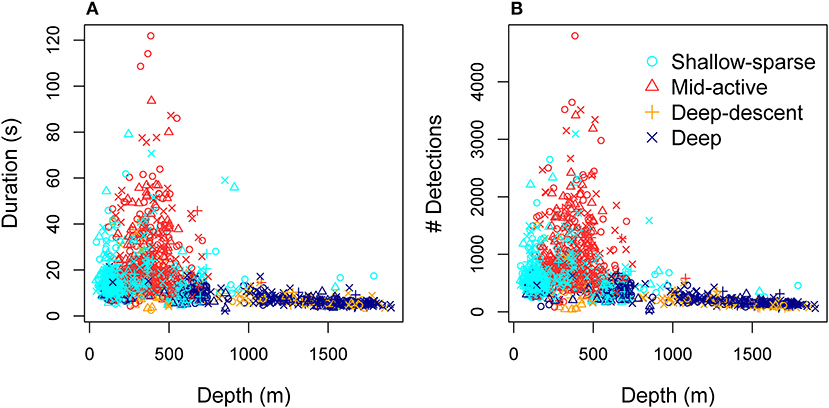
Figure 5. Total duration (A) and total number of click detections (B) per buzz as a function of depth, color-coded by the HMM classification of predator-prey movement (Figure 2, Tables 2, 3).
While we found an exponential decrease in maximum AOL with hydrostatic pressure for buzzes, Madsen P. T. et al. (2002) showed that on-axis output and frequency of sperm whale usual clicks were independent of depth up to 700 m. Multiple factors could explain the discrepancy to the off-axis results reported here for buzz clicks, such as narrowing of acoustic beam to retain optimal sonar capacity of on-axis clicks at depth. Sperm whale echolocation clicks are highly directional, and the backward directed beam can be dominated by the initial “p0” pulse produced in the distal air sac (Møhl et al., 2003; Zimmer et al., 2005). Indeed, the sound pressure levels received by the tag may not only represent off-axis levels, but may also be filtered and beamformed by the body of the whale (Johnson et al., 2009). Similarly, Thode and Mellinger (2002) reported a change in the frequency content of usual clicks with depth but the source-receiver aspect was unknown and possibly variable. Therefore, the negative trend in the apparent click levels does not necessarily indicate that on-axis levels were compromised at depth, but could also relate to changes in sound propagation, such as changing of the sound beam as a function of depth. This question could be evaluated by simultaneous acoustic recording at different points of the acoustic beam, e.g., by attaching multiple tags on the same individual or combining animal-borne and remote acoustic recording.
Echolocation Tactics
After accounting for the effects of hydrostatic pressure, we found variation in click rates between the four buzz types. Mid-active buzzes that were the longest in duration and most active buzz type in terms of movement were also associated with increased initial and maximum click rates. Conversely, maximum click rates were the slowest for the two deep, less active, buzz types (Table 3). These results are consistent with the need to increase click rate to increase rate of sensory feedback in order to inform predator motor reactions to more mobile prey (Madsen and Surlykke, 2013; Wisniewska et al., 2014). On the other hand, we found no evidence for slower initial ICI associated with longer buzzes that have been suggested to help processing more complex auditory scenes in beaked whales (Johnson et al., 2008).
As expected, within-buzz click rates were correlated with maximum AOL. Maximum peak-to-peak levels (AOLpp, 0.5s) ranged by 17.5 dB in an average buzz, of which < 10 dB was estimated to be due to co-variation with click rate. The per-click reduction in AOL with increasing click rate was not sufficient to completely remove a positive relationship between click rate and sound exposure level (AOLE, 0.5s) over time. Consistent with the hypothesis that per-click AOL was adjusted to reduce sensory volume, peak levels were best explained by log-transformed click rate. Auditory evoked potential experiments indicate that echolocating odontocetes have the ability to discriminate and track clicks and echoes at high temporal resolution (e.g., 5–20 ms in Risso's dolphins Mooney et al., 2006). Concordantly, in our data, 1% of the buzz clicks had ICI < 15 ms (minimum 12–13 ms). Therefore, if sperm whales tracked individual echoes, their sensory volume per second would increase by a factor of 60 by decreasing ICI from 1 s to 15 ms alone.
While log-transformed target range (calculated based on ICI) outperformed linear click rate as a predictor of AOLpp, 0.5s, the slope was estimated to be much lower than what would have been expected for two-way spherical transmission loss (Equation 1). This result indicates that ICI and/or per-click AOL did not fully and/or instantaneously track target range. If ICI corresponded to TWTT, the ranges to targets would have been 40–120 m at the beginning of the buzz (80–92 m for Shallow-sparse, 41–52 m for Mid-active, and 104–123 m for Deep-descent and Deep buzz types) (assuming 0–15 ms processing delay on the median first ICI). These ranges would be relatively long compared to other studied beaked whales, delphinids, and many bats that switch to terminal echolocation ~1 body length away from their target (Madsen and Surlykke, 2013). Alternatively, sperm whales emit buzz clicks more slowly at the beginning of the buzz, and do not reach their capacity of click-by-click (echo-by-echo) discrimination until the temporal resolution is required. This hypothesis would be consistent with the apparent pneumatic limitations. Low ICIs relative to target range (determined by animal-borne recording of prey echoes) have also been reported at the beginning of the buzz in beaked whales (Madsen et al., 2005) and other toothed whales (DeRuiter et al., 2009; Wisniewska et al., 2014).
Evidence for Different Prey Types
Buzz classification that included IBI and movement, but not depth or acoustic variables, produced a highly depth-dependent distribution (Figures 1, 2). Two buzz types occurred predominantly during deep dives (median >1,100 m): both “Deep” and “Deep-descent” types consisted of short duration (median 7.0 and 6.8 s, respectively) and relatively low movement activity (ODBA) buzzes. The two types differed by vertical velocity, and Deep-descent buzzes were also observed during shallower dives (< 500 m, Figure 2). “Shallow sparse” and “Mid-active” buzzes were on average more than twice as long in duration and were more active than the deep buzz types. Of all buzz types, Mid-active buzzes were the longest in duration, produced at the shortest intervals and were the most active in terms of movement. These buzzes also included up to 29 peaks in binned click rate, indicating multiple re-approaches (Table 3).
These results corroborate previous research showing that that sperm whales engage in an active search-and-pursue strategy (Amano and Yoshioka, 2003; Miller et al., 2004a; Aoki et al., 2012; Fais et al., 2016), but also that the level of activity during prey encounters varied with depth. Increased movement effort indicated that more mobile prey were targeted at shallower depths (<700 m), such as muscular cephalopods or fish. Conversely at deeper depths (~1,000–1,800 m) sperm whales appeared to either be selecting more prey items or foraging more densely distributed prey that did not require as much movement effort to catch. Furthermore, lower click rates suggest that high acoustic sampling rates were not necessary to detect prey at these depths.
The switch in movement and biosonar tactics during prey capture attempts indicates that sperm whales target prey with different mobility or manoverability, and is consistent with a generalist strategy of male sperm whales that are known to take different species and life stages of cephalopods (Santos et al., 1999; Bjørke, 2001; Simon et al., 2003) as well as fish in their high-latitude foraging grounds (Gaskin and Cawthorn, 1967; Martin and Clarke, 1986). In the Norwegian Sea, sperm whale feeding grounds overlap with the spawning grounds of Gonatus fabricii (Bjørke, 2001), which is also the most prevalent prey type in the stomachs of stranded specimens recovered in these waters (Santos et al., 2002; Simon et al., 2003). It has been suggested that sperm whales and pilot whales (Globicephalas melas) exploit aggregations of cephalopods that are either dead or are spent after spawning (Clarke, 1996), and that sperm whales may also target egg carrying female Gonatus fabricii (Simon et al., 2003). Mature female Gonatus fabricii lose their ability to swim and float in the water column as part of ontogenic changes during breeding as their muscle tissue disintegrates and mantle and fins become gelatinous (Bjørke, 2001). Given the high regional and individual variability in sperm whale diet (e.g., Evans and Hindell, 2004), it is possible that a range of more sedentary cephalopods was taken at depth. These could include smaller cephalopods that are generally more bioluminescent, neutrally buoyant, slower swimming and less muscular than larger squids, and therefore likely easier to catch, as well as dead cephalopods that eventually sink to the sea floor (Clarke et al., 1993; Clarke, 1996; Whitehead, 2003).
Based upon the expectation that a predator should optimize energy expenditure for expected returns, the shallow prey types can be expected to contain more energy or other nutritional reward, such as protein contained in more muscular (and hence faster) prey species. Given sperm whales must balance both their energy budget and oxygen stores during diving, foraging on likely lower quality prey at deeper depths is likely to carry other advantages, such as predictable and abundant prey patches (Teloni et al., 2008). Sperm whales can use usual clicks to scan for prey layers hundreds of meters ahead (Madsen P. et al., 2002), and in the beginning of a dive tend to target those layers that were located during previous dives (Fais et al., 2015). Sperm whales could also take advantage of aggregations of terminally spawning cephalopods, and prefer slower, more gelatinous, neutrally buoyant cephalopod species that are easier to capture, despite lower caloric value (Clarke et al., 1993; Clarke, 1996). Interestingly, for sperm whales tagged in a highly productive submarine canyon in New Zealand, the opposite might be the case: benthic buzzes were on average longer (10–30 s) and produced at longer inter-buzz intervals compared to pelagic buzzes, suggesting availability of more calorific and/or agile prey at greater depths (900–1,200 m) (Guerra et al., 2017).
It is possible that sperm whales approached and pursued similar types of prey in different body postures, and hence vertical velocity, depending on whether the individual was transiting or searching within a prey layer. These effects may have over-emphasized the Descent-deep buzz type as a separate movement strategy. Whales could also switch hunting or echolocation strategy for the same prey if their detectability changed with depth. Sea floor might provide both physical shelter and refuge from acoustic detection. It could be informative to assess the role of behavioral state and distance to sea floor in future analyses of prey encounter strategies.
Light conditions influencing the ability of prey to visually detect their predator (or vice-versa) can also be expected to play a role in aquatic foraging. Availability of daylight during the day could allow prey to visually detect their predator earlier, and thus increase handling time at shallower depths. With the near continuous availability of daylight during the summer months in Norway, our dataset collected was not optimal to address this question. Nevertheless, the probability of a buzz to be of the Descent-deep type decreased with greater solar elevation (Supplementary Figures 7, 8). During the day, the silhouette of aquatic predators may be more visually detectible to their prey, in particular when viewed from below. However, the effect was present in the bathypelagic zone (>1,000 m) where daylight is virtually absent (Warrant and Locket, 2004). Thus, the diurnal effect may be better explained by changes in prey availability due to vertical migration. For negatively buoyant divers, such as sperm whales at deep depths (>300 m, Miller et al., 2004b), these vertical descents may provide a way to increase pursuit speed while minimizing energetic and physiological costs.
Comparative studies have begun to link the maintenance costs and muscular performance of marine mammal predators to the energetic value of their prey (Spitz et al., 2012, 2014). Our results highlight how within-species dietary plasticity might arise from switching foraging strategies between heterogeneously distributed prey, and against ecophysiological and sensory constraints (distance from surface, pressure). In the future, including more sensory traits in the comparative approach (e.g., maximum echolocation rate, output level, hearing group) could further elucidate how toothed whale sensory niches map on to their dietary niche.
Data Availability Statement
The datasets that were analyzed and generated in this manuscript are enclosed with the manuscript as a Supplement, along with a data report.
Author Contributions
SI and PM conceived the conceptual approach of the manuscript. SI and PM contributed to the data collection. SI designed and performed the statistical analyses, and drafted the manuscript with feedback from PM.
Funding
This work was funded by NL Ministry of Defense, NOR Ministry of Defense, US Office of Naval Research (N00014-08-1-0984, N00014-10-1-0355, N00014-14-1-0390), and FR Ministry of Defense (DGA) (public market n°15860052).
Conflict of Interest Statement
The authors declare that the research was conducted in the absence of any commercial or financial relationships that could be construed as a potential conflict of interest.
Acknowledgments
We thank Mark Johnson, Peter Madsen and 3S (Sea mammals, Sonar, Safety project) ship's crew and research team members for efforts on the field data collection and access. We would also like to thank Peter Madsen for his extensive review and constructive feedback on the manuscript. We are also grateful to both reviewers for their insight and helpful suggestions. Visual data were collected using Logger 2000, developed by the International Fund for Animal Welfare (IFAW) to promote benign and non-invasive research. We would also like to thank our sponsors, NL Ministry of Defense, NOR Ministry of Defense, US Office of Naval Research and FR Ministry of Defense (DGA).
Supplementary Material
The Supplementary Material for this article can be found online at: https://www.frontiersin.org/articles/10.3389/fevo.2018.00200/full#supplementary-material
References
Amano, M., and Yoshioka, M. (2003). Sperm whale diving behavior monitored using a suction-cup-attached TDR tag. Mar. Ecol. Prog. Ser. 258, 291–295. doi: 10.3354/meps258291
Aoki, K., Amano, M., Mori, K., Kourogi, A., Kubodera, T., and Miyazaki, N. (2012). Active hunting by deep-diving sperm whales: 3D dive profiles and maneuvers during bursts of speed. Mar. Ecol. Prog. Ser. 444, 289–301. doi: 10.3354/meps09371
Arranz, P., de Soto, N., A., Madsen, P., T., Brito, A., Bordes, F., and Johnson, M., P. (2011). Following a foraging fish-finder: diel habitat use of Blainville's beaked whales revealed by echolocation. PLoS ONE 6:e28353. doi: 10.1371/journal.pone.0028353.
Bjørke, H. (2001). Predators of the squid Gonatus fabricii (Lichtenstein) in the Norwegian Sea. Fish. Res. 52, 113–120. doi: 10.1016/S0165-7836(01)00235-1
Clarke, M. R. (1996). Cephalopods as prey III Cetaceans. Philos. Trans. R. Soc. Lond. Ser. B Biol. Sci. 351, 1053–1065. doi: 10.1098/rstb.1996.0093
Clarke, M. R., Martins, H. R., and Pascoe, P. (1993). The diet of sperm whales (Physeter macrocephalus Linnaeus 1758) off the Azores. Philos. Trans. R. Soc. Lond. Ser. B Biol. Sci. 339, 67–82. doi: 10.1098/rstb.1993.0005
Davis, R. W., Jaquet, N., Gendron, D., Markaida, U., Bazzino, G., and Gilly, W. (2007). Diving behavior of sperm whales in relation to behavior of a major prey species, the jumbo squid, in the Gulf of California, Mexico. Mar. Ecol. Prog. Ser. 333, 291–302. doi: 10.3354/meps333291
DeRuiter, S. L., Bahr, A., Blanchet, A. M., Hansen, S. F., Kristensen, J. H., and Wahlberg, M. (2009). Acoustic behaviour of echolocating porpoises during prey capture. J. Exp. Biol. 212, 3100–3107. doi: 10.1242/jeb.030825
Evans, K., and Hindell, M. A. (2004). The diet of sperm whales (Physeter macrocephalus) in southern Australian waters. ICES J. Mar. Sci. 61, 1313–1329. doi: 10.1016/j.icesjms.2004.07.026
Fais, A., Johnson, M., Wilson, M., Aguilar Soto, N., and Madsen, P. T. (2016). Sperm whale predator-prey interactions involve chasing and buzzing, but no acoustic stunning. Sci. Rep. 6:28562. doi: 10.1038/srep28562
Fais, A., Soto, N. A., Johnson, M. P., Pérez-González, C., and Miller, P. J. O. (2015). Sperm whale echolocation behaviour reveals a directed, prior-based search strategy informed by prey distribution. Behav. Ecol. Soc. 69, 663–674. doi: 10.1007/s00265-015-1877-1
Finneran, J. J., Mulsow, J., and Houser, D. S. (2013). Auditory evoked potentials in a bottlenose dolphin during moderate-range echolocation tasks. J. Acoust. Soc. Am. 134:4532. doi: 10.1121/1.4826179
Gaskin, D. E., and Cawthorn, M. W. (1967). Diet and feeding habits of the sperm whale (Physeter Catodon L.) in the cook strait region of New Zealand. N. Z. J. Mar. Freshw. Res. 1, 156–179. doi: 10.1080/00288330.1967.9515201
Guerra, M., Hickmott, L. J., van der Hoop, Rayment, W., Leunissen, E., Slooten, E., et al. (2017). Diverse foraging strategies by a marine top predator: sperm whales exploit pelagic and demersal habitats in the Kaikoura submarine canyon. Deep-Sea Res. Part I Oceanogr. Res. Papers 128, 98–108. doi: 10.1016/j.dsr.2017.08.012
Heithaus, M. R., Frid, A., Wirsing, A. J., and Worm, B. (2008). Predicting ecological consequences of marine top predator declines. Trends Ecol. Evol. 23, 202–210. doi: 10.1016/j.tree.2008.01.003
Houston, A. I., and Carbone, C. (1992). The optimal allocation of time during the diving cycle. Behav. Ecol. 3, 255–265. doi: 10.1093/beheco/3.3.255
Huggenberger, S., André, M., and Oelschläger, H. H. A. (2014). An acoustic valve within the nose of sperm whales physeter macrocephalus. Mamm. Rev. 44, 81–87. doi: 10.1111/mam.12017
Isojunno, S., Sadykova, D., DeRuiter, S., Curé, C., Visser, F., Thomas, L., et al. (2017). Individual, ecological, and anthropogenic influences on activity budgets of long-finned pilot whales. Ecosphere 8:e02044. doi: 10.1002/ecs2.2044
Johnson, M., Hickmott, L. S., Soto, N. A., and Madsen, P. T. (2008). Echolocation behaviour adapted to prey in foraging Blainville's beaked whale (Mesoplodon densirostris). Proc. R. Soc. Lond. B Biol. Sci. 275, 133–139. doi: 10.1098/rspb.2007.1190
Johnson, M., Madsen, P. T., Zimmer, W. M., Aguilar de Soto, X. N., and Tyack, P. L. (2004). Beaked whales echolocate on prey. Proc. Biol. Sci. 271, 383–386. doi: 10.1098/rsbl.2004.0208
Johnson, M. P., Soto, N. A., and Madsen, P. T. (2009). Studying the behaviour and sensory ecology of marine mammals using acoustic recording tags: a review. Mar. Ecol. Prog. Ser. 395, 55–73. doi: 10.3354/meps08255
Johnson, M. P., and Tyack, P. L. (2003). A digital acoustic recording tag for measuring the response of wild marine mammals to sound. IEEE J. Ocean. Eng. 28, 3–12. doi: 10.1109/JOE.2002.808212
Klages, N. T. W. (1996). Cephalopods as prey II Seals. Philos. Trans. R. Soc. Lond. Ser. B Biol. Sci. 351, 1045–1052 doi: 10.1098/rstb.1996.0092
Madsen, P., Wahlberg, M., and Møhl, B. (2002). Male sperm whale (Physeter macrocephalus) acoustics in a high-latitude habitat: implications for echolocation and communication. Behav. Ecol. Sociobiol. 53, 31–41. doi: 10.1007/s00265-002-0548-1
Madsen, P. T. (2005). Marine mammals and noise: problems with root mean square sound pressure levels for transients. J. Acoust. Soc. Am. 117, 1–6. doi: 10.1121/1.1921508
Madsen, P. T., Aguilar de Soto, N., Arranz, P., and Johnson, M. (2013). Echolocation in Blainville's beaked whales (Mesoplodon densirostris). J. Compar. Physiol. A 199, 451–469. doi: 10.1007/s00359-013-0824-8
Madsen, P. T., Johnson, M., de Soto, N. A., Zimmer, W. M. X., and Tyack, P. (2005). Biosonar performance of foraging beaked whales (Mesoplodon densirostris). J. Exp. Biol. 208, 181–194. doi: 10.1242/jeb.01327
Madsen, P. T., Payne, R., Kristiansen, N. U., Wahlberg, M., Kerr, I., and Møhl, B. (2002). Sperm whale sound production studied with ultrasound time/depth-recording tags. J. Exp. Biol. 205, 1899–1906. Available online at: http://jeb.biologists.org/content/205/13/1899
Madsen, P. T., and Surlykke, A. (2013). Functional convergence in bat and toothed whale biosonars. Physiology 28, 276–283. doi: 10.1152/physiol.00008.2013
Martin, A. R., and Clarke, M. R. (1986). The diet of sperm whales (Physeter macrocephalus) captured between Iceland and Greenland. J. Mar. Biol. Assoc. 66, 779–790. doi: 10.1017/S0025315400048426
Miller, P., Antunes, R., Alves, A. C., Wensveen, P. J., Kvadsheim, P. H., and Tyack, P. L. (2011). The 3S Experiments: Studying the Behavioural Effects of Naval Sonar on Killer Whales (Orcinus orca), Sperm Whales (Physeter macrocephalus), and Long-Finned Pilot Whales (Globicephala melas) in Norwegian Waters. Scottish Oceans Institute Technical Report SOI-2011–I-2010.
Miller, P. J. O., Johnson, M. P., and Tyack, P. L. (2004a). Sperm whale behaviour indicates the use of echolocation click buzzes “creaks” in prey capture. Proc. R. Soc. Lond. Ser. B 217, 2239–2247. doi: 10.1098/rspb.2004.2863
Miller, P. J. O., Johnson, M. P., Tyack, P. L., and Terray, E. A. (2004b). Swimming gaits, passive drag and buoyancy of diving sperm whales Physeter macrocephalus. J. Exp. Biol. 6, 1953–1967. doi: 10.1242/jeb.00993
Møhl, B., Wahlberg, M., Madsen, P. T., Heerfordt, A., and Lund, A. (2003). The monopulsed nature of sperm whale clicks. J. Acoust. Soc. Am. 114, 1143–1154. doi: 10.1121/1.1586258
Mooney, T. A., Nachtigall, P. E., and Yuen, M. M. L. (2006). Temporal resolution of the Risso's dolphin, Grampus griseus, auditory system. J. Compar. Physiol. A 192, 373–380. doi: 10.1007/s00359-005-0075-4
Ridgway, S. H., and Carder, D. A. (2001). Assessing hearing and sound production in cetaceans not available for behavioral audiograms: experiences with sperm, pygmy sperm, and gray whales. Aquat. Mammals 27, 267–276. Available online at: https://aquaticmammalsjournal.org/share/AquaticMammalsIssueArchives/2001/AquaticMammals_27-03/27-03_Ridgway.pdf
Santos, M. B., Pierce, G. J., and Boyle, P. R. (1999). Stomach contents of sperm whales Physeter macrocephalus stranded in the North Sea 1990-1996. Mar. Ecol. Prog. Ser. 183, 281–294. doi: 10.3354/meps183281
Santos, M. B., Pierce, G. J., García Hartmann, M., Smeenk, C., Addink, M. J., Kuiken, T., et al. (2002). Additional notes on stomach contents of sperm whales Physeter macrocephalus stranded in the north-east Atlantic. J. Mar. Biol. Assoc. 82, 501–507. doi: 10.1017/S0025315402005787
Schnitzler, H., Moss, C. F., and Denzinger, A. (2003). From spatial orientation to food acquisition in echolocating bats. Trends Ecol. Evol. 18, 386–394. doi: 10.1016/S0169-5347(03)00185-X
Sergio, F., Caro, T., Brown, D., Clucas, B., Hunter, J., Ketchum, J., et al. (2008). Top predators as conservation tools: ecological rationale, assumptions, and efficacy. Ann. Rev. Ecol. Evol. Syst. 39, 1–19. doi: 10.1146/annurev.ecolsys.39.110707.173545
Simon, M. J., Kristensen, T. K., Tendal, O. S., Kinze, C. C., and Tougaard, S. (2003). Gonatus fabricii (Mollusca, Theuthida) as an important food source for sperm whales (Physeter macrocephalus) in the Northeast Atlantic. Sarsia North Atlant. Mar. Sci. 88, 244–246. doi: 10.1080/00364820310001688
Slater, G. J., Price, S. A., Santini, F., and Alfaro, M. E. (2010). Diversity versus disparity and the radiation of modern cetaceans. Proc. R. Soc. B Biol. Sci. 277, 3097–3104. doi: 10.1098/rspb.2010.0408
Spitz, J., Ridoux, V., and Brind'Amour A (2014). Let's go beyond taxonomy in diet description: testing a trait-based approach to prey-predator relationships. J. Anim. Ecol. 83, 1137–1148. doi: 10.1111/1365-2656.12218
Spitz, J., Trites, A. W., Becquet, V., Brind'Amour., A, Cherel, Y., Galois, R., et al. (2012). Cost of living dictates what whales, dolphins and porpoises eat: the importance of prey quality on predator foraging strategies. PLoS ONE 7:e50096. doi: 10.1371/journal.pone.0050096
Supin, A. Y., and Nachtigall, P. E. (2013). Gain control in the sonar of odontocetes. J. Compar. Physiol. A 199, 471–478. doi: 10.1007/s00359-012-0773-7
Teloni, V., Mark, J. P., Patrick, M. J. O., and Peter, M. T. (2008). Shallow food for deep divers : dynamic foraging behavior of male sperm whales in a high-latitude habitat. J. Exp. Mar. Biol. Ecol. 354, 119–131. doi: 10.1016/j.jembe.2007.10.010
Thode, A., and Mellinger, D. K. (2002). Depth-dependent acoustic features of diving sperm whales (Physeter macrocephalus) in the Gulf of Mexico. J. Acoust. Soc. Am. 112, 308–321. doi: 10.1121/1.1482077
Wahlberg, M. (2002). The acoustic behaviour of diving sperm whales observed with a hydrophone array. J. Exp. Mar. Biol. Ecol. 281, 53–62. doi: 10.1016/S0022-0981(02)00411-2
Warrant, E. J., and Locket, N. A. (2004). Vision in the deep sea Vision in the deep sea. Biol. Rev. 79, 671–712. doi: 10.1017/S1464793103006420
Watwood, S. L., Miller, P. J. O., Johnson, M., Madsen, P. T., and Tyack, P. L. (2006). Deep-diving foraging behaviour of sperm whales (Physeter macrocephalus). J. Anim. Ecol. 75, 814–825. doi: 10.1111/j.1365-2656.2006.01101.x
Whitehead, H. (2003). Sperm Whales: Social Evolution in the Ocean. Chicago, IL: University of Chicago Press.
Whitehead, H., MacLeod, C. D., and Rodhouse, P. (2003). Differences in the niche breadth among some teuthivorous mesopelagic marine mammals. Mar. Mammal Sci. 19, 400–406. doi: 10.1111/j.1748-7692.2003.tb01118.x
Wisniewska, D. M., Johnson, M., Beedholm, K., Wahlberg, M., and Madsen, P. T. (2012). Acoustic gaze adjustments during active target selection in echolocating porpoises. J. Exp. Biol. 215, 4358–4373. doi: 10.1242/jeb.074013
Wisniewska, D. M., Johnson, M., Nachtigall, P. E., and Madsen, P. T. (2014). Buzzing during biosonar-based interception of prey in the delphinids Tursiops truncatus and Pseudorca crassidens. J. Exp. Biol. 217, 4279–4282. doi: 10.1242/jeb.113415
Zimmer, W. M. X., Tyack, P. L., Johnson, M. P., and Madsen, P. T. (2005). Three-dimensional beam pattern of regular sperm whale clicks confirms bent-horn hypothesis. J. Acoust. Soc. Am. 117, 1473–1485. doi: 10.1121/1.1828501
Keywords: buzz, Dtag, hidden Markov model, sound production, pressure effects, prey switching
Citation: Isojunno S and Miller PJO (2018) Movement and Biosonar Behavior During Prey Encounters Indicate That Male Sperm Whales Switch Foraging Strategy With Depth. Front. Ecol. Evol. 6:200. doi: 10.3389/fevo.2018.00200
Received: 31 July 2018; Accepted: 09 November 2018;
Published: 28 November 2018.
Edited by:
Frants Havmand Jensen, Aarhus Institute of Advanced Studies, DenmarkReviewed by:
Matthew Bowers, Colorado State University, United StatesDaniel Paul Costa, University of California, Santa Cruz, United States
Copyright © 2018 Isojunno and Miller. This is an open-access article distributed under the terms of the Creative Commons Attribution License (CC BY). The use, distribution or reproduction in other forums is permitted, provided the original author(s) and the copyright owner(s) are credited and that the original publication in this journal is cited, in accordance with accepted academic practice. No use, distribution or reproduction is permitted which does not comply with these terms.
*Correspondence: Saana Isojunno, si66@st-andrews.ac.uk