Spatial Resolving Power and Contrast Sensitivity Are Adapted for Ambient Light Conditions in Australian Myrmecia Ants
 Yuri Ogawa
 Laura A. Ryan
  Ajay Narendra
- Department of Biological Sciences, Macquarie University, Sydney, NSW, Australia
The eyes of most animals exhibit a trade-off between spatial resolving power and absolute sensitivity, which likely reflects functional adaptations for the animals' visual ecology. When animals operate in dim light conditions, the sensitivity of an eye needs to be increased because the signal-noise ratio of visual information is typically low, even though this potentially compromises spatial resolving power. Here, we investigated the spatial resolving power and contrast sensitivity in two congeneric ant species: the diurnal-crepuscular Myrmecia tarsata and the nocturnal Myrmecia midas using pattern electroretinography (PERG). Both ant species have a specialised zone in the medio-frontal region of the eye that has enlarged facets compared to the rest of the eye. Using the PERG technique, we found that spatial resolving power was 0.60 cycles per degree (cpd) in M. tarsata, while it was 0.57 cpd in M. midas. This variation in spatial resolving power is explained by differences in ommatidial facet diameters, which were significantly larger in the nocturnal M. midas. The contrast sensitivity reached a maximum of 15.5 at 0.1 cpd in M. tarsata and 21.2 at 0.05 cpd in M. midas. The contrast sensitivity functions did not differ significantly between the two species. In the diurnal-crepuscular M. tarsata, the specialised eye region with the largest facets provides both high spatial resolving power and contrast sensitivity making it an “acute zone”. In contrast, in the nocturnal M. midas the specialised eye region with the largest facets improves the eye's sensitivity, making it a “bright zone”. The increased sensitivity would be important under low luminance conditions and/or for discriminating objects of low contrast. We conclude that even closely related species active at different ambient light intensities have evolved different strategies to optimise their visual system to match their respective visual ecologies.
Introduction
An animal's behaviour is constrained by the anatomy and physiology of its sensory systems, which have evolved to extract ecologically relevant information from their habitat. The visual capabilities of an animal are typically characterised by their spatial resolving power and contrast sensitivity (Land, 1997). In order to discriminate small objects or fine details in a scene, animals require high spatial resolving power. Contrast sensitivity is a measure of the ability to discriminate visual stimuli as their brightness contrast decreases. This is determined by the amount of light absorbed by each photoreceptor. Both spatial resolving power and contrast sensitivity in an eye are not uniform across the visual field and there is distinct regional specialisation (Walls, 1942). A classic example of regional specialisation is seen in the fiddler crab Uca spp, where their spatial resolving power varies across the eye, which matches to the information content and behavioural relevance of the corresponding parts of their visual field (Layne et al., 1997; Smolka and Hemmi, 2009). In insects, certain regions of the compound eye are associated with higher spatial resolving power (acute zones) that, for example, allow males to spot females against the sky background (Collett and Land, 1975; Beersma et al., 1977; Horridge, 1978; Zeil, 1979, 1983; Gonzalez-Bellido et al., 2011; Warrant, 2016). In contrast, in some insects, certain regions of the compound eye are most suited for increased light capture and improved absolute sensitivity (bright zone; van Hateren et al., 1989; Straw et al., 2006).
In addition, an eye also needs to be sensitive to a range of light intensities that the animal experiences (Snyder et al., 1977). This is because light intensity drops over 100 million times at night compared with a bright sunny day, which makes detecting reliable visual navigational information a challenge (Land and Nilsson, 2012). Indeed, a variety of nocturnal insects have evolved optical strategies to improve visual sensitivity to suit their nocturnal lifestyle (Land et al., 1999; Greiner et al., 2005; Warrant and Dacke, 2011; Stöckl et al., 2016a; Narendra et al., 2017). We have identified such optical adaptations in the Australian Myrmecia ants where congeneric and sympatric species range from being strictly diurnal, diurnal-crepuscular, and exclusively nocturnal. Myrmecia, similar to other ants and Hymenopterans, possess an apposition compound eye, which is an eye design well-suited for bright light conditions. The size of the lens and width of the rhabdoms gradually increase as species become nocturnal, resulting in a 27-fold increase in the sensitivity of the eye of the nocturnal ants (Greiner et al., 2007). The optical characteristics of their eyes are clearly related to periods of foraging activity that occur in different ambient light conditions as they become nocturnal (Narendra et al., 2011, 2016). Myrmecia ants, both diurnal and nocturnal, are well-known for their ability to forage individually and capture large prey (Narendra et al., 2013; Reid et al., 2013). However, their spatial resolving power and contrast sensitivity —especially in the context of the different light levels at which they operate—have not been measured.
Both spatial resolving power and contrast sensitivity of an eye can be estimated by anatomical measurements of optical properties. From their anatomy, it appears that the nocturnal Myrmecia pyriformis has lower spatial resolving power (interommatidial angle of 2.1°; Reid, 2010) compared to the diurnal Myrmecia gulosa (interommatidial angle of 1.7°; Via, 1977). Intracellular recordings also provide the information about the visual field of photoreceptors (Rigosi et al., 2017). One technique that can provide information of both the spatial resolving power and contrast sensitivity simultaneously is pattern electroretinography [PERG; (Porciatti, 2007)]. This technique allows us to measure responses of neurons in the lamina (the first optic ganglion), where sensitivity is improved by pooling the signals from photoreceptors in nocturnal insects (Kirschfeld, 1967; Warrant, 1993; Nilsson and Ro, 1994). The dendrites of the laminar monopolar cells (LMCs) extend into several neighbouring cartridges to connect the projections of the retinal axons from a single ommatidium, while in the diurnal insects they exhibit less branching (Greiner et al., 2005; Stöckl et al., 2016a,b). This strategy, known as spatial summation, increases photon capture without compromising spatial resolving power because it does not rely on changes in the optical components of the eye. Using PERG we can determine the spatial resolving power of an eye as the ability to resolve fine detail at different spatial frequencies of repeated dark and light stripes of gratings at high contrast. The PERG can also measure the contrast sensitivity, which is the ability to discriminate between adjacent stimuli on the basis of their differences in relative luminosity (contrast) rather than their absolute luminances (Ghim and Hodos, 2006). A contrast sensitivity function is obtained by measuring the contrast sensitivity over the range of the spatial frequencies of gratings and has become a common indicator of the ability of the visual system to process spatial frequency (Uhlrich et al., 1981; Ghim and Hodos, 2006; Porciatti, 2007; Ryan et al., 2017). The PERG technique has been used in humans (Bach et al., 2000), birds (Ghim and Hodos, 2006), turtles (Armington and Adolph, 1990), and sharks (Ryan et al., 2017). It may provide a more reliable estimate of spatial resolving power than anatomical methods especially for species in which behavioural estimates are difficult or time consuming to obtain (Ryan et al., 2017). Here we investigated the spatial resolving power and contrast sensitivities of two congeneric Myrmecia ants that are active at different times of the day using PERG.
Materials and Methods
Animals
We studied workers of two congeneric Myrmecia species, which are active at different times of the day. Myrmecia tarsata is a diurnal-crepuscular species, with majority of its activity restricted to the bright periods of the day (Greiner et al., 2007; Narendra et al., 2011). Myrmecia midas is a nocturnal ant that restricts its foraging activity to the low light periods of twilight and night (Freas et al., 2017). Both species were caught from nests on the Macquarie University campus, Sydney NSW (33.7738°S, 151.1126°E). Both species exhibited distinct size polymorphism and we used medium sized workers in our study. In five individuals of each species (head widths: 3.21 ± 0.38 mm in M. tarsata; 3.91 ± 0.11 mm in M. midas, Table 1) we determined their spatial resolving power and contrast sensitivity. Research on ants does not require ethics approval in Australia. Nevertheless, we treated our animals with care.
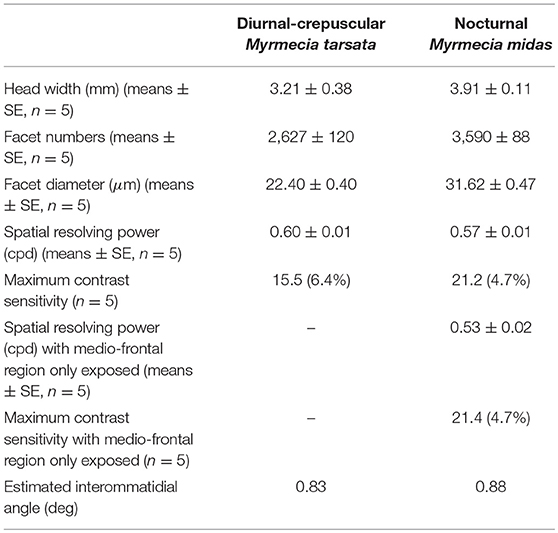
Table 1. Summary of the spatial resolving power and contrast sensitivity.
Electrophysiology
Animals were kept on ice for 5 min before removing their legs and gaster. Each ant was fixed with its dorsal side facing up on a plastic stage with bees' wax and then mounted in a Faraday cage. We recorded the pattern electroretinogram (PERG) to determine the spatial resolving power and contrast sensitivity of the whole eye. The active electrode was a platinum wire of 0.25 mm diameter attached to the surface of the lateral side of the compound eye with conductive gel (Livingstone International Pty Ltd., New South Wales, Australia). A silver/ silver-chloride wire of 0.1 mm diameter was inserted into the mesosoma and served as the indifferent electrode. ERGs were recorded using a differential amplifier (DAM50, World Precision Instruments Inc., FL, USA) connected to a computer via a 16-bit analogue-to-digital converter device (USB-6353, National Instruments, Austin, TX, USA). All experiments were carried out in a darkroom at room temperature (21–25°C). To exclude any effects of circadian rhythms on eye physiology, the experiments were carried out during each species' typical activity time, i.e., from 2 to 8 h after sunrise for M. tarsata and 1–6 h after sunset for M. midas. Animals were kept in dark for 1–3 h before recording.
The PERG visual stimuli were projected by a digital light processing (DLP) projector (W1210ST, BenQ corporation, Taipei, Taiwan) on a white screen (51 cm width × 81 cm height) at a distance of 30 cm from the ant's head. For detailed descriptions on methods see Ryan et al. (2017). The stimuli were vertical contrast-reversing sinusoidal gratings of different spatial frequencies (cycles per degree, cpd) and Michelson's contrasts (Michelson, 1927), generated using Psychtoolbox 3 (Pelli, 1997) and MATLAB (R2015b, Mathworks, Natick, MA, US) and controlled via custom Visual Basic software (NSH) written in Visual Studio (2013, Microsoft Corporation, Redmond, WA, US). The mean irradiance of the grating stimuli was 1.75 × 10⁻⁴ W/cm2 measured using a calibrated radiometer (ILT1700, International Light Technologies, Peabody, MA, US). A temporal frequency of 2 Hz was used for all stimuli.
Prior to the first recording, the ant was adapted to a uniform grey stimulus with the same mean irradiance as the grating stimuli for 20 min. To measure the contrast sensitivity function of the ants, they were presented with 14 spatial frequencies (0.73, 0.67, 0.62, 0.57, 0.52, 0.47, 0.41, 0.36, 0.31, 0.26, 0.21, 0.16, 0.1, 0.05 cpd), and up to eight contrasts (95%, 85 75, 50, 25, 12.5, 6, 3) with the same mean irradiance for each spatial frequency. The spatial frequencies of the gratings were presented in the order of decreasing frequencies of every second spatial frequency. To evaluate any degradation of the response over time, the interleaved spatial frequencies were then presented in ascending order. At each spatial frequency, all eight different contrasts were tested in decreasing order. For each combination of the stimuli, 15 repetitions of the response for 5 s each were averaged in the time domain. The averaged responses were then analysed using a Fast Fourier Transform, FFT. The non-visual electric signal (i.e., background noise) was measured as a control at two spatial frequencies (0.1 and 0.05 cpd) at 95% contrast with a black board used to shield the ant from the visual stimuli before and after the experimental series. The maximum signal out of the four control runs was used as the noise threshold.
Estimation of Spatial Resolving Power and Contrast Threshold
An F-test was used to assess whether the response signal at the second harmonic (4 Hz) of the FFT response spectrum differed significantly from 10 neighbouring frequencies, five on either side, for each spatial frequency and contrast combination. Spatial resolving power and contrast threshold were obtained by interpolating from the last point above the noise threshold whose amplitude at 4 Hz was also significantly greater than the 10 surrounding frequencies, and the first point below the noise threshold. If the first point below the noise threshold was not significantly greater than the 10 surrounding frequencies, the last point above the threshold was considered as the spatial resolving power, without interpolating between two data points. Contrast sensitivity is defined as the inverse of contrast threshold.
Identifying the Stimulation Region
For the experiments described above, the entire surface of the compound eye was exposed to the stimuli. Thus, it was possible that regions other than the medio-frontal region were activated by the visual stimuli. To identify whether this was the case, in five other individuals of one species, M. midas, we blocked the entire compound eye except the medio-frontal region using black paint. We carried out the PERG experiments with these occluded animals as described previously. From cornea replicas (see below) we determined the number of the facets and measured the diameter of 30 facets that were selected within the non-occluded medio-frontal region.
Size, Number, and Distribution of Facets
To determine the number and size of the facets we prepared eye replicas of all tested individuals. We used a thin layer of colourless nail polish using a well-established technique described in Narendra et al. (2011) and Ramirez-Esquivel et al. (2017). The replicas were photographed under a light microscope (Leica DM5000B, Leica Microsystems GmbH, Wetzlar, Germany) and we counted all the facets in each eye in all five animals for each species. Using ImageJ (U. S. National Institutes of Health, Bethesda, MD, US) we measured the diameter of 30 facets that were distributed across the medio-frontal region in each individual. Although the average facet size in the medio-frontal region varied significantly between individuals, variation of facet size was greater between species compared to between individuals (Nested ANOVA: species and individual accounted for 65.6 and 12.2% of the variance of facet diameter, respectively, see Supplementary Material). Hence to determine the mean facet diameter of each species, we calculated the average facet diameter of each individual and reported the average of all individuals. For one individual of each species, we created an eye map using a custom-written program in MATLAB (courtesy Richard Peters, La Trobe University).
Statistical Analysis
We tested whether facet diameters differ between species by performing analysis of variance (ANOVA) in a linear mixed-effects model in RStudio (Version 1.1.419, RStudio, Inc. Boston, MA, US). Species was used as a random effect. We used a linear model to assess the relationship between spatial resolving power and facet diameter. To determine the relationship between contrast sensitivity and facet diameters in M. tarsata and M. midas, we used a linear mixed-effects model using a restricted maximum likelihood (REML) estimation method. We carried this out in the lme4 package of R (https://cran.r-project.org/web/packages/lme4/index.html) to examine the relationship between contrast sensitivity, facet diameter and spatial frequency of stimuli. Prior to data analysis, we log-transformed contrast sensitivity and spatial frequency data. Facet diameter and spatial frequency were used as fixed effects. Animal identity nested within species was used as a random effect. The significances of the fixed effect terms were examined using a t-test with Satterthwaite approximation for degree of freedom (lmerTest package). Final residuals were checked graphically for compliance with model assumptions.
In the nocturnal M. midas, we determined whether spatial resolving power differed between animals that had their entire eye exposed (intact) or had only the medio-frontal region of their eye exposed by using a linear model in RStudio. To assess the relationship between contrast sensitivity, facet diameter and spatial frequency in two conditions of M. midas (entire eye exposed (intact) or eyes with medio-frontal region only exposed), we again used the mixed-effects model, which was used to assess the contrast sensitivity functions in M. tarsata and M. midas as described previously.
Results
Facet Numbers and Diameters
The nocturnal ant M. midas had more facets compared to the diurnal-crepuscular M. tarsata (Table 1). From the eye maps of both species, it is clear that larger facets were localised in the medio-frontal region of the eye (Figure 1). The nocturnal ants had significantly larger facets (31 μm) in the medio-frontal region compared to its diurnal relative (22 μm) (Table 1; Supplementary Table 1 and Supplementary Figures 1A,B).
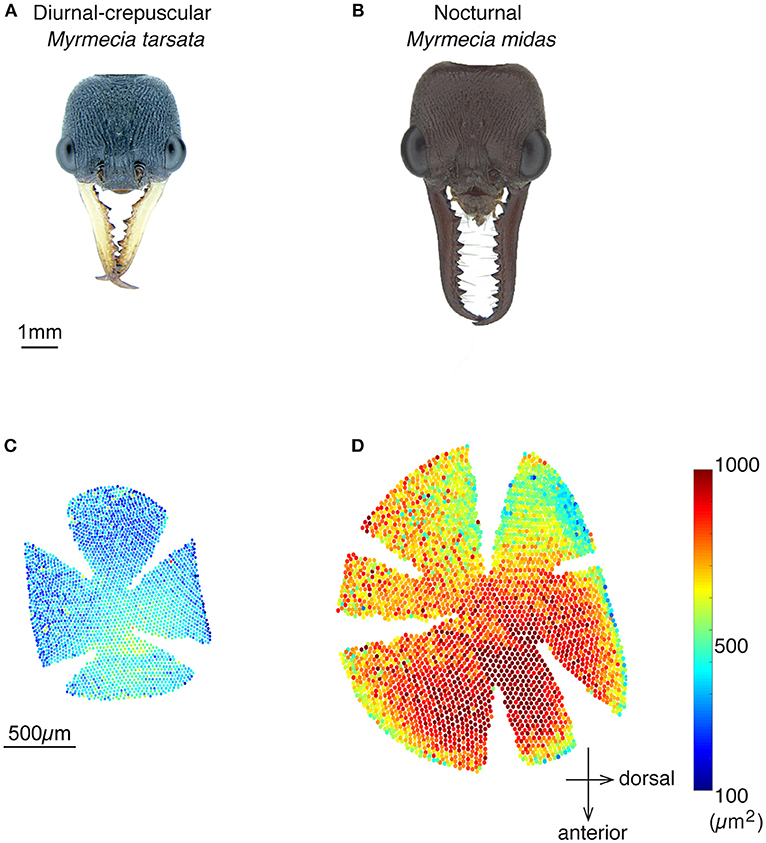
Figure 1. Spatial variability in facet diameters in the compound eyes of worker ants of the diurnal-crepuscular Myrmecia tarsata and nocturnal Myrmecia midas. (A,B) Dorsal view of the two ants. (C,D) Eye maps depicting the number of facets and the size of the facets in one individual. Eye maps of the two species are shown in the same scale. Each dot represents a facet, with its centre indicating the position of the facet. The size of the lens is indicated by the vertical colour map and not by the size of individual dots. Anterior and dorsal side of the eye are indicated.
Spatial Resolving Power
The amplitude of the PERG response at the second harmonic of the stimulus modulation frequency decreased with increasing spatial frequency or decreasing contrast of the visual stimuli. The point at which the amplitude fell below the noise threshold was used to define the spatial resolving power at the highest contrast. Spatial resolving power was 0.60 ± 0.01 cpd and 0.57 ± 0.01 cpd (mean ± SE) in the diurnal-crepuscular and nocturnal species, respectively (Table 1). We found that facet diameter explained the variation in the spatial resolving power (Figure 2, Table 2).
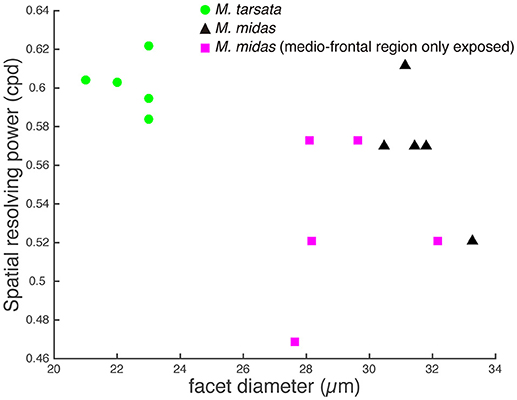
Figure 2. Relationship between the spatial resolving power and facet diameter in the medio-frontal region of the eye in Myrmecia ants. Green circles: diurnal-crepuscular M. tarsata; black triangles: nocturnal M. midas; magenta squares: M. midas with medio-frontal region of the eye only exposed. Slightly smaller ants were used to measure the facet diameters of M. midas with medio-frontal region of the eye only exposed (magenta squares). Hence their facets were slightly smaller. However, their average facet sizes were comparable to the intact eyes and this variation did not cause a difference in the spatial resolving power.
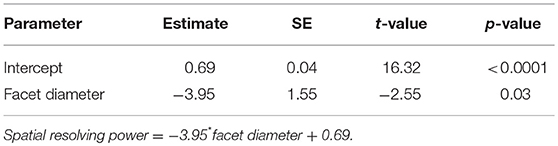
Table 2. Summary of linear model fit for testing the relationship between spatial resolving power and facet diameter in Myrmecia ants.
Contrast Sensitivity
The contrast threshold was measured as the point at which the response amplitude fell below the noise threshold whilst decreasing the contrast of the visual stimuli. The contrast threshold was typically lower at lower spatial frequency (0.05 cpd) and increased at higher spatial frequencies. No contrast threshold was recorded for the highest spatial frequency (0.73 cpd) because responses for that frequency never reached the threshold. Contrast thresholds for all spatial frequencies were used to calculate the contrast sensitivities (1/contrast threshold) shown in Figure 3. In M. tarsata, the contrast sensitivity reached a maximum of 15.5 at 0.1 cpd. In M. midas the highest contrast sensitivity was 21.2 at 0.05 cpd and declined with increasing spatial frequency. We found that variation in contrast sensitivity was explained by the spatial frequency of gratings, but not by the facet diameter (Table 3).
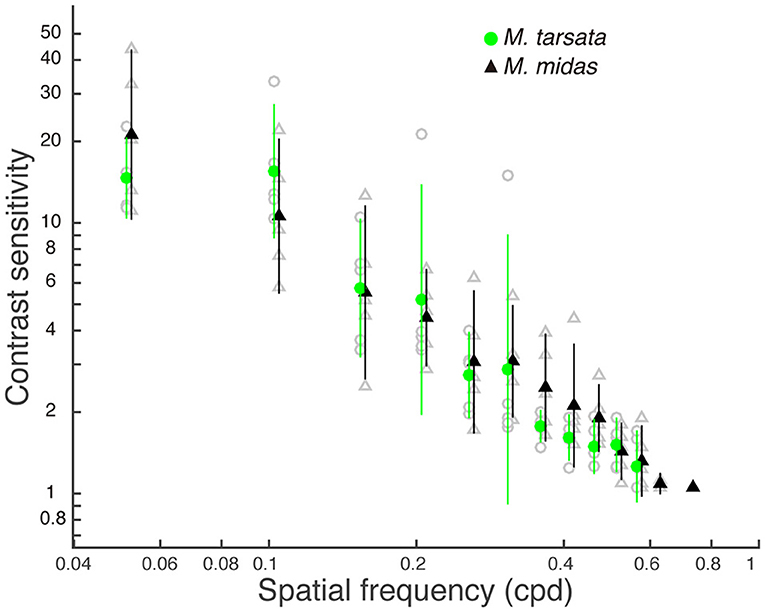
Figure 3. Contrast sensitivity functions for Myrmecia ants obtained from pattern electroretinogram (PERG) measurements. Data are means ± 95% confidence intervals of contrast sensitivity (1/contrast threshold) measured from five individuals of M. tarsata (filled green circles) and M. midas (filled black triangles). Individual measurements are shown as open grey symbols for M. tarsata (circles) and M. midas (triangles). Data points for each species are slightly shifted to either left or right from tested spatial frequencies for clarity.
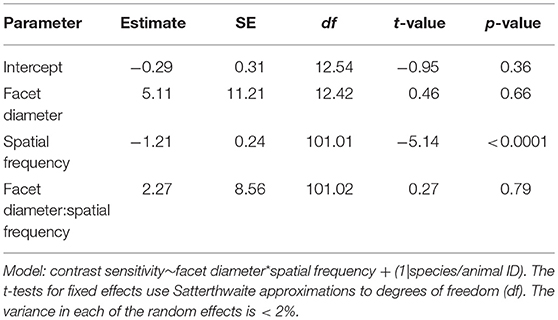
Table 3. Summary of the linear mixed-effects model analysis by restricted maximum likelihood for testing the relationship between contrast sensitivity, spatial frequency, and facet diameter in Myrmecia ants.
Stimulating Only the Medio-Frontal Region of the Eye
To ascertain the region of the compound eye that was stimulated, we occluded the compound eye except the medio-frontal region and measured both spatial resolving power and contrast sensitivity. We determined this only in the nocturnal M. midas. In the occluded animals, the medio-frontal region of the eye consisted of 431.2±34.8 facets. Their average facet diameter was 29.1±0.83 μm, which was comparable to the facet sizes found in intact M. midas (31 μm). The spatial resolving power of the eye at the highest contrast when the medio-frontal region only was exposed was 0.53 ± 0.02 cpd (N = 5) and was comparable to the M. midas with intact eyes [0.57 ± 0.01 cpd; R2 = 0.23, F(1, 8) = 2.36, p < 0.16, Tables 1, 4, Figure 2]. The variation in contrast sensitivity for intact eyes and eyes with medio-frontal region only exposed was explained by spatial frequency of stimuli, but not by the facet diameter (Figure 4; Table 5).
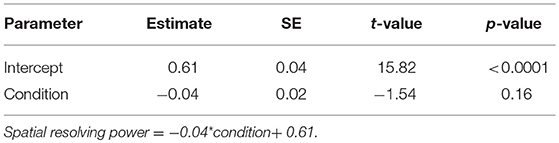
Table 4. Summary of linear model fit for testing whether the spatial resolving power differ between conditions (intact M. midas vs. M. midas with medio-frontal region of the eye only exposed).
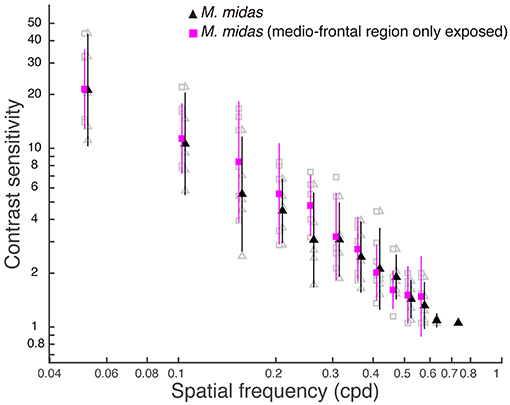
Figure 4. Contrast sensitivity functions for intact eyes and eyes with medio-frontal region only exposed in M. midas. Data are means ± 95% confidence intervals of contrast sensitivity (1/contrast threshold) measured from five individuals of intact (filled black triangles) and M. midas with medio-frontal region of the eye only exposed (filled magenta squares). Individual measurements are shown as open grey symbols for intact (triangles) and M. midas with medio-frontal region of the eye only exposed (squares). Data points for each condition are slightly shifted to either left or right from tested spatial frequencies for clarity.

Table 5. Summary of the linear mixed-effects model analysis by restricted maximum likelihood for testing the relationship between contrast sensitivity, spatial frequency and facet diameter in intact M. midas and M. midas with medio-frontal region of the eye only exposed.
Discussion
We measured the spatial resolving power and contrast sensitivity using a pattern electroretinogram technique in two congeneric Myrmecia ants that were active at different times of the day. We found that the spatial resolving power of Myrmecia ants was correlated with their facet diameter in the medio-frontal region of the compound eye. Spatial resolving power was higher in the diurnal-crepuscular M. tarsata that had smaller facets compared to the nocturnal M. midas that had larger facets. The contrast sensitivity of M. tarsata and M. midas reached a the maximum of 15.5 (6.4% Michelson's contrast) and 21.2 (4.7% Michelson's contrast), respectively, at low spatial frequency. As the variation in contrast sensitivity was not explained by facet diameters, the results suggested that contrast sensitivity functions did not differ between species.
Spatial Resolving Power
The medio-frontal region of the compound eye in the diurnal-crepuscular M. tarsata was composed of considerably smaller facets (22.4 μm) compared to the nocturnal M. midas (31.62 μm). Both the spatial resolving power and contrast sensitivity function did not differ between fully exposed eyes and eyes with medio-frontal region only exposed in M. midas. This indicates that only the medio-frontal region of the compound eye was responsible for the majority of the recorded PERG signal when the entire eye was exposed. The larger lens diameter in nocturnal M. midas might improve photon capture, an adaptation for dim-light conditions (Narendra et al., 2011), but it may come at the expense of spatial resolving power (Warrant and McIntyre, 1993; Warrant, 1999). Our results from the PERG show that the spatial resolving power is lower in ants with larger lenses (M. midas) compared to ants with smaller lenses (M. tarsata) (Figure 2; Table 2). Larger lenses with lower spatial resolving power seem to be an adaptation for a nocturnal lifestyle in M. midas. However this may also be an effect of nocturnal animals typically being larger which enables them to accommodate larger lenses (e.g., Narendra et al., 2017).
In order to compare the spatial resolving power of the two Myrmecia ants that we studied with other species, we estimated their interommatidial angles (Δø) as 1/(2*spatial resolving power) (Land, 1997). This was 0.83° for the diurnal-crepuscular M. tarsata and 0.88° for the nocturnal M. midas. Interommatidial angles have been reported in a diurnal Myrmecia gulosa as 1.7° (Via, 1977) and in a nocturnal Myrmecia pyriformis as 2.1° (Reid, 2010). In M. gulosa, the interommatidal angle was determined by tracking the pseudopupil (Via, 1977), whereas in the nocturnal M. pyriformis, the interommatidial angle was calculated by dividing the average diameter of the facets by the curvatures of the eye in the medio-frontal region (Reid, 2010). Based on these interommatidial angles, the spatial resolving power can be predicted as 0.29 cpd for M. gulosa and as 0.24 cpd for M. pyriformis. Thus, the spatial resolving power of M. gulosa and M. pyriformis estimated by anatomical results is much lower than the values obtained for M. tarsata (0.57 cpd) and M. midas (0.6 cpd) by PERG. This difference occurs despite the time of activity and the visual tasks of these different species being comparable. This discrepancy in the spatial resolving power is likely due to the difference in methods, such as not taking into account the neural connectivity in the lamina for anatomical estimates which can only provide a theoretical upper limit of spatial resolving power (Caves et al., 2018).
This is not unusual and indeed different measures of spatial resolving power yield different estimates even in the same species (Horridge, 2005; Caves et al., 2016, 2018; Ryan et al., 2017). In honeybees, the optical data suggests that bees have interommatidial angles of 1–1.3°(Land 1997, references therein) or 1.7° (Horridge, 2005). These anatomical estimates differ markedly from those obtained using behavioural discrimination tests, which were 0.26 cpd, giving a Δø of 1.92° (Srinivasan and Lehrer, 1988), or Δø of 1.78 based on the spatial resolving power of 0.28 cpd (Horridge, 2003). A recent study using intracellular recording techniques showed that single photoreceptors in the light-adapted state are capable of responding to objects as small as 0.6 × 0.6° (Rigosi et al., 2017), which is at least 5 times smaller than the smallest features bees are known to behaviourally resolve (Lehrer and Bischof, 1995; Giurfa et al., 1996; Giurfa and Vorobyev, 1998). The differences in results may be due to different experimental conditions including light intensity or the eye's adaptation state, and the recording level in the visual processing pathway.
Clearly, spatial resolving power measured by PERG is higher than the theoretical maximum based on anatomical estimates. We suggest two reasons for this. One, PERG measures all signals that improve signal-to-noise ratio (SNR) in the lamina, which includes temporal and spatial summation strategies. Spatial summation may reduce spatial resolving power due to the large visual overlap. However, increasing the photon capture, which improves the SNR should reduce any potential decrease in spatial resolving power (Land, 1997; Theobald et al., 2006). Temporal summation could also decrease spatial resolution, but mostly at high frequencies, i.e., at the limit of the temporal resolving power (Warrant, 1999). Since the temporal frequency of our stimuli was low (2 Hz), spatial resolving power may actually improve, which is what we found. Secondly, interommatidial angle estimated from anatomy assumes that the closest neighbouring ommatidia are the horizontally or vertically adjacent ommatidia. PERG estimates do not make this assumption. This is crucial because, if there is a slight distortion in the ommatidial array, the neural wiring of neighbouring laminar cartridges could potentially reduce the distance between physiological neighbouring ommatidia compared to anatomical neighbours, which would also improve spatial resolving power. Thus, the PERG potentially provides a more reliable estimate of spatial resolving power than anatomical methods. Further PERG studies in other animals whose spatial resolving power are known from anatomical and behavioural techniques, such as honeybees, are required to evaluate this hypothesis.
Contrast Sensitivity
Contrast sensitivity is the ability to discriminate patterns as their brightness contrast decreases (O'Carroll and Wiederman, 2014). In this study, the PERG measurements of contrast sensitivity revealed a maximum of 15.5 (6.4% contrast) at 0.1 cpd in M. tarsata and 21.2 (4.7% contrast) at 0.05 cpd and in M. midas. In most previous studies, the minimum amount of contrast (contrast threshold) of a grating to evoke a response has been measured from motion detecting neurons. In insects, contrast sensitivity (1/contrast threshold) estimates have ranged from 25 to 40 in blowfly (Dvorak et al., 1980), in both diurnal and nocturnal hawkmoths (O'Carroll et al., 1996, 1997), in honeybees (Bidwell and Goodman, 1993), in bumblebees (O'Carroll et al., 1996) and in hoverfly (Straw et al., 2006). These suggest that the maximum contrast sensitivity in the diurnal-crepuscular Myrmecia ant is slightly lower than that found in the motion detection neurons of other insects. Contrast sensitivity changes depending on the behavioural task. This was shown in bumblebees Bombus terrestris where behavioural estimates had a peak contrast sensitivity of at least 33 (3% contrast) in the motion detection system (Chakravarthi et al., 2017), which is much lower than the value of 1.57 (63.6% contrast) for an object discrimination test (Chakravarthi et al., 2016).
The ability of the eye to capture light, which likely limits contrast sensitivity, in M. tarsata must be the same as nocturnal M. midas, because their contrast sensitivity functions are not significantly different. However, the optical sensitivity in M. tarsata was lower than nocturnal ants based on their facet and rhabdom diameters (Greiner et al., 2007). In addition to the size of the photosensitive structure, the sensitivity of a compound eye depends on the overall number of facets and on the size of the individual facets (Horridge, 1977). The diurnal-crepuscular M. tarsata had fewer and smaller facets compared to the nocturnal M. midas, and correspondingly they had a lower maximum contrast sensitivity. In addition, the critical flicker fusion frequency, that is the fastest flickering light an animal can still perceive as flickering, is lower in M. midas (84.6 ± 3.2 Hz) compared to M. tarsata (154.0 ± 8.5 Hz) (unpublished data). This indicates that nocturnal ants employ a slower temporal resolution to improve the sensitivity of eyes, unlike the diurnal-crepuscular ants. Nevertheless, M. tarsata maintained a reasonable contrast sensitivity despite having smaller facets that led to higher spatial resolving power than M. midas. The diurnal Myrmecia ants, including M. tarsata, are known to have larger optic lobes compared to their nocturnal relatives (Sheehan et al., 2019). The large optic lobes in diurnal ants may increase the absolute sensitivity compared to their nocturnal counterparts. This raises the possibility that M. tarsata with their small lenses might maintain a slightly higher contrast sensitivity than expected by neural summation mechanisms, which improves the sensitivity without compromising spatial resolving power.
Data Availability Statement
The datasets for this study are available in the Supplementary Material.
Author Contributions
YO, LR, and AN designed the study. YO and RP-N data collection. YO, LR, and RP-N data analysis. YO and OS eye maps. NH, LR, YO, and OS built the equipment and wrote the software. YO first draft of the manuscript. YO and AN wrote sections of the manuscript. All authors revised manuscript.
Funding
The research was supported by the grants from the Australian Research Council (FT140100221 and DP150101172).
Conflict of Interest Statement
The authors declare that the research was conducted in the absence of any commercial or financial relationships that could be construed as a potential conflict of interest.
Acknowledgments
We thank Jan Hemmi for his advice and helpful discussions during this project. We thank Dr. Drew Allen for advice on statistical analyses.
Supplementary Material
The Supplementary Material for this article can be found online at: https://www.frontiersin.org/articles/10.3389/fevo.2019.00018/full#supplementary-material
References
Armington, J. C., and Adolph, A. R. (1990). Local pattern electroretinograms and ganglion cell activity in the turtle Eye. Int. J. Neurosci. 50, 1–11. doi: 10.3109/00207459008987152
Bach, M., Hawlina, M., Holder, G. E., Marmor, M. F., Meigen, T., et al. (2000). Standard for pattern electroretinography. International Society for Clinical Electrophysiology of Vision. Doc. Ophthalmol. 101, 11–18. doi: 10.1023/A:1002732114721
Beersma, D., Stavenga, D. G., and Kuiper, J. (1977). Retinal lattice, visual field and binocularities in flies. Joumal Comp. Physiol. A 119, 207–220. doi: 10.1007/BF00656634
Bidwell, N. J., and Goodman, L. J. (1993). Possible functions of a population of descending neurons in the honeybees visuo-motor pathway. Apidologie 24, 333–354. doi: 10.1051/apido:19930311
Caves, E. M., Brandley, N. C., and Johnsen, S. (2018). Visual acuity and the evolution of signals. Trends Ecol. Evol. 33, 358–72. doi: 10.1016/j.tree.2018.03.001
Caves, E. M., Frank, T. M., and Johnsen, S. (2016). Spectral sensitivity, spatial resolution and temporal resolution and their implications for conspecific signalling in cleaner shrimp. J. Exp. Biol. 219, 597–608. doi: 10.1242/jeb.122275
Chakravarthi, A., Baird, E., Dacke, M., and Kelber, A. (2016). Spatial vision in bombus terrestris. Front. Behav. Neurosci. 10:17. doi: 10.3389/fnbeh.2016.00017
Chakravarthi, A., Kelber, A., Baird, E., and Dacke, M. (2017). High contrast sensitivity for visually guided flight control in bumblebees. J. Comp. Physiol. A 203, 999–1006. doi: 10.1007/s00359-017-1212-6
Collett, T. S., and Land, M. F. (1975). Visual spatial memory in a hoverfly. J. Comp. Physiol. A 100, 59–84. doi: 10.1007/BF00623930
Dvorak, D., Srinivasan, M. V., and French, A. S. (1980). The contrast sensitivity of fly movement-detecting neurons. Vision Res. 20, 397–407. doi: 10.1016/0042-6989(80)90030-9
Freas, C. A., Narendra, A., and Cheng, K. (2017). Compass cues used by a nocturnal bull ant, Myrmecia midas. J. Exp. Biol. 220, 1578–1585. doi: 10.1242/jeb.152967
Ghim, M. M., and Hodos, W. (2006). Spatial contrast sensitivity of birds. J. Comp. Physiol. A 192, 523–534. doi: 10.1007/s00359-005-0090-5
Giurfa, M., and Vorobyev, M. (1998). The angular range of achromatic target detection by honey bees. J. Comp. Physiol. A 183, 101–110. doi: 10.1007/s003590050238
Giurfa, M., Vorobyev, M., Kevan, P., and Menzel, R. (1996). Detection of coloured stimuli by honeybees: minimum visual angles and receptor specific contrasts. J. Comp. Physiol. A 178, 699–709. doi: 10.1007/BF00227381
Gonzalez-Bellido, P. T., Wardill, T. J., and Juusola, M. (2011). Compound eyes and retinal information processing in miniature dipteran species match their specific ecological demands. Proc. Natl. Acad. Sci.U.S.A. 108, 4224–4229. doi: 10.1073/pnas.1014438108
Greiner, B., Narendra, A., Reid, S. F., Dacke, M., Ribi, W. A., and Zeil, J. (2007). Eye structure correlates with distinct foraging-bout timing in primitive ants. Curr. Biol. 17, R879–880. doi: 10.1016/j.cub.2007.08.015
Greiner, B., Ribi, W. A., and Warrant, E. J. (2005). A neural network to improve dim-light vision? Dendritic fields of first-order interneurons in the nocturnal bee Megalopta genalis. Cell Tissue Res. 322, 313–320. doi: 10.1007/s00441-005-0034-y
Horridge, A. (2005). The spatial resolutions of the apposition compound eye and its neuro-sensory feature detectors: observation versus theory. J Insect Physiol 51, 243–266. doi: 10.1016/j.jinsphys.2004.11.018
Horridge, G. A. (1977). The compound eye of insects. Sci. Am. 237, 108–121. doi: 10.1038/scientificamerican0777-108
Horridge, G. A. (1978). The separation of visual axes in apposition compound eyes. Philos. Trans. R. Soc. B 285, 1–59. doi: 10.1098/rstb.1978.0093
Horridge, G. A. (2003). Visual resolution of gratings by the compound eye of the bee Apis mellifera. J. Exp. Biol. 206, 2105–2110. doi: 10.1242/jeb.00379
Kirschfeld, K. (1967). Die projektion der optischen umwelt auf das raster der rhabdomere im komplexauge von Musca. Exp. Brain Res. 3, 248–270. doi: 10.1007/BF00235588
Land, M. F. (1997). Visual acuity in insects. Annu. Rev. Entomol. 42, 147–177. doi: 10.1146/annurev.ento.42.1.147
Land, M. F., Gibson, G., Horwood, J., and Zeil, J. (1999). Fundamental differences in the optical structure of the eyes of nocturnal and diurnal mosquitoes. J. Comp. Physiol. A 185, 91–103. doi: 10.1007/s003590050369
Land, M. F., and Nilsson, D.-E. (2012). Animal Eyes. 2nd Edn. Oxford: Oxford University Press. doi: 10.1093/acprof:oso/9780199581139.001.0001
Layne, J., Land, M., and Zeil, J. (1997). Fiddler crabs use the visual horizon to distinguish predators from conspecifics: a review of the evidence. J. Mar. Biol. Assoc. 77, 43–54. doi: 10.1017/S0025315400033774
Lehrer, M., and Bischof, S. (1995). Detection of model flowers by honeybees: The role of chromatic and achromatic contrast. Naturwissenschaften 82, 145–147. doi: 10.1007/BF01177278
Narendra, A., Gourmaud, S., and Zeil, J. (2013). Mapping the navigational knowledge of individually foraging ants, Myrmecia croslandi. Proc. R. Soc. B Biol. Sci. 280, 20130683–20130683. doi: 10.1098/rspb.2013.0683
Narendra, A., Greiner, B., Ribi, W. A., and Zeil, J. (2016). Light and dark adaptation mechanisms in the compound eyes of Myrmecia ants that occupy discrete temporal niches. J. Exp. Biol. 219, 2435–2442. doi: 10.1242/jeb.142018
Narendra, A., Kamhi, J. F., and Ogawa, Y. (2017). Moving in dim light: behavioral and visual adaptations in nocturnal ants. Integr. Comp. Biol. 57, 1104–1116, doi: 10.1093/icb/icx096
Narendra, A., Reid, S. F., Greiner, B., Peters, R. A., Hemmi, J. M., Ribi, W. A., et al. (2011). Caste-specific visual adaptations to distinct daily activity schedules in Australian Myrmecia ants. Proc. R. Soc. B 278, 1141–1149. doi: 10.1098/rspb.2010.1378
Nilsson, D. E., and Ro, A. I. (1994). Did neural pooling for night vision lead to the evolution of neural superposition eyes? J. Comp. Physiol. A 175, 289–302. doi: 10.1007/BF00192988
O'Carroll, D. C., Bidwell, N. J., Laughlin, S. B., and Warrant, E. J. (1996). Insect motion detectors matched to visual ecology. Nature 382, 63–66.
O'Carroll, D. C., Laughlin, S. B., Bidwell, N. J., and Harris, R. A. (1997). Spatio-temporal properties of motion detectors matched to low image velocities in hovering insects. Vision Res. 37, 3427–3439.
O'Carroll, D. C., and Wiederman, S. D. (2014). Contrast sensitivity and the detection of moving patterns and features. Philos. Trans. R. Soc. B 369–377:369. doi: 10.1098/rstb.2013.0043
Pelli, D. G. (1997). The VideoToolbox software for visual psychophysics: transforming numbers into movies. Spat. Vis. 10, 437–442. doi: 10.1163/156856897X00366
Porciatti, V. (2007). The mouse pattern electroretinogram. Doc. Ophthalmol. 115, 145–153. doi: 10.1007/s10633-007-9059-8
Ramirez-Esquivel, F., Ribi, W. A., and Narendra, A. (2017). Techniques for investigating the anatomy of the ant visual system. J. Vis. Exp. 129:e56339. doi: 10.3791/56339
Reid, S. F. (2010). Life in the Dark: Vision and Navigation in a Nocturnal Bull Ant. Ph.D. thesis, The Australian National University, Canberra.
Reid, S. F., Narendra, A., Taylor, R. W., and Zeil, J. (2013). Foraging ecology of the night-active bull ant Myrmecia pyriformis. Aust. J. Zool. 61, 170–177. doi: 10.1071/ZO13027
Rigosi, E., Wiederman, S. D., and O'Carroll, D. C. (2017). Visual acuity of the honey bee retina and the limits for feature detection. Sci. Rep. 7:45972. doi: 10.1038/srep45972
Ryan, L. A., Hemmi, J. M., Collin, S. P., and Hart, N. S. (2017). Electrophysiological measures of temporal resolution, contrast sensitivity and spatial resolving power in sharks. J. Comp. Physiol. A 203, 197–210. doi: 10.1007/s00359-017-1154-z
Sheehan, Z. B. V., Kamhi, J. F., Seid, M. A., and Narendra, A. (2019). Differential investment in brain regions for a diurnal and nocturnal lifestyle in Australian Myrmecia ants. J. Comp. Neurol. doi: 10.1002/cne.24617
Smolka, J., and Hemmi, J. M. (2009). Topography of vision and behaviour. J. Exp. Biol. 212, 3522–3532. doi: 10.1242/jeb.032359
Snyder, A. W., Laughlin, S. B., and Stavenga, D. G. (1977). Information capacity of eyes. Vision Res. 17, 1163–1175. doi: 10.1016/0042-6989(77)90151-1
Srinivasan, M. V., and Lehrer, M. (1988). Spatial acuity of honeybee vision and its spectral properties. J. Comp. Physiol. A 162, 159–172. doi: 10.1007/BF00606081
Stöckl, A. L., O'Carroll, D. C., and Warrant, E. J. (2016a). Neural summation in the hawkmoth visual system extends the limits of vision in dim light. Curr. Biol. 26, 821–826. doi: 10.1016/j.cub.2016.01.030
Stöckl, A. L., Ribi, W. A., and Warrant, E. J. (2016b). Adaptations for nocturnal and diurnal vision in the hawkmoth lamina. J. Comp. Neurol. 524, 160–175. doi: 10.1002/cne.23832
Straw, A. D., Warrant, E. J., and O'Carroll, D. C. (2006). A “bright zone” in male hoverfly (Eristalis tenax) eyes and associated faster motion detection and increased contrast sensitivity. J. Exp. Biol. 209, 4339–4354. doi: 10.1242/jeb.02517
Theobald, J. C., Greiner, B., Wcislo, W. T., and Warrant, E. J. (2006). Visual summation in night-flying sweat bees: a theoretical study. Vision Res. 46, 2298–2309. doi: 10.1016/j.visres.2006.01.002
Uhlrich, D. J., Essock, E. A., and Lehmkuhle, S. (1981). Cross-species correspondence of spatial contrast sensitivity functions. Behav. Brain Res. 2, 291–299. doi: 10.1016/0166-4328(81)90013-9
van Hateren, J. H., Hardie, R. C., Rudolph, A., Laughlin, S. B., and Stavenga, D. G. (1989). The bright zone, a specialized dorsal eye region in the male blowfly Chrysomyia megacephala. J. Comp. Physiol. A 164, 297–308. doi: 10.1007/BF00612990
Via, S. E. (1977). Visually mediated snapping in the bulldog ant: a perceptual ambiguity between size and distance. J. Comp. Physiol. A 121, 33–51. doi: 10.1007/BF00614179
Walls, G. L. (1942). The Vertebrate Eye and Its Adaptive Radiation. Bloomfield Hills: The Cranbrook Institute of Science.
Warrant, E. J. (1993). Can neural pooling help insects see at night? Proc IEEE Int Conf Syst Man Cyber. 3, 150–155. doi: 10.1109/ICSMC.1993.385001
Warrant, E. J. (1999). Seeing better at night: life style, eye design and the optimum strategy of spatial and temporal summation. Vision Res. 39, 1611–1630. doi: 10.1016/S0042-6989(98)00262-4
Warrant, E. J. (2016). Sensory matched filters. Curr. Biol. 26, R976–R980. doi: 10.1016/j.cub.2016.05.042
Warrant, E. J., and Dacke, M. (2011). Vision and visual navigation in nocturnal insects. Annu. Rev. Entomol. 56, 239–254. doi: 10.1146/annurev-ento-120709-144852
Warrant, E. J., and McIntyre, P. D. (1993). Arthropod eye design and the physical limits to spatial resolving power. Prog. Neurobiol. 40, 413–461. doi: 10.1016/0301-0082(93)90017-M
Zeil, J. (1979). A new kind of neural superposition eye: the compound eye of male Bibionidae. Nature 278, 249–250. doi: 10.1038/278249a0
Keywords: vision, PERG, bright zone, acute zone, contrast sensitivity
Citation: Ogawa Y, Ryan LA, Palavalli-Nettimi R, Seeger O, Hart NS and Narendra A (2019) Spatial Resolving Power and Contrast Sensitivity Are Adapted for Ambient Light Conditions in Australian Myrmecia Ants. Front. Ecol. Evol. 7:18. doi: 10.3389/fevo.2019.00018
Received: 29 September 2018; Accepted: 21 January 2019;
Published: 12 February 2019.
Edited by:
Ahmed El Hady, Princeton University, United StatesReviewed by:
David Richard Nash, University of Copenhagen, DenmarkNico K. Michiels, University of Tübingen, Germany
Copyright © 2019 Ogawa, Ryan, Palavalli-Nettimi, Seeger, Hart and Narendra. This is an open-access article distributed under the terms of the Creative Commons Attribution License (CC BY). The use, distribution or reproduction in other forums is permitted, provided the original author(s) and the copyright owner(s) are credited and that the original publication in this journal is cited, in accordance with accepted academic practice. No use, distribution or reproduction is permitted which does not comply with these terms.
*Correspondence: Yuri Ogawa, yuriogawa.kato@mq.edu.au
Ajay Narendra, ajay.narendra@mq.edu.au