Contact Calls Facilitate Group Contraction in Free-Ranging Goats (Capra aegagrus hircus)
 Lisa R. O'Bryan1*
  Nicole Abaid2
  Shinnosuke Nakayama3
  Tanujit Dey4
  Andrew J. King5,6
  Guy Cowlishaw7
  Daniel I. Rubenstein8
  Simon Garnier1
- 1Federated Department of Biological Sciences, New Jersey Institute of Technology, Newark, NJ, United States
- 2Federated Department of Biological Sciences, Rutgers University-Newark, Newark, NJ, United States
- 3Department of Mechanical and Aerospace Engineering, New York University, New York City, NY, United States
- 4Department of Quantitative Health Sciences, Lerner Research Institute, Cleveland Clinic, Cleveland, OH, United States
- 5Department of Biosciences, Swansea University, Swansea, United Kingdom
- 6Institute for Communities and Wildlife in Africa, Department of Biological Sciences, University of Cape Town, Cape Town, South Africa
- 7Institute of Zoology, Zoological Society of London, London, United Kingdom
- 8Department of Ecology and Evolutionary Biology, Princeton University, Princeton, NJ, United States
Many social animal species produce vocalizations believed to facilitate group contraction when one or more group members have become distant. However, the mechanisms underlying this function remain unclear for many species. We examined this question with data on a semi-free ranging group of 16 adult domesticated goats (Capra aegagrus hircus) inhabiting Tsaobis Nature Park, Namibia. All goats wore dataloggers consisting of a GPS and audio recorder for 5–6 h per day for 10 days, providing continuous data on their geolocations and vocal communication. We found that callers were farther from the group centroid than expected by chance and that call production was associated with the cessation of group expansion and subsequent group contraction. We did not find strong evidence for antiphonal call exchange between distant and core group members. Rather, we found that (i) call production by distant group members is associated with a significant reduction of group movement away from the caller, and (ii) call production by core group members is associated with greater, though not significantly greater, group movement toward the caller. These findings suggest that calls may be used by distant, and potentially core, group members to facilitate the contraction of group spread. Results from our study clarify the mechanisms through which social animals can regulate collective movement behavior and the specific role that vocalizations play in this process.
Introduction
Animals can gain many benefits from remaining cohesive with others, such as greater protection from predators, more opportunities for mating and access to social information on the locations of resources (van Schaik, 1983; Dehn, 1990). In order to maintain such group cohesion, animals must coordinate their behavior with one another. Studies indicate that many groups can coordinate their behavior by responding to the positions and trajectories of near neighbors (Couzin et al., 2002; Herbert-Read et al., 2011; Farine et al., 2016). However, the efficacy of these mechanisms can diminish during contexts in which lines of sight are broken by vegetation or when visual attention is focused on activities such as foraging (Strandburg-Peshkin et al., 2017). Accordingly, many social birds and mammals produce specific vocalizations (“contact calls”) which are believed to play a role in aiding the maintenance of group cohesion and/or coordination (Kondo and Watanabe, 2009). One category of contact call includes loud calls which individuals produce primarily when they have become distant from some or all group members (Rendall et al., 2000; Gros-Louis et al., 2008). This type of contact call is often termed a “lost call” and is believed to play a role in helping the caller(s) to regain contact with group members (Cheney et al., 1996; Fischer et al., 2001; Digweed et al., 2007). Despite numerous studies of loud contact calling behavior in a variety of species, how these calls facilitate the contraction of group spread (hereafter “group contraction”) remains poorly understood, largely due to the difficulty of monitoring the vocal and movement behaviors of multiple group members simultaneously and due to the typical subtlety of any behavioral changes (Cheney et al., 1996).
Here, we use wearable dataloggers to examine the role loud contact calls play in group contraction among a herd of free-ranging adult goats (Capra aegagrus hircus). Domesticated goats are a highly tractable study species that facilitated the ready deployment of our tracking devices on all group members and the monitoring of these devices throughout the study. Furthermore, goats are gregarious animals that display herding behaviors (Escós et al., 1993), make collective decisions about the nature and timing of their activities (Shrader et al., 2007) and produce contact calls as their primary vocalization type (Briefer and McElligott, 2011, 2012). Controlled experiments have shown that partial social isolation induces contact call production and increased levels of movement which could promote the restoration of contact with group members (Price and Thos, 1980; Siebert et al., 2011). While differences in dominance may exist between individuals, dominance does not correlate with leadership (Stewart and Scott, 1947), suggesting that all individuals have the capacity to influence group movement. Despite being domesticated, domestic goats have been found to display many behaviors similar to other bovids, as well as other wild species (Shank, 1972; Dunbar et al., 1990; Saunders et al., 2005). Thus, we use our study system to test hypotheses posed for the function of loud contact calls in a variety of social birds and mammals, and we expect our findings to be relevant to studies of contact calling behavior in these species as well.
A number of studies have sought to determine how loud contact calls facilitate group contraction. Antiphonal call production is common among separated parents and offspring in a variety of species, especially those in which parents leave young behind while foraging, such as white-winged vampire bats (Diaemus youngi) (Carter et al., 2008) and king penguins (Aptenodytes patagonicus) (Aubin et al., 2000). Accordingly, a common assumption about the role loud contact calls play in group contraction is that calls made by distant individuals elicit a vocal response by group members located near the core of the group, enabling the distant individual to localize and move toward the group. Indeed, in a study of white-faced capuchins (Cebus capucinus), Digweed et al. (2007) found that the duration of separation for distant individuals was shorter when their calls were answered than when they were not. However, studies have found that such antiphonal responses to loud contact calls can be rare and selective among adults. For example, the same study of white-faced capuchins found that antiphonal responses to loud contact calls occurred only 35% of the time, with the calls of dominant individuals being more likely to elicit responses than the calls of lower ranking individuals (Digweed et al., 2007). Additionally, studies of chacma baboons (Papio ursinus) have found that those individuals that do call, seemingly in response to the loud contact calls of others, are also on the periphery of the group themselves (Cheney et al., 1996; Rendall et al., 2000). In this situation, if rejoining the group depends upon reciprocal call production between distant and core individuals, these patterns of call production would not be beneficial.
There is some evidence that loud contact calls can facilitate group contraction in ways that do not depend upon antiphonal call exchange. For example, descriptions of the vocal repertoire of white-faced capuchins by Gros-Louis et al. (2008) indicate that these calls are sometimes produced by individuals in the core of the group when other group members have become distant. Such spontaneously produced calls by core group members could prompt distant individuals to move toward the caller without the need for a provoking vocalization by the distant individual. Similarly, a study of contact call production between female baboons (P. ursinus) and their infants found that, while females were capable of recognizing the contact calls of their infants, they did not tend to respond vocally, but rather moved toward their infants in order to retrieve them (Rendall et al., 2000). Both studies suggest that contact calls can attract specific group members toward the caller. While it remains unclear whether distant individuals use loud contact calls to attract the entire group toward themselves, there is evidence that vocalizations produced in other contexts can have a similar attractive effect on groups. For example, “trill” vocalizations produced by white-faced capuchins located toward the side or back of a traveling troop are capable of changing the troop's trajectory toward that of the callers (Boinski, 1993). As another example, a study of quiet contact calls (“close calls”) produced by foraging meerkats (Suricata suricatta) found that playbacks of these calls caused nearby individuals to move toward the speaker and thereby gravitate toward the “vocal hotspot” (Gall and Manser, 2017).
We first establish whether, in our study system, loud contact calls are indeed more likely to occur following a period of group expansion, when at least some individuals become distant from the group. We also test whether contact call production is associated with subsequent group contraction while also gaining insight into the timeframe over which this might occur. We then test two main hypotheses regarding the mechanisms through which call production could promote group contraction (Table 1). The “Vocal Beacon Hypothesis” poses that calls attract group members toward the caller. This could occur in two different ways depending on the presence (1a) or absence (1b) of antiphonal calling: Prediction (1a) The production of an initial contact call elicits the production of antiphonal call(s) by individuals closer to the center of the group, enabling the initial caller to move toward the group. Prediction (1b) A group member produces a call which attracts other group members toward itself. While studies of domestic goats have found that mothers and their offspring respond vocally to playbacks of each other's contact calls (Ruiz-Miranda et al., 1993; Briefer and McElligott, 2011), counter calling behavior between adults is not well studied. In addition to the Vocal Beacon Hypothesis, we propose a novel hypothesis—the “Straggler Hypothesis”—which proposes that calls slow or stop the movement of group members away from the caller, enabling it to more readily catch up (Prediction 2). This hypothesis presumes that the caller is already aware of others' locations at the time of call production. A study of the contact barks of chacma baboons (P. ursinus) found that 80% of contact barks were produced by individuals in the last third of the group progression, even when they were surrounded by many group members (Cheney et al., 1996). While it is unclear whether these calls cause baboons in the front of the group to slow their movement away from callers in the back of the group, this is a possible way in which calls could facilitate group contraction, and one hypothesis which we explicitly test here.
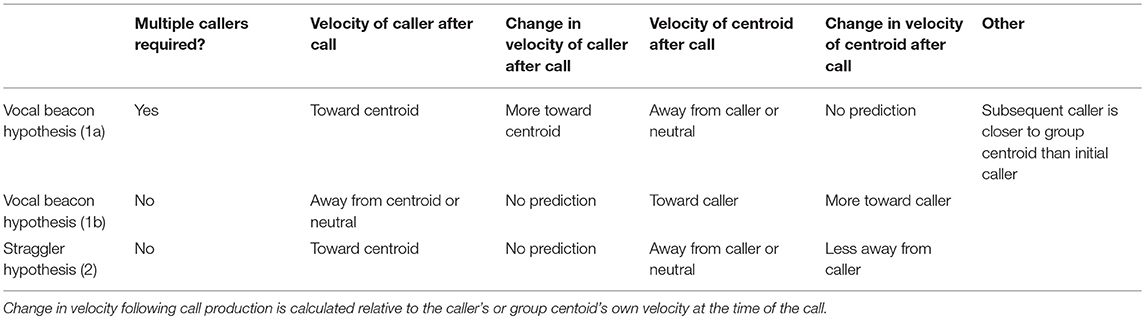
Table 1. Our predictions regarding call production patterns and the velocities of the caller relative to the group centroid, and vice versa, surrounding call production.
We tested our hypotheses using fine-scale GPS and audio data collected from wearable dataloggers which we deployed on a group of 16 free-ranging goats in Namibia. Using these data, we examined the individual and group-level properties displayed during periods of call production and tested the mechanisms through which contact calls may facilitate group contraction. Specifically, we examined measures of individual and group spread at the time of call production, evidence for antiphonal call exchange, and changes in both group spread and the velocities of the callers and group members toward one another during periods surrounding call production.
Materials and Methods
Study Subjects and Data Collection
Fieldwork was carried out during September 2015 at Tsaobis Nature Park which is located on the edge of the Namib Desert in central Namibia (22°23′S 15°45′W). The park is bordered to the north by the ephemeral Swakop River which supports patches of riparian woodland along its banks. Beyond the banks, vegetation is sparse and consists primarily of small trees and shrubs (see Cowlishaw and Davies, 1997 for a full description of the ecology at the site). At the beginning of the study, a group of 16 adult female goats were separated from a larger mixed-species herd of goats and sheep. The goats were housed in a corral in the evenings and at night and were allowed to roam freely for 5–6 h per day from early morning to early afternoon. All group members were lactating during the study and had young offspring which remained in the pen while the herd grazed. This practice, which predated the study, was for the protection of the young and is similar to the infant caching behavior displayed by feral goats (McDougall, 2009). The goats had free access to their offspring while in the pen.
The goats were allowed to adjust to their modified group over a 5 day period at the start of the study. On the morning of the sixth day, all 16 goats were fitted with modified SHOALgroup F2HKv2 collars (see Fehlmann et al., 2017 for details). Each collar contained a TechnoSmArt GiPSy 4 GPS unit, recording geolocation at 1 Hz, and an audio recorder which recorded data continuously at 16 kHz. This audio recorder was comprised of an Adafruit Electret Microphone Amplifier (MAX4466), Adafruit Trinket Microcontroller, and Adafruit VS1053 Codec + MicroSD Breakout. The microphone was positioned on the outside of the case surrounding the other collar components and was angled up toward the wearer's mouth. Audio data were saved as 1 h-long OGG files which were later converted to WAV files. The goats wore the collars for a 10 day period (09/09/2015–09/18/2015). Since our study species was a domesticated animal, we had ready access to the animals while in the pen, which enabled us to monitor the status of the dataloggers and save battery by turning the GPS and audio recorder on, and off, each day prior to, and following, their free-ranging period. In order to synchronize the audio and GPS data, we synchronized our watches to internet-derived Universal Coordinated time (UTC) time at the beginning of the study and spoke the current time out loud to each recorder each time we turned it on (see Supplemental Material 1.1.3 for more information on our verification of synchronization). Any observed power failures were repaired following daily inspection of devices. In addition, the collar of each group member was removed once in the evening between 09/12/2015 and 09/14/2015 in order to back up the data and correct any additional malfunctions of the devices. Each removed collar was replaced the following morning before the goats were released from the pen.
In addition to the data collected by the collars, observational data were collected throughout the study. The goats were followed by two observers from a distance so as to not influence their behavior. In order to verify the audio data recorded by the collars, all observations of vocalizations were documented as well as the identity of the individual producing the vocalization. On occasions, the group would split into two subgroups (see section GPS Processing), and on these occasions, one observer would follow each group. Occasionally, the movement of the goats had to be influenced by the observers. These instances included herding the goats out of the corral in the morning, herding them back toward the corral in the afternoon, and occasionally herding them back within the boundaries of the park, away from the larger herd or if the herd began to split into more than two groups. Data collected during these periods were not included in the analysis (see section GPS Processing).
Data Processing
GPS Processing
Data processing and analysis took place using R (version 3.1) and Matlab (version 2017b). GPS data were error corrected using the swaRm package (Garnier, 2016) (Supplementary Material 1.1.1). On five occasions, the herd was observed to split into two groups which began to function separately from one another for a period of time (mean: 171.7 minutes, range: 59.6–300.7 min). These periods were identified in the GPS data by calculating the mean group member distance to centroid for each second and finding the time periods in which this measure exceeded the third quartile of mean distances to centroid (87.5 m) for study-wide data. All data falling within these intervals were omitted from analysis (858.6 min). As mentioned above, we also omitted any time periods when the group had to be herded (641.4 min). A window of an additional ±5 min was added around each omitted period as a buffer. Thus, our analyses focus only on those time periods in which the herd was naturally functioning as a cohesive group (total observation time: 34.9 h; Datasheets 1, 2).
Identification of Calls and Call Bouts
In order to determine the timing of call production and identity of the caller, we trained a support vector machine algorithm to identify and extract vocalizations with data on observer-verified calls and non-calls (Supplementary Material 1.1.2; Figures S2, S3). The algorithm had an 88.7% success rate on detecting known vocalizations. This resulted in a final dataset of 651 vocalizations, 244 of which fell during the selected periods of movement data. Rather than being produced intermittently throughout the day in a regular or random manner, call production in our study system was temporally clumped. Thus, we divided the calls into calling bouts based on the amount of time between successive vocalizations by any group member. We only considered intervals between calls that did not overlap with periods of herding or group splits and where both calls occurred on the same day. We fitted a Gaussian mixture model to the log transformed time delays between successive calls to find the cutoff between bouts (Figure S4). Our inferred criterion was 150 s which resulted in 57 call bouts. The number of calls in a bout ranged from 1 to 57 with a median of 1 and mean (SD) of 4 (8.4). 59.6% of bouts consisted of only one call while 40.4% consisted of more than one call. The duration of call bouts ranged from 0 s (for solitary calls) to 685 s, with a mean (SE) of 61.25 (17.5) s.
Assessing Group Spread at the Time of Call Production
To establish whether the goats' contact calls do occur during periods of greater than normal group spread, we first assessed the group's spread at times of call production and compared these measures to randomly selected time points. We used the maximum individual distance to the group's centroid (the average geolocation of all group members) as our measure of group spread. We focused on the first call of each bout (n = 57) and found the maximum distance to centroid at the time of each call. We then randomly selected 57 time points from the dataset (without replacement) and repeated this selection 10,000 times, finding the maximum distance to centroid at each randomly selected time. We used the “density” function from the base package (R Core Team, 2016) to calculate the kernel density estimates for the real data and each randomized selection of 57 data points. The density estimates were calculated for a range of maximum distances to centroid from 20 to 100 m by intervals of 1 m. For the randomized datasets, we then calculated the mean density estimate for each distance across all 10,000 iterations and found confidence intervals by calculating the 0.025 and 0.975 quantiles for these data using the “quantile” function from the stats package (R Core Team, 2016). The density functions for the real and randomized datasets were compared by examining areas of overlap between the real dataset and the confidence intervals of the randomized dataset.
Investigating Caller Distances to Centroid at the Time of Call Production
In addition to examining the maximum distance to centroid at the time of call production, we also examined the relationship between call production and the caller's own distance to the centroid of the group at the time of its call. We compared the distribution of distances to the centroid at the time of the first call in the bout for the individual who gave that call (n = 50 calls with GPS data for the caller) to the distribution of distances expected if call production was randomly distributed between all group members. This randomized dataset was generated by reassigning caller identities for the selected calls (for instance, randomly assigning all calls produced by individual #1 to individual #4 and all calls by individual #4 to individual #7) across 10,000 iterations, thereby breaking any correlation between call production and the caller's distance to centroid. The distances to centroid of reassigned “callers” were then calculated for each iteration at each call time. From these data, we then calculated kernel density estimates for distances to centroid ranging from 0 to 150 m by intervals of 1 m for both the real and randomized datasets. For the randomized dataset, we then found the mean density estimate and confidence interval for each distance across all permutations. As in the previous analysis, the density functions for the real and randomized datasets were compared by examining areas of overlap between the real dataset and the confidence intervals of the randomized dataset.
In addition to distance to centroid, we also examined the relationship between calling and the caller's ordinal distance from the centroid (n = 50 calls with GPS data for the caller). To calculate this measure, we ranked each group member based on its distance to the centroid at the time of the first call in a bout, starting with the closest individual to the centroid. Since we did not always have GPS data for the same number of group members throughout the dataset (Figure S1), we calculated each individual's relative rank by dividing its ordinal rank by the number of individuals for whom we had GPS data for that time point. Thus, a relative distance of 1 means that the individual is the furthest from the centroid (of those for whom we have data); with values close to zero indicating that the individual is one of the closest to the centroid. We then compared the distribution of observed ranked distances of callers to expectations based on the ranks of randomized caller identities generated in the same manner as the previous two analyses. Density estimates were calculated for relative ranked distances to centroid within a range from 0 to 1 by intervals of 0.05.
Determining the Relationship Between Call Production and Group Contraction
We assessed changes in the group's spread during time periods before and after call production to establish whether call production is associated with the initiation of group contraction. We focused on calling bouts where an interval of 20 min before and after the first call in the bout did not overlap with any periods corresponding to herding or group splits (n = 38 calling bouts). We found the maximum group member distance to centroid every 15 s within the +/- 20 min interval (40 min total). We then subtracted the maximum distance to centroid at the time of the call from the maximum distance to centroid at each time point and found the mean and 95% confidence interval for these differences for all time points. Time points with confidence intervals that did not include zero were considered to have group spreads that were significantly different from that seen at the time of the call. For comparison, we repeated the analysis by randomly selecting 38 time points from the GPS data to use as focal points instead of calls, ensuring that the +/- 20 min window of each point did not overlap with herding or group splits.
Investigating Calling Patterns Within Bouts
In order to assess whether calls by distant individuals elicit vocal responses by those closer to the center of the group, as predicted by Vocal Beacon Hypothesis 1a, we first calculated the total number of unique callers within each calling bout and determined the frequency of multi-caller bouts. For bouts with more than one caller, we first calculated the distance between subsequent callers at the time of the second caller's first call. We calculated this distance using the “nnd” function from the swaRm package (Garnier, 2016) which calculates the distance between nearest neighbors given their geolocations at given timepoints. Since the first and second callers were not necessarily nearest neighbors, we reduced our dataset to include only the geolocations of the first and second callers for each included timepoint before running the function. We then calculated the distance to centroid of both callers and used a chi-squared test to determine whether the second caller was significantly more likely to be closer to, or further from, the centroid than the first caller and a Wilcoxon Rank-sum Test to test whether the distance to centroid of the second caller was significantly different from the distance to centroid of the first caller.
Examining Velocity of Callers and Centroid
We measured both the caller's velocity relative to the centroid of the remaining group members at times surrounding call production as well as the centroid's velocity relative to the caller. We selected the first call of all bouts where an interval of 20 min before and after the call did not overlap with any periods corresponding to herding or group splits and in which we had GPS data for the first caller of the bout (n = 33). We found the geolocation of the caller for each second during the time window for each call. We also calculated the geolocation of the group centroid of the remaining group members during this same period. The position time series for the caller and the centroid were smoothed over a moving 20 s window using the Matlab built-in function “smooth” and a lowess local regression method. These time series were numerically differentiated to find velocity vectors for the caller and the group centroid. We then computed the scalar projection of each caller's velocity onto the unit vector originating at its position in the direction of the group centroid's position sc→g (where the “g” subscript denotes the group centroid and the “c” denotes the caller), and the analogous quantity for the centroid sg→c. These quantities are defined as:
and a schematic illustrating their physical meaning is shown in Figure 1. xg and vg represent the position and velocity of the group centroid, respectively, while xc and vc represent the position and velocity of the caller. sg→c represents the velocity of the group centroid relative to the caller and sc→g represents the velocity of the caller relative to the group centroid. In terms of the goats' relative motion, sc→g is positive when the caller moves toward the group centroid, and it is negative when it moves away from the group centroid. Similarly, sg→c is positive when the group centroid moves toward the caller and negative otherwise. Therefore, these quantities capture the relative movements that could result in the caller and remaining group members rejoining, namely, the caller approaching the group centroid or the group centroid approaching the caller.
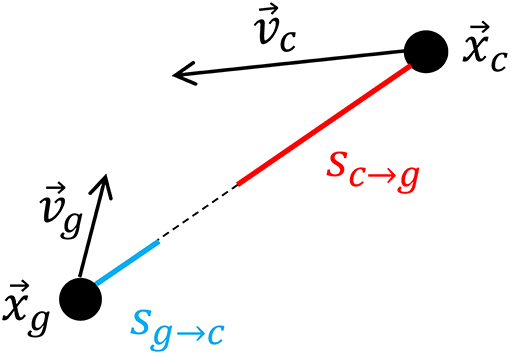
Figure 1. Schematic showing how the velocities of the caller toward the group centroid sc→g and group centroid toward the caller sg→c are calculated according to the positions of the group centroid (xg) and caller (xc) and the velocities of the group centroid (vg) and caller (vg) at each timepoint.
Across bouts, we found the mean (and 95% confidence interval) for the velocity of the caller to the group centroid and velocity of the group centroid to the caller for time points occurring every 15 s within each call's ±20 min interval. Furthermore, we found the mean difference (and 95% confidence interval) in the caller's velocity to group centroid and group centroid's velocity to caller relative to that displayed by each at the time of the call. Lastly, we used the “ma” function from the forecast package (Hyndman, 2017) to display a simple moving average of these velocities with a window spanning from 2.5 min before to 2.5 min after each timepoint. The Vocal Beacon Hypothesis 1a predicts increased caller movement toward the group centroid following call production (presumably due to a subsequent call by a core group member). The Vocal Beacon Hypothesis 1b predicts increased group centroid movement toward the caller after call production. The Straggler Hypothesis predicts caller movement toward the group centroid and a reduction in centroid movement away from the caller following call production (Table 1).
Results
Compared to randomly selected time points, the likelihood of call production by any group member increased with increasing maximum distance to centroid, reaching significance for maximum distances to the group centroid >57 m (Figures 2A, B). The likelihood that a given individual would produce the first call in a bout also increased with that individual's own distance to the group centroid, with individuals being significantly less likely to call when they were closer to the group centroid (within 28 m) and significantly more likely to call when they were far from the group centroid (>95 m; Figures 2C, D). Similarly, a group member was significantly more likely to call when it was the furthest individual from the group centroid (normalized ranked distance to group centroid >0.95; Figures 2E, F).
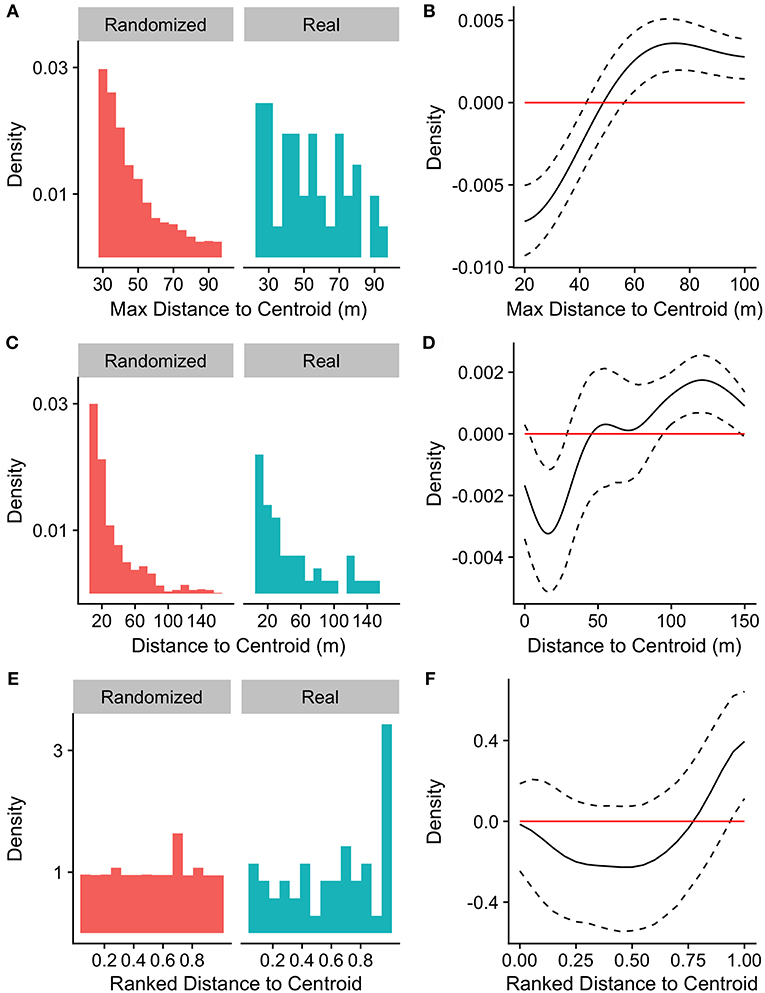
Figure 2. Distributions of (A) maximum distance to centroid, (C) distances to centroid of callers, and (E) callers' ranked distances from the centroid (1 = furthest) at the time of the first call in a bout for real and randomized datasets. (A) nreal = 57 calls, nrand = 10,000 iterations of 57 randomly selected time points, (C,E) nreal = 50 calls, nrand = 10,000 permutations of caller identity for 50 calls. (B,D,F) Represent differences between density functions for real minus randomized datasets.
Calls were produced by 13 out of the 16 group members with a mean (SD) of 3.6 (3.4) bouts initiated by each individual and a mean (SD) of 14.3 (18.5) calls per individual. The number of unique callers in a bout (n = 57 bouts) ranged from 1 to 5 with a median of 1 and mean (SD) of 1.4 (0.9). 78.9% of call bouts were by a single caller while 21.1% were by multiple callers. For bouts in which there was more than one caller (n = 9 out of 50 with GPS data for both callers), the distance between the first and second caller at the time of the second caller's first call ranged from 3.9 to 100.8 m with a median of 42.2 and mean (SD) of 42.0 (30.0) m. Our prediction for the Vocal Beacon Hypothesis 1a, that the second caller would be closer to the centroid than the first (Table 1), was not supported. The second caller in the bout was equally likely to be closer to, or farther from, the centroid compared to the first caller (X2 = 0.11, df = 1, p-value = 0.74). The second caller was closer in 55.6% of the bouts and farther in 44.4%. Furthermore, the distance to centroid of the second caller relative to that of the first caller was not significantly different from zero (Wilcoxon signed-rank test: V = 39, p-value = 0.93) and ranged from −38.0 to 36.9 m with a median of −2.1 and mean (SD) of −3.8 (27.5) m.
The mean (SD) maximum group member distance to centroid at the time of the first call in a bout was 65.1 (37.6) m. When considering a ±20 min time window before and after call production, calls fell in between periods of group expansion and contraction (Figure 3). The mean maximum distance to centroid was significantly greater surrounding the time of call production (from 60 s before the call to 660 s after the call) compared all other times within the ±20 min time window. The mean maximum distance to centroid was never significantly greater than that observed at the time of the call. The mean (SD) maximum distance to centroid observed at the times of randomly selected focal points, rather than real calls, was 36.7 (29.8) meters. This level of group spread was not significantly different from mean distances observed during any times within the ±20 min time interval (Figure S5). These patterns of group spread can be examined visually on an event-by-event basis in Figure 4. As can be seen, call bouts tended to fall near times when maximum distance to centroid had peaked.
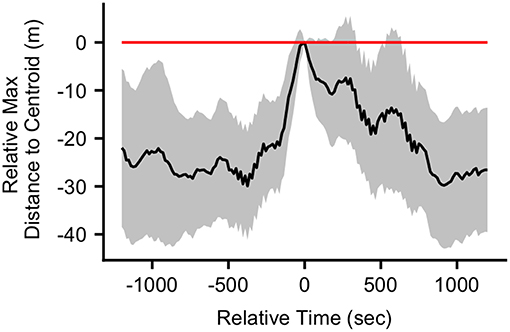
Figure 3. The mean difference (with 95% confidence interval) in the maximum distance to centroid at each time point in the ±20 min interval relative to the maximum distance to centroid at the time of the call (n = 38 calls). Relative time = 0 indicates the time of the calls.
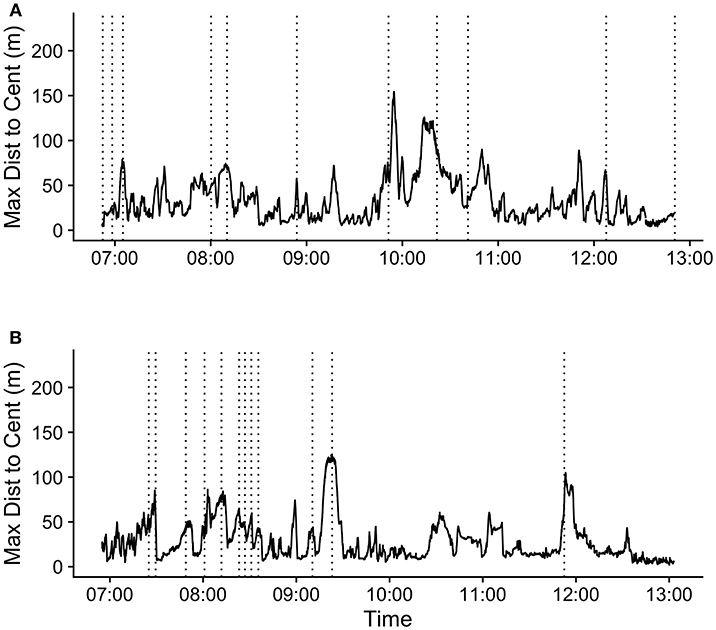
Figure 4. Maximum distance to centroid over time (hh:mm) for 2 days during the study period: (A) 09/10/2018 and (B) 09/15/2018. Vertical dotted lines indicate the times of the first call in each call bout during these periods.
The mean caller velocity relative to the centroid was intermittently significantly positive (i.e., the caller moved toward the centroid) surrounding the time of the call (from 300 s prior to call production to 45 s after call production). After this period, the mean caller velocity had a negative trend and eventually became intermittently significantly negative (i.e., the caller moved away from the centroid) between 615 and 975 s after call production (Figure 5A). The mean caller velocity relative to the group centroid was never significantly greater than that displayed at the time of the call, meaning that the caller was never moving significantly more toward the group centroid than it was at the time of the call. The caller's velocity relative to the group centroid was intermittently significantly lower than that displayed at the time of the call both prior to and following call production (prior to 405 s before call production and following 450 s after call production; Figure 5C). The mean group centroid velocity relative to the caller was significantly negative (i.e., the centroid moved away from the caller) prior to call production (from 360 to 45 s prior to call production). Following this period, the mean group centroid velocity had a positive trend and eventually became significantly positive (i.e., the group centroid moved toward the caller) between 780 and 960 s after call production (Figure 5B). The mean group centroid velocity relative to the caller was never significantly lower than that displayed at the time of the call, meaning that the group centroid never moved significantly more away from the caller than it did at the time of the call. The group centroid's velocity relative to the caller was intermittently significantly greater than that displayed at the time of the call both prior to and following call production (prior to 810 s before call production and following 240 s after call production; Figure 5D). These findings, of reduced group centroid movement away from the caller and intermittent caller movement toward the group centroid following call production, best support the predictions of the Straggler Hypothesis (Table 1).
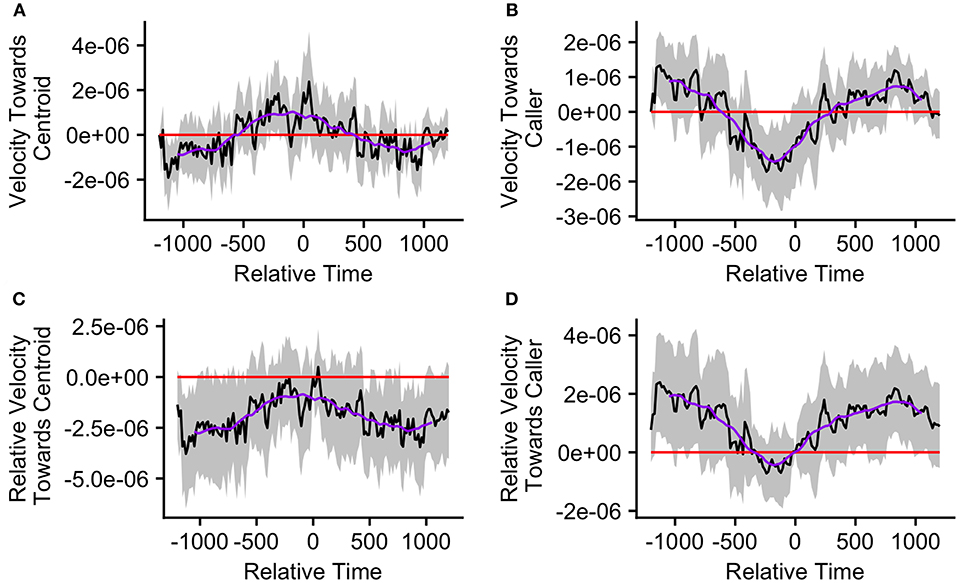
Figure 5. The upper graphs show the mean velocity with 95% confidence interval of the (A) caller toward the group centroid and (B) group centroid toward the caller, from 20 min before to 20 min after the production of the first call (relative time = 0) in a call bout (n = 33 calling bouts). The lower graphs show the mean difference in velocity (with 95% confidence interval) of the (C) caller toward the group centroid and (D) group centroid toward the caller compared to their own velocities at the time of the call (relative time = 0). The purple line represents the simple moving average of each plotted velocity calculated with a window of 301 s centered on each datapoint.
While we found that individuals that were distant from the centroid were most likely to call during periods of wide group spread (above), many calls were produced by individuals that were close to the centroid due to the greater number of group members in these positions (Figure 2B). Thus, we examined whether calls might function differently when produced by individuals distant from the group centroid compared to those produced by individuals close to the centroid at the time of call production. We conducted a k-means cluster analysis on call bouts using the “kmeans” function from the stats package (R Core Team, 2016). The clustering variables we chose were the caller's distance to centroid and the caller's relative distance to centroid at the time of call production. We chose these variables since, together, they provide information on whether an individual may be distant from the group (far from the group centroid in both rank and distance) or more central (closer to the centroid in both rank and distance). Before including these variables in the model, we scaled them to have a mean of 0 and standard deviation of 1 using the “scale” function (R Core Team, 2016). We set the number of clusters to 2 in order to differentiate those individuals that were distant from the group centroid from those that were closer to the centroid at the time of call production. We ran the analysis on all bouts in which we had GPS data for the first caller (n = 50).
The results of the k-means cluster analysis are displayed in Figure 6. Cluster 1 consisted of 23 bouts and had a non-scaled mean (SD) caller distance to group centroid of 74.9 (37.9) m and a relative distance to group centroid of 0.90 (0.13) (1 = furthest from centroid). Cluster 2 consisted of 27 bouts and had a mean (SD) caller distance to group centroid of 13.2 (9.2) m and a relative distance to group centroid of 0.36 (0.21). The maximum distance to group centroid of any group member at the time of the call was significantly greater in cluster 1 than cluster 2 (Wilcox.test; V = 490, p < 0.001). The mean (SD) maximum group member distance to the group centroid in cluster 1 was 98.2 (71.7) m while it was 47.1 (28.0) in cluster 2. Due to this difference, we re-plotted the maximum distance to group centroid over the time surrounding call production in order to examine whether bouts in both clusters correspond with peaks in group spread (Figure S6). We found that, for both clusters, mean group spread was never significantly greater than it was at the time of the call. However, there was a more pronounced group contraction surrounding events in cluster 1, with significantly lower group spread for all times before 105 s prior to the call, intermittently following 30 s after the call, and for all times following 525 s after call production (Figure S6A). Events in cluster 2 had significantly lower group spread between 450 and 195 s prior to call production and then again following 1,140 s after call production (Figure S6B).
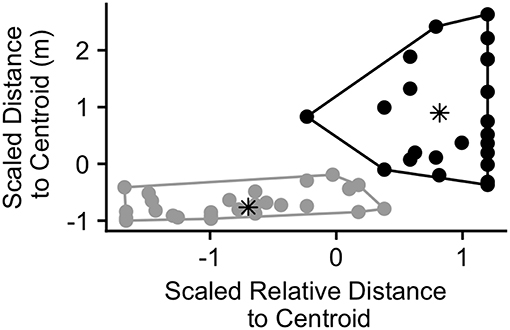
Figure 6. Calling bouts plotted according to the scaled relative distance to centroid of the caller and the scaled distance to centroid of the caller (meters) at the time of the first call in the bout (n = 50 calling bouts). Points are colored according to the cluster in which they were assigned by the cluster analysis (black = cluster 1, gray = cluster 2). The asterisks represent the center of each cluster.
We also re-examined counter-calling behavior within the two clusters predicted by the k-means cluster analysis in order to determine whether there was evidence for differences in behavior between them. Cluster 1 had 5 multi-caller bouts out of 23 total bouts (21.7%) while cluster 2 had 7 multi-caller bouts out of 27 (25.9%). Due to the low sample sizes within each cluster (4 events with GPS data for both callers in cluster 1 and 5 in cluster 2), we simply calculated summary statistics in order to examine potential trends. In cluster 1, the distances between the first and second callers ranged from 34.6 to 70.2 m with a median of 42.4 and mean (SD) of 47.4 (15.6) m. In 1 out of the 4 bouts, the second caller was further from the centroid than the first, while in 3 out of 4 it was closer. The distance to centroid of the second caller relative to the first ranged from −38.1 to 25 m with a median of −32.4 and mean (SD) of −19.4 (29.9). In cluster 2, the distances between the first and second callers ranged from 3.9 to 100.8 m with a median of 30.3 and a mean (SD) of 37.7 (39.6) m. In 3 out of the 5 bouts, the second caller was further from the centroid than the first, while in 2 out of 5 it was closer. The distances to centroid of the second caller relative to the first ranged from −13.4 to 36.9 m with a median of 1.5 and mean (SD) of 8.7 (20.0). These results suggest that there was little difference between clusters in the tendency for counter calling to occur. There was also little evidence for differences in the distances between the first and second callers. However, there was some tendency for the second caller to be closer to the centroid than the first caller in the first cluster and vice versa for the second cluster.
Finally, we re-ran our velocity analysis to examine longitudinal changes in the callers' and centroids' velocities relative to one another for the two clusters predicted by the k-means cluster analysis. As before, we restricted analysis to those bouts in which the ±20 min window did not overlap with any periods of herding or group splits (n = 33, cluster 1 = 15, cluster 2 = 18). We found that events from cluster 1, where the caller was far from the group centroid, were associated with significantly positive mean caller velocity relative to the centroid surrounding the time of call production (from 15 s before the call to 105 s after the call; Figure 7A). The mean caller velocity was never significantly greater than at the time of the call, but it was intermittently significantly lower both prior to and following call production (prior to 60 s before call production and following 270 s after call production; Figures 7C). Furthermore, these events were associated with group centroids that displayed significantly negative mean velocity relative to the caller surrounding call production (for the majority of timepoints from 330 s prior to the call to 135 s after the call; Figure 7B). Following call production, there was an increase in mean group centroid velocity relative to the caller which eventually became intermittently significantly positive (between 825 and 945 s after call production). The group centroid's mean velocity relative to the caller was at its most negative 45 s after the first call and became significantly greater than it was at the time of call production beginning 225 s after the call (Figure 7D). These results, of reduced group centroid movement away from the caller and strong caller movement toward the group centroid following call production, support the predictions of the Straggler Hypothesis (Table 1).
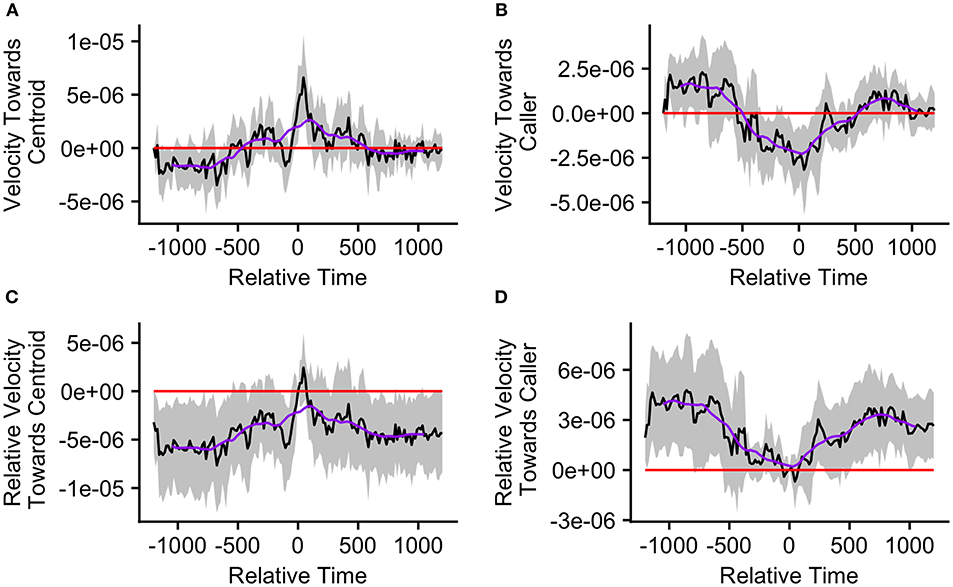
Figure 7. The upper graphs show the mean velocity with 95% confidence interval of the (A) caller toward the group centroid and (B) group centroid toward the caller, from 20 min before to 20 min after the production of the first call (relative time = 0) in a call bout. Data are presented for bouts assigned to cluster 1 (n = 15 calling bouts), which correspond with bouts in which callers are far from the centroid at the time of the call. The lower graphs show the mean difference in velocity (with 95% confidence interval) of the (C) caller toward the group centroid and (D) group centroid toward the caller compared to their own velocities at the time of the call (relative time = 0). The purple line represents the simple moving average of each plotted velocity calculated with a window of 301 s centered on each datapoint.
Events in the second cluster, where the caller was close to the group centroid, were associated with a neutral caller velocity relative to the group centroid prior to call production and an intermittently significantly negative velocity beginning 45 s after call production (Figure 8A). However, for the majority of timepoints, the mean caller velocity relative to the centroid was not significantly different from that displayed at the time of the call (Figure 8C). For these events, the group centroid had an intermittently significantly negative mean velocity relative to the caller prior to call production (between 375 and 165 s prior to call production) followed by an intermittently significantly positive mean velocity after call production (from 45 to 75 s following call production, and following 450 s after call production; Figure 8B). However, the group centroid's mean velocity relative to the caller was never significantly different from that displayed at the time of the call (Figure 8D). These findings, of the caller moving away from the group centroid and the group centroid moving toward the caller following call production, support some predictions of the Vocal Beacon Hypothesis (Table 1). However, our findings do not support the prediction that the group centroid's movement toward the caller following call production was significantly greater than its movement toward the caller at the time of the call.
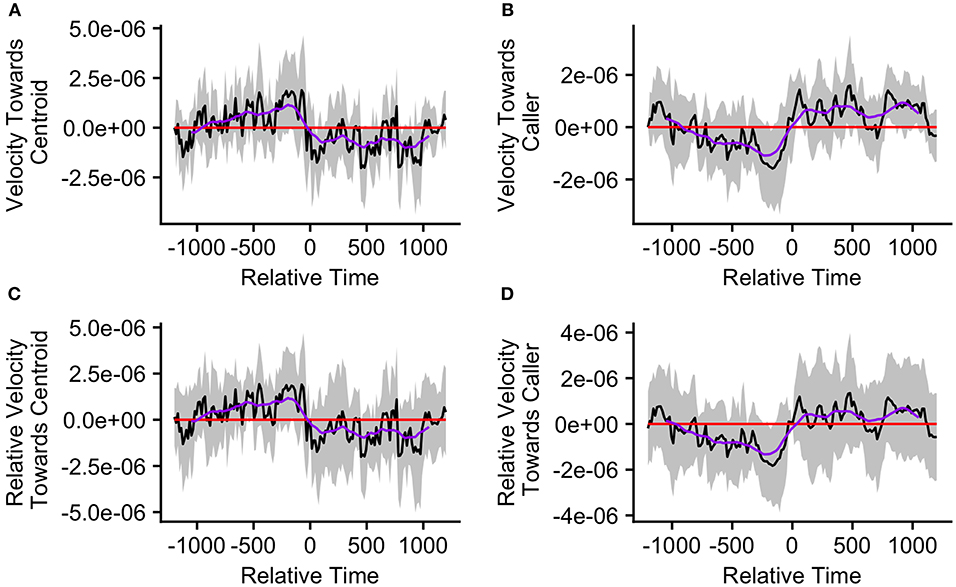
Figure 8. The upper graphs show the mean velocity with 95% confidence interval of the (A) caller toward the group centroid and (B) group centroid toward the caller, from 20 min before to 20 min after the production of the first call (relative time = 0) in a call bout. Data are presented for bouts assigned to cluster 2 (n = 18 calling bouts), which correspond with bouts in which callers are close to the centroid at the time of the call. The lower graphs show the mean difference in velocity (with 95% confidence interval) of the (C) caller toward the group centroid and (D) group centroid toward the caller compared to their own velocities at the time of the call (relative time = 0). The purple line represents the simple moving average of each plotted velocity calculated with a window of 301 s centered on each datapoint.
Discussion
The aim of our study was to determine the function of goats' loud contact calls and explore how they might facilitate group contraction during periods of wide group spread. We first tested whether these calls were indeed associated with periods of wide group spread while also gaining insight into the positions of group members producing these calls. We found evidence that these vocalizations were associated with contexts in which group spread was especially wide, with group members that were further from the centroid being more likely to produce the calls. These findings are consistent with the characterization of some loud contact calls, such as those produced by white-faced capuchins (Gros-Louis et al., 2008), as “lost calls” and suggests that they do play a role in facilitating group contraction. Indeed, we found that the first call in a bout fell at an intermediary point between group expansion and contraction. From the time of the call until a little more than 10 min after the call, group spread was significantly greater than it was at all other times surrounding call production, but mean group spread was never significantly greater than at the time of the call. Randomly selected time points did not fall at such peaks in group spread suggesting that it is not simply coincidental that calls fall during these periods. It also suggests that it is unlikely that the goats produced calls for reasons unrelated to the spread of their current group. Overall, these results support our central hypothesis that call production plays a role in halting group expansion and prompting group members to adjust their behavior in order to initiate group contraction.
Hypothesis 1a predicted that antiphonal call production between distant and more central group members is necessary to enable group contraction. We found that the majority of calling bouts consisted of calls by only one caller. Furthermore, when multicaller bouts did occur, the second caller was equally likely to be closer to, or further from, the group centroid compared to the first caller, with only a small mean difference in distance to group centroid between successive callers. Therefore, these findings do not support the prediction that call production elicits antiphonal responses by more central group members, which is consistent with others studies that have reported infrequent vocal responses to the loud contact calls of others (Cheney et al., 1996; Rendall et al., 2000; Digweed et al., 2007). While it is possible that the low number of antiphonal responses in our study system represents a failure to facilitate group contraction, this interpretation is not consistent with our finding that call production was correlated with the cessation of group expansion and subsequent group contraction.
When investigating the mechanisms that may facilitate group contraction, we found that the mean pattern across all bouts best corresponded with the predictions of the Straggler Hypothesis. We found evidence that the group centroid was moving away from the caller prior to call production but reduced its movement away from the caller following call production. We also found some evidence that the caller was moving toward the group centroid around the time of the call, but this movement was less consistent. This inconsistency is likely due to our finding that callers that were far from the group centroid and callers that were close to the group centroid displayed opposite movement patterns relative to the group centroid around the time of the call. We gained a more clear understanding of the mechanisms facilitating group contraction after dividing calling bouts according to the initial caller's distance from the centroid. For bouts in which the caller was distant from the centroid, we found that call production was associated with a cessation of group centroid movement away from the caller, similar to the pattern observed in the data aggregated across all bouts. These bouts were also associated with a strong peak in caller movement toward the centroid at the time of call production which was not observed in the data aggregated across all bouts. These findings more clearly support the predictions of the Straggler Hypothesis and suggest that callers far from the centroid can use loud contact calls to slow the group centroid's movement away from themselves to enable them to catch up more readily. This hypothesis is further supported by our finding that these bouts were associated with very wide group spread and also with strong group contraction following call production. While we did not find support for Hypothesis 1a, that counter calling plays a key role in group contraction, we did observe some instances of counter calling behavior in these bouts. Furthermore, we found some evidence that the second caller tended to be more central than the first. This counter calling behavior has the potential to play a role when lagging group members are not aware of the group centroid's location and therefore cannot move toward it. In order to test this hypothesis, more data must be collected on instances of counter calling behavior.
For bouts in which the caller was close to the group centroid, we found that call production was associated with a transition period during which the caller switched from moving neutrally relative to the centroid to moving significantly away from it. Call production was also associated with a transition period during which the group centroid switched from moving significantly away from the caller to moving significantly toward it. However, group movement toward the caller following call production was not significantly greater than the group's movement relative to the caller at the time of the call. These findings support some predictions of Hypothesis 1b and suggest that call production by central group members can boost the group centroid's velocity toward itself, perhaps by attracting some, but not all, group members. This mechanism could function by drawing more distant group members, or those moving away from the centroid, toward the caller and the center of the group, similar to the finding that central white-faced capuchins sometimes produce contact calls when other group members have become distant (Gros-Louis et al., 2008). Since events in this cluster were associated with both lesser group spread at the time of call production and lesser group contraction following call production, as compared to the other cluster of events, it is possible that these calls serve a preventative function. Furthermore, as these calls were associated with the initiation of caller movement away from the group centroid, they could potentially function by alerting any inattentive group members to the initiation of group movement. For instance, Trillmich et al. (2014) found that Sifakas (Propithecus verreauxi) frequently produce contact calls prior to leaping, which the authors propose could signal that “displacement is imminent.” We found a similar frequency of counter calling behavior in these bouts compared to those associated with distant initial callers. However, in these bouts, the second caller tended to be more distant from the centroid than the first. For these events, it is possible that two or more callers, and any surrounding group members, could simultaneously move toward one another. Alternatively, since the initial callers in these bouts tended to move away from the centroid following call production, these events could be more prone to resulting in group splits. For instance, Gall and Manser (2017) found that simultaneous playbacks of quiet contact calls from both the front and back of meerkat groups expanded group spread along that axis. Again, in order to test these hypotheses, more data needs to be collected on events in which counter calling occurs.
Overall, regardless of the caller's location, our study provides evidence that loud contact call production can facilitate group contraction, by either reducing centroid velocity away from lagging callers or boosting centroid velocity toward central callers. Our study is one of the first to continuously and simultaneously monitor both the positions and vocalizations of the majority of group members in a free-ranging animal group (For a similar methodological approach see Leighty et al., 2008). This methodology enabled us to detect changes in group movement patterns surrounding the time of call production which may have been missed otherwise. Many studies of loud contact calls have reported subtle responses or a lack of response altogether. For instance, a study of white-faced capuchins reported that, when observing a given group member who was within hearing range of a calling distant individual, 77% of the time it “ignored” the calls (Gros-Louis et al., 2008). Furthermore, a study of chacma baboons found that in 56% of trials involving the acoustic playback of a group member's contact barks, the subject simply briefly oriented toward the speaker (Cheney et al., 1996). These responses have led to the assumption that calls that are not answered vocally may not aid the caller in returning to the group (Digweed et al., 2007). Our study indicates that, in domesticated goats, unanswered calls can have the subtle effect of adjusting the group centroid's movement relative to the caller in ways that could prevent separation or aid reunion. As many social birds and mammals produce loud contact calls when separated from their group and/or specific individuals (Reviewed in Kondo and Watanabe, 2009), applying our methodology to studies of contact calling behavior in these species has significant potential to improve understanding of the mechanisms underlying their role in the facilitation of group contraction.
Given the direct influence of calling on group dynamics in our study, further work would benefit from developing models of collective movement which can estimate the “forces” imposed by calls on individual group members based on their relative positions, velocities, behaviors, and even relationships (Farine et al., 2016). For instance, a study of contact calls produced by captive elephants (Loxodonta africana) coming together after periods of fission found that vocal production by one group member was correlated with the movement of other group members toward the caller, particularly if a given group member tended to spend more time in close proximity to the initial caller and also if that group member produced an antiphonal call in response to the initial call (Leighty et al., 2008). Future models could even account for the sensory abilities of group members (Strandburg-Peshkin et al., 2013) and the role the landscape may play in both influencing movement patterns and interfering with interindividual contact (Strandburg-Peshkin et al., 2017). Applying these analytical techniques to positional, behavioral and communicative data collected from wearable tracking devices like those used in our study will be especially useful for studying the softer class of contact calls which tend to be produced more often, by more individuals and in a greater variety of contexts (Harcourt et al., 1993; Meise et al., 2011; Reber et al., 2013). In addition to these techniques, playback experiments need to be conducted to test inferred causal relationships between contact call production and behavioral changes in group members, ideally while group members are wearing tracking devices.
Finally, by taking advantage of new technological approaches, our findings provide some of the first insight into collective behaviors of animals under ecologically complex conditions (Hughey et al., 2018). Studies indicate that many groups, such as bird flocks and fish schools, can coordinate their behavior by responding to the positions and trajectories of near neighbors (Reynolds, 1987; Couzin and Krause, 2003; Herbert-Read et al., 2011). However, as these studies typically focus on short time scales and/or on individuals that are moving through relatively simple environments (King et al., 2018), it is unclear whether these rules would be effective, or even beneficial, under more ecologically complex conditions, where dense vegetation, wide group spread and/or occupied visual attention may limit the tracking of groupmates. Rather, individuals in some groups may require flexibility in their movements relative to one another. For example, Strandburg-Peshkin et al. (2017) found that when baboons were moving through dense habitats, individual movements were more influenced by vegetation than social factors and levels of group polarization were lower, likely because the habitat constrained individuals' abilities to track others' trajectories. As another example, Ginelli et al. (2015) documented intermittent periods of group expansion and contraction among a flock of sheep in an enclosed pasture and proposed that, by switching between these modes, individuals can enjoy the benefits of both exploration and protection. In this study, sheep on the periphery appeared to trigger a mass group contraction event by running toward the center of the group. While this may be possible when all group members can see one another, it may not be effective otherwise. During contexts in which lines of sight between group members become broken, vocalizations, such as those described in our study, could be used to initiate and facilitate group contraction.
Ethics Statement
This study was carried out in accordance with the recommendations of Rutgers Newark Animal Care and Use Committee'. The protocol was approved by the Rutgers Newark Animal Care and Use Committee. Institutional Animal Care and Use Committee (IACUC) at Rutgers University-Newark.
Author Contributions
LO and AK formulated the hypotheses. LO, AK, and SG developed and built the dataloggers. GC and LO were responsible for the fieldwork. LO performed the data collection. LO and SG processed the data. LO, NA, SN, TD, DR, and SG developed techniques for analyzing the data. LO and NA conducted the analysis. DR and SG provided guidance on the progression of the work and LO wrote the manuscript with feedback from all coauthors.
Funding
This material was supported by the James S. McDonnell Foundation (grant #220020422) and was based on work partially supported by the National Science Foundation under Grant DMS-1638521 to the Statistical and Applied Mathematical Sciences Institute. Any opinions, findings, and conclusions or recommendations expressed in this material are those of the author(s) and do not necessarily reflect the views of the National Science Foundation.
Conflict of Interest Statement
The authors declare that the research was conducted in the absence of any commercial or financial relationships that could be construed as a potential conflict of interest.
Acknowledgments
We thank Isak Ouseb for permission to work with his livestock and the Tsaobis beneficiaries, the Snyman and Wittreich families, Johan Venter, the Gobabeb Research and Training Centre, the Ministry of Environment and Tourism, and the Ministry of Lands and Resettlement, for permission and support to conduct our research at Tsaobis. We are grateful to Levi Arnoldus for assistance with fieldwork, Claudia Martina, Alecia Carter, the 2015 Tsaobis Baboon Project team and Herman Strydom for support in the field, Mark Holton and Abid Haque for the development of our recording device, Julian Kivell, Phil Hopkins, and Gaelle Fehlmann for aid in the design and production of our collars and Nicole Dykstra and undergraduates at NJIT for aiding the processing of our GPS and audio data. This paper is a publication of the ZSL Institute of Zoology's Tsaobis Baboon Project.
Supplementary Material
The Supplementary Material for this article can be found online at: https://www.frontiersin.org/articles/10.3389/fevo.2019.00073/full#supplementary-material
References
Aubin, T., Jouventin, P., and Hildebrand, C. (2000). Penguins use the two-voice system to recognize each other. Proc. R. Soc. B Biol. Sci. 267, 1081–1087. doi: 10.1098/rspb.2000.1112
Boinski, S. (1993). Vocal coordination of troop movement among white-faced capuchin monkeys,Cebus capucinus. Am. J. Primatol. 30, 85–100. doi: 10.1002/ajp.1350300202
Briefer, E., and McElligott, A. G. (2011). Mutual mother-offspring vocal recognition in an ungulate hider species (Capra hircus). Anim. Cogn. 14, 585–598. doi: 10.1007/s10071-011-0396-3
Briefer, E. F., and McElligott, A. (2012). Social effects on vocal ontogeny in an ungulate, the goat, Capra hircus. Anim. Behav. 83, 991–1000. doi: 10.1016/j.anbehav.2012.01.020
Carter, G. G., Skowronski, M. D., Faure, P. A., and Fenton, B. (2008). Antiphonal calling allows individual discrimination in white-winged vampire bats. Anim. Behav. 76, 1343–1355. doi: 10.1016/j.anbehav.2008.04.023
Cheney, D. L., Seyfarth, R. M., and Palombit, R. (1996). The function and mechanisms underlying baboon ‘contact’ barks. Anim. Behav. 52, 507–518.
Couzin, I. D., and Krause, J. (2003). Self organization and collective behavior in vertebrates. Adv. Stud. Behav. 32, 1–75. doi: 10.1016/S0065-3454(03)01001-5
Couzin, I. D., Krause, J., James, R., Ruxton, G. D., and Franks, N. R. (2002). Collective memory and spatial sorting in animal groups. J. Theor. Biol. 218, 1–11. doi: 10.1006/jtbi.2002.3065
Cowlishaw, G., and Davies, J. G. (1997). Flora of the pro-namib desert swakop river catchment, Namibia: community classification and implications for desert vegetation sampling. J. Arid Environ. 36, 271–290. doi: 10.1006/jare.1996.0203
Dehn, M. M. (1990). Vigilance for predators: detection and dilution effects. Behav. Ecol. Sociobiol. 26, 337–342.
Digweed, S. M., Fedigan, L. M., and Rendall, D. (2007). Who cares who calls? selective responses to the lost calls of socially dominant group members in the white-faced capuchin (Cebus capucinus). Am. J. Primatol. 69, 829–835. doi: 10.1002/ajp.20398
Dunbar, R. I. M., Buckland, D., and Millert, D. (1990). Mating strategies of male feral goats: a problem in optimal foraging. Anim. Behav. 40, 653–667. doi: 10.1016/S0003-3472(05)80695-5
Escós, J., Alados, C.L., and Boza, J. (1993). Leadership in a domestic goat herd. Appl. Anim. Behav. Sci. 38, 41–47. doi: 10.1016/0168-1591(93)90040-V
Farine, D. R., Strandburg-Peshkin, A., Berger-Wolf, T., Ziebart, B., Brugere, I., Li, J., et al. (2016). Both nearest neighbours and long-term affiliates predict individual locations during collective movement in wild baboons. Sci. Rep. 6:27704. doi: 10.1038/srep27704
Fehlmann, G., O'Riain, M. J., Hopkins, P. W., O'Sullivan, J., Holton, M. D., Shepard, E. L. C., et al. (2017). Identification of behaviours from accelerometer data in a wild social primate. Anim. Biotelemetry 5:6. doi: 10.1186/s40317-017-0121-3
Fischer, J., Hammerschmidt, K., Cheney, D. L., and Seyfarth, R. M. (2001). Acoustic features of female chacma baboon barks. Ethology 107, 33–54. doi: 10.1046/j.1439-0310.2001.00630.x
Gall, G. E. C., and Manser, M. B. (2017). Group cohesion in foraging meerkats: follow the moving ‘Vocal Hot Spot.’ R. Soc. Open Sci. 4:170004. doi: 10.1098/rsos.170004
Garnier, S. (2016). SwaRm. Available online at: https://github.com/swarm-lab/swaRm
Ginelli, F., Peruani, F., Pillot, M. H., Chaté, H., Theraulaz, G., and Bon, R. (2015). Intermittent collective dynamics emerge from conflicting imperatives in sheep herds. Proc. Natl. Acad. Sci. U.S.A. 112, 1–6. doi: 10.1073/pnas.1503749112
Gros-Louis, J. J., Perry, S. E., Fichtel, C., Wikberg, E., Gilkenson, H., Wofsy, S., et al. (2008). Vocal repertoire of Cebus capucinus: acoustic structure, context, and usage. Int. J. Primatol. 29, 641–670. doi: 10.1007/s10764-008-9263-8
Harcourt, A. H., Stewart, K. J., and Hauser, M. D. (1993). Functions of wild gorilla ‘close’ calls. I. Repertoire, context, and interspecific comparison. Behaviour 124, 89–122.
Herbert-Read, J. E., Perna, A., Mann, R. P., Schaerf, T. M., Sumpter, D. J., and Ward, A. J. (2011). Inferring the rules of interaction of shoaling fish. Proc. Natl. Acad. Sci. U.S.A. 108, 18726–18731. doi: 10.1073/pnas.1109355108
Hughey, L. F., Hein, A. M., Strandburg-Peshkin, A., and Jensen, F. H. (2018). Challenges and solutions for studying collective animal behaviour in the wild. Philos. Trans. R. Soc. B Biol. Sci. 373:20170005. doi: 10.1098/rstb.2017.0005
Hyndman, R. J. (2017). Forecast: Forecasting Functions for Time Series and Linear Models. R package version 8.2. Available online at: http://pkg.robjhyndman.com/forecast
King, A. J., Fehlmann, G., Biro, D., Ward, A. J., and Fürtbauer, I. (2018). Re-wilding collective behaviour: an ecological perspective. Trends Ecol. Evol. 33, 347–357. doi: 10.1016/j.tree.2018.03.004
Kondo, N., and Watanabe, S. (2009). Contact calls: information and social function. Jpn. Psychol. Res. 51, 197–208. doi: 10.1111/j.1468-5884.2009.00399.x
Leighty, K. A., Soltis, J., Wesolek, C. M., and Savage, A. (2008). Rumble vocalizations mediate interpartner distance in African elephants, Loxodonta africana. Anim. Behav. 76, 1601–1608. doi: 10.1016/j.anbehav.2008.06.022
McDougall, P. (2009). The feral goats of kielderhead moor. J. Zool. 176, 215–246. doi: 10.1111/j.1469-7998.1975.tb03194.x
Meise, K., Keller, C., Cowlishaw, G., and Fischer, J. (2011). Sources of acoustic variation: implications for production specificity and call categorization in chacma baboon (Papio ursinus) grunts. J. Acoust. Soc. Am. 129, 1631–1641. doi: 10.1121/1.3531944
Price, E. O, and Thos, J. (1980). Behavioral responses to short-term social isolation in sheep and goats. Appl. Anim. Ethol. 6, 331–339. doi: 10.1016/0304-3762(80)90133-9
R Core Team (2016). R: A Language and Environment for Statistical Computing. Vienna: R Foundation for Statistical Computing.
Reber, S. A., Townsend, S. W., and Manser, M. B. (2013). Social monitoring via close calls in meerkats. Proc. Biol. Sci. 282:20131013. doi: 10.1098/rspb.2013.1013
Rendall, D., Cheney, D. L., and Seyfarth, R. M. (2000). Proximate factors mediating ‘contact’ calls in adult female baboons (Papio Cynocephalus Ursinus) and their infants. J. Comp. Psychol. 114, 36–46. doi: 10.1037//0735-7036.114.1.36
Reynolds, C. W. (1987). Flocks, herds, and schools: a distributed behavioral model. Comput. Graph. 21, 25–34. doi: 10.1145/37402.37406
Ruiz-Miranda, C. R., Szymanski, M. D., and Ingals, J. W. (1993). Physical characteristics of the vocalizations of domestic goat does capra hircus in response to their offspring's cries. Bioacoustics 5, 99–116.
Saunders, F. C, McElligott, A. G., Safi, K., and Hayden, T. J. (2005). Mating tactics of male feral goats (Capra hircus): risks and benefits. Acta Ethol. 8, 103–110. doi: 10.1007/s10211-005-0006-y
Shank, C. C. (1972). Some aspects of social behaviour in a population of feral goats (Capra hircus L.). Z. Tierpsychol. 30, 488–528. doi: 10.1111/j.1439-0310.1972.tb00876.x
Shrader, A. M., Kerley, G. I. H., Kotler, B. P., and Brown, J. S. (2007). Social information, social feeding, and competition in group-living goats (Capra hircus). Behav. Ecol. 18, 103–107. doi: 10.1093/beheco/arl057
Siebert, K., Langbein, J., Schön, P-C., Tuchscherer, A., and Puppe, B. (2011). Degree of social isolation affects behavioural and vocal response patterns in dwarf goats (Capra hircus). Appl. Anim. Behav. Sci. 131, 53–62. doi: 10.1016/j.applanim.2011.01.003
Stewart, J. C., and Scott, J. P. (1947). Lack of correlation between leadership and dominance relationships in a herd of goats. J. Comp. Physiol. Psychol. 40, 255–264. doi: 10.1037/h0060710
Strandburg-Peshkin, A., Farine, D. R., Crofoot, M. C., and Couzin, I. D. (2017). Habitat and social factors shape individual decisions and emergent group structure during baboon collective movement. ELife 6:e19505. doi: 10.7554/eLife.19505
Strandburg-Peshkin, A., Twomey, C. R., Bode, N. W., Kao, A. B., Katz, Y., Ioannou, C. C., et al. (2013). Visual sensory networks and effective information transfer in animal groups. Curr. Biol. 23, R709–R711. doi: 10.1016/j.cub.2013.07.059
Trillmich, J., Fichtel, C., and Kappeler, P. (2014). Coordination of group movements in wild Verreaux 's Sifakas (Propithecus verreauxi). Behaviour 141, 1103–1120. doi: 10.1163/1568539042664579
Keywords: communication, group cohesion, wearable sensing devices, contact call, collective behavior
Citation: O'Bryan LR, Abaid N, Nakayama S, Dey T, King AJ, Cowlishaw G, Rubenstein DI and Garnier S (2019) Contact Calls Facilitate Group Contraction in Free-Ranging Goats (Capra aegagrus hircus). Front. Ecol. Evol. 7:73. doi: 10.3389/fevo.2019.00073
Received: 10 September 2018; Accepted: 26 February 2019;
Published: 19 March 2019.
Edited by:
Claudia Fichtel, Deutsches Primatenzentrum, GermanyReviewed by:
Odile PETIT, Centre National de la Recherche Scientifique (CNRS), FranceLucille Chapuis, University of Exeter, United Kingdom
Copyright © 2019 O'Bryan, Abaid, Nakayama, Dey, King, Cowlishaw, Rubenstein and Garnier. This is an open-access article distributed under the terms of the Creative Commons Attribution License (CC BY). The use, distribution or reproduction in other forums is permitted, provided the original author(s) and the copyright owner(s) are credited and that the original publication in this journal is cited, in accordance with accepted academic practice. No use, distribution or reproduction is permitted which does not comply with these terms.
*Correspondence: Lisa R. O'Bryan, obry0017@gmail.com