Measuring Up to Reality: Null Models and Analysis Simulations to Study Parental Coordination Over Provisioning Offspring
 Malika Ihle
 Joel L. Pick1,3,4
  Shinichi Nakagawa
 Terence Burke
- 1Department of Animal and Plant Sciences, University of Sheffield, Sheffield, United Kingdom
- 2Department of Entomology and Nematology, University of Florida, Gainesville, FL, United States
- 3School of Biological, Earth and Environmental Sciences, University of New South Wales, Sydney, NSW, Australia
- 4Institute of Evolutionary Biology, University of Edinburgh, Edinburgh, United Kingdom
Behavioral coordination when provisioning offspring, through alternation and synchrony, has been hypothesized to influence rearing success. However, studying coordination at the pair level presents two analytical difficulties. First, alternating or synchronous (i.e., simultaneous) feeding can occur randomly and be induced by a shared environment. Therefore, a null model must account for this apparent coordination that occurs by chance. Second, alternation and synchrony in provisioning are intrinsically linked to the rate of provisioning itself, and the effects of coordination and provisioning rate, for instance on fitness, need to be distinguished. In this paper, we explore several randomization procedures and simulation scenarios to tease apart true coordination from random alternation and synchrony, and to find an appropriate statistical model for analyzing coordination. First, to establish a baseline of alternated or synchronous visits expected by chance, we took data from a natural population of house sparrows and randomized inter-feeding intervals in various ways. Alternation and synchrony in the observed dataset were higher than expected by chance under any of our randomizations. However, it was impossible to exclude that alternation and synchrony patterns did not arise due to the pair's shared environment. Second, to identify a way of statistically modeling coordination without generating spurious effects due to intrinsic mathematical relationships between coordination and provisioning rates, we simulated data according to different scenarios. Only one out of five candidate models for analyzing alternation was deemed appropriate, and gave similarly appropriate results for analyzing synchrony. This work highlights the importance and difficulty of finding an adequate null model for studying behavioral coordination and other emergent behaviors. In addition, it demonstrates that analyzing simulated data, prior to analyzing empirical data, enables researchers to avoid spurious effects.
Introduction
In many biological systems, emergent patterns arise when different entities (such as molecules, individuals, groups of individuals, etc.) interact. To qualify a behavior as emergent, one needs to establish that the patterns observed are not merely randomly generated by the combination of two (or more) individuals' behaviors. To evolve via natural selection, this emergent behavior needs to have an effect on fitness that is not explained by the sum of the fitness effects of each individual's behavior. Recently, the possibility of an emergent property arising between provisioning parents, namely their behavioral coordination, has aroused interest among researchers of behavior and evolution (e.g., Mariette and Griffith, 2012, 2015; van Rooij and Griffith, 2013; Johnstone et al., 2014; Ihle et al., 2015; Bebbington and Hatchwell, 2016; Koenig and Walters, 2016; Iserbyt et al., 2017; Khwaja et al., 2017; Savage et al., 2017; Takahashi et al., 2017; Tyson et al., 2017; Leniowski and Wegrzync, 2018). Behavioral coordination in provisioning offspring could consist of synchronous (i.e., simultaneous) feeding or of alternated feeding by two or more carers, and both options have been hypothesized to influence the success of a pair in raising offspring. For instance, synchrony could reduce the conspicuousness of a brood to predators (Mariette and Griffith, 2012; Bebbington and Hatchwell, 2016; Leniowski and Wegrzync, 2018), while alternation could result from a simple form of conditional cooperation, turn-taking, or resolving sexual conflict between parents (Johnstone et al., 2014). Here, we define the number of alternated visits for each pair as the number of times a pair member visits the nest after its partner, and the number of synchronized visits as the number of times an individual visits the nest shortly after its partner (Box 1). Several attempts—predominantly observational—have been made to quantify pair coordination. However, analytical difficulties arise when studying emergent behaviors, which we outline below.
Box 1. Glossary.
Alternation describes the temporal patterns of visits, whereby one parent's visit follows the visit of its partner. Alternation could be due to parental coordination or could be environmentally induced.
Apparent coordination: patterns of alternation or synchrony that resemble true parental coordination but may have arose through other processes, for example due to an environmental effect.
Conditional cooperation: a negotiation strategy initially proposed by Johnstone et al. (2014), in which each parent contributes more when the partner does too. Alternated visits could result from a simple form of conditional cooperation, turn-taking, resembling a tit-for-tat strategy, whereby a parent having provisioned offspring may restraint feeding until its partner has provisioned.
Coordination: alternation and synchrony patterns that result from an emergent behavioral interaction between the parents. In theory, emergent behaviors have been selected for because of their non-additive fitness benefits. Parents could follow rules of conditional cooperation (i.e., turn-taking) and alternate their visits, or could intentionally or adaptively synchronize their visits, to produce patterns of coordination.
Correlation in directional changes: short for correlation in a pair's within-individual directional change in interval length. A simultaneous change in the directional change of partners' provisioning rates can be environmentally induced. For example, both parents in a pair can show a simultaneous decrease followed by a simultaneous increase in provisioning rate, as the result of a shared third stimulus, like a change in weather (see Figure 1). The within-individual directional change can be gradual (temporal autocorrelation), or sudden. The correlation between the partner's directional changes (and between the partners patterns of intervals more generally) will create patterns of alternation.
Randomization: in this article, we use this term exclusively when we shuffle inter-visit intervals (whether they were observed or simulated) to create a null model against which to compare the initial dataset. For this comparison, we refer to the level of alternation measured in the randomization as the expected level of alternation.
Simulation: in this article, we use this term exclusively when we generate data according to specified parameters. This generated data can be random with regard to alternation and synchrony (for instance see dataset (b) in Part 1), or can include specific patterns of alternation (for instance, higher than expected due to correlated patterns of interval lengths (scenario 3 and 4, Part 2), or higher than expected due to an effect of brood size (scenario 5 and 6 in Part 2).
Synchrony describes a temporal pattern of visits whereby parents visit the nest “simultaneously” (within a specific time window, e.g., a 2-min window in this study). Synchrony could be due to parental coordination or be environmentally induced.
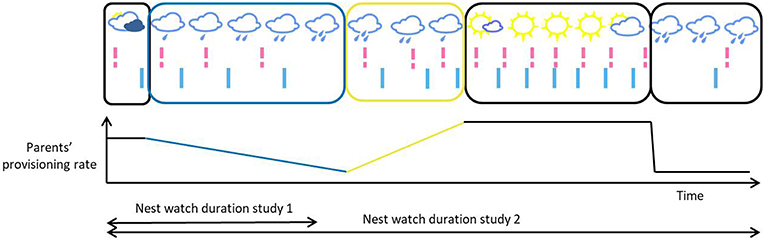
Figure 1. Illustrative timeline of provisioning visits, with each bar representing a visit [female and male visits, in pink (dashed bar) and light blue (solid bar), respectively], and as a function of weather conditions. In this example, both parents have similar provisioning rates at any time, and their provisioning rates fluctuate simultaneously as a function of the environmental conditions. In blue is represented a period of gradual slowdown in provisioning visits, and in yellow a gradual but more sudden increase in the parents' provisioning rates. In these periods, we can see a directional temporal autocorrelation of the interval length within each individual. The correlation between the pair members' change in provisioning rate, which may be due to the environment, creates patterns of alternation. Depending on when the observation of the nest was made and the duration of that observation, the observer may capture a single directional change in the provisioning rates of the parents, or multiple directional changes in opposite directions and of different lengths (blue vs. yellow rectangles and slopes).
First, in order to study coordination at the pair level, one needs to disentangle active coordination between partners from patterns of synchrony and alternation that occur by chance. For example, a pair with similar provisioning rates might be expected, by chance, to alternate their visits to the nest around 50% of the time. However, it is not clear which null model best represents these patterns of apparent coordination that arise by chance. To determine more precisely what would be expected, one could simulate a random distribution of visits to the nest for each carer individually, before pairing them up and calculating the “random” (or expected) level of alternation and synchrony. Simulating visits independently for each partner would not include any pattern of intentional coordination between them. Higher synchrony or alternation than expected by chance would, therefore, suggest that pair members purposely coordinate their behavior. Previous studies of coordination have used different random null models (e.g., Johnstone et al., 2014; Bebbington and Hatchwell, 2016) and it is not clear whether these models are equivalent and predict similar baseline levels of coordination. More generally, it is important to know what factors can and/or should be considered when adopting null models to enable emerging patterns to be distinguished from random ones.
Secondly, it has been demonstrated that patterns of alternation could also emerge from a passive process [see also note on refractory periods in section Simulation of a random dataset (dataset b)]. That is, apparent coordination between the parents could occur unintentionally, independently of conditional cooperation (Schlicht et al., 2016). This might notably happen when both parents are simultaneously influenced by shared environmental conditions. In this case, the shared environment could lead both parents to have more similar intervals at any given time than when looking at each parent's intervals from different periods. When two partners have intervals of similar duration, one partner cannot visit the nest several times before its partner returns—which would reduce alternation. Therefore, this non-independence of both partners' intervals creates more alternation than expected by chance (Schlicht et al., 2016). In the field, we can expect that environmental conditions will affect the speed at which parents provision, and both parents may slow down or speed up their return to the nest. For instance, both partners could reduce their visit rate at the same time due to rain, a predator encounter, or local food depletion, and both progressively resume provisioning afterwards. This simultaneous response to environmental conditions could explain all or part of any detected non-random alternation (Schlicht et al., 2016).
To investigate whether this phenomenon could have confounded their results, Johnstone et al. (2016), and more recently Savage et al. (2017), checked that there was no directional change in individuals' inter-visit intervals over the entire duration of the nest watches. In the first case, nest watches lasted on average 80 min, while, in the second, they ran continuously over several days as visits were recorded automatically with PIT tags. However, simultaneous directional changes in visit rate might have occurred multiple times, in opposite directions, and for various durations, over the course of a nest watch. This would leave no apparent directional change overall (see Figure 1). Therefore, it is not surprising that within-individual directional change over the course of a long nest watch (e.g., continuously increasing or decreasing provisioning speed) was not observed in the studies of Johnstone et al. (2016) and Savage et al. (2017). In addition, and most importantly, it is not the directional change of one pair member (temporal autocorrelation) that creates patterns of alternation: it is the correlation between the pair members' patterns of inter-visit intervals (Schlicht et al., 2016; Santema et al., 2019). We will sometimes refer to this as “correlation in directional changes” (Box 1). In other words, an absence of within-individual temporal autocorrelation over a long time-scale provides no information on whether there was a change over a shorter timescale (e.g., a decrease and increase within one nest watch, for instance following a rain shower) and whether this change was simultaneous (or correlated) between partners. Unfortunately, it would be difficult to identify and measure all the potentially relevant environmental parameters, and all the appropriate time windows of various length, in which to measure simultaneous directional change (or, more generally, correlation in pair members' patterns of inter-visit intervals). Other ways of investigating whether true coordination behavior occurs in nature still need to be explored.
Finally, we need an appropriate measure of coordination to correlate the variation in pair behavioral coordination with a pair's reproductive success. Finding this measure is difficult because alternation, synchrony and total provisioning at the nest (as well as derivatives that appear to control for visit rate, see Part 2) are mathematically dependent. A more precise description and visual representation of the confounding mathematical relationships can be found in Box 2. However, current methods either do not allow for measuring coordination at the pair level, or do not adequately account for these inevitable relationships. In the initial test of the conditional cooperation hypothesis, Johnstone et al. (2014) compared, for the overall population, the rates of transition between two states: returning to the nest after one's own visit vs. after one's partner's. However, this population-level measure does not allow us to correlate the pair's coordination with their reproductive success. Rather than looking at population-level return rates, Bebbington and Hatchwell (2016) analyzed counts of alternated visits, a by-product of having different return rates depending on who visited the nest last. However, the way coordination was modeled did not account for its mathematical relationship with provisioning rate (see Part 2). As provisioning rate itself is expected to predict some variation in the pair's reproductive success (Liebl et al., 2016), if we later want to understand the impact of behavioral coordination on offspring fitness, we need a measure of coordination that is independent of the provisioning rate of the pair, and not simply its by-product.
Box 2. Mathematical relationships between synchrony, alternation and total provisioning.
Alternation occurs when a pair member visits the nest after its partner, rather than after itself. This means that the maximum number of alternated visits (Amax) that could be observed for a pair, given the observed male's and female's number of visits (Pm and Pf, respectively), is constrained by the smallest of each of the partner's number of visits, as well as bounded by the total number of visits (PT) observed at the nest. More precisely, if Pm ≠ Pf, Amax = PT - |Pm-Pf|, and if Pm = Pf (i.e., when both provision are at the same rate), Amax = PT - |Pm-Pf| - 1 (Figure 2). Furthermore, a visit is considered synchronous when an individual visits the nest only a short period of time after its partner, that is, when parents alternate their visits to the nest in quick succession (whether they provision at high or low rates). Therefore, the maximum number of synchronized visits that can be observed (Smax) is bounded by the number of alternated visits (A) that were actually observed (Figure 2). In addition, the likelihood of an individual visiting the nest shortly after its partner (i.e., to visit synchronously) necessarily increases when the provisioning rate of the partner increases (since the time between visits is shorter), further linking synchrony to the total number of visits observed. To summarize, within a nest watch, the number of synchronous visits (S) is necessarily correlated with the total number of visits and the number of alternated visits, while the number of alternated visits is itself necessarily correlated with the total number of visits and negatively correlated with the difference in number of visits made by both partners (Figure 2).
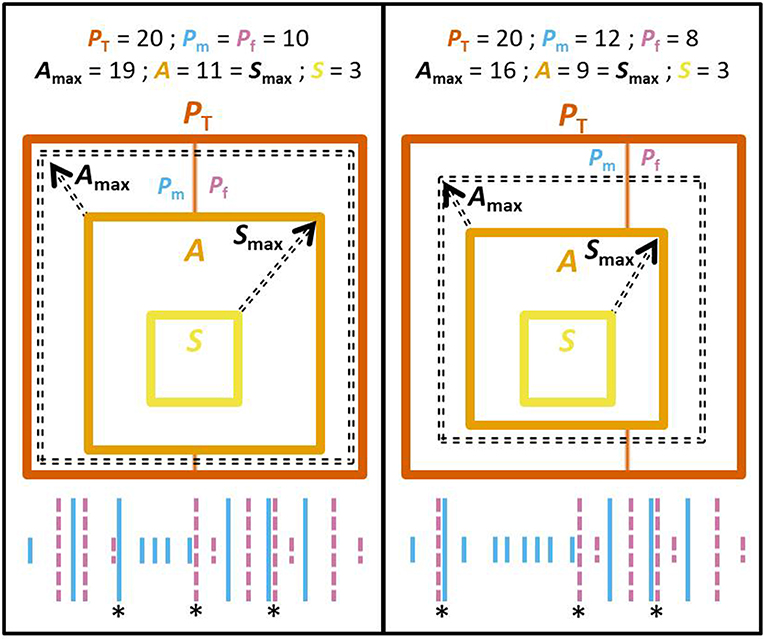
Figure 2. (Center) Scheme illustrating the constraints on the range of values that the different mathematically related variables can take. Specifically, it represents the mathematical relationships between the total number of provisioning visits within a nest watch (PT, area within dark orange squares) and the difference between male's and female's number of visits (Pm and Pf, respectively; dividing the area of PT in 2 parts), with the number of alternated visits (A, orange square) and synchronous visits (S, yellow square). Square areas are proportionate to the number of visits (total, alternated, or synchronized). The number of alternated and synchronized visits can vary between 0 and the limit is indicated by broken arrows (broken square for Amax, and observed alternation A for Smax, respectively). (Bottom) Illustrative timeline of provisioning visits, with each bar representing a visit [female and male visits, in pink (dashed bar) and light blue (solid bar), respectively]. Longer bars represent alternated visits. Asterisks highlight synchronous visits. (Left) When Pm = Pf: A is bounded by PT - 1. (Right) When Pm > Pf: A is bounded by PT - |Pm - Pf|. In both cases, S is bounded by A.
In the first part of this study, we investigate whether active coordination can be distinguished from patterns of alternation and synchrony that arise by chance. We demonstrate how incorporating increasing numbers of factors when building up a random null model can lead to very different baselines of apparent coordination that only arise by chance. Additionally, we explore how the shared environment can passively increase apparent pair coordination by simultaneously influencing provisioning rate in both parents. For this, we slightly changed the order of naturally observed inter-feeding intervals, to maintain some of the potentially pre-existing episodes of correlated directional change in the intervals' lengths (see Figure 1). As a case study, we used a large dataset on provisioning behavior, gathered over 12 years on 580 individuals of a wild population of the socially monogamous house sparrow (Passer domesticus). Second, we used simulations to identify a way to statistically model coordination that, in contrast to previous analyses, has an acceptable Type I error rate for the effects of interest (i.e., no more than 5% of false-positive results). We applied this method to our case study dataset to investigate which house sparrow pair characteristics influence the amount of alternation and synchrony achieved when provisioning offspring. Such an approach, consisting of generating and analyzing simulated data prior to analyzing real data, could be used in many studies where statistical modeling is not trivial, for instance where mathematical relationships are expected between response and predictor variables. These methods could equally apply to other sequential behavior shared between two or more individuals, such as incubation or vigilance behavior.
Part 1: Observed vs. Expected Coordination
In this section, we create various datasets against which to compare our observed dataset. First, we used simulation and randomisations to create a baseline level of coordination, i.e., random null models. Second, we (indirectly) manipulated, in our observed data, the level of correlation in the pair members' patterns of visits (referred to as “correlation in directional changes” below, see Box 1) to explore how a shared environment could affect apparent coordination. Finally, we contrast the level of coordination observed in our study case dataset, to the level of coordination reached in all the derived datasets, and speculate on the distinction between true coordination between the parents and patterns of alternation that occur passively due to their shared environment (see Box 1).
Observed Dataset (Dataset a)
The dataset used for our case study (dataset a) was collected on a closed, wild house sparrow population breeding on Lundy Island, UK (51°10′N, 4°40′W). We selected 1,599 video recordings ~90 min in length (median 90, range 4–122.6, see Supplementary Text 1 for justification not to exclude videos based on duration) taken between 2004 and 2015 of parents provisioning at nest boxes. On average, 1.8 videos (median 2, range 1–3) were taken per brood, featuring 299 different social mothers and 281 different social fathers. The recorded males and females formed 473 different pairs, and each parent was observed over a mean of 4.7 broods (median 4, range 1–20). Each parent visited their nest ~10.8 times per hour (median 10, range 1–51). The number of alternated and synchronized visits were calculated for each nest watch, with synchrony defined as the occurrence of an alternated visit within a 2-min interval, as in Bebbington and Hatchwell (2016). This time window, although arbitrary, is also both greater than the median duration spent in the nest during a visit (median = 0.3 min, range = 0–47.7 min), allowing the first bird time to feed prior to leaving the nest and be followed by its partner, and below the median duration of individual inter-visit intervals (median = 3.3 min, range: 0–74.1 min). Because the most appropriate time window is unknown, other time windows (1.5 and 2.5) were also explored, leading to qualitatively similar results (see Supplementary Text 1). Pairs performed a mean of 12 alternated visits per hour (median 11.5, range 0.6–38.7) and 7 synchronized visits per hour (median 5.6, range 0–34.5). Further field protocols and data selection procedures can be found in Supplementary Text 1. Data handling, selection, randomization, and simulation were performed in R version i386 3.5.1 (R Core Team, 2017) and all codes are available in a permanent repository (https://doi.org/10.5281/zenodo.2635443).
Simulation of a Random Dataset (Dataset b)
In order to simulate nest visit data, we assumed that the stochastic nature of the timing of an individual's nest visits is well-described by a Poisson process (see Pick et al., 2019). This assumes that, within an observation, an individual visits their nest at a certain rate, but due to the many stochastic factors that affect the exact length of each visit (e.g., interactions with other birds, finding food, etc.), the length of the inter-visit intervals within an observation follows an exponential distribution (i.e., the bird's probability of arrival is constant over time and shorter intervals are more likely than longer ones). This assumes that there is no refractory period. Although this may seem unlikely, a (near) exponential distribution of visits has been found in many species including ours (see Pick et al., 2019 and Supplementary Figure 1) and the same assumption has also been made in related work (Johnstone et al., 2014). Refractory periods (or non-constant return rates) can, in addition to the non-independence of intervals, creates more alternation than expected by chance (Schlicht et al., 2016). Therefore, assuming no refractory period in this random null model may underestimate the level of coordination expected by chance.
To simulate data following a Poisson process, we used the observed mean (μO) and standard deviation (σO) of provisioning rate from our study case dataset. We estimated these parameters on the expected (or latent) scale (i.e., without stochastic Poisson distributed error; μe = μo and ). Then, we sampled expected provisioning rates from a lognormal distribution with these parameters and added Poisson distributed error to the resulting rates to generate counts of nest visits. To simulate nest visit times within the simulated observation period, we drew the corresponding number of samples from a uniform distribution (i.e., where every arrival time is equally likely) bounded by 0 and 90 (the most frequent duration of our observations). This means that, as intended, the arrivals were stochastically spread through the observation period with exponentially distributed intervals (see Supplementary Figure 2 for a graphical description of all the steps described here). This procedure was conducted independently for two birds in each simulated nest watch, thereby generating a random set of provisioning visits and a random pattern of coordination between partners (Figure 3B). We generated 1,599 such nest watches in total, to match the number of observed nest watches. The distribution of simulated inter-feeding intervals matches the distribution of naturally observed intervals well (e.g., ranges, medians, and shapes of distribution, see Supplementary Figure 1).
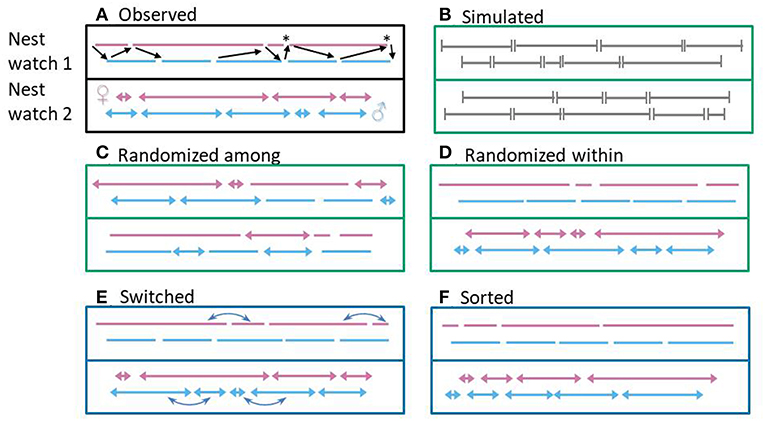
Figure 3. Illustrative timeline of inter-feeding intervals for six datasets, with each line (nest watch 1) or arrow (nest watch 2) representing an interval (female and male visits in pink and light blue, respectively). Random datasets (randomized or simulated) are in green boxes, and those can be used as baseline expectation to compare the observed coordination. Datasets used to explore whether and how a shared environment can passively induce alternation are represented in blue boxes. In the first nest watch of the first dataset (A), black arrows represent the transition from one partner to another, i.e., alternated visits. Note that one visit can be involved in zero, one, or two such transitions. Asterisks highlight synchronized visits. Five datasets are derived from the observed dataset (A): (B) intervals (in gray) were simulated according to the observed parameters (population mean and standard deviation of provisioning rate) to create patterns that do not contain any active coordination or environmentally induced alternation, and only contain alternation and synchrony occurring by chance, (C) observed intervals were randomized among individuals of the same sex and same provisioning rate, to break down active coordination and environmentally induced alternation, while maintaining the properties of observed intervals (e.g., potential refractory periods) (D) observed intervals were randomized within individual within nest watch to break down active coordination but maintain the interdependencies of intervals produced in a same overall environment (e.g., properties relative to the regularity of visits of a specific individuals), but probably does not include any finer-scale environmentally induced alternation, (E) consecutive observed intervals were switched in one randomly picked pair member (blue arrows) with the intent to break down some active coordination and maintain some environmentally induced alternation, and (F) observed intervals were sorted by length within each individual within nest watch to visualize the maximum possible alternation that could have been induced by a simultaneous directional change in interval length (given a set of intervals), which could be produced by the influence of a shared environment.
Randomization of Observed Inter-feeding Intervals (Datasets c and d)
Another way of generating random distributions of feeds is to randomize observed inter-feeding intervals in order to break down any potential pattern of active coordination between pair members. Importantly, randomizing observed inter-feeding intervals, as opposed to simulating fictional intervals, maintains the known and unknown biological properties (including refractory periods) of the original intervals as part of the null model. Moreover, the provisioning rate of an individual during a specific time window will constrain the range of inter-feeding intervals that can occur. For this reason, to simulate another random distribution of feeds over time, we randomized all naturally observed inter-feeding intervals from house sparrows with the same provisioning rate (calculated in number of visits per hour) and the same sex (procedure comparable to (Bebbington and Hatchwell, 2016), see Supplementary Text 1). We will call this an “among nest-watches” randomization (Figure 3C).
Additionally, one could consider the non-independence of different naturally observed nest watches because they feature, for example, a similar male, female, pair, or nest location. Moreover, at equal provisioning rate, an individual could be consistently very regular or very irregular (intrinsically, or due to its environment), which could influence the ease with which its partner can coordinate visits, as well as influencing the level of coordination occurring by chance. To take these dependencies into account, we randomized inter-feeding intervals from each observed bird, within each observed nest watch, as was done on a study on great tits (Johnstone et al., 2014). We will refer to this procedure as the randomization “within individual within nest watch” (Figure 3D).
Each randomization procedure was iterated 100 times for each of the 1,599 nest watches and coordination medians were calculated across the 100 iterations for each specific nest watch. We used medians rather than means of coordination values because Poisson models need integers as the dependent variable (medians and means were highly correlated, N = 1,599, r > 0.99, p < 0.001).
Exploration on the Non-independence of Consecutive Inter-visit Intervals (Datasets e and f)
Finally, within the time-frame of a single nest watch, consecutive inter-feeding intervals can share additional dependencies, and be more similar to each other than inter-visit intervals further apart—a phenomenon known as temporal autocorrelation. As mentioned in the Introduction, the non-independence of both parents' inter-visit intervals in any given period, such as a simultaneous directional change in the duration of the inter-feeding intervals of both partners (which could be induced by environmental conditions and change direction for variable duration several times within a nest watch, see Figure 1) will create patterns of alternation (Schlicht et al., 2016). To demonstrate this principle, Schlicht et al. (2016) included an extra parameter in a within-individual randomization procedure, such that intervals would get more or less strongly sorted by duration, for each partner separately, and over the entire duration of a nest watch. They found that the frequency of alternated visits in such “sorted” randomization can reach levels of alternation similar to those observed in great tits, even with a relatively weak sorting parameter (Schlicht et al., 2016, based on Johnstone et al., 2014 Data). Choosing the entire duration of the nest watch for a directional change, while probably not realistic, is a useful proof of principle. It is important to remind ourselves that correlated directional changes in visit rates between partners are difficult to measure, since they would not occur in a fixed time-scale. Instead, individuals are likely to co-vary in their behavior due to stochastic events that vary in the duration and direction of their effects (see Figure 1). Using our case study dataset, we manipulated the level of temporal autocorrelation within individuals to explore how changing the level of correlation between each partner's directional change affects the expected number of alternated visits.
First, we switched consecutive intervals in one randomly picked partner (while keeping visits of the other pair member unchanged, Figure 3E). This should maintain some of the temporal autocorrelation (and correlation between partners' directional changes thereof) potentially present in the observed data, and therefore maintain some of the alternation due to this process. At the same time, this should break down some of the pattern of alternation actively expressed by the individuals (true coordination). These predictions are made under the assumption that the time-frames of the environmental influence (bouts of directional changes, see Figure 1) are wider than the time-frame at which pair members react to their partners following conditional cooperation rules (presumably almost after each visit).
Second, we fully sorted the intervals of both partners over the entire course of the nest watch and recalculated the maximum alternation that could have been reached with this process (Figure 3F).
Case Study: Observed vs. Expected Coordination
The mean of coordination (counts of alternated and synchronous visits separately) across each dataset (observed, simulated, randomized among, randomized within, switched and sorted) were compared using a generalized linear mixed effects model with a Poisson error distribution and log link function. The types of dataset were modeled as fixed effects, the nest watch identity as a random effect, and the observed number of coordinated visits was the reference (intercept). A post-hoc Tukey contrasts test was used to compare the coordination means of all types of dataset, using the function ghlt from the package multicomp (Hothorn et al., 2008). All analyses were performed in R version i386 3.5.1 (R Core Team, 2017).
Results
Pairs of wild house sparrows alternated and synchronized their visits to the nest more than expected by chance, as estimated from both types of randomization and from a randomly simulated dataset (all p < 0.0001, Figure 4 and Supplementary Figure 3, respectively, black vs. green). The number of alternated visits obtained when switching consecutive intervals was significantly greater than when intervals were fully randomized within the individual within nest watch (Figure 4 dataset e vs. Figure 4 dataset d). This difference is likely to represent environmentally induced alternation. Indeed, randomizing intervals across the whole nest watch (Figure 3D), as opposed to switching consecutive intervals (Figure 4 dataset e), would have led to a greater disruption of any simultaneous directional change. In other words, a more complete randomization should maintain less environmentally induced alternation, assuming the time-scale of environmental influence is larger than the time-scale for conditional cooperation (see above). Sorting the intervals from each individual within each nest watch according to their lengths created high levels of alternation, confirming the demonstration of Schlicht et al. (2016) (Figure 4 dataset f). The dataset where observed intervals were sorted (Figure 4 dataset f) and the dataset where the observed intervals were randomized within nest watches (Figure 4 dataset d) are datasets that contain, respectively, the highest and the lowest amounts of alternation due to a correlation in directional changes, given a set of intervals. Alternation observed (Figure 4 dataset a) falls between those two extremes. In addition, alternation in the dataset with switched intervals (Figure 4 dataset e) was significantly lower than the alternation observed (Figure 4 dataset a), which, if we assume the time-scale of the environmental influence to be wider than the time-frame at which cooperation takes place, would mean that there was more active coordination between the observed pair members than expected by chance.
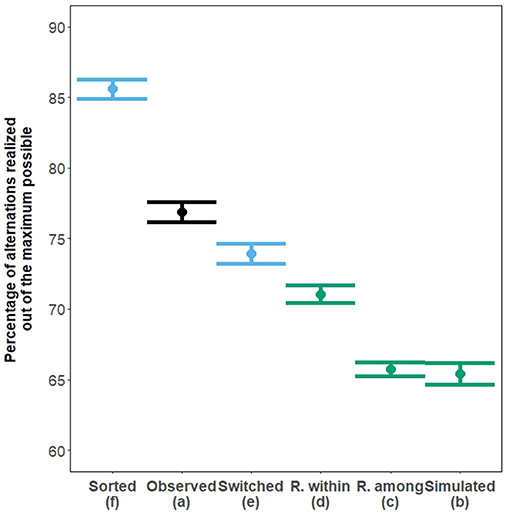
Figure 4. Mean percentage of alternated visits (±95% CI) out of the theoretical maximum (calculated according to both partners' provisioning rates—see Box 2). Random data (randomized or simulated) are in green, and those can be used as a baseline expectation to compare with the observed alternation [(a), black]. The exploration of the process under which shared environmental influences affect partners' patterns of visits, and increases in the levels of alternation is represented in blue. All plotted pairs of means are significantly different (Tukey contrast post-hoc test, all p < 0.0001) except for between the simulated dataset and the randomization among nest watches (p = 0.34).
Conclusions
More complete randomisations (i.e., a greater disruption of the shared environmental influence and of any simultaneous directional change), led to stronger reductions in the level of alternation. If we assume that the time-scale of environmental influence is larger than the time-scale where parental coordination takes place, this suggests that environmentally induced correlation in directional change may play a role in this observed dataset. Nevertheless, the observed number of alternated visits in this dataset is significantly higher than in the most conservative randomization (i.e., within individual randomization, Figure 4 dataset a vs. Figure 4 dataset d). Although we cannot assert that this difference is due to parental coordination, demonstrating that observed alternation is higher than random alternation is a prerequisite for any study analyzing the effects of alternation and synchrony on fitness. To summarize, the processes leading to environmentally induced patterns of alternation could explain part (or all) of the observed alternation.
Part 2: Analyzing Coordination
In this section, the aim is to model coordination to test whether alternation and synchrony are predicted by the pair or the brood characteristics (such as pair bond duration, pair provisioning effort, brood size, nestling age, etc).
Problematically, coordination in provisioning and total provisioning at the nest are mathematically dependent (see Box 2). In a first attempt at addressing this issue, Bebbington and Hatchwell (2016) modeled coordination scores equal to the number of alternated visits (or synchronous visits, respectively) divided by the total number of visits minus one. However, modeling coordination with this ratio poses problems. (1) If any explanatory variable is correlated with the total provisioning rate (such as brood size), then it would appear to be negatively correlated with this score (or a positive effect could be masked). This is because, if provisioning rate is the denominator, as provisioning rate and brood size increase then the coordination score will decrease, leading to a negative correlation between brood size and coordination. (2) Since alternation and synchrony are counts of visits, it would be best to keep them untransformed and model their Poisson distributed error in order not to underestimate effect sizes (Pick et al., 2019).
Here, we use simulations to identify a way to statistically model coordination that, in contrast to previous analyses (see e.g., model ii below), has an acceptable Type I error rate (i.e., no more than 5% of false-positive results) for effects of interest. More precisely, we first consider a set of candidate statistical models with which to model coordination. Then, we simulate scenarios where total provisioning rate is simulated to be correlated to brood size (as observed in our dataset) and where coordination observed is either similar to or higher than what would be expected by chance, for either one of two reasons: (1) due to a simulated impact of the influence of the environment on both pair members, or (2) a simulated effect of brood size on coordination. Next, we analyze the simulated data with each of the candidate models in each of the simulated scenarios and analyse the type I error rate for each of their factors. We reject models which led to a significant effect of brood size on alternation when this effect was not simulated. Finally, we analyze our observed dataset with the model that was found to be most appropriate according to the simulations of analyses.
Candidate Models
We considered five models to analyze alternation and then used the best performing model to analyze synchrony. These models represented a combination of models that had already been used to analyze coordination, and new models to address the fact that a certain degree of coordination occurs by chance in any given dataset (Figure 4) and that there are mathematical links between coordination, total provisioning and difference in provisioning between partners (Figure 2). To this end, the latter models (model iii, iv, and v) focus on modeling the deviation from randomness by using the within-nest randomization procedure outlined above (see section “Randomization of observed inter-feeding intervals”). This was the most conservative randomization as it included most of the intervals' interdependencies.
In the first model (i), we analyze alternation as an absolute count (assuming a Poisson error distribution—exact models described in more detail below). This represents a completely uncorrected model. In model ii, we model alternation as the ratio of number of alternated visits to total number of visits (as in Bebbington and Hatchwell, 2016). In model iii, we analyze coordination directly as a deviation from random, calculated as the difference in number of alternated visits between observed and randomized data within each nest watch (a value used to model fitness in Bebbington and Hatchwell, 2016). In model iv, the deviation from random in coordination was modeled indirectly by including both observed and randomized data as counts (with a Poisson error distribution), and an interaction between the type of data (observed vs. randomized) and all the predictors. In this model, the intercept and main effects represent the model estimates for the randomized data, and the interaction terms (e.g., between Type and Brood Size, latter referred to as Type:BS) represent the contrast between the estimates for randomized and observed, in other words the deviation from random. The interaction terms are therefore equivalent to the respective main effects in models ii and iii. Finally, in model v, we sought to account for the total possible alternation given the visit rates of the two birds. More precisely, we calculated Amax following the equation given in Box 2, and modeled alternation as a proportion of the maximum number of alternated visits that pairs could have achieved in a binomial model (number of alternated visits A, vs. the number of missed alternated visits, Amax-A). As in model iv, we included both observed and randomized data, and the interaction between predictors and the type of data (observed vs. randomized).
Simulation Procedures for Determining How to Statistically Model Coordination
To explore which of these models would be most appropriate for analyzing variation in coordination, we simulated data and analyzed them with the models outlined above. We implemented six different scenarios to demonstrate the mathematical relationships that arise between coordination in provisioning and provisioning rate itself (Box 2), and between coordination and a variable correlated with provisioning rate. Here, we used brood size, which is typically correlated with provisioning rate in observed datasets, and which has been shown to affect coordination in wild zebra finches (Mariette and Griffith, 2015). All simulations were repeated 1,000 times and the rates of false-positive results reported as the criteria for assessment of the appropriateness of the models.
Simulated Scenarios
To simulate data, we built upon the procedure presented above [“Simulation of a random dataset (dataset b)”]. For all six scenarios, provisioning rates were randomly generated according to the population parameters and following a Poisson process, and in half of the scenarios (scenarios 2, 4, 6, Table 1), we simulated provisioning rates to be correlated with brood size. Nest visits were then generated randomly within observations of 90 min, and subsequently sorted according to scenario (see below).
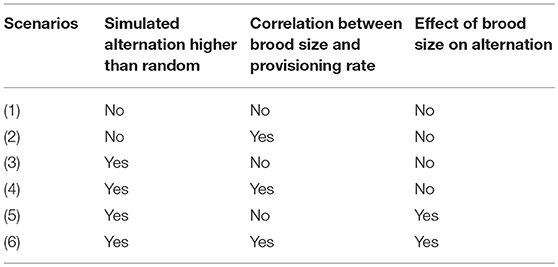
Table 1. Summary of the effects simulated in each of the six scenarios that were built to define which statistical models would be most appropriate for analyzing variation in coordination.
In scenarios 1 and 2, the randomly generated inter-visit intervals were left unsorted (Table 1, first row Figure 5). In scenarios 3 and 4, we simulated a higher alternation than expected by chance by fully sorting the intervals for both partners, mimicking the phenomenon leading to environmentally induced alternation described in Schlicht et al. (2016) (Table 1, second row Figure 5). Fully sorting the intervals of both individuals may represent a fairly extreme scenario, but it does not induce the maximum possible alternation (Figure 4 dataset f). This was done to create a statistical difference between observed and random levels of alternation. In scenarios 5 and 6, we simulated an additional effect of brood size on alternation. In the field, both parents could pick up cues on the brood size and adjust their provisioning patterns to their brood's needs, potentially increasing cooperation with higher offspring demand (Mariette and Griffith, 2015). Here, we created an effect of brood size on alternation by having the intervals of one randomly picked pair member fully sorted, and partially sorting the inter-feeding intervals from the other partner more or less strongly according to brood size (Table 1, third row Figure 5). To do this, we simulated an auxiliary variable that was correlated to the order of intervals with a correlation coefficient equal to the sorting parameter. The sorting parameter varied with brood size so that it was 0 for nests with 1 nestling, 0.5 for nests with 4 nestlings, and 1 for nests with 7 nestlings (the maximum number of nestlings we ever observed). Then we reordered the intervals according to the auxiliary variable. These simulation steps are not meant to represent a biological mechanism but are designed to induce alternation that is correlated with brood size, i.e., a statistical effect of brood size on alternation.
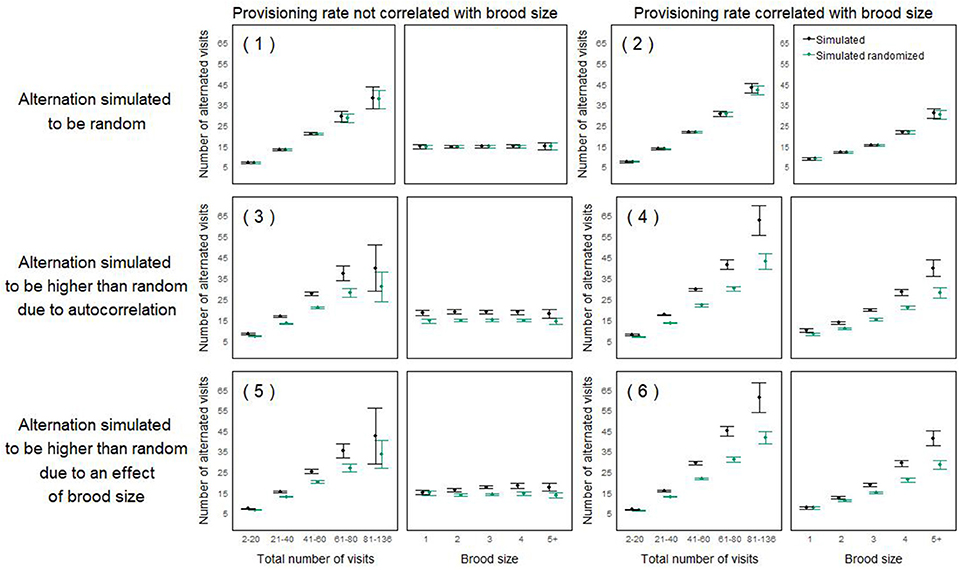
Figure 5. Mean number of alternated visits in simulated nest watches (±95% CI) as a function of the total number of visits (left panels) and brood size (right panels). For each scenario (half rows, with number referring to the scenarios described in Table 1), we plotted the alternation of one representative simulated dataset of 1,599 nest watches (chosen randomly among 10 simulations which all appeared to be qualitatively similar; in black), as well as the alternation obtained after randomizing that simulated dataset (according to the within-individual randomization procedure; in green), which can be used as a baseline expectation. For all three scenarios on the left hand-side, the provisioning rate was not simulated to be correlated with brood size. For all three scenarios on the right-hand side, the provisioning rate was simulated to be correlated with brood size. For scenario 1 and 2 (top row) alternation was simulated to be random, for scenario 3 and 4 (middle row), alternation was simulated to be higher than expected by chance due to correlation in directional changes, for scenario 5 and 6 (bottom row), alternation was simulated to be higher than expected by chance due to an effect of brood size. An appropriate analysis should only detect an effect of brood size on alternation in scenario 6, where it was specifically simulated. The total numbers of visits were categorized in increments of 20; simulated nest watches with more than 100 visits (between 6 and 20 cases) were pulled into the last category (“81–136”). Nest watches with more than 5 nestlings (n = 4) were pulled into the category “5+” nestlings.
Figure 5 illustrates these scenarios and some of the spurious effects that could emerge when modeling alternation. In scenarios 2, 4, and 6, where brood size is correlated with the total provisioning rate, itself correlated with alternation (Box 2), alternation seems to increase with brood size (Figure 5, right hand-side panel). Such an effect should only be detected in scenarios 5 and 6, where it is specifically simulated (Table 1, Figure 5, bottom row). In scenarios 3–6, where observed alternation is simulated to be higher than random, an effect of total provisioning on the level of alternation seems to appear, even though it was not specifically simulated (Figure 5, bottom two rows).
Model Parameterization
We modeled alternation in these simulated scenarios with the five models presented above. Model i was run as a generalized linear mixed model (GLMM) with a Poisson error distribution and an observation level random effect to account for over-dispersion. Models ii and iii were run as linear models (LM) with a Gaussian error distribution. Models iv and v were run as GLMMs with Poisson and Binomial error distributions, respectively, and with nest watch ID as a random effect. Predictors for all models were the total number of visits, the difference in number of visits between the partners (which was used in the model of Bebbington and Hatchwell (2016) and that we included for exploration purposes), and brood size (all as continuous variables). All model structures are summarized in Table 2. Similarly, we modeled synchrony following the structure of model iv, the best performing model for alternation. All simulations were coded in R version 3.5.1 (R Core Team, 2017). GLMMs were performed with the lme4 package (Bates et al., 2015) using the bobyqa optimizer and, in all models, all non-categorical predictors were z-transformed so that their mean would be centered on zero and their standard deviation equal to 1.
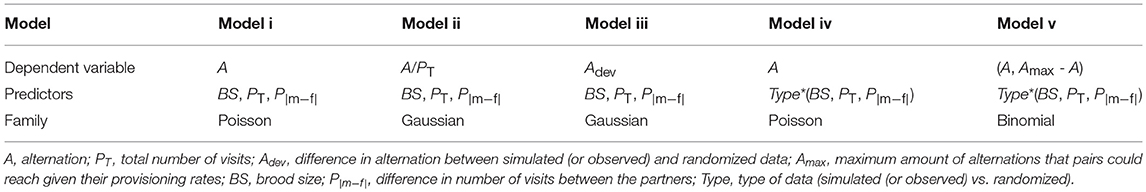
Table 2. Model structure for the 5 candidate models to analyze alternation.
Rates of False Positive Results
To assess whether a model is appropriate, one can verify that it does not produce more than 5% of significant results for a variable that was not simulated to have an effect. Therefore, for each parameter in each model, we calculated the percentage of significant results out of all the simulation iterations where all statistical models converged (range: 797–992 out of 1,000 simulations per scenario). For all non-simulated (false) positive effects that were close to the accepted threshold of false positive (i.e., from 5 to 10% for a threshold of 5%), we tested whether the number of significant results was higher than random using a binomial exact test (given a significance threshold of 0.05). On average, given the number of iterations and this threshold, false positive rates of 5.8% (range: 5.2%−6.3%) in our models were not different compared to random. Table 3 shows the percentage of significant results for factors of all models and scenarios.
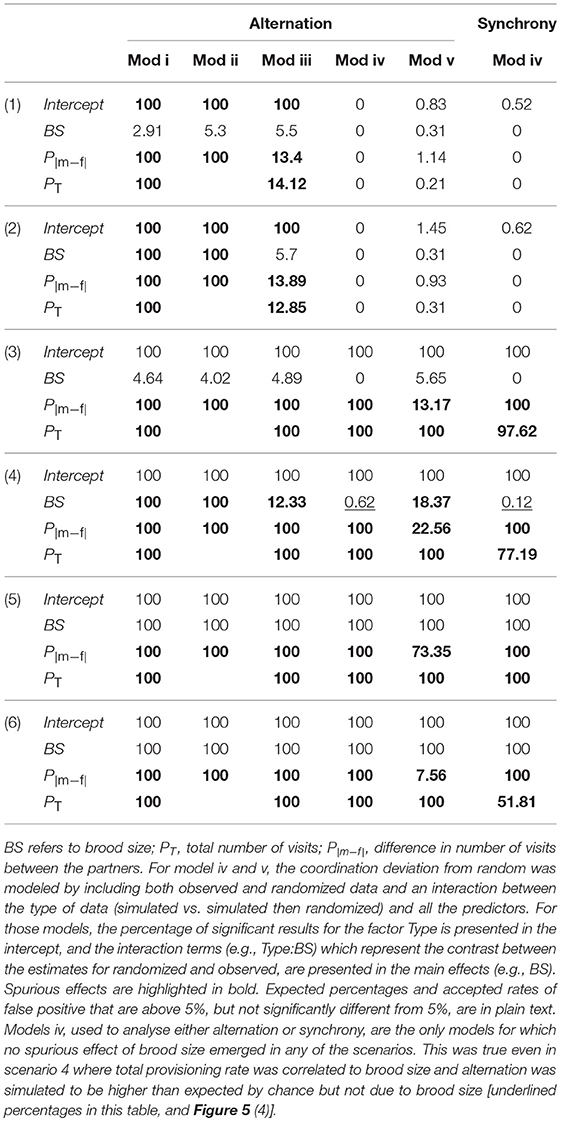
Table 3. Percentage of significant results out of 1,000 simulations, for all factors of each of the 5 candidate models (models i to v) for analyzing alternation and model iv for analyzing synchrony, provided for each of the six simulated scenarios (numbers in brackets, see Table 1).
Brood size
In scenarios 3–6, observed coordination was simulated to be higher than expected by chance; this effect can be seen for models iv and v when the percentage of significant effects for the type of data (Type, shown in the intercept, see Table 3 legend) is 100% (Table 3). In scenarios 2, 4, and 6, provisioning rates were generated such that they would correlate with brood size, but only in scenarios 6 was coordination simulated to be higher than expected by chance due to an effect of brood size. In scenario 2 and 4, spurious effects of brood size on coordination deviation occurred in models i, ii, iii, and v. For these models, outputs indicated a significant effect of brood size on alternation in more than the accepted rate of false positive results for these simulations (scenarios 2 and 4, highlighted in bold in Table 3). These models had higher Type I errors (significant result when no real effect exists), than our threshold. Therefore, these models were rejected. Model iv (Poisson model using the aforementioned interaction) detected the simulated effect of brood size on alternation or synchrony (scenarios 5 and 6), but did not lead to spurious effects, even when total provisioning was simulated to be correlated with brood size [scenarios 2 and 4 Table 3, Figure 5 (4)].
Total provisioning and difference in partners' provisioning rates
In all models, the total number of visits (PT) and the difference in visits between the partners (P|m−f|) always led to false positive results (Table 3). For models i to iii, PT and P|m−f| were always significant, while for models iv and v, Type:P|m−f| and Type:PT were significant as soon as there was more alternation than expected by chance (scenario 3 to 6, Table 3). We conclude that none of the models were helpful in testing whether there was an additional effect of provisioning rate on alternation, as their inevitable relationship would systematically appear (see also Figure 5 left panels, scenarios 3 to 6 to visualize those artifacts inherent to the data).
Conclusion
Overall, model iv was deemed the most appropriate model with which to analyse our case study data when investigating the relationship between coordinated pattern of visits and the pair and brood characteristics (such as pair bond duration, nestling age, brood size, etc), as it did not lead to a spurious effect of brood size. We believe that this model would be the most appropriate for other analyses of alternation, synchrony, and other such emergent behaviors. However, we still advise using similar simulations to test this with different data structures to confirm that the model does not lead to spurious effects.
Case Study: Predictors of Coordination
We modeled house sparrow pair coordination (alternation and synchrony separately) with the structure of model iv. More precisely, we modeled the coordination in naturally observed or randomized nest watches with the type of data [observed or randomized within individual within nest watch, having the expected level of coordination as the reference (intercept)], and all the predictors in interaction with the type of data, in a model with Poisson distributed error. Predictors were, in addition to those included in the simulation, the average of both parents' ages as a measure of their experience (in this population, pairs assortatively mate by age; the correlation between male and female age across N = 1,599 nest watches (with pairs being represented multiple times) is r = 0.34, p < 0.0001); the number of broods a pair has already reared together (successfully or unsuccessfully) as a measure of their familiarity to each other (which is correlated with the mean age of the pair across N = 1,599 nest watches, r = 0.65, p = 0.0001, but our mixed effect models separated both effects adequately); the number of days after the first of April of that year and the time, relative to sunrise, at which the video recording was taken, to control for major variation in the environment; whether or not a male had nested in this nest box prior to the recorded breeding attempt, as a measure of its (and usually the pair's) familiarity with its environment; nestling age as a categorical variable (nestlings are routinely recorded at 6 and 10 days old; recordings deviating from that were pooled according to whether they were inferior, superior or equal to 9, see Supplementary Figure 4), along with the number of nestlings on the day of recording (brood size), as a measure of parental workload. Random effects were the brood ID, the social mother, social father and social pair IDs, the breeding year, the combination of the pair ID and the breeding year, the nest watch ID, and an observation-level ID to account for over-dispersion.
Results
Predictors of interest
None of the predictors had a significant effect on the deviation in coordination [by looking at the factors in interaction with the type of data (observed or randomized)]. This included the parents' experience and familiarity with each other, the familiarity with their environment, and all the predictors relative to the parental workload or the environment itself. The models confirmed that the type of data itself (factor Type) was significant (p < 10−10 and p < 10−5 in the models of alternation and synchrony, respectively) with the observed alternation and synchrony being more frequent than expected (as shown in Figure 4 and in Supplementary Figure 3).
Total provisioning and difference in partners' provisioning rates
In our simulations, as soon as we generated more alternation than expected by chance, we obtained a positive effect of provisioning rate (PT) and negative effect of the difference in provisioning rate between the partners (P|m−f|) on alternation (see Table 3, Figure 5, and Supplementary Table 1). When modeling alternation in the observed dataset, those effects were 6 times smaller and non-significant, although in the same direction. However, the simulated alternation deviation (e.g., in scenarios 3 and 4, where we sorted intervals in both partners) was higher than the deviation that was observed in the study case dataset, and, therefore, the size of observed and simulated estimates cannot be directly compared. To know how the effect of PT and P|m−f| are expected to change with the degree of alternation, one would need to simulate variation in the extent to which alternation is greater than random. Simulating variation in alternation deviation was beyond the scope of this study, and therefore, we currently cannot interpret the effects of PT and P|m−f| in our model.
Full model outputs are presented in (Supplementary Text 2).
Discussion
In the first part of this study, we investigated whether parental coordination can be distinguished from patterns of alternation and synchrony that arise by chance. We built several null models, either based on a simulation or on randomizations (Figure 3), and explored how the shared environment between partners could passively increase apparent pair coordination by simultaneously influencing provisioning patterns in both parents (Figures 1, 3, Box 1). Using our study case dataset, we found that the observed level of parental coordination was higher than expected under our most conservative randomization, however we concluded that we could not assign this difference to either parental coordination or the influence of the parents' shared environment (Figure 4, Supplementary Figure 3). Indeed, both members of a pair could, for instance, show a correlated gradual temporal change in the lengths of their inter-feeding intervals, matching a gradual change in environmental conditions, and leading to a pattern of apparent coordination of their visits to the nest, all of this being completely independent of any conditional cooperation (Figure 1). We confirmed with our simulations that this phenomenon could take place as described by Schlicht et al. (2016). We explored whether trying to increase or maintain parts of the correlation in the provisioning patterns of the partners had an impact on the level of alternation (Figures 3E,F), and our results are consistent with the idea that this phenomenon could be responsible for all or part of the coordination patterns we observed (see Figure 4, and below).
In the second part of this study, we aimed to model coordination and test whether alternation and synchrony were predicted by the pair or the brood characteristics (such as pair bond duration, pair provisioning effort, brood size, nestling age, etc). Given that coordination in provisioning and provisioning itself are mathematically related (Box 2) and that provisioning rate is also often correlated with other variables, such as brood size (like in our study case dataset), we researched how to analyse coordination without inducing spurious effects between, in this case, coordination and brood size (Figure 5). We considered a set of candidate models (Table 2) and simulated several scenarios (Table 1) to identify which statistical model would give an acceptable Type I error rate (i.e., no more than 5% of false-positive results) for our effect of interest. Model iv was deemed the most appropriate model with which to analyse our case study data when investigating the relationship between coordinated pattern of visits and the pair and brood characteristics, as it did not lead to a spurious effect of brood size in any of the 6 scenarios (Table 3). We believe that this model would be the most appropriate for other analyses of alternation, synchrony, and other such emergent behaviors. However, we still advise using similar simulations to test this with different data structures to confirm that the model does not lead to spurious effects. In our study case dataset, we did not find that any of the brood characteristics or pair characteristics were predicting variation in parental coordination (Supplementary Text 2).
Different authors have used different approaches to test whether behavioral coordination between the two parents provisioning their offspring happened more frequently than expected by chance (e.g., Johnstone et al., 2014; Bebbington and Hatchwell, 2016; Khwaja et al., 2017). Our work (Part 1) highlights the importance of carefully considering what the most appropriate null model is when studying behavioral coordination or any other complex behavior. Specifically, we clarified the mechanisms that give rise to apparent coordination, and different steps for taking them in to account when building a null model.
In addition, we presented an approach for statistical modeling (Part 2) that will prove evermore useful for addressing many questions in behavioral ecology (e.g., Class et al., 2017). While already well-established in other fields, this approach is still emerging in the field of evolutionary ecology (e.g., Allegue et al., 2017). First, we simulated data. Here, we did so according to parameters taken from an observed dataset, but a whole parameter range could be explored when no such a priori information exist. We then analyzed the simulated data with several candidate models. Finally, we analyzed real data with the model found to be most appropriate according to the simulation outcomes and rates of false-positive results. Given the complexity of the final model, conceiving this prior to the simulations would have been unlikely. In fact, not only does the simulation approach allow us to exclude analysis plans that would lead to spurious effects, it also allows us to design appropriate analysis plans prior to seeing the results from observed data. Simulations are therefore an ideal tool to plan statistical analyses, as encouraged by advocates of reliable science (Parker et al., 2016; Forstmeier et al., 2017; Ihle et al., 2017; Open Science Collaboration, 2017).
In this study, we assumed that the time window during which a possible simultaneous influence of the environment on the pair provisioning rate should realistically be relatively larger than the time-scale at which conditional cooperation would occur. Based on this assumption, we draw some speculative conclusions in Part 1. We found that maintaining some of this temporal pattern (by switching consecutive intervals) would lead to more alternated visits than a complete randomization among intervals within individuals and within nest watch (Figure 4 dataset e vs. Figure 4 dataset d); a difference which we attributed to apparent coordination, based on our assumption on the difference in time-frame for the two phenomena. However, this may not be the case, which would entirely prevent from teasing those two phenomena apart. First, gradual simultaneous directional changes in inter-feeding intervals, which were assumed in this study to mostly come from a gradual environmental influence, are also compatible with the conditional cooperation hypothesis (individuals gradually increasing or decreasing their provisioning rate along with their partners). For instance, one could imagine cycles where turn-taking pair members stimulate each other to increase their provisioning rates, until one exhaust itself resulting in both reducing their visit rates. The patterns of visits generated by such a pair in a stable and profitable environment would be virtually indistinguishable from the patterns induced by a more variable and stochastic environment. On the opposite side of the spectrum, perhaps more perplexingly, “instantaneous” conditional cooperation and environmental influences could also both exist and create patterns of alternation. As mentioned in introduction, it is the non-independence between the provisioning patterns of both partners that creates more alternation than expected by chance. This non-independence could take the form of a correlated gradual directional change as described previously, but alternatively, partners could both have constant regular intervals, or, to the contrary, partners could both frequently change their length of intervals in the same direction and do so simultaneously. For instance, on the one hand, individuals could react to their erratic partners after each visit, leading to a correlation in inter-visit interval length between partners at each point in time without creating patterns of temporal autocorrelation (that is, one interval would not resemble the next, but only resemble the interval of the partner at that time). This would be the most extreme case of conditional cooperation, which would require a very precise monitoring of the partner. On the other hand, environmental change at a very fine scale could lead to a similar correlation between partners within a very short time-frame (Santema et al., 2019). For instance, rapidly changing environmental conditions (such as the presence of a predator) could influence both partners to have a long interval, and then both partners again to have a short interval. This would leave no temporal autocorrelation within individuals, but maintain a strong correlation between both partners' patterns of visits. To conclude, without making any assumptions, we cannot associate gradual temporal change, erratic changes, or even regular visits, to either conditional cooperation or environmental influence.
Overall, even by taking into account all considerations presented in this study, it is currently impossible to exclude the possibility that the emergent patterns are due to a passive process that does not involve parental coordination. Teasing apart one phenomenon from another will be extremely challenging. Using correlational studies, it would require measuring all relevant environmental parameters, or having exceptional datasets where multiple nests from the same environment are observed simultaneously (for instance with the use of PIT tags) to help detect the signature of an environmental impact. Such dataset could provide an idea of whether general patterns of environmentally induced patterns of alternation occur. Such between nest effect would, of course, be weakened the more environmental variables are shared within pairs but not between pairs, for instance because they occur on a small geographic scale (e.g., presence of a predator). Alternatively, logistically challenging experiments would be needed, where one individual is manipulated to return faster to the nest (e.g., by selectively playing back begging calls or providing food) and the return rate of its partner examined (Santema et al., 2017) or where one parent's provisioning rate is kept hidden from its partner whose subsequent behavior is then analyzed (Iserbyt et al., 2015). More experimental work with ingenious designs are require to test the conditional cooperation hypothesis and whether pair coordination is an adaptive emergent behavior.
Finally, it is crucial that further studies explore the fitness consequences of pair coordination, in addition to showing that any alternation or synchrony is higher than expected by chance and/or that variation in coordination is predicted by pair or brood characteristics. This would provide a stronger basis for considering the adaptive significance of behavioral coordination. Thus far, the fitness consequences of behavioral coordination have been assessed in only a few instances (Raihani et al., 2010; Mariette and Griffith, 2012, 2015; van Rooij and Griffith, 2013; Bebbington and Hatchwell, 2016; Iserbyt et al., 2017). If we disregard cases where alternation has not been adequately disentangled from its intrinsic link with provisioning rate, little evidence remains in the literature that suggest fitness benefits of parental coordination. The evidence that does remain consist almost exclusively of a reduction of predation risk with increased synchrony (Raihani et al., 2010; Bebbington and Hatchwell, 2016; Leniowski and Wegrzync, 2018), which may be the sole realistic effect of parental coordination.
Conclusion
This work illustrates the need to identify the best null model to interpret counts of behaviors, especially in the case an emergent behavior arising from the collaboration of several individuals. In addition, it highlights the benefits of simulating data and simulating statistical modeling prior to the analyses of real data. Simulations can be used to avoid being misled by spurious effects generated by mathematical relationships. Such approaches could be incorporated into the planning of complex analyses, and could be included in a preregistration proposal, thereby improving the reliability of science (Open Science Collaboration, 2017).
Ethics Statement
This study was carried out in accordance with the Natural England licenses.
Author Contributions
MI conceived the study with input from JP, IW, and TB. SN and TB provided the raw data. MI and JP did the analyses. MI drafted and revised the manuscript with input from all co-authors.
Funding
MI was funded by a grant from the Natural Environment Research Council (NERC, J024597/1) awarded to TB. JP was funded by a Swiss National Science Foundation Early Mobility grant (P2ZHP3 164962). IW was funded by a grant from the Volkswagen Foundation awarded to Julia Schroeder.
Conflict of Interest Statement
The authors declare that the research was conducted in the absence of any commercial or financial relationships that could be construed as a potential conflict of interest.
Acknowledgments
We thank Emmi Schlicht for discussions at the conception of the study and revision of the manuscript, Andrew Jones and Wolfgang Forstmeier for discussions at the conception of the study; Ian Cleasby, Yu-Hsun Hsu, Andrew Jones and many master students for help with analyzing the videos; Aaron Sibma and Alfredo Sanchez-Tojar for help with standardizing the data. Finally, we are grateful to four reviewers for helping improving the clarity of our explanations.
Supplementary Material
The Supplementary Material for this article can be found online at: https://www.frontiersin.org/articles/10.3389/fevo.2019.00142/full#supplementary-material
References
Allegue, H., Araya-Ajoy, Y. G., Dingemanse, N. J., Dochtermann, N. A., Garamszegi, L. Z., Nakagawa, S., et al. (2017). Statistical Quantification of Individual Differences (SQuID): an educational and statistical tool for understanding multilevel phenotypic data in linear mixed models. Methods Ecol. Evol. 8, 257–267. doi: 10.1111/2041-210x.12659
Bates, D., Maechler, M., Bolker, B., and Walker, S. (2015). Fitting linear mixed-effects models using lme4. J. Stat. Softw. 67, 1–48. doi: 10.18637/jss.v067.i01
Bebbington, K., and Hatchwell, B. J. (2016). Coordinated parental provisioning is related to feeding rate and reproductive success in a songbird. Behav. Ecol. 27, 652–659. doi: 10.1093/beheco/arv198
Class, B., Dingemanse, N. J., Araya-Ajoy, Y. G., and Brommer, J. E. (2017). A statistical methodology for estimating assortative mating for phenotypic traits that are labile or measured with error. Methods Ecol. Evol. 8, 1910–1919. doi: 10.1111/2041-210x.12837
Forstmeier, W., Wagenmakers, E.-J., and Parker, T. H. (2017). Detecting and avoiding likely false-positive findings – a practical guide. Biol. Rev. 92, 1941–1968. doi: 10.1111/brv.12315
Hothorn, T., Bretz, F., and Westfall, P. (2008). Simultaneous inference in general parametric models. Biometr. J. 50, 346–363. doi: 10.1002/bimj.200810425
Ihle, M., Kempenaers, B., and Forstmeier, W. (2015). Fitness benefits of mate choice for compatibility in a socially monogamous species. PLoS Biol. 13:e1002248. doi: 10.1371/journal.pbio.1002248
Ihle, M., Winney, I. S., Krystalli, A., and Croucher, M. (2017). Striving for transparent and credible research: practical guidelines for behavioral ecologists. Behav. Ecol. 28, 348–354. doi: 10.1093/beheco/arx003
Iserbyt, A., Farrell, S., Eens, M., and Müller, W. (2015). Sex-specific negotiation rules in a costly conflict over parental care. Anim. Behav. 100, 52–58. doi: 10.1016/j.anbehav.2014.11.014
Iserbyt, A., Fresneau, N., Kortenhoff, T., Eens, M., and Müller, W. (2017). Decreasing parental task specialization promotes conditional cooperation. Sci. Rep. 7:6565. doi: 10.1038/s41598-017-06667-1
Johnstone, R. A., Manica, A., Fayet, A. L., Stoddard, M. C., Rodriguez-Gironés, M. A., and Hinde, C. A. (2014). Reciprocity and conditional cooperation between great tit parents. Behav. Ecol. 25, 216–222. doi: 10.1093/beheco/art109
Johnstone, R. A., Manica, A., Fayet, A. L., Stoddard, M. C., Rodriguez-Gironés, M. A., and Hinde, C. A. (2016). Evidence for conditional cooperation: a response to Schlicht et al. Behav. Ecol. 27, e6–e7. doi: 10.1093/beheco/arw051
Khwaja, N., Hatchwell, B. J., Freckleton, R. P., and Green, J. P. (2017). Sex allocation patterns across cooperatively breeding birds do not support predictions of the repayment hypothesis. Am. Nat. 190, 547–556. doi: 10.1086/693532
Koenig, W. D., and Walters, E. L. (2016). Provisioning patterns in the cooperatively breeding acorn woodpecker: does feeding behaviour serve as a signal? Anim. Behav. 119, 125–134. doi: 10.1016/j.anbehav.2016.06.002
Leniowski, K., and Wegrzync, E. (2018). Synchronisation of parental behaviours reduces the risk of nest predation in a socially monogamous passerine bird. Sci. Rep. 8:7385. doi: 10.1038/s41598-018-25746-5
Liebl, A. L., Browning, L. E., and Russell, A. F. (2016). Manipulating carer number versus brood size: complementary but not equivalent ways of quantifying carer effects on offspring. Behav. Ecol. 27, 1247–1254. doi: 10.1093/beheco/arw038
Mariette, M. M., and Griffith, S. C. (2012). Nest visit synchrony is high and correlates with reproductive success in the wild zebra finch Taeniopygia guttata. J. Avian Biol. 43, 131–140. doi: 10.1111/j.1600-048X.2012.05555.x
Mariette, M. M., and Griffith, S. C. (2015). The adaptive significance of provisioning and foraging coordination between breeding partners. Am. Nat. 185, 270–280. doi: 10.1086/679441
Open Science Collaboration (2017). “Maximizing the reproducibility of your research,” in Psychological Science Under Scrutiny: Recent Challenges and Proposed Solutions, eds S. O. Lilienfeld and I. D. Waldman (New York, NY: Wiley), 1–21.
Parker, T. H., Forstmeier, W., Koricheva, J., Fidler, F., Hadfield, J. D., Chee, Y. E., et al. (2016). Transparency in ecology and evolution: real problems, real solutions. Trends Ecol. Evol. 31, 711–719. doi: 10.1016/j.tree.2016.07.002
Pick, J. L., Khwaja, N., Spence, M. A., Ihle, M., and Nakagawa, S. (2019). Counter culture: causes, extent and solutions of systematic bias in the analysis of behavioural counts. EcoEvoRxiv. doi: 10.32942/osf.io/jq9n6
R Core Team (2017). R: A Language and Environment for Statistical Computing. Vienna: R Foundation for Statistical Computing. Available online at: https://www.R-project.org/
Raihani, N. J., Nelson-Flower, M. J., Moyes, K., Browning, L. E., and Ridley, A. R. (2010). Synchronous provisioning increases brood survival in cooperatively breeding pied babblers. J. Anim. Ecol. 79, 44–52. doi: 10.1111/j.1365-2656.2009.01606.x
Santema, P., Schlicht, E., and Kempenaers, B. (2019). Testing the conditional cooperation model: what can we learn from parents taking turns when feeding offspring? Front. Ecol. Evol. 7:94. doi: 10.3389/fevo.2019.00094
Santema, P., Schlicht, E., Schlicht, L., and Kempenaers, B. (2017). Blue tits do not return faster to the nest in response to either short- or long-term begging playbacks. Anim. Behav. 123, 117–127. doi: 10.1016/j.anbehav.2016.10.016
Savage, J. L., Browning, L. E., Manica, A., Russell, A. F., and Johnstone, R. A. (2017). Turn-taking in cooperative offspring care: by-product of individual provisioning behavior or active response rule? Behav. Ecol. Sociobiol. 71:162. doi: 10.1007/s00265-017-2391-4
Schlicht, E., Santema, P., Schlicht, R., and Kempenaers, B. (2016). Evidence for conditional cooperation in biparental care systems? A comment on Johnstone et al. Behav. Ecol. 27, e2–e5. doi: 10.1093/beheco/arw036
Takahashi, L. S., Storey, A. E., Wilhelm, S. I., and Walsh, C. J. (2017). Turn-taking ceremonies in a colonial seabird: does behavioral variation signal individual condition? Auk. 134, 530–541. doi: 10.1642/auk-17-26.1
Tyson, C., Kirk, H., Fayet, A., Van Loon, E. E., Shoji, A., Dean, B., et al. (2017). Coordinated provisioning in a dual-foraging pelagic seabird. Anim. Behav. 132, 73–79. doi: 10.1016/j.anbehav.2017.07.022
Keywords: provisioning, coordination, alternation, synchrony, null model, simulation, house sparrow, emergent property
Citation: Ihle M, Pick JL, Winney IS, Nakagawa S and Burke T (2019) Measuring Up to Reality: Null Models and Analysis Simulations to Study Parental Coordination Over Provisioning Offspring. Front. Ecol. Evol. 7:142. doi: 10.3389/fevo.2019.00142
Received: 02 February 2019; Accepted: 11 April 2019;
Published: 03 May 2019.
Edited by:
James Luke Savage, University of Cambridge, United KingdomReviewed by:
Peter Santema, Max Planck Institute of Ornithology, GermanyDavide Baldan, Netherlands Institute of Ecology (NIOO-KNAW), Netherlands
Copyright © 2019 Ihle, Pick, Winney, Nakagawa and Burke. This is an open-access article distributed under the terms of the Creative Commons Attribution License (CC BY). The use, distribution or reproduction in other forums is permitted, provided the original author(s) and the copyright owner(s) are credited and that the original publication in this journal is cited, in accordance with accepted academic practice. No use, distribution or reproduction is permitted which does not comply with these terms.
*Correspondence: Malika Ihle, malika_ihle@hotmail.fr