Synergistic Effects of Climate and Land-Cover Change on Long-Term Bird Population Trends of the Western USA: A Test of Modeled Predictions
 Matthew G. Betts
 Javier Gutiérrez Illán
 Zhiqiang Yang1,3
  Chris D. Thomas
- 1Forest Biodiversity Research Network, Department of Forest Ecosystems and Society, Oregon State University, Corvallis, OR, United States
- 2Department of Entomology, Washington State University, Pullman, WA, United States
- 3USDA Forest Service, RMRS Research Station, Odgen, UT, United States
- 4Department of Biology, University of York, York, United Kingdom
Climate and land-use change are predicted to lead to widespread changes in population dynamics, but quantitative predictions on the relative effects of these stressors have not yet been examined empirically. We analyzed historical abundance data of 110 terrestrial bird species sampled from 1983 to 2010 along 406 Breeding Bird Survey (BBS) across the western USA. Using boosted-regression trees, we modeled bird abundance at the beginning of this interval as a function of (1) climate variables, (2) Landsat-derived landcover data, (3) the additive and interactive effects of climate and land-cover variables. We evaluated the capacity of each model set to predict observed 27-year bird population trends. On average, 45 species significantly declined over the period observed and only 8 increased (mean trend = −0.84%/year). Climate change alone significantly predicted observed abundance trends for 44/108 species (mean 0.37 ± 0.09 [SD]), land-cover changes alone predicted trends for 47/108 species (mean r = 0.36 ± 0.09), and the synergistic effects predicted 59/108 species (mean r = 0.37 ± 0.11). However, for 37 of these species, including information on land-cover change increased prediction success over climate data alone. Across stressors, species with trends that were predicted accurately were more likely to be in decline across the western USA. For instance, species with high correlations between predicted and observed abundances (>r = 0.6) were declining at rates that were on average >2%/year. We provide the first empirical evidence that abundance models based on land cover and climate have the capacity to predict the species most likely to be at risk from climate and land-use change. However, for many species there were substantial discrepancies between modeled and observed trends. Nevertheless, our results highlight that climate change is already influencing bird populations of the western U.S. and that such effects often operate synergistically with land-cover change to affect population declines.
Introduction
Destruction of habitats through direct human exploitation is the greatest contemporary cause of terrestrial biodiversity declines (Newbold et al., 2015). Land-use is considered to be one of the most important drivers of biodiversity, affecting patterns of species diversity (Jetz et al., 2007), distributions (Wilcove et al., 1998; Opdam and Wascher, 2004; Tingley and Beissinger, 2013; Regos et al., 2018), and ecological processes (Dickinson et al., 1991; Dale, 1997; Allan, 2004). However, the influence of recent climate change is also exerting a clear influence on species' populations and biodiversity (Parmesan, 2006; Both et al., 2009; Gutiérrez Illán et al., 2014) and these effects are expected to intensify over the coming decades (Thomas et al., 2004).
Until recently, the effects of these two anthropogenic stressors have been considered in isolation, but there are strong theoretical reasons to expect that they can interact synergistically to drive biodiversity declines (Travis, 2003; Opdam and Wascher, 2004). First, populations that are already in decline due to habitat loss may be less likely to behaviorally adapt to climate change; lower recruitment reduces the number of natal dispersers, and therefore the potential for prospecting and colonization of newly available habitat at the range edge (Holt and Keitt, 2000). Second, fragmentation of native habitats can directly reduce functional connectivity of landscapes (Taylor et al., 1993), thereby preventing the potential for metapopulation persistence (Hanski and Parmesan, 1999) and range shifting (Mair et al., 2014). Third, loss or degradation of certain habitat types (e.g., forest) can cause regional rainfall reductions, thereby intensifying negative climate effects (Lawrence and Vandecar, 2015).
Unfortunately, the relative roles of climate and land-use in affecting species distributions and population trends over relatively short time periods (< 50 years) is not well-known (Mantyka-Pringle et al., 2012). It has been hypothesized that climate influences distributions at broad scales and over the long-term, whereas the influence of land-use is shorter term and at finer spatial scales (Lemoine et al., 2007; Soberón, 2007). However, this hypothesis has been difficult to test. Previous efforts to understand the cumulative effects of climate and land-cover changes on biodiversity have typically relied on a niche modeling approach whereby current or past species distributions are statistically linked to climate (Peterson et al., 2002a), land-cover (Lawler et al., 2014), or both (Jetz et al., 2007; Ponce-Reyes et al., 2013; Sohl, 2014). These associations are then projected forward under various climate change and land-use scenarios to provide estimates of species vulnerability. Changes in climate and land-cover are implicitly assumed to cause change in species ranges (Jantz et al., 2015), with potential impacts on natural system functioning and ecosystem services (Botkin et al., 2007).
Several hurdles have limited empirical testing of these projections. First, available past, current and projected land-cover data are typically available only in coarse-resolution human-defined categories (e.g., forest, agriculture, urban). These categorical data may have little bearing on how individual species are distributed across landscapes and often predict occurrence poorly (Shirley et al., 2013; Betts et al., 2014). Further, vegetation data must be at sufficiently fine resolutions to match the spatial scales experienced by species (Wiens, 1989), but such data are rarely available at broad spatial scales associated with species' ranges and climate data.
Second, and most importantly, climate and land-cover tend to be highly correlated over short time periods and broad spatial scales; precipitation and temperature are well-known to influence vegetation type and cover, which makes it challenging to attribute the cause of species distributions to either climate or land-cover change (Pearson and Dawson, 2003). Darwin (1859) foreshadowed this problem over 150 years ago: “… When we travel from south to north, or from a damp region to a dry, we invariably see some species gradually getting rarer and rarer, and finally disappearing; and the change of climate being conspicuous, we are tempted to attribute the whole effect to its direct action. But this is a very false view …”.
Accelerated rates of both climate (Karl et al., 2015) and land-use change (Hansen et al., 2013) offer the potential to test the independent roles of each of these factors in affecting population trends. Though climate and land-cover are usually highly correlated, this is not necessarily the case for changes in these potential stressors; areas with the most habitat loss (e.g., tropical forest; Hansen et al., 2013) have not necessarily experienced the greatest accelerations in climate change (Chen et al., 2011; Mantyka-Pringle et al., 2012). Temporal autocorrelation in both climate and land cover are likely to result in overly optimistic estimates of the role of these variables in driving species abundance and distributions. Locations in the landscape that have relatively high abundance in time t are likely to still have high abundance in time t2. For example, predicting long-lived tree species abundance distributions as a function of climate variables and then testing these predictions on data 75 years later should result in a high degree of concordance between predicted and observed distributions (Dobrowski et al., 2011). Predicting population trajectories as a function environmental change is substantially more challenging (Ehrlen and Morris, 2015) because current population sizes provide no information about the direction of future change (i.e., both large and small populations may increase or decrease). Thus, if a model is successful at predicting population change, it is more likely to reflect the drivers of species' abundance distributions.
Here, we capitalize on this decoupling between climate and land-cover changes to build models that predict the abundance of 101 bird species over 27 years (1983–2010) in the western United States as a function of climate, land-cover and their combined effects. We then provide, to our knowledge, the first empirical test of the degree to which predicted changes in species abundances, as a function of land cover and climate, reflect observed trends. Predicting animal numbers, rather than distributions, is of critical importance because it is abundance, rather than occupancy, that is the greater determinant of extinction risk (Ehrlen and Morris, 2015). Specifically, we asked: (1) Do land-cover, climate or their combined effects best predict bird population trends over time? (2) Are there spatial “hotspots” where declines or increases are more common across species? (3) Are life history and/or ecological traits associated with sensitivity to climate vs. land-cover change? (4) Which species attributes are associated with high vs. low-performing models?
Materials and Methods
Study System
Our study system comprises the entire western Pacific portion of the United States including California, Oregon and Washington. Our study area covers latitudes from 32°41'N to 60°00'N (~3,000 km south to north) that is sufficiently large to include the entire latitudinal (breeding) distribution of the majority of the species considered (Figure 1). The region is characterized by complex topography ranging from below sea level to 4394 m.a.s.l. and a gradient from oceanic to continental climates. Climate is sufficiently diverse as to include broad land cover types ranging from evergreen rainforest to desert. Temperature in the warmest month (July) range from 17.9 to 44.3°C and wettest month (December) precipitation ranges from 11 to 490 mm.
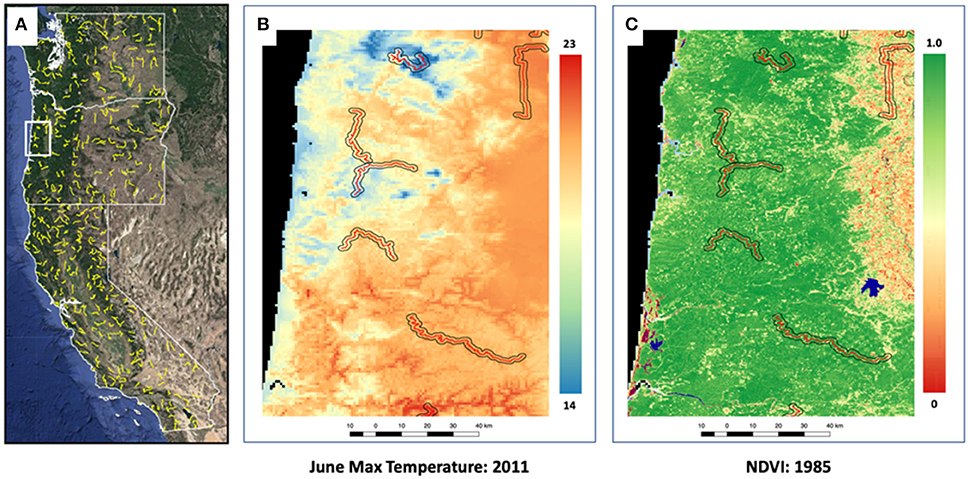
Figure 1. Study area map showing Breeding Bird Survey (BBS) routes across Washington, Oregon and California (A), along with finer-scale maps showing one climate variable (June maximum temperature) (B) and one land-cover variable (normalized difference vegetation index [NDVI]) (C).
Bird Data
Terrestrial bird species' population data were derived from count data collected as part of the USGS Breeding Bird Survey (BBS, www.pwrc.usgs.gov/bbs, Sauer et al., 2011, 2017). These data have been used widely in studies of bird distributions (Robbins et al., 1986, 1989; Peterson, 2003; Gutiérrez Illán et al., 2014). The BBS survey system consists of 39.4 km linear routes that are located on secondary roads throughout the continental United States and Canada. BBS data has been collected every May or June (breeding season) since 1966 by trained surveyors that recorded every species observed during 3 min counts at 50 point locations spaced at 0.8 km intervals along the route. The survey begins soon after sunrise and surveyors record birds that are seen or heard within 400 m from each point, summing counts over all 50 points in a given year (Bystrak, 1981). BBS data provide an index of population abundance at the scale of an individual route that can be used to estimate trends in relative abundance at various geographic scales. We selected bird species that were present in more than 10% of sampling sites in the study system during the selected time periods (to avoid extremely rare species), excluding species whose distributions mainly occur outside the study region and those for which the region may not contain environmental limits, respectively. Aquatic and coastal bird species were also excluded because we did not expect the terrestrial-based BBS routes to sample breeding populations of these species effectively. In total, 108 species satisfied the criteria for analyses.
We used BBS data from 1983 (the origin of satellite-derived land cover data for the region) to 2010. To reduce sampling variation in abundance caused by observer and weather effects, we considered two 5-year windows representing an early (1983–86) and a later period (2006–10). To avoid possible “false zeroes” in species counts, we only included routes that were sampled in all years during each period (1980–84 and 2006–2010). Abundance was the average number counted on a route over the 5-year period. A similar approach has been adopted in previous studies on species distributions that use BBS data (Hitch and Leberg, 2007; Phillips et al., 2010; Gutiérrez Illán et al., 2014). Finally, we also excluded from analyses those routes that were so close to the ocean that their centroids were located in the water, which would bias estimates of terrestrial climate. This initial screening resulted in a dataset of 338 routes (Figure 1).
Climate and Land Cover Data
We obtained historical climate data generated by the Parameter Regression of Independent Slope Model (PRISM) (Oregon Climate Service, Corvallis, Oregon, USA) for the continental United States (Daly et al., 2000, 2002). This dataset was created using point meteorological station data, digital elevation models, and other spatial data sets to generate interpolated gridded estimates of monthly, yearly, and event-based climatic parameters, such as precipitation, temperature, and dew point. We used maps at a spatial resolution of 2.5-arcmin (~3 km cell size at this latitude) (Daly et al., 2002).
We selected a set of seven climatic variables previously reported to be associated with bird species distributions, reflecting conditions in the breeding season and during summer and winter months when the most extreme conditions are likely to be experienced (Green et al., 2008; Jiménez-Valverde et al., 2011). The seven climatic predictors included in the models were: average daily maximum temperature of the hottest month in the study system (July), average daily minimum temperature of coldest month (January) and total precipitation of wettest (December), and driest month (July). The peak breeding period for most birds in the study region is in June, so we also considered maximum temperature, minimum temperature and precipitation for this month.
We acquired continuous land cover data for the time periods 1983–1987 and 2006–2010 at 30 m pixel resolution using Landsat7 (https://www.usgs.gov/land-resources/nli/landsat). We used six visible spectral reflectance bands and NDVI (Normalized Difference Vegetation Index) as independent variables in analysis because our previous work has shown these to be effective in predicting distributions of bird populations in this region (Shirley et al., 2013) and change in reflectance is well-known to be a measure of fine-scale vegetation change (Kennedy et al., 2010) (Figure S1). NDVI and Landsat bands are known to be influenced directly by climate (particularly moisture availability). We therefore tested whether changes in reflectance we observed in our study was indicative of true land-use change (gleaned from disturbance maps available for the western US; Kennedy et al., 2010). To test whether Landsat bands reflected stand-replacing disturbance (i.e., major land-cover change) we quantified whether reflectance changed for all bands in locations that were known to have stand-replacing fire (N = 126) or timber harvest (N = 462). We also included non-stand-replacing disturbance insect damage (N = 58) and forest regrowth following disturbance (N = 1460), and undisturbed ‘control' sites (N = 880) for comparison. ‘Known' sites were collected manually by expert observers using high-resolution Google Earth imagery and time series of Landsat images (Cohen et al., 2016). Landsat signatures were taken in the year of disturbance in all cases and all years following disturbance until 2010 for forest regrowth. Landsat bands showed strong influences of stand replacing disturbance and recovery in comparison to sites that were not disturbed during the course of our study (Figure S1); matched controls sites showed relatively little change between randomly selected “pre” and “post” disturbance years.
Although all the images were chosen to represent the growing season (July and August in the year of data origin), factors such as seasonal phenology and atmospheric conditions etc. can cause variability in spectral values across images and years. We therefore conducted radiometric correction to minimize the noise not related to ground conditions (Song and Woodcock, 2003; Schroeder et al., 2006). The cosine–Theta (COST) correction of Chavez (1996) was used to remove most atmospheric effects for a single reference image in a given Landsat time series (LTS) (after Kennedy et al., 2007; Shirley et al., 2013).
We summarized all climate and land cover variables within 1 km of BBS routes, the maximum distance within which birds are likely to be detected in a survey (Betts et al., 2007). We took the average value of climate variables across the 5 years in each period. Similarly, the mean and standard deviation (i.e., measures of spatial heterogeneity) for the 6 spectral bands and NDVI were summarized to produce the spectral variables. The full set of predictor variables included in the analyses is listed in Table S1.
Statistical Analyses
Model Development
We built models using the “gbm” package in R (R Development Core Team, 2010) for Boosted Regression Trees (BRT) analyses, which have been widely used for climatic envelope models (Randin et al., 2009; Veloz et al., 2012). BRTs are a type of machine-learning method that combines the strength of regression trees and boosting; that aims to fit a single parsimonious model. Generalized Boosted Models (GBMs) combine many simple models to give improved predictive performance and provide the capacity to include different types of predictor variables and to accommodate missing data. BRTs exhibit high prediction performance while minimizing the risks of overfitting (Elith et al., 2006). In addition, they are sufficiently flexible to include non-linear relationships and interactions between predictors (Elith et al., 2008), which makes them particularly appropriate for examining combined and synergistic effects of climate and land cover change. We generated three sets of BRTs to predict bird abundance: (1) Climate-only models, (2) Land-cover only models, and (3) Combined climate-land-use models. The latter of these model sets allowed for interaction between climate and land-use variables. We used the following default settings for each of our BRT models: tree complexity = 5, learning rate = 0.01, bag fraction = 0.9. When these settings did not result in 1,000 or more trees, we decreased the learning rate incrementally until 1,000 or more trees were obtained (Elith et al., 2008).
Species abundance models are well-known to suffer from potential biases caused by imperfect detection (MacKenzie et al., 2003; Kery, 2011). However, we did not account for detection in our modeling strategy for four reasons. First, BBS data are not collected using the repeated temporal sample structure required for occupancy modeling (MacKenzie et al., 2003). Second, to date, no machine learning methods (e.g., BRT) exist that account for imperfect detection. Machine learning methods such as BRT enable the fitting of complex structures (non-linearities, interactions) that are too computationally challenging for an occupancy framework. Thirdly, “occupancy,” after accounting for imperfect detection, is a latent variable and, therefore, impossible to validate on independent data because the “true” state of independent data are unknown (Welsh et al., 2013). Finally, as our primary objective was SDM validation, and the same search effort was applied to every transect in both time periods, this approach was therefore unnecessary.
Model Evaluation
To evaluate models, we first quantified original model fit. Here, we tested the correlation between model fitted predictions for the first time period (1983; hereafter “historical abundance”) and the observed data (nt1). We then tested the degree to which our models could predict changes in abundance across the two time periods; Projected abundance change was calculated as:
where is the projected abundance in the second time period, given changes in climate or land-cover. Finally, we tested the correlation (ρΔ) between and Δni, the observed change in abundance
Transect routes where a species was absent in both time periods were excluded to avoid the possibility that statistical fits might be exaggerated (large numbers of points with near-zero predicted change and zero change observed). We used Spearman rank correlations coefficients (ρ) between predicted and observed population change values because observed count numbers were low for almost all species on some routes (leading to deviations from normality), and because some species showed non-linear relationships between predicted and observed abundance changes (after Gutiérrez Illán et al., 2014). We also tested for correlations between observed and predicted abundance using Pearson's r, but results were not substantively different, so here we report only Spearman ρ, which is a more conservative test.
Spatial Autocorrelation
One of the most common criticisms of the species distribution models is spatial autocorrelation of results, which could lead to spurious relationships and thus, to infer wrong conclusions (Beale et al., 2008). Spatial autocorrelation can influence the reliability of biogeographic analyses, particularly based on sample sites separated by short geographic distances (Algar et al., 2009). We tested for spatial autocorrelation in residuals of both presence-absence and abundance models using correlograms (Moran's I; Fortin et al., 1990; Betts et al., 2006).
Life History and Ecological Trait Analysis
We tested whether life history and ecological traits influenced overall model performance across predictor variable sets. Model performance for each species was quantified as above (the correlation between observed and predicted abundance [ρ]) Because migratory bird species are more likely to be influenced by phenological mismatches with arthropod prey than resident birds (Both et al., 2009), we included ‘migratory strategy' and diet preferences as life history predictors of whether species abundances were best predicted by climate change. Given that many factors occurring during migration and wintering could influence migratory bird populations, we also expected migrants to be more poorly predicted overall than residents. We tested the effect of several variables representing a “slow-fast” continuum (i.e., reproductive output, longevity; Owens and Bennett, 2000) on model performance. Species with “fast” life histories should be expected to track changes in climate or land-cover more rapidly than those with “slow” strategies. Finally, we were interested in the degree to which our models were associated with long-term population trends of western birds. Larger numbers of propagules should afford populations the potential to settle newly available habitats, thus enhancing model performance.
We tested the effects of life history traits on overall model performance (ρΔ) and whether life history traits could predict sensitivity of a species to climate vs. land-use change (ρΔlc), we used generalized linear mixed effects (GLME; nlme package [Pinheiro et al., 2014]) models and phylogenetically independent contrasts (PIC) in the R package APE (https://cran.r-project.org/web/packages/ape/ape.pdf) (Paradis, 2015). Both of these methods take into account lack of independence among species caused by phylogenetic structure. First, we used GLMEs fit using maximum likelihood and Akaike's Information Criterion for small sample sizes (AICc; “drop 1” command in R) to reduce the full model (all life history and ecological traits above) to the most parsimonious model. We specified taxonomic family as a random effect. However, this approach does not account for lack of independence at finer and coarser taxonomic levels (i.e., order, genus). We therefore tested the statistical significance of individual model parameters in top-ranked models using Phylogenetically Independent Contrasts (PIC). We obtained phylogenetic information from Jetz et al. (2012) from www.birdtree.org.
Results
Overall, climate, land-cover, and combined models all described bird species abundances with some accuracy; correlations between predicted and observed bird data in the 1980s time period were high (climate = 0.74 [0.28–0.99], land-cover = 0.75 [0.12–0.98], combined = 0.82 [0.25–0.99] (Figure 2).
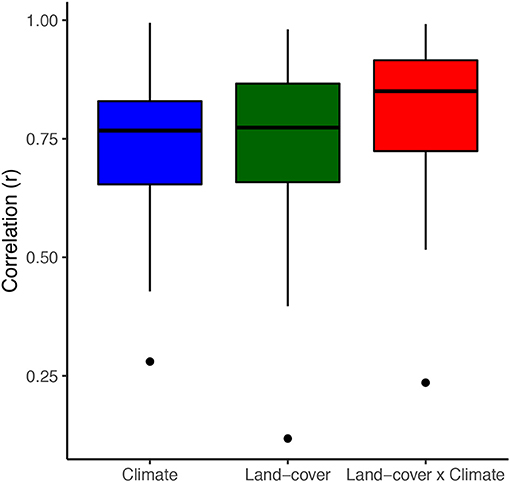
Figure 2. Boxplot showing Spearman correlations for all species between model fit and independent test data (10-fold validation) for the same time period in which models were built (1983–1987). Models predicting bird abundance generally performed well when not projecting across time periods.
Predicting trends in bird abundance over the 30-year period was more challenging; changes in climate significantly predicted observed abundance trends for 44/108 species ( = 0.37 ± 0.09 [SD]) and land-cover changes alone significantly predicted trends for 47/108 species ( = 0.36 ± 0.09). Land-cover trend predictions were rarely superior to climate models; only 8 species had statistically significant observed trend correlations that were best predicted by land-cover. However, the synergistic effects of climate and land-cover significantly predicted trends for 59/108 species ( = 0.37 ± 0.11) and for 37 of these species, including information on land-cover increased trend prediction success over climate data alone (Figure 3). We rarely detected significant spatial autocorrelation in residuals of observed vs. predicted trend correlations (Figure S2) and the magnitude of autocorrelation was consistently low (Moran's I < 0.2).
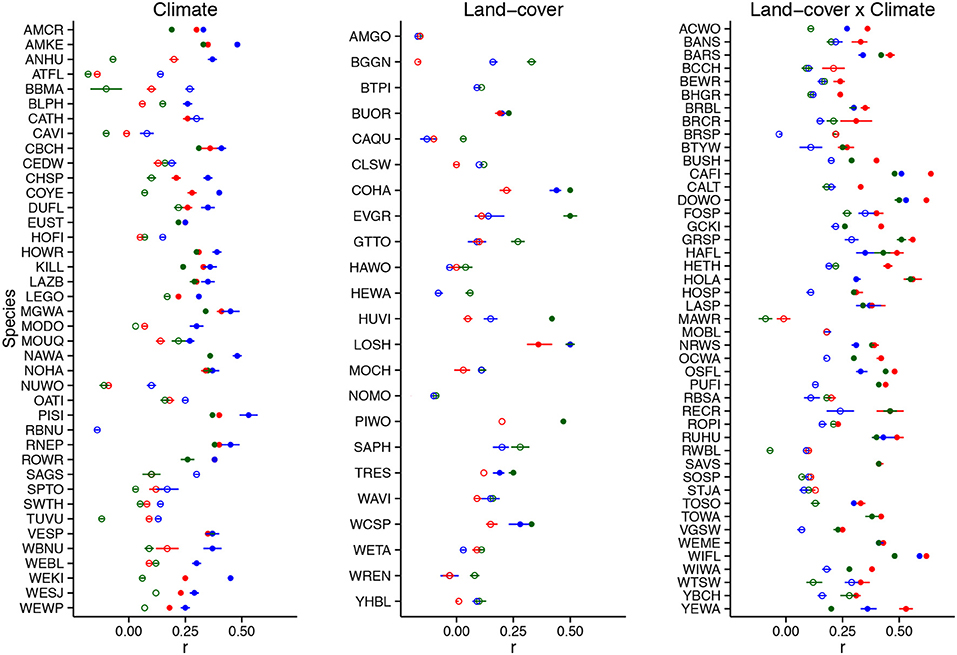
Figure 3. Spearman correlations (ρΔ; here 'r') for relationship between predicted and observed abundance changes for 108 terrestrial bird species of the western U.S. (1980–2010). Predictions were derived from boosted regression tree models using either Climate data, Land-cover data or both (Land-cover x Climate). Solid and open circles represent statistically significant (α = 0.05) vs. non-significant correlations, respectively. Each species is only depicted only for the change element (climate, land-cover, land-cover x climate) that best predicted abundance change. See Table S3 for English and scientific names. Bars reflect 95% confidence intervals from 1000 model runs.
Life History Traits
The top predicting model performance as a function of life history and demographic traits included only foraging preference, model type (i.e., climate, land-cover or both) and BBS population trend (Table 1). This model had considerable support in relation to competing models (AIC wi = 0.96, Tables S2,S4). Across stressors, species with trends in decline across the western U.S. were more likely to have accurate estimates of abundance trends (Figure 4). For instance, species with high correlations between predicted and observed abundances (>r = 0.4) were declining at rates that were on average >5% /year ( = −0.019± 0.007 SE, P = 0.021). On average, 45/108 species (41.6%) significantly declined over the period observed and only 8 increased (mean trend = −0.84%/year).
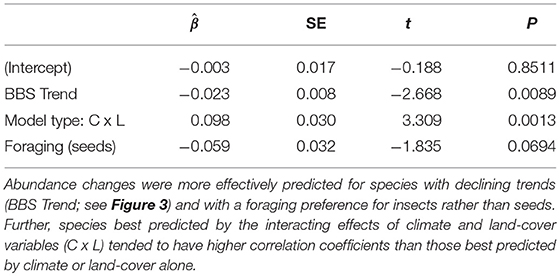
Table 1. Parameter estimates from phylogenetically independent contrasts (PIC) for the influence of life history and ecological traits on the capacity of models to predict bird abundance changes (ρΔ).
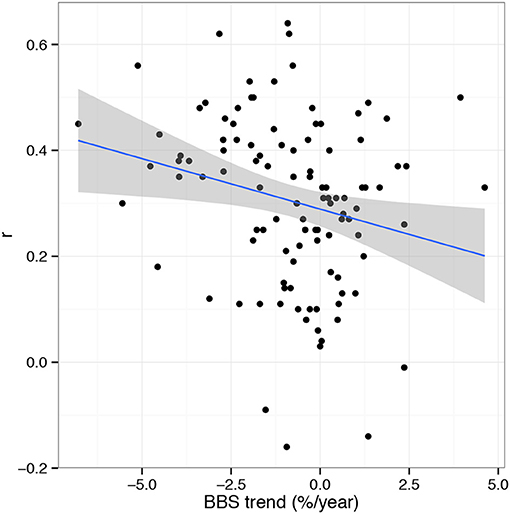
Figure 4. Relationship between BBS population trend (%/year 1980–2014) and model prediction success. On average, abundance changes of declining species were better predicted than those with stable or increasing populations ( = −0.019± 0.007 SE, P = 0.021).
Model type was also strongly associated with prediction success; after accounting for population trend and foraging preference, combined climate–land-cover models consistently outperformed those with only climate or land-cover variables; correlations between observed and predicted abundance changes (ρΔ) were 0.09 (±0.03 SE) higher for models including land-cover and climate variables vs. climate variables alone (Table 1). Finally, abundance changes of seedeaters were consistently more challenging to predict than insectivores. Model performance was not strongly associated with a migratory life history strategy (0.026 [0.035 SE], P = 0.45).
Hotspots for Bird Abundance Change
The spatial distribution of population trends varied strongly across species, as might be expected given the diversity in life history traits and habitat associations that we examined. This prompted us to “stack” prediction maps across species to enable us to examine spatial consistency in predicted declines and increases across species (i.e., “hotspots”). Only species with a statistically significant relationship between predicted and observed abundance change were mapped. Also, we only counted species as increasing or decreasing if one standard deviation of mean predicted abundance change along a route did not overlap zero. We then summed the number of species with predicted decreases (−1) and increases (+1) for each pixel to yield a map of net species abundance change (Figure 5). For example, a pixel with 6 declining species, but 10 increasing species would have a net abundance change of +4.
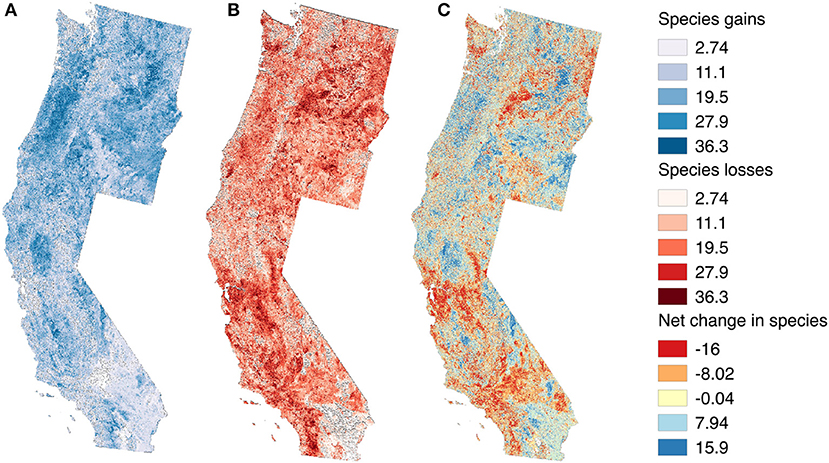
Figure 5. Stacked (summed) regional trend maps showing “hotspots” for (A) number of species declining, (B) number of species increasing, and (C) net numbers of species increasing or decreasing across all species with statistically significant correlations between predicted and observed abundance changes. Hotspots for declines tended to be associated with decreases in precipitation, whereas hotspots for population increases were associated with increases in Landsat band 4—a reflectance associated with recovery from disturbance and deciduous vegetation.
Overall, net abundance change tended to be more negative in the southwestern US (i.e., southern California), and in topographically simple areas at both lower (e.g., the Mohave desert) and higher elevations (e.g., the plateau east of the Washington Cascades). Bird populations of the Oregon Coast Range and Willamette Valley seemed relatively buffered from the effects of climate and landcover change (most species increased) (Figure 5). BBS routes with increasing Landsat band 4, an indicator of deciduous vegetation growth (Shirley et al., 2013), also tended to have an increased number of species with positive population trends (net trends ~ band 4: r = 0.19, p = 0.0002). Also, stable or increasing July precipitation seemed to result in fewer bird population declines than if July precipitation had declined (net trends ~ July precipitation: r = 0.33, p < 0.0001).
Discussion
Accurate models for predicting future changes in species distributions and population trends are essential for understanding the effects of global change and in policy development (Mazziotta et al., 2015; Thomas, 2017; Titeux et al., 2017). Such models are particularly relevant considering that the Earth is likely experiencing a sixth mass extinction event, mostly due to anthropogenic factors (Barnosky et al., 2011; Ceballos et al., 2015; Thomas, 2017).
Considerable efforts have been made in recent years to assess the effects of the diverse aspects of global change on the ecosystems (Pearson and Dawson, 2003). However, most of these studies focused on the evaluation of each component of global change in isolation (Keith et al., 2014; Ostberg et al., 2015; Pacifici et al., 2015, but see Marshall et al., 2018). Changes in climate and land use may exert a greater joint effect on ecosystems biota and ecosystem services than when considered individually (Gutiérrez Illán et al., 2012; Mantyka-Pringle et al., 2012; McCauley et al., 2015; Anteau et al., 2016). If this is the case for most species, predictions about the real effects of anthropogenic global change, regardless of their spatio-temporal scale, may have been underestimated (Stanton et al., 2012). This is why it is surprising that most projections of future species distributions for different parts of the planet are primarily based on climate change scenarios, without taking into account land-use change (e.g., Bakkenes et al., 2002; Peterson et al., 2002b; Thomas et al., 2004), let alone the synergistic effects of climate and land use. Thus, there is a pressing need to develop species distribution models that reflect and predict the impact of these potentially synergistic factors. In the present study, we examined the potential synergistic effects of climatic and land-cover change factors on populations of 108 bird species of the Pacific Northwest in North America over the last three decades. To our knowledge, ours is the first study to formally test the prediction success of land cover and climate models using a model-validation forecasting approach.
Our results indicate that future and observed effects of global change on avian biodiversity in the Pacific Northwest may be greater than the sum of the effects caused by climate and land-use changes separately. As expected, the inclusion of land-cover change improved the capacity of our models to estimate bird abundance in a single time period. If such models were validated using only data from the same place and time, it is possible that inclusion of more variables simply resulted in overfitting. Indeed, our results from cross-validation in the same time period (1983–86) showed relatively high model performance (Figure 2). However, our most rigorous validation tested whether models could predict species abundance trends, a much more challenging task. For 37 species, including land-cover information improved abundance change predictions.
Overall, synergistic effects of climate and land-cover were able to significantly predict abundance changes for more than half of the analyzed species (59 out of 108). Although this is cause for some optimism, it is important to note that modeled predictions for 45% of species did not even significantly correlate with observed changes. Such a result should temper existing unvalidated projections about species responses to climate and land-cover change (e.g., Thuiller et al., 2004; Jetz et al., 2007, Ponce-Reyes et al., 2013; Sohl, 2014; Jantz et al., 2015). This underscores the reality that even though a model may be well-validated in a single place and time (e.g., via cross-validation), or even in different regions (Betts et al., 2006), this is not necessarily an indication that models will effectively predict future trends.
The relatively low explanatory power of our models in relation to previous studies could stem from the following: (i) most of the studies have looked at occupancy predictions, which constitutes only a pseudo-validation. Predicting actual trends is a much more challenging task (Regos et al., 2018). (ii) The spatial scale at which the species' responses to changes in climate and land-use change occur are undoubtedly finer resolution than we were able to measure with current data (e.g., microclimate under canopy, fine-resolution habitat associations, cold-air pooling, etc.; Frey et al., 2016; Betts et al., 2018). Mismatches between predictions and reality likely stem from missing key climate or habitat variables that were perhaps initially correlated with the variables used in the analysis, but have become decoupled over time (for example, perhaps a fine-scale habitat feature such as cavity trees were associated with a certain reflectance band in time t, but this is no longer the case in time t +1). (iii) There are obviously other factors, well known to influence populations (e.g., dispersal, species interactions, disease), that were not included in our models.
It is reassuring, to some extent, that the capacity of our models to predict bird population changes was improved for species with declining, rather than increasing, populations. This indicates that we may have a better idea about population stressors for species of potential conservation concern, which at least offers the potential for management actions to reverse declines. We hypothesize that this finding results from the rather deterministic process of decline and local extinction of species if the climate changes to exceed the species' niche. However, colonization and population increases in a landscape may be more dependent on less predictable processes that are often a function of landscape configuration such as dispersal (Gustafson and Gardner, 1996). Thus, species with expanding ranges and populations may be inherently more difficult to predict.
Life History and Ecological Traits
Surprisingly, foraging behavior was the only ecological or life history trait that could predict model performance. Our models were able to predict trends of insectivores more accurately than seedeaters. When there is a difference in model performance between species traits, we are always tempted to explain it on the basis of a better, or rather more complete, environmental predictors for that particular group of species. For example, climate envelope models for resident species, that spend all their entire life cycle in the study system, could be expected to show a greater predicting ability than those for migrant species (Kerr et al., 2015). Interestingly, most migrant passerines in our dataset are migratory insectivores (Logistic regression: χ2 = 16.62, 1.64 (0.41 SE), P < 0.0001), so absence of information about wintering ground climate and land-cover changes did not seem to adversely affect model performance in relation to resident species that spend their entire life cycle within the study system.
Implications for Management
Climate change is already exerting a substantial impact on bird populations of the Pacific Northwest (Gutiérrez Illán et al., 2014; Betts et al., 2018; Northrup et al., 2019). Overall, climate variables tended to have more effect on populations than land-cover variables. This is possibly because land-use change in the NW has still been relatively minor over the time-period observed, due partly to sweeping policy implemented in 1993 which precluded clear cutting of old growth forest on federal land (Phalan et al., 2019). Before strong conclusions can be made about the relative effect of climate vs. land-cover change on biodiversity, it will be critical that the current study be replicated in regions that have experienced severe land-cover change over the past 30 years (e.g., Borneo, Congo Basin; Betts et al., 2017); we predict that in such instances land-cover would exert a much stronger and unambiguous effects, in relation to climate, on the abundance of birds in such regions.
Author Contributions
All authors conceived the ideas and designed methodology. MB, JG, and ZY led the data analyses. MB wrote the first draft of the manuscript with major contributions from JG. All authors contributed critically to the drafts and gave final approval for publication.
Conflict of Interest Statement
The authors declare that the research was conducted in the absence of any commercial or financial relationships that could be construed as a potential conflict of interest.
Acknowledgments
The research was funded by Oregon State University, a National Science Foundation grant to MB (NSF-ARC 0941748) and a National Science Foundation CDI grant to MB (NSF-CDI 0913560). The project described in this publication was supported by a grant to MB the Department of the Interior Northwest Climate Science Center through Cooperative Agreement No. G11AC20255 from the United States Geological Survey. Its contents are solely the responsibility of the authors and do not necessarily represent the views of the Northwest Climate Science Center or the USGS. This manuscript is submitted for publication with the understanding that the United States Government is authorized to reproduce and distribute reprints for Governmental purposes.
Supplementary Material
The Supplementary Material for this article can be found online at: https://www.frontiersin.org/articles/10.3389/fevo.2019.00186/full#supplementary-material
References
Algar, A. C., Kharouba, H. M., Young, E. R., and Kerr, J. T. (2009). Predicting the future of species diversity: macroecological theory, climate change, and direct tests of alternative forecasting methods. Ecography 32, 22–33. doi: 10.1111/j.1600-0587.2009.05832.x
Allan, J. D. (2004). Landscapes and riverscapes: the influence of land use on stream ecosystems. Ann. Rev. Ecol. Evol. System. 35, 257–284. doi: 10.1146/annurev.ecolsys.35.120202.110122
Anteau, M. J., Wiltermuth, M. T., van der Burg, M. P., and Pearse, A. T. (2016). Prerequisites for understanding climate-change impacts on northern prairie wetlands. Wetlands, 36, 299–307. doi: 10.1007/s13157-016-0811-2
Bakkenes, M., Alkemade, R. M., Ihle, F., Leemans, R., and Latour, J. B. (2002). Assessing effects of forecasted climate change on the diversity and distribution of European higher plants for 2050. Global Change Biol. 8, 390–407. doi: 10.1046/j.1354-1013.2001.00467.x
Barnosky, A. D., Matzke, N., Tomiya, S., Wogan, G. O., Swartz, B., Quental, T. B., et al. (2011). Has the Earth's sixth mass extinction already arrived? Nature 471:51. doi: 10.1038/nature09678
Beale, C. M., Lennon, J. J., and Gimona, A. (2008). Opening the climate envelope reveals no macroscale associations with climate in European birds. Proc. Natl. Acad. Sci. U.S.A. 105, 14908–14912. doi: 10.1073/pnas.0803506105
Betts, M. G., Diamond, A. W., Forbes, G. J., Villard, M. A., and Gunn, J. S. (2006). The importance of spatial autocorrelation, extent and resolution in predicting forest bird occurrence. Ecol. Model. 191, 197–224. doi: 10.1016/j.ecolmodel.2005.04.027
Betts, M. G., Fahrig, L., Hadley, A. S., Halstead, K. E., Bowman, J., Robinson, W. D., et al. (2014). A species-centered approach for uncovering generalities in organism responses to habitat loss and fragmentation. Ecography 37, 517–527. doi: 10.1111/ecog.00740
Betts, M. G., Forbes, G. J., and Diamond, A. W. (2007). Thresholds in songbird occurrence in relation to landscape structure. Conserv. Biol. 21, 1046–1058. doi: 10.1111/j.1523-1739.2007.00723.x
Betts, M. G., Phalan, B., Frey, S. J., Rousseau, J. S., and Yang, Z. (2018). Old-growth forests buffer climate-sensitive bird populations from warming. Diver. Distribut. 24, 439–447. doi: 10.1111/ddi.12688
Betts, M. G., Wolf, C., Ripple, W., Phalan, B., Butchart, S., and Levi, T. (2017). Global forest loss disproportionately erodes biodiversity in intact landscapes. Nature 547, 441–444. doi: 10.1038/nature23285
Both, C., Van Turnhout, C. A., Bijlsma, R. G., Siepel, H., Van Strien, A. J., and Foppen, R. P. (2009). Avian population consequences of climate change are most severe for long-distance migrants in seasonal habitats. Proc. Royal Soc. London B. 2009:1525. doi: 10.1098/rspb.2009.1525
Botkin, D. B., Saxe, H., Araujo, M. B., Betts, R., Bradshaw, R. H., Cedhagen, T., et al. (2007). Forecasting the effects of global warming on biodiversity. AIBS Bull. 57, 227–236. doi: 10.1641/B570306
Ceballos, G., Ehrlich, P. R., Barnosky, A. D., García, A., Pringle, R. M., and Palmer, T. M. (2015). Accelerated modern human–induced species losses: entering the sixth mass extinction. Sci. Adv. 1:1400253. doi: 10.1126/sciadv.1400253
Chavez, P. S, Jr. (1996). Image-based atmospheric corrections - revisited and improved, Photogram. Eng. Remote Sens. 62, 1025–1036.
Chen, I. C., Hill, J. K., Ohlemüller, R., Roy, D. B., and Thomas, C. D. (2011). Rapid range shifts of species associated with high levels of climate warming. Science 333, 1024–1026. doi: 10.1126/science.1206432
Cohen, W. B., Yang, Z., Stehman, S. V., Schroeder, T. A., Bell, D. M., Masek, J. G., et al. (2016). Forest disturbance across the coterminous United States from 1985-2012: The emerging dominance of forest decline. Forest Ecol. Manage. 360, 242–252. doi: 10.1016/j.foreco.2015.10.042
Dale, V. H. (1997). The relationship between land-use change and climate change. Ecol. Applicat. 7, 753–769. doi: 10.1890/1051-0761(1997)007[0753:TRBLUC]2.0.CO;2
Daly, C., Gibson, W. P., Taylor, G. H., Johnson, G. L., and Pasteris, P. (2002). A knowledge-based approach to the statistical mapping of climate. Climate Res. 22, 99–113. doi: 10.3354/cr022099
Daly, C., Taylor, G. H., Gibson, W. P., Parzybok, T. W., Johnson, G. L., and Pasteris, P. A. (2000). High-quality spatial climate data sets for the United States and beyond. Transact. ASAE 43:1957. doi: 10.13031/2013.3101
Darwin, C. (1859). The Origin of Species by Charles Darwin: a Variorum Text. London: ICON Group International. doi: 10.9783/9780812200515
Dickinson, N. M., Turner, A. P., and Lepp, N. W. (1991). How do trees and other long-lived plants survive in polluted environments? Funct. Ecol. 5, 5–11. doi: 10.2307/2389550
Dobrowski, S. Z., Thorne, J. H., Greenberg, J. A., Safford, H. D., Mynsberge, A. R., Crimmins, S. M., et al. (2011). Modeling plant ranges over 75 years of climate change in California, USA: temporal transferability and species traits. Ecol. Monogra. 81, 241–257. doi: 10.1890/10-1325.1
Ehrlen, J., and Morris, W. F. (2015). Predicting changes in the distribution and abundance of species under environmental change. Ecol. Lett. 18, 303–314. doi: 10.1111/ele.12410
Elith, J., Graham, C. H., Anderson, R. P., Dudík, M., Ferrier, S., Guisan, A., et al. (2006). Novel methods improve prediction of species' distributions from occurrence data. Ecography 29, 129–151. doi: 10.1111/j.2006.0906-7590.04596.x
Elith, J., Leathwick, J. R., and Hastie, T. (2008). A working guide to boosted regression trees. J. Anim. Ecol. 77, 802–813. doi: 10.1111/j.1365-2656.2008.01390.x
Fortin, M. J., Drapeau, P., and Legendre, P. (1990). “Spatial autocorrelation and sampling design in plant ecology,” in Progress in Theoretical Vegetation Science, eds G. Grabherr, L. Mucina, M. B. Dales, and C. J. F. ter Braak (Dordrecht: Springer), 209–222.
Frey, S. J. K., Hadley, A. S., Johnson, S. L., Schulze, M., Jones, J. A., and Betts, M. G. (2016). Spatial models reveal the microclimatic buffering capacity of old-growth forests. Sci. Adv. 2:e1501392. doi: 10.1126/sciadv.1501392
Green, R. E., Collingham, Y. C., Willis, S. G., Gregory, R. D., Smith, K. W., and Huntley, B. (2008). Performance of climate envelope models in retrodicting recent changes in bird population size from observed climatic change. Biol. Lett. 4, 599–602. doi: 10.1098/rsbl.2008.0052
Gustafson, E. J., and Gardner, R. H. (1996). The effect of landscape heterogeneity on the probability of patch colonization. Ecology 77, 94–107. doi: 10.2307/2265659
Gutiérrez Illán, J., Gutierrez, D., Diez, S. B., and Wilson, R. J. (2012). Elevational trends in butterfly phenology: implications for species responses to climate change. Ecol. Entomol. 37, 134–144. doi: 10.1111/j.1365-2311.2012.01345.x
Gutiérrez Illán, J., Thomas, C. D., Jones, J. A., Wong, W. K., Shirley, S. M., and Betts, M. G. (2014). Precipitation and winter temperature predict long-term range-scale abundance changes in Western North American birds. Global Change Biol. 20, 3351–3364. doi: 10.1111/gcb.12642
Hansen, M. C., Potapov, P. V., Moore, R., Hancher, M., Turubanova, S., Tyukavina, A., et al. (2013). High-resolution global maps of 21st-century forest cover change. Science 342, 850–853. doi: 10.1126/science.1244693
Hitch, A. T., and Leberg, P. L. (2007). Breeding distributions of North American bird species moving north as a result of climate change. Conserv. Biol. 21, 534–539. doi: 10.1111/j.1523-1739.2006.00609.x
Holt, R. D., and Keitt, T. H. (2000). Alternative causes for range limits: a metapopulation perspective. Ecol. Lett. 3, 41–47. doi: 10.1046/j.1461-0248.2000.00116.x
Jantz, S. M., Barker, B., Brooks, T. M., Chini, L. P., Huang, Q., Moore, R. M., et al. (2015). Future habitat loss and extinctions driven by land-use change in biodiversity hotspots under four scenarios of climate-change mitigation. Conserv. Biol. 29, 1122–1131. doi: 10.1111/cobi.12549
Jetz, W., Thomas, G. H., Joy, J. B., Hartmann, K., and Mooers, A. O. (2012). The global diversity of birds in space and time. Nature 491:444. doi: 10.1038/nature11631
Jetz, W., Wilcove, D. S., and Dobson, A. P. (2007). Projected impacts of climate and land-use change on the global diversity of birds. PLoS Biol. 5:157. doi: 10.1371/journal.pbio.0050157
Jiménez-Valverde, A., Barve, N., Lira-Noriega, A., Maher, S. P., Nakazawa, Y., Pape,ş, M., et al. (2011). Dominant climate influences on North American bird distributions. Global Ecol. Biogeogra. 20, 114–118. doi: 10.1111/j.1466-8238.2010.00574.x
Karl, T. R., Arguez, A., Huang, B., Lawrimore, J. H., McMahon, J. R., Menne, M. J., et al. (2015). Possible artifacts of data biases in the recent global surface warming hiatus. Science 348:aaa5632. doi: 10.1126/science.aaa5632
Keith, D. A., Mahony, M., Hines, H., Elith, J., Regan, T. J., Baumgartner, J. B., et al. (2014). Detecting extinction risk from climate change by IUCN Red List criteria. Conserv. Biol. 28, 810–819. doi: 10.1111/cobi.12234
Kennedy, R. E., Cohen, W. B., Kirschbaum, A. A., and Haunreiter, E. (2007). Protocol for Landsat-based Monitoring of Landscape Dynamics at North Coast and Cascades Network Parks (No. 2-G1). Geological Survey (US). Natural Resource Report NPS/NCCN/NRR-2012/601. doi: 10.3133/tm2G1
Kennedy, R. E., Yang, Z., and Cohen, W. B. (2010). Detecting trends in forest disturbance and recovery using yearly Landsat time series: 1. LandTrendr—Temporal segmentation algorithms. Remote Sens. Environ. 114, 2897–2910. doi: 10.1016/j.rse.2010.07.008
Kerr, J. T., Pindar, A., Galpern, P., Packer, L., Potts, S. G., Roberts, S. M., et al. (2015). Climate change impacts on bumblebees converge across continents. Science 349, 177–180. doi: 10.1126/science.aaa7031
Kery, M. (2011). “Species richness and community dynamics: a conceptual framework,” in Camera Traps in Animal Ecology, eds A. F. O'Connell, J. D. Nichols, and K. U. Karanth (Tokyo: Springer), 207–231. doi: 10.1007/978-4-431-99495-4_12
Lawler, J. J., Lewis, D. J., Nelson, E., Plantinga, A. J., Polasky, S., Withey, J. C., et al. (2014). Projected land-use change impacts on ecosystem services in the United States. Proc. Natl. Acad. Sci. U.S.A. 2014:05557. doi: 10.1073/pnas.1405557111
Lawrence, D., and Vandecar, K. (2015). Effects of tropical deforestation on climate and agriculture. Nat. Climate Chan. 5:27. doi: 10.1038/nclimate2430
Lemoine, N., Bauer, H. G., Peintinger, M., and Böhning-gaese, K. (2007). Effects of climate and land-use change on species abundance in a central European bird community. Conserv. Biol. 21, 495–503. doi: 10.1111/j.1523-1739.2006.00633.x
MacKenzie, D. I., Nichols, J. D., Hines, J. E., Knutson, M. G., and Franklin, A. B. (2003). Estimating site occupancy, colonization, and local extinction when a species is detected imperfectly. Ecology 84, 2200–2207. doi: 10.1890/02-3090
Mair, L., Hill, J. K., Fox, R., Botham, M., Brereton, T., and Thomas, C. D. (2014). Abundance changes and habitat availability drive species' responses to climate change. Nat. Climate Chan. 4:127. doi: 10.1038/nclimate2086
Mantyka-Pringle, C. S., Martin, T. G., and Rhodes, J. R. (2012). Interactions between climate and habitat loss effects on biodiversity: a systematic review and meta-analysis. Global Change Biol. 18, 1239–1252. doi: 10.1111/j.1365-2486.2011.02593.x
Marshall, L., Biesmeijer, J. C., Rasmont, P., Vereecken, N. J., Dvorak, L., Fitzpatrick, U., et al. (2018). The interplay of climate and land use change affects the distribution of EU bumblebees. Global Change Biol. 24, 101–116. doi: 10.1111/gcb.13867
Mazziotta, A., Triviño, M., Tikkanen, O. P., Kouki, J., Strandman, H., and Mönkkönen, M. (2015). Applying a framework for landscape planning under climate change for the conservation of biodiversity in the Finnish boreal forest. Global Change Biol. 21, 637–651. doi: 10.1111/gcb.12677
McCauley, L. A., Anteau, M. J., van der Burg, M. P., and Wiltermuth, M. T. (2015). Land use and wetland drainage affect water levels and dynamics of remaining wetlands. Ecosphere 6, 1–22. doi: 10.1890/ES14-00494.1
Newbold, T., Hudson, L. N., Hill, S. L., Contu, S., Lysenko, I., Senior, R. A., et al. (2015). Global effects of land use on local terrestrial biodiversity. Nature 520:45. doi: 10.1038/nature14324
Northrup, J., Zhiqiang, Y., Rivers, J.R., and Betts, M.G. (2019). Synergistic effects of climate and land-use change influence broad-scale population declines. Global Change Biol. 25, 1561–1575. doi: 10.1111/gcb.14571
Opdam, P., and Wascher, D. (2004). Climate change meets habitat fragmentation: linking landscape and biogeographical scale levels in research and conservation. Biol. Conserv. 117, 285–297. doi: 10.1016/j.biocon.2003.12.008
Ostberg, S., Schaphoff, S., Lucht, W., and Gerten, D. (2015). Three centuries of dual pressure from land use and climate change on the biosphere. Environ. Res. Lett. 10:044011. doi: 10.1088/1748-9326/10/4/044011
Owens, I. P., and Bennett, P. M. (2000). Ecological basis of extinction risk in birds: habitat loss versus human persecution and introduced predators. Proc. Natl Acad. Sci. U.S.A. 97, 12144–12148. doi: 10.1073/pnas.200223397
Pacifici, M., Foden, W. B., Visconti, P., Watson, J. E., Butchart, S. H., Kovacs, K. M., et al. (2015). Assessing species vulnerability to climate change. Nat. Climate Change 5:215. doi: 10.1038/nclimate2448
Paradis, E. (2015). Random phylogenies and the distribution of branching times. J. Theoret. Biol. 387, 39–45. doi: 10.1016/j.jtbi.2015.09.005
Parmesan, C. (2006). Ecological and evolutionary responses to recent climate change. Annu. Rev. Ecol. Evol. System. 37, 637–669. doi: 10.1146/annurev.ecolsys.37.091305.110100
Pearson, R. G., and Dawson, T. P. (2003). Predicting the impacts of climate change on the distribution of species: are bioclimate envelope models useful? Global Ecol. Biogeograp. 12, 361–371. doi: 10.1046/j.1466-822X.2003.00042.x
Peterson, A. T. (2003). Projected climate change effects on Rocky Mountain and Great Plains birds: generalities of biodiversity consequences. Global Change Biol. 9, 647–655. doi: 10.1046/j.1365-2486.2003.00616.x
Peterson, A. T., Ortega-Huerta, M. A., Bartley, J., Sánchez-Cordero, V., Soberón, J., Buddemeier, R. H., et al. (2002b). Future projections for Mexican faunas under global climate change scenarios. Nature 416, 626–629. doi: 10.1038/416626a
Peterson, A. T., Stockwell, D. R., and Kluza, D. A. (2002a). “Distributional prediction based on ecological niche modeling of primary occurrence data,” in Predicting Species Occurrences: Issues of Accuracy and Scale, eds J. M. Scott., P. J. Heglund, M. L. Morrison, J. B. Haufler, M. G. Raphael, W. A. Wall, et al. (Washington, DC: Island Press), 265–270.
Phalan, B., Northrup, J., Zhiquiang, Y., Deal, R., Spies, T., and Betts, M.G. (2019). Successes and limitations of an iconic policy: impacts of the Northwest Forest Plan on forest composition and bird populations. Proc. Natl. Acad. Sci. U.S.A. 116, 3322–3327. doi: 10.1073/pnas.1813072116
Phillips, L. B., Hansen, A. J., Flather, C. H., and Robison-Cox, J. (2010). Applying species–energy theory to conservation: a case study for North American birds. Ecol. Appli. 20, 2007–2023. doi: 10.1890/09-0580.1
Pinheiro, J., Bates, D., DebRoy, S., and Sarkar, D. (2014). R. Core Team (2014). Nlme: Linear and Nonlinear Mixed Effects Models. R package version 3.1-117. Available online at: http://CRAN.R-project.org/package=nlme
Ponce-Reyes, R., Nicholson, E., Baxter, P. W., Fuller, R. A., and Possingham, H. (2013). Extinction risk in cloud forest fragments under climate change and habitat loss. Divers. Distribut. 19, 518–529. doi: 10.1111/ddi.12064
R Development Core Team (2010). R: A Language and Environment for Statistical Computing. Vienna: R Foundation for Statistical Computing. Available online at: http://www.R-project.org
Randin, C. F., Vuissoz, G., Liston, G. E., Vittoz, P., and Guisan, A. (2009). Introduction of snow and geomorphic disturbance variables into predictive models of alpine plant distribution in the Western Swiss Alps. Arctic Antarctic Alpine Res. 41, 347–361. doi: 10.1657/1938-4246-41.3.347
Regos, A., Imbeau, L., Desrochers, M., Luduc, A., Robert, M., Jobin, B., et al. (2018). Hindcasting the impacts of land-use changes on bird communities with species distribution models of Bird Atlas data. Ecol. Appli. 28, 1967–1883. doi: 10.1002/eap.1784
Robbins, C. S., Bystrak, D., and Geissler, P. H. (1986). The Breeding Bird Survey: Its First Fifteen Years, 1965-1979 (No. FWS-PUB-157). Patuxent Wildlife Research Center Laurel Md.
Robbins, C. S., Sauer, J. R., Greenberg, R. S., and Droege, S. (1989). Population declines in North American birds that migrate to the Neotropics. Proc. Natl. Acad. Sci. U.S.A. 86, 7658–7662. doi: 10.1073/pnas.86.19.7658
Sauer, J. R., Hines, J. E., Fallon, J. E., Pardieck, K. L., Ziolkowski Jr, D. J, and Link, W. A. (2011). The North American Breeding Bird Survey Results and Analysis 1966–2009. Version 3.23. 2011 (USGS Patuxent Wildlife Research Center, Laurel, MD).
Sauer, J. R., Niven, D. K., Pardieck, K. L., Ziolkowski Jr, D. J, and Link, W. A. (2017). Expanding the North American Breeding Bird Survey analysis to include additional species and regions. J. Fish Wildlife Manag. 8, 154–172. doi: 10.3996/102015-JFWM-109
Schroeder, T. A., Cohen, W. B., Song, C., Canty, M. J., and Yang, Z. (2006). Radiometric correction of multi-temporal Landsat data for characterization of early successional forest patterns in western Oregon. Remote Sens. Environ. 103, 16–26. doi: 10.1016/j.rse.2006.03.008
Shirley, S. M., Yang, Z., Hutchinson, R. A., Alexander, J. D., McGarigal, K., and Betts, M. G. (2013). Species distribution modelling for the people: unclassified landsat TM imagery predicts bird occurrence at fine resolutions. Diver. Distribut. 19, 855–866. doi: 10.1111/ddi.12093
Soberón, J. (2007). Grinnellian and Eltonian niches and geographic distributions of species. Ecol. Lett. 10, 1115–1123. doi: 10.1111/j.1461-0248.2007.01107.x
Sohl, T. L. (2014). The relative impacts of climate and land-use change on conterminous United States bird species from 2001 to 2075. PLoS ONE 9:112251. doi: 10.1371/journal.pone.0112251
Song, C., and Woodcock, C. E. (2003). Monitoring forest succession with multitemporal Landsat images: Factors of uncertainty. IEEE Trans. Geosci. Remote Sens. 41, 2557–2567. doi: 10.1109/TGRS.2003.818367
Stanton, J. C., Pearson, R. G., Horning, N., Ersts, P., and Reşit Akçakaya, H. (2012). Combining static and dynamic variables in species distribution models under climate change. Methods Ecol. Evol. 3, 349–357. doi: 10.1111/j.2041-210X.2011.00157.x
Taylor, P. D., Fahrig, L., Henein, K., and Merriam, G. (1993). Connectivity is a vital element of landscape structure. Oikos 68, 571–573. doi: 10.2307/3544927
Thomas, C. D. (2017). Inheritors of the Earth: How Nature is Thriving in an Age of Extinction. London: Hachette.
Thomas, C. D., Cameron, A., Green, R. E., Bakkenes, M., Beaumont, L. J., Collingham, Y. C., et al. (2004). Extinction risk from climate change. Nature 427, 145–148. doi: 10.1038/nature02121
Thuiller, W., Araújo, M. B., and Lavorel, S. (2004). Do we need land-cover data to model species distributions in Europe? J. Biogeograp. 31, 353–361. doi: 10.1046/j.0305-0270.2003.00991.x
Tingley, M. W., and Beissinger, S. R. (2013). Cryptic loss of montane avian richness and high community turnover over 100 years. Ecology 94, 598–609. doi: 10.1890/12-0928.1
Titeux, N., Henle, K., Mihoub, J. B., Regos, A., Geijzendorffer, I. R., Cramer, W., et al. (2017). Global scenarios for biodiversity need to better integrate climate and land use change. Divers. Distribut. 23, 1231–1234. doi: 10.1111/ddi.12624
Travis, J. M. J. (2003). Climate change and habitat destruction: a deadly anthropogenic cocktail. Proc. Royal Soc. London Series B. 270, 467–473. doi: 10.1098/rspb.2002.2246
Veloz, S. D., Williams, J. W., Blois, J. L., He, F., Otto-Bliesner, B., and Liu, Z. (2012). No-analog climates and shifting realized niches during the late quaternary: implications for 21st-century predictions by species distribution models. Global Change Biol. 18, 1698–1713. doi: 10.1111/j.1365-2486.2011.02635.x
Welsh, A. H., Lindenmayer, D. B., and Donnelly, C. F. (2013). Fitting and interpreting occupancy models. PLoS ONE 8:52015. doi: 10.1371/annotation/83cc3ff1-9438-4b1d-abf4-07f378ed558f
Keywords: bird populations, geographical patterns, global change, ecological niche modeling, population trends
Citation: Betts MG, Gutiérrez Illán J, Yang Z, Shirley SM and Thomas CD (2019) Synergistic Effects of Climate and Land-Cover Change on Long-Term Bird Population Trends of the Western USA: A Test of Modeled Predictions. Front. Ecol. Evol. 7:186. doi: 10.3389/fevo.2019.00186
Received: 15 December 2018; Accepted: 08 May 2019;
Published: 29 May 2019.
Edited by:
Samuel A. Cushman, United States Forest Service (USDA), United StatesReviewed by:
Pablo Almaraz, Institute of Marine Sciences of Andalusia (ICMAN), SpainMichael J. Anteau, United States Geological Survey, United States
Copyright © 2019 Betts, Gutiérrez Illán, Yang, Shirley and Thomas. This is an open-access article distributed under the terms of the Creative Commons Attribution License (CC BY). The use, distribution or reproduction in other forums is permitted, provided the original author(s) and the copyright owner(s) are credited and that the original publication in this journal is cited, in accordance with accepted academic practice. No use, distribution or reproduction is permitted which does not comply with these terms.
*Correspondence: Matthew G. Betts, matthew.betts@oregonstate.edu