Structural Changes of Seagrass Seascapes Driven by Natural and Anthropogenic Factors: A Multidisciplinary Approach
 Arnaud Abadie
 Jonathan Richir
 Pierre Lejeune4
  Sylvie Gobert
- 1Laboratory of Oceanology, Interfacultary Center for Marine Research (MARE) Centre, University of Liege, Liège, Belgium
- 2Seaviews, La Ciotat, France
- 3Chemical Oceanography Unit, Institut de Physique, Université de Liège, Liège, Belgium
- 4STARESO, Calvi, France
Seascape ecology has been widely applied to marine habitats, including seagrass meadows, through various approaches all over the world for the past 30 years. However, these methods mainly study seagrass meadows on a single spatial scale and monitor a single driver of heterogeneity. Additionally, few assess the seascape's structural evolution. This creates gaps between the scientific data provided and those required by environmental managers and stakeholders in charge of seagrass meadow conservation. To meet their expectations, in this paper we developed a new multidisciplinary approach based on the coupling of mapping techniques, particle flux, and biometric investigations in a Mediterranean Bay, the Calvi Bay (Corsica, France), to assess the structural changes of Posidonia oceanica (L.) Delile meadows subject to disturbances. We focused our investigations on the structural characteristics, the spatial dynamics, and the particle fluxes of natural sand areas generated by bottom currents and dead matte patches which ensued from anchoring damages at 10, 15, and 20 m depth. Natural sand patches and anchoring patches differed in size, the first the largest. They also displayed different erosion-colonization dynamics. Natural sand patches were eroded at a mean speed of 12 cm.a−1 and colonized at a rate of 7 cm.a−1. Anchoring patches showed a mean erosion speed of 3.5 cm.a−1 and a colonization rate of 6.5 cm.a−1. Regarding particle fluxes, continuous meadow, and natural patch sedimentation and resuspension rates were 3.7 gDW.m−2.d−1 and 4.1 gDW.m−2.d−1 in average, respectively. In contrast, anchoring patches at 20 m depth acted as sediment traps (112.60 gDW.m−2.d−1 in winter) and showed a higher particle resuspension rate. Our results highlighted the dichotomous dynamics of seagrass seascapes influenced by natural and anthropogenic factors. Thus, the smallest anchoring patch will take about 27 years to be recolonized while the biggest requires 60 years to be covered by the plant. With an upscaling approach, together with the newest mapping tools of marine habitats, we suggest a new method to study the evolution of seagrass meadows at a large spatial scale.
Introduction
Over the past century, landscape ecology has been widely used to tackle environmental issues through the study of habitats' spatial heterogeneity and its effect on species distribution (Pickett and Cadenasso, 1995). A landscape can be defined as a shifting arrangement of biotic structures and the resulting mosaic of patches within a matrix connecting them (Forman et al., 1986; Robbins and Bell, 1994). Landscape ecology consists in the study of the structure, i.e., the spatial assembling of patches within the matrix; the function, i.e., the distribution of organisms within the landscape; and the evolution, i.e., the changes over time of both the structure and the function (Turner, 1989). Patch dynamics is commonly used in landscape ecology for the management of natural and anthropic ecosystems (Pittman et al., 2011; Jackson et al., 2017), although for marine habitats no formal landscape approach was developed until the 1990s (Bell and Hicks, 1991; Robbins and Bell, 1994). This recent field of study was named “seascape ecology,” with reference to the application of landscape ecology concepts to the marine environment (Pittman, 2017).
Because of the ecosystemic and economical services they provide, the strong research interest they create, and the need to provide management tools, seagrass meadows were among the first marine habitats to be studied with a seascape approach (Bell et al., 2006). The seagrass Posidonia oceanica (L.) Delile endemic to the Mediterranean Sea plays major roles at the scale of the whole basin. For that reason, this seagrass is one of the most studied species with a seascape approach (Abadie et al., 2018b). Posidonia oceanica builds extensive beds with complex three-dimensional structures. These seagrass beds are under the influence of natural and anthropogenic factors leading to both spatial and temporal heterogeneity (Boudouresque et al., 2009). The definition of a P. oceanica seascape will vary according to the spatial scale considered and the seafloor matrix (e.g., sand, rock, seagrass) in which habitat patches are embedded (Pagès et al., 2014). In the present study, a P. oceanica seascape is defined according to Abadie et al. (2015) as the set of the different habitats (i.e., types of patch) of natural and anthropogenic origin included in a meadow matrix.
Natural factors such as erosive bottom currents and extreme seasonal wave events shape the P. oceanica seascape by generating sand patches within the meadow matrix (Figure 1A) and restraining the development and colonization of the plant at shallow depths (Gobert et al., 2016; Vacchi et al., 2017). Natural patches derived from bottom currents present a structural duality with an eroded vertical matte edge opposed to a colonized one (Abadie et al., 2017). In addition, the particle flux within the canopy drives the meadow's vertical growth and results in the elevation of the matte, i.e., a complex of dead/living rhizomes, roots, and sediments (Boudouresque and Jeudy De Grissac, 1983).
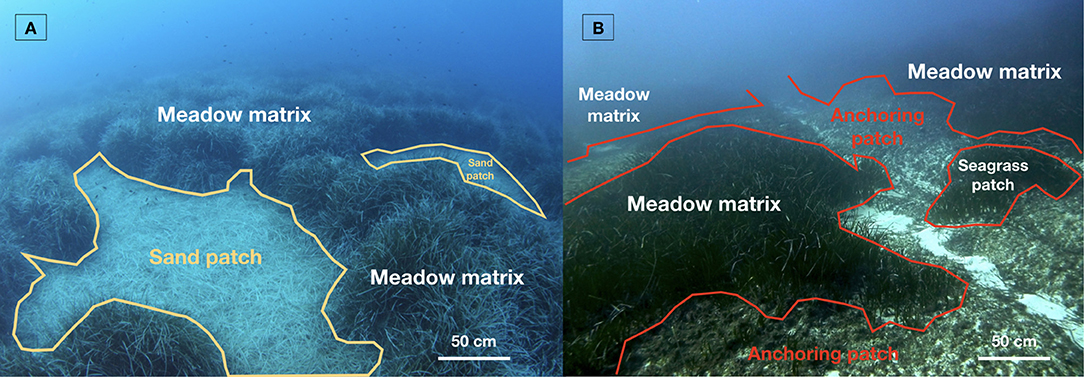
Figure 1. Two contrasted P. oceanica seascapes in Calvi Bay at 20 m depth (Corsica, France): (A) a natural seascape made of sand patches generated by water movements; (B) a seascape impacted by intensive anchoring leading to dead matte patches. Photos: A. Abadie.
Anthropogenic impacts are more diverse and may affect the seascape structure with contrasted dynamics given their origin (Giakoumi et al., 2015). Mechanical impacts such as anchoring (Figure 1B), trawling, explosions, and costal urban development lead to the immediate disappearance of the seagrass and the creation of dead matte patches (Meinesz and Lefèvre, 1983; Francour et al., 1999; Kiparissis et al., 2011). Other human activities that persist over time such as fish farming, sewage outfalls, and dredging may also create dead matte patches within the P. oceanica matrix through over-sedimentation, organic matter overload, and light availability reduction. These persisting processes take months or even years to affect the meadows in contrast to the previous (Pergent-Martini et al., 1995; Holmer et al., 2008; Boudouresque et al., 2009).
According to the various dynamics of patches composing the P. oceanica seascape, the study of its changes requires a better understanding of processes involved at various spatial and temporal scales (Wedding et al., 2011). This information is needed when studying P. oceanica meadow changes for management or conservation purposes (Montefalcone et al., 2013). Nowadays, this knowledge is missing which restrains the use of practical seascape ecology as a standard tool for the study of seagrass meadows' evolution for decision makers and stakeholders. European directives, such as the Water Framework Directive (WFD) and the Marine Strategy Framework Directive (MSFD), aim at evaluating the ecological status of key marine ecosystems such as P. oceanica meadows (Gobert et al., 2009; Personnic et al., 2014). Consequently, the development of a seascape ecology approach specific to seagrass meadows is required. By studying the link between the structure of seagrass habitats, the distribution of its inhabiting organisms and changes occurring over time for the whole system, seascape ecology is a promising approach to addressing the management obligation ensuing from these directives (Abadie et al., 2018b).
To respond to this lack of knowledge for Mediterranean seascape management, an extensive research effort was performed at various temporal (seasonal to pluriannual) and spatial scales (several m2 to km2) in Calvi Bay (Corsica, France) to study natural and anthropogenic patch dynamics. First, a cartographic analysis of P. oceanica seascapes was performed at a large spatial scale using side scan sonar images allowing to classify patches according to their origin (Abadie et al., 2015). A second study focused on the characterization of the structure of meadows impacted by intensive anchoring and chemical dynamics within sediments of the resulting dead matte patches (Abadie et al., 2016). A third work presented results of long term investigation of the structural dynamics of sand patches resulting from water movement (Gobert et al., 2016). The most recent work compared sediment chemistry of natural sand patches at various depths and the resulting structural edge effect on the surrounding meadow (Abadie et al., 2017).
In this context, this work aimed to answer a fundamental question in the field of seagrass seascape ecology: do natural and anthropogenic patches within a meadow matrix show the same dynamics? More precisely, specific objectives of the present study were: (1) to provide a quantitative description of natural and anthropogenic anchoring patches' dynamics through a multidisciplinary approach and the acquisition of original results; (2) to merge these new findings with observations from previous studies on P. oceanica seascapes conducted in Calvi Bay in order to draw a general picture of P. oceanica seascapes' dynamics; (3) to bring new insights for seascape management for P. oceanica meadows and other seagrass ecosystems by suggesting an approach for large spatial scale investigations of their structural evolution.
Materials and Methods
Sampling Design and Study Sites
The sampling design was based on the comparison of (1) the characteristics of natural sand patches generated by water movements (both eroded and colonized sides are considered), (2) anthropogenic patches generated by anchoring, and (3) a continuous reference meadow with no human impact (Figure 2). The multidisciplinary approach (1) encompassed the growth rate and biometry of orthotropic rhizomes at the edge of the surrounding meadow, (2) the particle total deposition and resuspension inside patches as well as in the reference meadow, and (3) the spatial evolution of each patch. In order to take into account the influence of light and water movement reduction with increasing depth, this sampling design was repeated simultaneously at 10, 15, and 20 m depth.
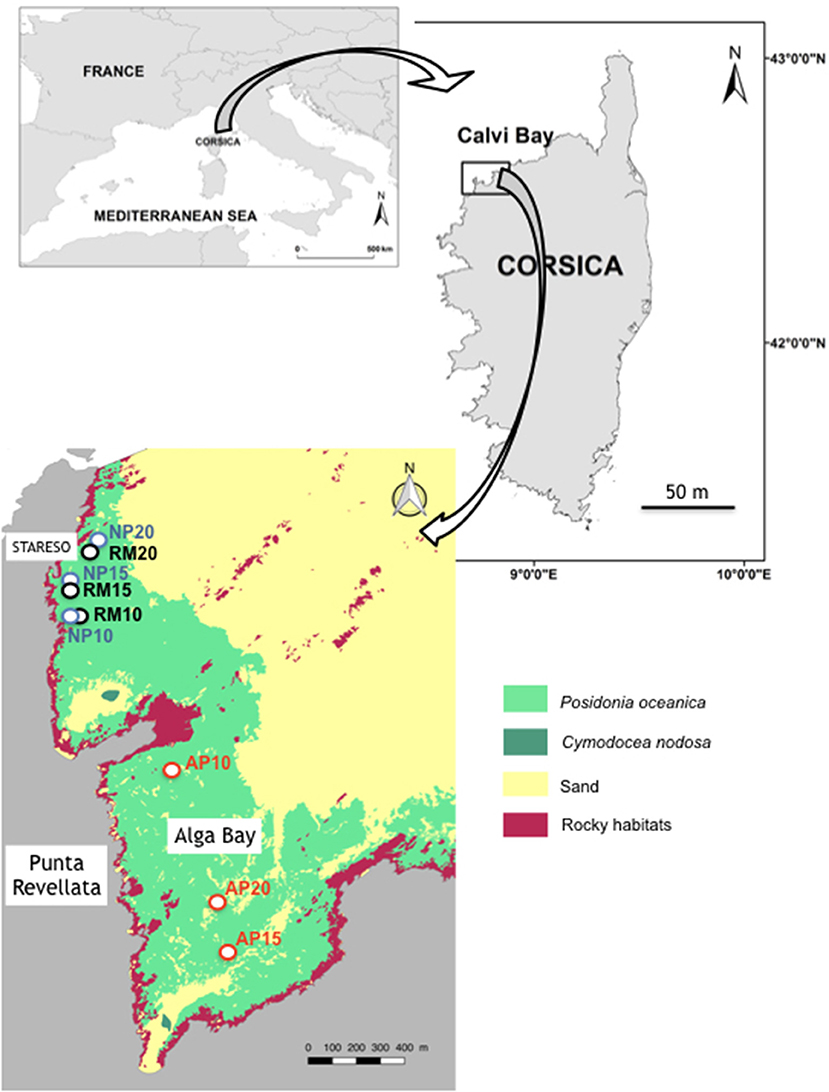
Figure 2. Location of study sites in the Calvi Bay. RM, reference meadow; NP, natural patch; AP, anchoring patch. Ten, fifteen, and twenty numbers are depths. Mapping data of marine habitat are from Abadie (2012).
Study sites were located in the Calvi Bay (Corsica, France), nearby the research station STARESO (Figure 3). Natural patches (NP) with their eroded (‘E) and colonized (‘C) edges (respectively, NPE and NPC), and the continuous reference P. oceanica meadow (RM) are located in the western part of the Bay near the extremity of the Punta Revellata (Figure 2). Eroded edges take the shape of a vertical wall of matte while colonized sides show plagiotropic rhizomes on bare sediments as described by Gobert et al. (2016). An intensive research effort has been performed on the P. oceanica meadows of this area since the 1970s where no mechanical anthropogenic impact has ever been observed (Michel et al., 2012). Anchoring patches (AP) are located in the smaller Alga sub-Bay at the basis of the Punta Revellata (Figure 2). An intensive anchoring pressure of leisure boats of various sizes, i.e., from 5 to 90 m long, has been reported for several decades in the Alga Bay. The origin of these anchoring patches was attested to through the observation of mechanical impacts along their edges corresponding to the abrasion resulting from anchor removal. Study sites nearby the STARESO research station and in the Alga Bay are the same than those studied by Abadie et al. (2016, 2017).
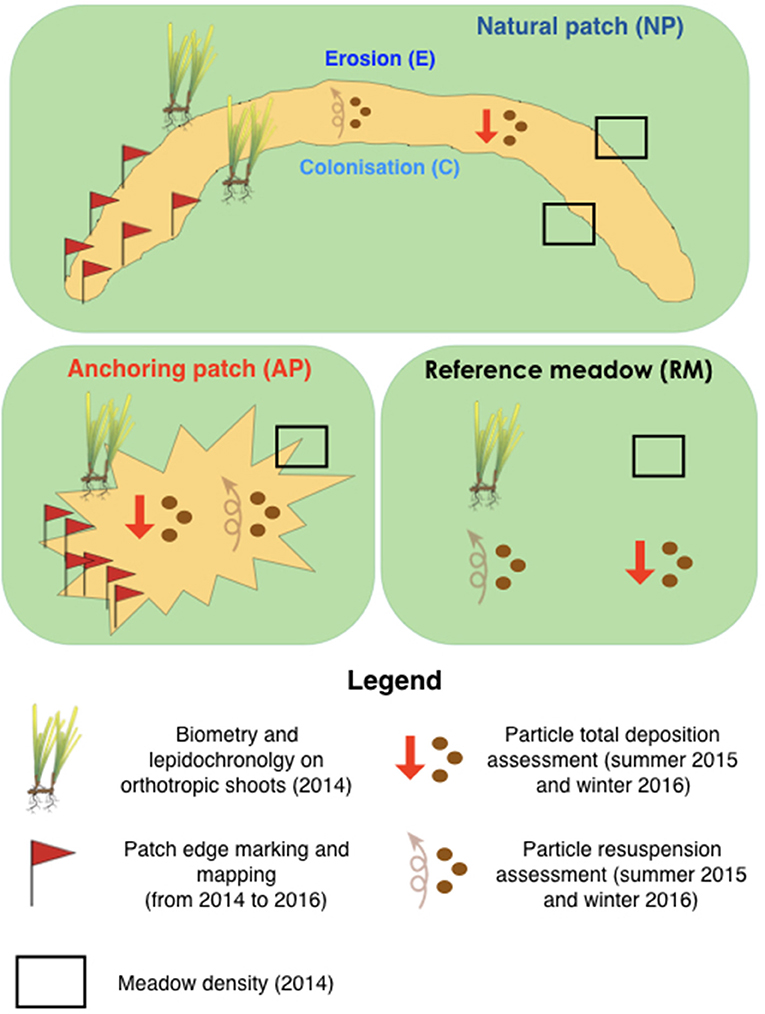
Figure 3. Sampling design encompassing lepidochronology, fine scale mapping, and biometry of orthotropic rhizomes, particle total deposition, and resuspension in natural and anchoring patches as well as in a continuous reference P. oceanica meadow.
Patch Marking and Mapping
Six patches (two at each depth) were mapped using the method of Gobert et al. (2016) to monitor their surface evolution between 2014 and 2016 (Figure 3). Patch borders were marked out with labeled pegs anchored 50 cm deep in the sediments. A fine scale map was then obtained using triangulation measurements between pegs, i.e., by measuring the distance and orientation of each peg from the other. Each year, the distance between each peg and the nearest meadow border was measured and then reconstructed in a GIS software (QGis 3).
Biometry, Rhizome Growth, and Meadow Density
Twenty orthotropic P. oceanica shoots were sampled in winter 2014 in each station (RM, NPE, NPC, AP) at each depth (10, 15, and 20 m; Figure 2) for a total of 240 shoots. Leaf surface was measured using the method of Giraud (1979). Rhizome growth and the number of new scales per year were measured using lepidochronology (Pergent et al., 1989). This method reconstructs the yearly chronological cycle of leaves' development through the measurement of their scale thickness. Ten replicates of the meadow density were randomly performed at each station using 25 × 40 cm quadrats using the method of (Giraud, 1977).
Particle Flux
The particle flux, i.e., total deposition and resuspension, was investigated using the particle traps developed by Gacia et al. (1999). Traps were deployed and retrieved using SCUBA. Total deposition traps took the shape of PVC stands supporting centrifugation tubes with an aspect ratio of the opening around 3, each stand encompassing five tubes (Figure 4A). They were deployed 20 cm above the substrate. Particle resuspension traps were PVC ropes with four tube levels starting at 20 cm from the substrate and separate from each other by 20 cm (i.e., at 0.2, 0.4, 0.6, and 0.8 m high). Each tube level was composed of five tubes, for a total of 20 tubes (Figure 4B). Tube levels were placed in a spiral fashion in order to avoid masking by upper ones (Figure 4B). Three total deposition traps (n = 15 tubes) and one resuspension traps (n = 20 tubes) were deployed during 8 days at each depth in natural (NP) and anchoring patches (AP) and in the continuous reference meadow (RM). After retrieval, the content of particle traps was immediately filtered in STARESO's laboratory using pre-weighted GF/F filters with diameter of 25 mm. Filters and their particle content were dried at 60°C during 4 days before being weighted again using a Mettler AJ100 scales with 0.0001 g precision. Results were expressed in gDW.m−2.d−1 taking into account the 0.000573 m2 opening area of the tubes and the 8 days of underwater deployment.
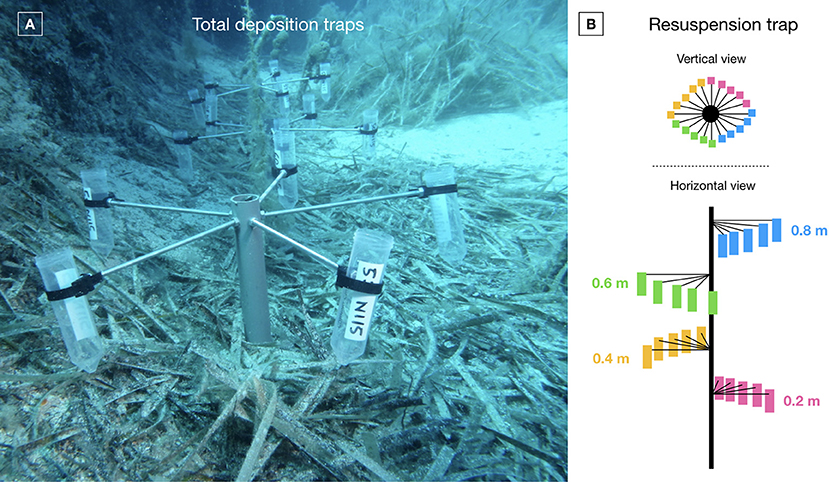
Figure 4. (A) Total deposition traps in a natural patch (photo: A. Abadie); (B) Schematic vertical and horizontal views of a resuspension trap.
Statistical Analyses
Statistical analyses were performed under the R 3.5.1 software (R Development Core Team, 2018) using the FactoMineR package. The normality of leaf surface, meadow density, rhizome growth, and scale number residual distribution were tested by Shapiro–Wilk statistic. Differences between stations (NPE vs. NPC vs. AP vs. RM) were tested for each depth (10, 15, and 20 m) with an ANOVA, after checking for homoscedasticity using the Fisher test. The Kruskal-Wallis test was performed when ANOVA assumptions were not met. ANOVAs and Kruskal-Wallis tests were followed by post-hoc Tuckeys' or Dunns' multiple comparison test of means, respectively. The same statistical approach was applied to total deposition data.
Results
Natural patches showed similar areas ranging between 136.8 and 143.9 m2 (Table 1; Figure 4) but had disparities in their total edge length varying between 67.1 to 97.3 m at a depth of 20 and 15 m, respectively (Table 1). Anchoring patches showed a strong dimorphism both in terms of area [1.0 and 0.8 m2 at 10 and 15 m depth, respectively, but 90.6 m2 at 20 m depth; Figure 4)] and total edge length (4.1 and 4.8 m at 10 and 15 m depth, respectively, and 45.2 at 20 m depth; Table 1).
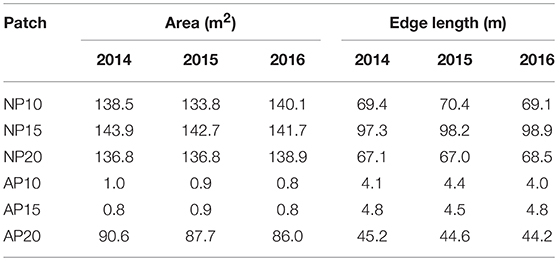
Table 1. Evolution of natural and anthropogenic patch area (m2) and edge length (m) between 2014 and 2016.
Although natural patches showed a clear dichotomous morphology between erosion and colonization (i.e., two continuous edges), edges of anchoring patches were an alternation of colonization and erosion without any distinct pattern (Figure 5). The percentage of the edge colonized among natural patches (NP) varied from 57.1% at 20 m depth to 77.3% at 10 m depth (Figure 6). Erosion speed (ranging from 10.5 to 15.6 cm.a−1) exceeded colonization speed (ranging from 6.5 to 8.4 cm.a−1) at all depths (Figure 6). A different pattern was observed for anchoring patches (AP) with contrasted percentage of erosion: 28.7% at 10 m depth, 59.3% at 15 m depth, and 25.4% at 20 m depth, respectively (Figure 6). Erosion speed was similar to colonization speed at 10 m depth (AP10, 5.5 an,d 4.7 cm.a−1,, respectively; Figure 6). In contrast, at 15 and 20 m depth, colonization speed (5.2 cm.a−1 at 15 m depth and 8.0 cm.a−1 at 20 m depth) speed exceeded erosion (3.7 cm.a−1 at 15 m depth and 2.7 cm.a−1 at 20 m depth; Figure 6).
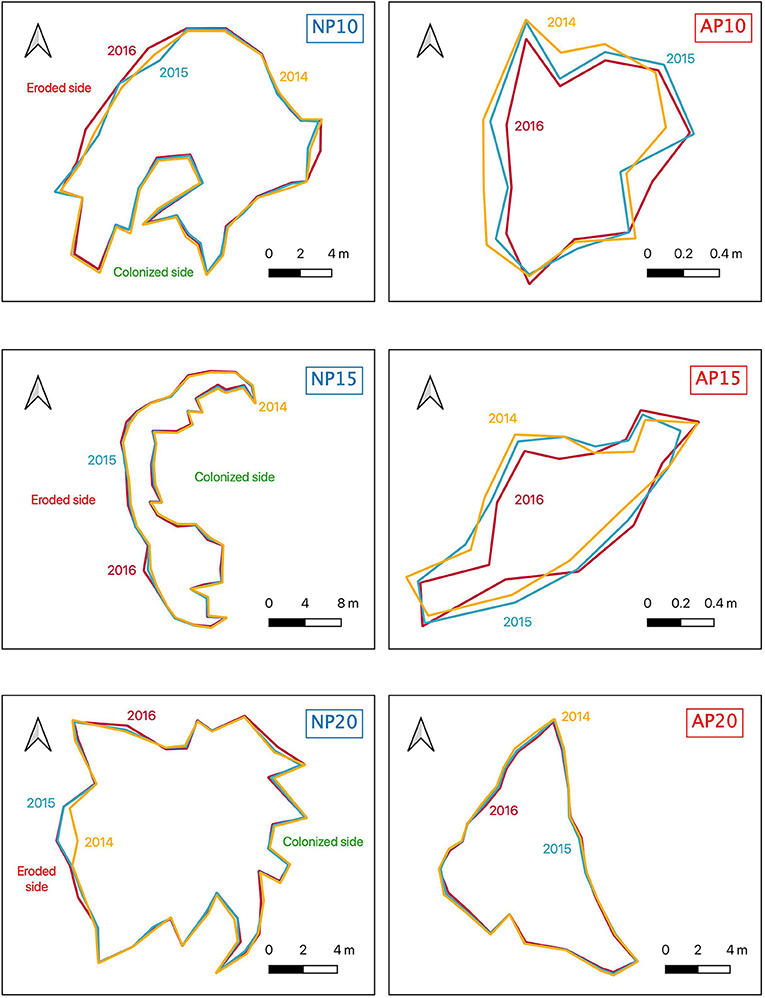
Figure 5. Maps of the borders of natural (NP10, NP15, NP20) and anchoring patches (AP10, AP15, AP20) in 2014 (yellow), 2015 (blue), and 2016 (red). The position of the eroded and the natural sides are indicated for natural patches.
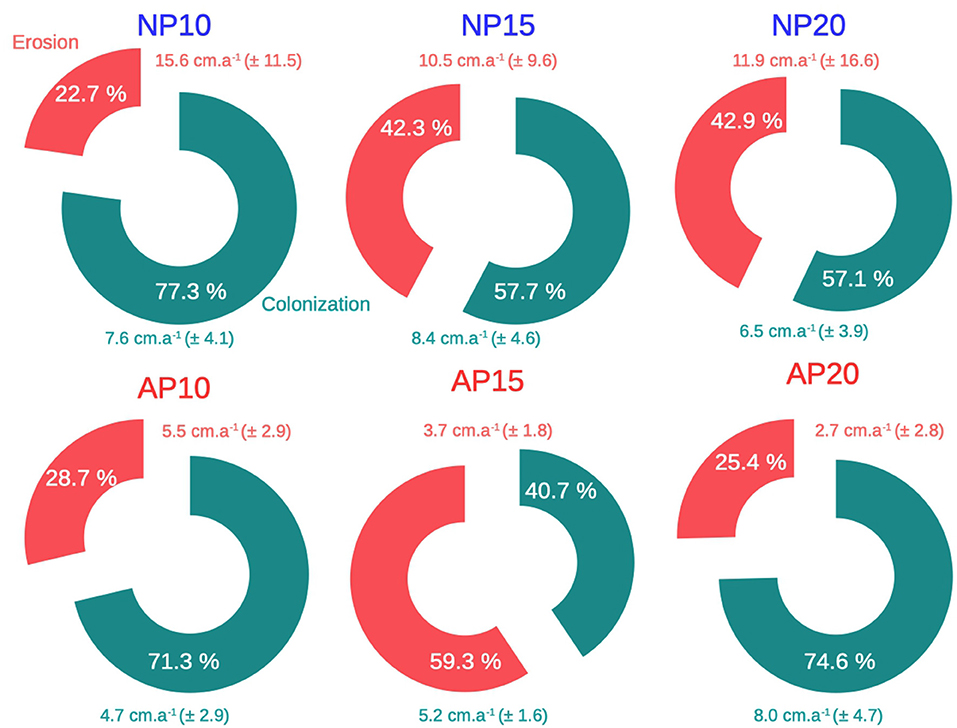
Figure 6. Mean erosion (red) and colonization (green) in cm.a−1 over the edge of natural (NP) and anchoring (AP) patches at 10, 15, and 20 m depth between 2014 and 2016. Mean erosion and colonization speeds are expressed ± their standard deviation. Percentages represent the edge proportion of erosion and colonization over the whole patch perimeter.
The maximum mean leaf surface was measured at 10 m depth at AP10 (254.5 cm2.shoot−1; Figure 7). Significant differences were found between stations (ANOVA: F = 4.856; p < 0.0001; df = 11). NPE10 mean leaf surface was smaller than AP10 and NPC10 ones (Figure 7). Mean shoot density showed a pick value at 10 m depth at NPC10 (630 shoots.m−2; Figure 7). Significant differences were found between stations (ANOVA: F = 19.5; p < 0.0001; df = 11). Fifteen meter depth station NPE15 mean shoot density was higher than AP15 one (Figure 7). Rhizome growth followed a different pattern with both lowest (5.55 mm.a−1, RM10) and highest (13.65 mm.a−1, NPC10) mean values recorded at 10 m depth, all stations considered (Figure 7). Significant differences were found between stations (Kruskal-Wallis test = 182.9; p < 0.0001). Post-hoc Dunn's tests highlighted strong disparities between most stations at 10 m depth and between RM15 and NPE15 at 15 m depth (Figure 7). Finally, the maximum mean leaf scale number produced per year was recorded at station NPE20 (9.3 scales.a−1; Figure 7). Like for the other three parameters, significant differences were found between stations (Kruskal-Wallis test = 100.0; p < 0.0001). These differences were observed at 15 m depth between stations RM15 and AP15 and between stations NPC15 and AP15 (Figure 7).
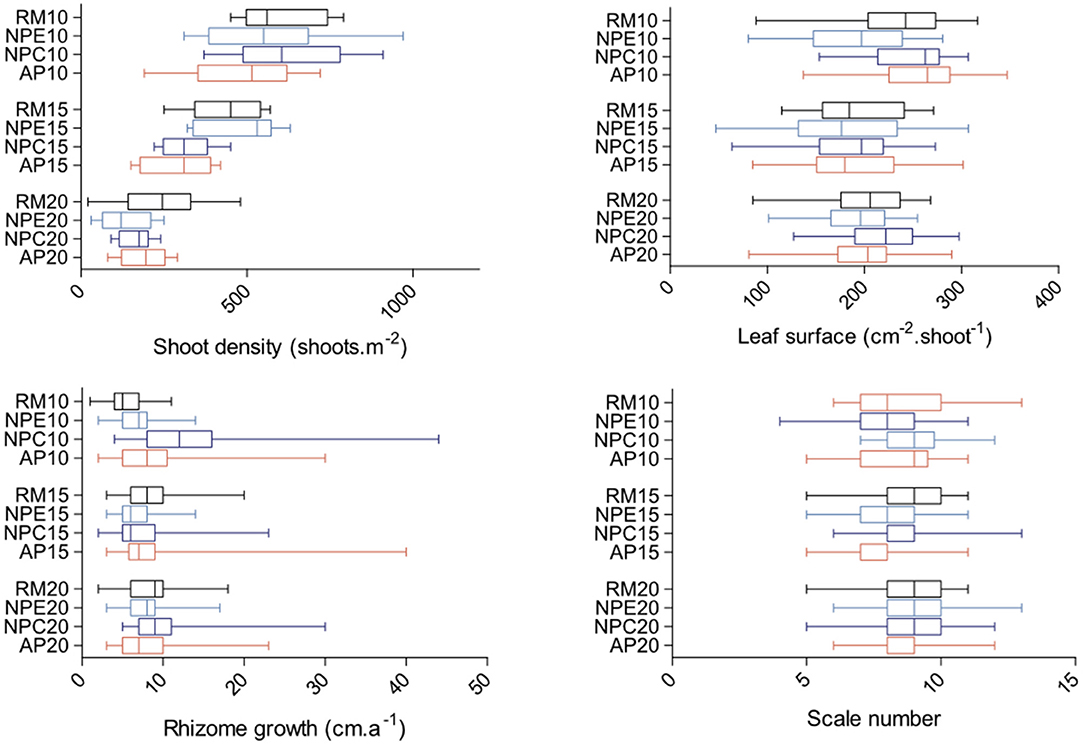
Figure 7. Boxplots of leaf surface (cm−2.shoot−1), shoot density (shoots.m−2), rhizome growth (cm.a−1), and leaf scale number per year (scales) for each of the 12 monitored stations (RM, reference meadow, black; NPE, natural patch erosion, clear blue; NPC, natural patch colonization, dark blue; AP, anchoring patch, red) at either 10, 15, or 20 m depth. Double bars represent minimum and maximum values.
The maximum mean total deposition is observed at station AP20 both in summer 2015 and winter 2016 with 6.38 and 112.60 gDW.m−2.d−1, respectively (Figure 8). Significant differences were found between stations both in summer 2015 (Kruskal-Wallis test = 56.9; p < 0.0001) and in winter 2016 (Kruskal-Wallis test = 120.7; p < 0.0001). In summer, post-hoc Dunn's tests revealed differences between station RM15 and the two other 15 m depth stations, and between 20 m depth stations RM20 and AP20 (Figure 8). Although mean total particle deposition at 10 and 15 m depth are of the same order in summer 2015 and winter 2016 (ranging from 2.44 to 8.51 gDW.m−2.d−1), far higher values were measured at 20 m depth in winter 2016 compared to summer 2015 with values ranging from 24.80 to 112.60 gDW.m−2.d−1 (Figure 8). Among the three stations RM20, NP20, and AP20, AP20 mean total deposition in winter 2016 was significantly higher (Kruskal-Wallis test = 32.55 p < 0.0001).
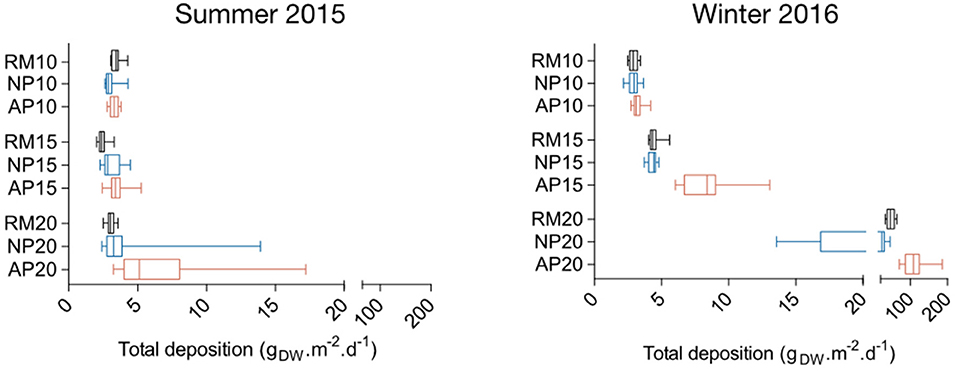
Figure 8. Boxplots of total particle deposition within natural (NP, blue) and anchoring patches (AP, red) and in continuous reference meadows (RM, black) at 10, 15, and 20 m depth in summer 2015 and winter 2016. Double bars represent minimum and maximum values.
A decrease of the vertical particle flux, or resuspension captured by traps was observed for all stations from 0.2 to 0.8 m above the seafloor (Figure 9). In summer 2015 at 10 and 15 m depth, the mean weight of trapped particles in the water column (0.8 m, ranging from 1.77 to 2.54 gDW.m−2.d−1) was similar to the one closest to the sea bottom (0.2 m, ranging from 2.31 to 3.37 gDW.m−2.d−1; Figure 9). Resuspension at 0.2 m above the sea bottom showed the same disparities than for total deposition (Figures 8, 9). At 20 m depth stations in summer 2015, a higher mean weight of trapped particles were measured at all sampling heights. At station AP20 in particular, mean values ranged from 3.06 gDW.m−2.d−1 0.8 m above the seafloor to 4.63 gDW.m−2.d−1 0.2 m above (Figure 9). In winter 2016, higher amounts of particles were trapped in the 0.8 m water column height above the seafloor, these amounts further increasing with the depth. The mean weight of particles was similar between the three stations at 10 m depth (Figure 9). At 15 and 20 m depth, stations AP15 and AP20 showed much higher amount of particles in the water column compared to RM and NP stations especially as we got closer to the sea bottom, with mean values ranging, respectively, from 4.12 to 8.82 gDW.m−2.d−1 and from 50.78 to 155.44 gDW.m−2.d−1 (Figure 9).
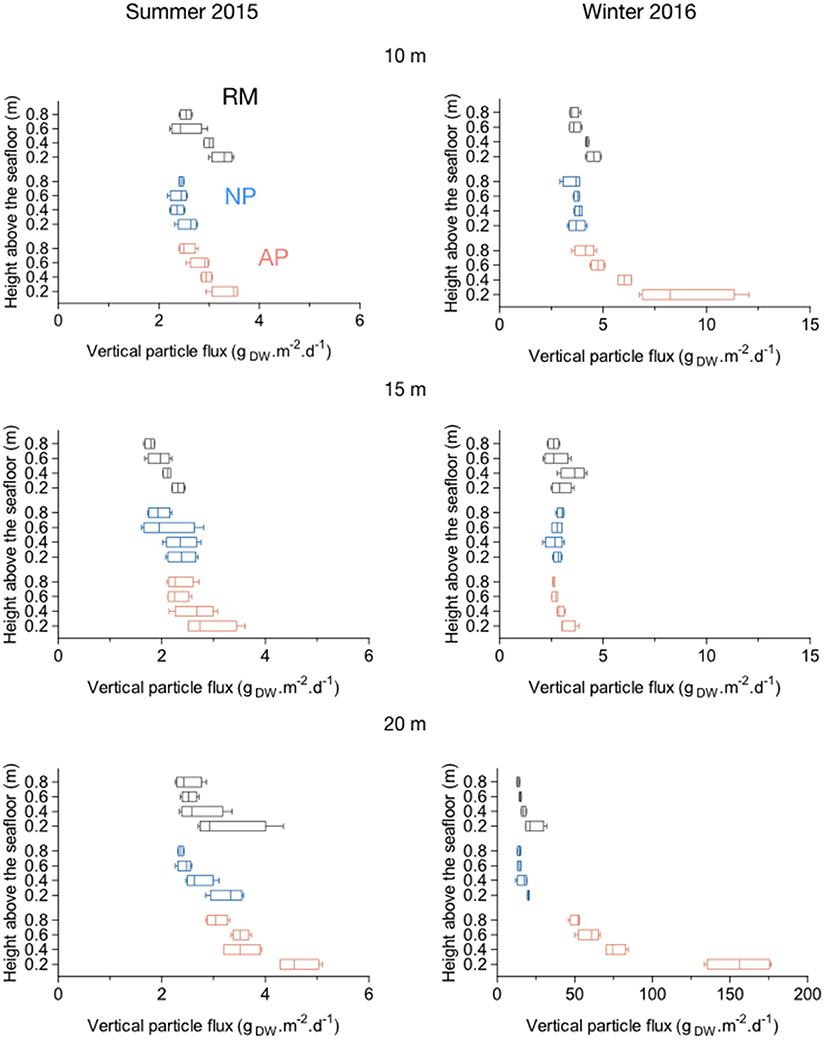
Figure 9. Boxplots of vertical particle fluxes (resuspension) within natural (NP) and anchoring patches (AP) and in continuous reference meadows (RM) at 10, 15, and 20 m depth in summer 2015 and winter 2016. Double bars represent minimum and maximum values.
Discussion
The aim of the present study was to answer a fundamental question in the field of seagrass seascape ecology: do natural and anthropogenic patches within a meadow matrix show the same dynamics? We have addressed this conservation issue through a multidisciplinary approach coupling spatial investigations, biometric analysis, and a particle flux evaluation. From field and laboratory measurements, it is clear that natural and anthropogenic patches (here anchoring patches) show contrasted structural dynamics. But how does this assertion provide new insights in the field of seagrass conservation and management? To discuss this aspect of seagrass seascape ecology, we will consider together results from the present study and findings of previous researches conducted in the Calvi Bay on P. oceanica seascapes (Abadie et al., 2015, 2016, 2017; Gobert et al., 2016). Through an upscaling approach, we will conclude by suggesting a large spatial use of these data through extensive mapping.
Colonization vs. Erosion: A Balanced Process?
Prior to any consideration about the colonization and erosion dynamics, it is worth noting that natural sand patches and anchoring dead matte patches are not similar in terms of shape and area (Pasqualini et al., 1999; Boudouresque et al., 2012; Abadie et al., 2015). In the present study, we did not find in the Calvi Bay anchoring patches matching the size of natural ones at 10 and 15 m depth (Figure 4). But these observations do not imply that large anchoring patches do not exist elsewhere along the Mediterranean coast at these depths. The study of Ganteaume et al. (2005) in Port-Cros (France) at 9 m depth supports this assertion, although no distinctions were made by these authors among intermatte—i.e., patch—types.
Due to these disparities in size and shape, a relative approach was chosen to study the duality between the erosion and the colonization processes occurring at their edge. The natural patch at 10 m depth showed a higher proportion of colonized than eroded edge. In contrast, patches at 15 and 20 m depth showed balanced proportions of both edge types (Figure 6). This finding may seem unlikely since patches at 10 m depth are more exposed to water movements generated by waves and extreme storm events (Vacchi et al., 2012). This is counterbalanced by the erosion speed which exceeded the colonization one at all depths. While light availability at 20 m depth reduces P. oceanica capacity to colonize raw substrates (Marba and Duarte, 1998; Di Maida et al., 2013), light and water movement conditions at 10 and 15 m depth are optimal for the plant development (Elkalay et al., 2003) thus leading to higher colonization rates at the latter depths. This proportional balance between eroded and colonized edges at 20 m depth coupled with a higher erosion speed results in the creation of large patches with an “ovoid” shape (Abadie et al., 2015). At 15 m depth, the higher colonization speed creates narrow corridors (Boudouresque et al., 1980; Gobert et al., 2016). These observations support the theory of Abadie et al. (2015) that described a succession of natural patches with various shapes from the seaward limit of the meadow to the landward according to water movement intensity and light availability.
Contrary to natural patches, anchoring patches showed a more erratic pattern of their proportions of colonized and eroded edges along the 10–20 m depth bathymetric gradient. However, when looking at their surface dynamics, we observed that colonization rate exceeded erosion, except for the patch at 10 m depth. These findings on the favorable dynamics of recolonization are contrary to Abadie et al. (2016) theory on patch extension due to H2S chemical damages in anchoring dead matte patches. Indeed, these authors measured high H2S concentrations at 10 cm depth within the dead matte of anchoring patches theoretically unfavorable to any efficient recolonization by the seagrass. In addition, the colonization process at patch edges involving plagiotropic rhizomes with few cm long roots (Gobert et al., 2016). So although anchoring patches are recolonized, the very slow growth rate of the plant (Boudouresque et al., 1983; Marba and Duarte, 1998) moderates any recovery optimism. Thereby, according to the proportion of colonized edges and colonization speed rate by plagiotropic shoots, it would take about 27 years for the 0.83 m2 anchoring patch at 15 m depth to be fully recolonized by P. oceanica (erosion excluded). For the largest 90 m2 anchoring patch investigated at 20 m depth, it would take about 60 years for the plant to recolonize the area. These time estimates are much longer that what would be expected from recolonization rates measured in the present study Moreover, they do not take into account the persistent anchoring pressure that delays meadow recovery. Part of the explanation could rely on the influence of P. oceanica morphology on the structural dynamic of patch edges.
Influence of P. Oceanica Morphology on the Structural Dynamic of Patch Edges
The structural dynamics and recolonization rates of both natural and anchoring patches rely certainly on the morphology of plants growing at their colonization edges. According to our data it is, however, hard to highlight any specific morphological traits of the meadow at the edge of patches explaining those dynamics. Leaf surface and meadow shoot density were similar among patch edges, and differences were observed between patch edges and the continuous reference meadows regarding rhizome growth rate and the number of new leaves. More specifically, rhizome growth was higher at the colonized edge of the natural patch at 10 m depth (Figure 7). High vertical growth of orthotropic rhizomes suggests high sedimentation rates (Boudouresque and Jeudy De Grissac, 1983; Alcoverro et al., 1995). High vertical growth ensures the formation of stronger matte providing better protection against water movements and extreme wave events (Vacchi et al., 2017) and therefore reducing the proportion of edge eroded. In a previous study, Abadie et al. (2017) reported that chemical and morphologic characteristics of natural patch edges in the Calvi Bay at different depths showed clear disparities: hydrodynamism is the main driver of patch dynamics through erosion which leads to changes in sediment biochemistry and the plant biological adaptations for colonization.
A contrasted statement was made by Abadie et al. (2016) regarding anchoring. These authors showed that anchoring pressure did not clearly affect P. oceanica meadow morphology at 10 m depth but had a direct mechanical action at 15 and 20 m depth by generating dead matte areas. Similar observations in the present study confirmed their statement. Few morphological adaptations of the plant foliar structure were observed except regarding the number of leaves produced over time that was lower at 15 and 20 m depth at the colonization edge of anchoring patches. These few differences could indicate a relocation of internal resources from leaf production to rhizome horizontal growth (Lepoint et al., 2004; Almela et al., 2008) as revealed by the higher colonization rate.
Particle Flux Within Anchoring Patches
At this stage of the discussion, it is obvious that the main drivers of the dynamics of natural and anchoring patches are the hydrodynamism and the mechanical damages caused by anchors respectively. As “gaps” within continuous meadows, patches modify the particle flux over the whole P. oceanica seascape. Indeed, continuous meadows are known to efficiently trap suspended particles within the canopy (Dauby et al., 1995; Terrados and Duarte, 2000), while unvegetated areas show higher resuspension rates (Gacia et al., 1999). But what about small unvegetated areas within P. oceanica meadows, i.e., natural and anchoring patches within the meadow matrix?
Our results showed that the reference continuous meadow reduced particle resuspension thanks to the leaf canopy. Similarly to large unvegetated areas, natural patches showed high resuspension rates of particles (Gacia and Duarte, 2001). Anchoring patches also act as sediment traps but in a different way. This difference was especially observed in winter at 15 and 20 m depth for patches AP15 and AP20 that showed morphological particularities. AP15 had a roughly circular shape forming a cauldron-like hole inside the matte. Such an ideal aspect ratio easily trapped suspended particles. In contrast, AP20 was a vast area of dead matte with little relief favoring suspended particle retention. From these structural differences, we can assume that superficial dead matte, recently created by anchoring, composed of dead roots and rhizomes and not yet fully filed with sediments, may continue to trap suspended particles from the water column until filling.
The recolonization process of anchoring patches suggests that the higher particle deposition rates observed act as a positive feedback (Maxwell et al., 2017) by providing an organic matter-rich substrate. On the contrary, the high hydrogen sulfide concentrations measured by Abadie et al. (2016) at the very same stations reveal an additional negative feedback. The apparent resilience of P. oceanica meadows to anchoring damages in this area may derive from the overall good biological and physical conditions in Alga Bay (e.g., low algal cover, good water quality, stable climate, trophic interactions) (Unsworth et al., 2015).
Upscaling for Management Purpose
One of the main interests of stakeholders managing coastal areas colonized by P. oceanica meadows is to detect hotspots of anthropogenic impacts and to quantify abnormal regression of these meadows. Since the purpose of seascape ecology is to deal with large spatial scales (hectares to hundreds of km2), small scale studies of patch dynamics such as the present work must be upscaled to become useful managing tools. Previous works have shown that acoustic imagery using side scan sonars allow to detect and map depth limits of seagrass meadows (Pasqualini et al., 1998; Montefalcone et al., 2013) and to identify natural and anthropogenic patches (Pasqualini et al., 1999; Leriche et al., 2006). From a study of Abadie et al. (2015), it is now possible to detect, classify, and discriminate natural and anthropogenic patches along the Corsican coast from side sonar images. However, although side scan sonars provides high resolution images, their positioning precision is, at best, at several meters (Brissette and Clarke, 1999).
Due to the slow growth of P. oceanica and the centimetric annual evolution of patches revealed in the present study, it is obvious that a metric positioning accuracy is not sufficient to properly investigate the spatial evolution of P. oceanica seascapes. The solution of this issue relies on the use of another acoustic sensor able to provide acoustic imagery at large spatial scale as well as a centimetric positioning precision: the multibeam echo sounder (Le Bas and Huvenne, 2009). Moreover, new algorithms are currently under development to use multibeam echo sounder bathymetric data to detect seagrass meadows (Abadie et al., 2018a).
Conclusion
This study highlighted the dichotomous spatial evolution of natural and anchoring patches within the P. oceanica seascape and their disparities in terms of particle trapping, together leading to contrasted dynamics. Such punctual observations, when upscaled to the whole seascape through large-scale mapping, could bring new insight into the evolution of seagrass meadows.
High precision large spatial scale mapping through pluriannual surveys will provide managers and stakeholders with maps highlighting hotspots of seagrass meadow cover which is increasing or decreasing. However, to this day, precise information (metric to centimetric) on large-scale distribution of marine organisms is widely missing, especially for benthic key species like seagrasses. The development of new underwater mapping techniques such as the multibeam echo sounder will soon fill this lack of precise information. Finally, from a wider viewpoint, as the coastal fringe is a continuum of the terrestrial coastal environment, the fusion of land and underwater maps will bring about new insights to the comprehension of their interconnection (e.g., mangroves to seagrass meadows) and will be a powerful tool for large-scale management and conservation.
Author Contributions
AA was responsible for the write-up of introduction, methods results, and discussion. AA, JR, and ML carried out the experiment and data collection. SG and PL supervised and advised AA on experimental design and write-up. SG and JR edited and added text to manuscript throughout.
Funding
This research work was conducted in the framework, of the STARE-CAPMED (STAtion of Reference and rEsearch on Change of local and global Anthropogenic Pressures on Mediterranean Ecosystems Drifts) program funded by the Territorial Collectivity of Corsica and by The French Water Agency (PACA-Corsica). The first author acknowledges a Ph.D. grant (2013/0470) of the French ANRT (Association Nationale Recherche Technologie).
Conflict of Interest Statement
The authors declare that the research was conducted in the absence of any commercial or financial relationships that could be construed as a potential conflict of interest.
References
Abadie, A. (2012). Evolution des herbiers à Posidonia oceanica (L.) Delile dans la Baie de Calvi (Corse, France) et Influence de L'ancrage dans la Baie de l'Alga Marseille: Aix-Marseille University.
Abadie, A., Borges, A. V., Champenois, W., and Gobert, S. (2017). Natural patches in Posidonia oceanica meadows: the seasonal biogeochemical pore water characteristics of two edge types. Mar. Biol. 164:166. doi: 10.1007/s00227-017-3199-5
Abadie, A., Gobert, S., Bonacorsi, M., Lejeune, P., Pergent, G., and Pergent-Martini, C. (2015). Marine space ecology and seagrasses. Does patch type matter in Posidonia oceanica seascapes? Ecol. Indic. 57, 435–446. doi: 10.1016/j.ecolind.2015.05.020
Abadie, A., Lejeune, P., Pergent, G., and Gobert, S. (2016). From mechanical to chemical impact of anchoring in seagrasses: the premises of anthropogenic patch generation in Posidonia oceanica meadows. Mar. Pollut. Bull. 109, 61–71. doi: 10.1016/j.marpolbul.2016.06.022
Abadie, A., Marty, P., and Viala, C. (2018a). “BATCLAS index: a new method to identify and map with high resolution natural and artificial underwater structures on marine wind turbine sites.” in Wind Energy and Wildlife Seminar, 3rd (Artigues-prés-Bordeaux), 120–127.
Abadie, A., Pace, M., Gobert, S., and Borg, J. A. (2018b). Seascape ecology in Posidonia oceanica seagrass meadows: linking structure and ecological processes for management. Ecol. Indic. 87, 1–13. doi: 10.1016/j.ecolind.2017.12.029
Alcoverro, T., Duarte, C. M., and Romero, J. (1995). Annual growth dynamics of Posidonia oceanica- Contribution of large-scale versus local factors to seasonality. Mar. Ecol. Prog. Ser. 120, 203–210.
Almela, E. D., Marbà, N., Álvarez, E., Santiago, R., Martínez, R., and Duarte, C. M. (2008). Patch dynamics of the Mediterranean seagrass Posidonia oceanica: implications for recolonisation process. Aquat. Bot. 89, 397–403. doi: 10.1016/j.aquabot.2008.04.012
Bell, S. S., Fonseca, M. S., and Stafford, N. B. (2006). “Seagrass ecology: new contributions from a landscape perspective,” in Seagrasses: Biology, Ecology, and Conservation, eds A. W. D. Larkum, R. J. Orth, and C. M. Duarte (Dordrecht: Springer), 625–645. doi: 10.1007/978-1-4020-2983-7_26
Bell, S. S., and Hicks, G. R. F. (1991). Marine landscapes and faunal recruitment: a field test with seagrasses and copepods. Mar. Ecol. Prog. Ser. 73, 61–68.
Boudouresque, C. F., Bernard, G., Bonhomme, P., Charbonnel, E., Diviacco, G., Meinesz, A., et al. (2012). Protection and Conservation of Posidonia oceanica Meadows. Tunis: RAMOGE pub.
Boudouresque, C. F., Bernard, G., Pergent, G., Shili, A., and Verlaque, M. (2009). Regression of Mediterranean seagrasses caused by natural processes and anthropogenic disturbances and stress: a critical review. Bot. Mar. 52, 395–418. doi: 10.1515/BOT.2009.057
Boudouresque, C. F., and Jeudy De Grissac, A. (1983). L'herbier à Posidonia oceanica en Méditerranée: les interactions entre la plante et le sédiment. J. Rech. Océanogr. 8, 99–122.
Boudouresque, C. F., Jeudy De Grissac, A., and Meinesz, A. (1983). “Relations entre la sédimentation et l'allongement des rhizomes orthotropes de Posidonia oceanica dans la baie d'Elbu (Corse),” in International Workshop on Posidonia oceanica Beds, eds C. F. Boudouresque, A. jeudy De Grissac, and J. Olivier (Marseille: G.I.S. Posidonie), 185–191.
Boudouresque, C. F., Thommeret, J., and Thommeret, Y. (1980). “Sur la découverte d'un bioconcrétionnement fossile intercalé dans l'herbier à Posidonia oceanica de la baie de Calvi (Corse),” in Journées d'Etude de Systématique et Biogéographie Méditerranéenne (Cagliari: CIESM pub.), 139–142.
Brissette, M., and Clarke, J. E. (1999). Side scan versus multibeam echo sounder object detection: Comparative analysis. Int. Hydrogr. Rev., 76, 21–34.
Dauby, P., Bale, A. J., Bloomer, N., Canon, C., Ling, R. D., Norro, A., et al. (1995). Particle fluxes over a Mediterranean seagrass bed: a one year case study. Mar. Ecol. Prog. Ser. 126, 233–246. doi: 10.3354/meps126233
Di Maida, G., Tomasello, A., Sciandra, M., Pirrotta, M., Milazzo, M., and Calvo, S. (2013). Effect of different substrata on rhizome growth, leaf biometry and shoot density of Posidonia oceanica. Mar. Environ. Res. 87–88, 96–102. doi: 10.1016/j.marenvres.2013.04.001
Elkalay, K., Frangoulis, C., Skliris, N., Goffart, A., Gobert, S., Lepoint, G., et al. (2003). A model of the seasonal dynamics of biomass and production of the seagrass Posidonia oceanica in the Bay of Calvi (Northwestern Mediterranean). Ecol. Modell. 167, 1–18. doi: 10.1016/S0304-3800(03)00074-7
Francour, P., Ganteaume, A., and Poulain, M. (1999). Effects of boat anchoring in Posidonia oceanica seagrass beds in the Port-Cros National Park (North-Western Mediterranean Sea). Aquat. Conserv. Mar. Freshw. Ecosyst. 9, 391–400.
Gacia, E., and Duarte, C. M. (2001). Sediment retention by a Mediterranean Posidonia oceanica meadow: the balance between deposition and resuspension. Estuar. Coast. Shelf Sci. 52, 505–514. doi: 10.1006/ecss.2000.0753
Gacia, E., Granata, T. C., and Duarte, C. M. (1999). An approach to measurement of particle flux and sediment retention within seagrass (Posidonia oceanica) meadows. Aquat. Bot. 65, 255–268. doi: 10.1016/S0304-3770(99)00044-3
Ganteaume, A., Bonhomme, P., Bernard, G., Poulain, M., and Boudouresque, C. F. (2005). Impact de l'ancrage des bateaux de plaisance sur la prairie à Posidonia oceanica dans le Parc national de Port-Cros (Méditerranée nord-occidentale). Sci. Rep. Port Cros Natl. Park. 21, 147–162.
Giakoumi, S., Halpern, B. S., Michel, L. N., Gobert, S., Sini, M., Boudouresque, C. F., et al. (2015). Towards a framework for assessment and management of cumulative human impacts on marine food webs. Conserv. Biol. 29, 1228–1234. doi: 10.1111/cobi.12468
Giraud, G. (1977). Essai de classement des herbiers de Posidonia oceanica (Linné) Delile. Bot. Mar. 20, 487–491.
Giraud, G. (1979). Sur une méthode de mesure et de comptage des structures foliaires de Posidonia oceanica (Linnaeus) Delile. Bull. Museum d'Histoire Nat. Marseille 39, 33–39.
Gobert, S., Lepoint, G., Pelaprat, C., Remy, F., Lejeune, P., Richir, J., et al. (2016). Temporal evolution of sand corridors in a Posidonia oceanica seascape: a 15-year study. Mediterr. Mar. Sci. 17, 777–784. doi: 10.12681/mms.1816
Gobert, S., Sartoretto, S., Rico-Raimondino, V., Andral, B., Chery, A., Lejeune, P., et al. (2009). Assessment of the ecological status of Mediterranean French coastal waters as required by the Water Framework Directive using the Posidonia oceanica rapid easy index: PREI. Mar. Pollut. Bull. 58, 1727–1733. doi: 10.1016/j.marpolbul.2009.06.012
Holmer, M., Argyrou, M., Dalsgaard, T., Danovaro, R., Diaz-Almela, E., Duarte, C. M., et al. (2008). Effects of fish farm waste on Posidonia oceanica meadows: Synthesis and provision of monitoring and management tools. Mar. Pollut. Bull. 56, 1618–1629. doi: 10.1016/j.marpolbul.2008.05.020
Jackson, E. L., Santos-Corujo, R. O., and Pittman, S. J. (2017). “Seascape patch dynamics,” in Seascape Ecology, ed S. J. Pittman (Hoboken, NJ: John Wiley and Sons), 153–188.
Kiparissis, S., Fakiris, E., Papatheodorou, G., Geraga, M., Kornaros, M., Kapareliotis, A., et al. (2011). Illegal trawling and induced invasive algal spread as collaborative factors in a Posidonia oceanica meadow degradation. Biol. Invas. 13, 669–678. doi: 10.1007/s10530-010-9858-9
Le Bas, T. P., and Huvenne, V. A. I. (2009). Acquisition and processing of backscatter data for habitat mapping–comparison of multibeam and sidescan systems. Appl. Acoust. 70, 1248–1257. doi: 10.1016/j.apacoust.2008.07.010
Lepoint, G., Vangeluwe, D., Eisinger, M., Paster, M., van Treeck, P., Bouquegneau, J.-M., et al. (2004). Nitrogen dynamics in Posidonia oceanica cuttings: implications for transplantation experiments. Mar. Pollut. Bull. 48, 465–470. doi: 10.1016/j.marpolbul.2003.08.023
Leriche, A., Pasqualini, V., Boudouresque, C. F., Bernard, G., Bonhomme, P., Clabaut, P., et al. (2006). Spatial, temporal and structural variations of a Posidonia oceanica seagrass meadow facing human activities. Aquat. Bot. 84, 287–293. doi: 10.1016/j.aquabot.2005.10.001
Marba, N., and Duarte, C. M. (1998). Rhizome elongation and seagrass clonal growth. Mar. Ecol. Prog. Ser. 174, 269–280. doi: 10.3354/meps174269
Maxwell, P. S., Eklöf, J. S., van Katwijk, M. M., O'brien, K. R., de la Torre-Castro, M., Boström, C., et al. (2017). The fundamental role of ecological feedback mechanisms for the adaptive management of seagrass ecosystems–a review. Biol. Rev. 92, 1521–1538. doi: 10.1111/brv.12294
Meinesz, A., and Lefèvre, J. R. (1983). “Régénération d'un herbier à Posidonia oceanica quarante années après sa destruction par une bombe dans la rade de Villefranche (Alpes-Maritimes),” in International Workshop on Posidonia oceanica Beds, eds C. F. Boudouresque, A. Jeudy De Grissac, and J. Olivier (Marseille: G.I.S. Posidonie), 39–44.
Michel, L., Abadie, A., Biondo, R., Borges, A., Collignon, A., Champenois, W., et al. (2012). STARE-CAPMED–Rapport D'activité 2012. STARESO.
Montefalcone, M., Rovere, A., Parravicini, V., Albertelli, G., Morri, C., and Bianchi, C. N. (2013). Evaluating change in seagrass meadows: a time-framed comparison of Side Scan Sonar maps. Aquat. Bot. 104, 204–212. doi: 10.1016/j.aquabot.2011.05.009
Pagès, J. F., Gera, A., Romero, J., and Alcoverro, T. (2014). Matrix composition and patch edges influence plant-herbivore interactions in marine landscapes. Funct. Ecol. 28, 1440–1448. doi: 10.1111/1365-2435.12286
Pasqualini, V., Pergent-Martini, C., Clabaut, P., and Pergent, G. (1998). Mapping of Posidonia oceanica using aerial photographs and side scan sonar : application off the Island of Corsica (France). Estuar. Coast. Shelf Sci. 47, 359–367.
Pasqualini, V., Pergent-Martini, C., and Pergent, G. (1999). Environmental impact identification along the Corsican coast (Mediterranean sea) using image processing. Aquat. Bot. 65, 311–320. http://dx.doi.org/10.1016/S0304-3770(99)00048-0
Pergent, G., Boudouresque, C. F., Crouzet, A., and Meinesz, A. (1989). Cyclic changes along Posidonia oceanica rhizomes (Lepidochronology) - present state and perspectives. Mar. Ecol. Pubbl. Stn. Zool. Napoli 10, 221–230.
Pergent-Martini, C., Pasqualini, V., and Pergent, G. (1995). Monitoring of the Posidonia oceanica meadow in proximity of the sea outfall from the sewage treatment plant at Marseille (Mediterranean, France). EARSeL Adv. Remote Sens. 4, 128–134.
Personnic, S., Boudouresque, C. F., Astruch, P., Ballesteros, E., Blouet, S., Bellan-Santini, D., et al. (2014). An ecosystem-based approach to assess the status of a mediterranean ecosystem, the Posidonia oceanica seagrass meadow. PLoS ONE 9:e98994. doi: 10.1371/journal.pone.0098994
Pickett, S. T. A., and Cadenasso, M. L. (1995). Landscape ecology: spatial heterogeneity in ecological systems. Science 269, 331–334. doi: 10.1126/science.269.5222.331
Pittman, S. J. (2017). “Introducing seascape ecology,” in Seascape Ecology, ed S. J. Pittman (Hoboken, NJ: John Wiley and Sons), 3–25.
Pittman, S. J., Kneib, R. T., and Simenstad, C. A. (2011). Practicing coastal seascape ecology. Mar. Ecol. Prog. Ser. 427, 187–190. doi: 10.3354/meps09139
R Development Core Team (2018). R: A Language and Environment for Statistical Computing. Vienna, Austria: R Foundation for Statistical Computing.
Robbins, B. D., and Bell, S. S. (1994). Seagrass landscapes: a terrestrial approach to the marine subtidal environment. Trends Ecol. Evol. 9, 301–304. doi: 10.1016/0169-5347(94)90041-8
Terrados, J., and Duarte, C. M. (2000). Experimental evidence of reduced particle resuspension within a seagrass (Posidonia oceanica L.) meadow. J. Exp. Mar. Bio. Ecol. 243, 45–53. doi: 10.1016/S0022-0981(99)00110-0
Turner, M. G. (1989). Landscape ecology: the effect of pattern on process. Annu. Rev. Ecol. Evol. Syst. 20, 171–197.
Unsworth, R. K. F., Collier, C. J., Waycott, M., Mckenzie, L. J., and Cullen-Unsworth, L. C. (2015). A framework for the resilience of seagrass ecosystems. Mar. Pollut. Bull. 100, 34–46. doi: 10.1016/j.marpolbul.2015.08.016
Vacchi, M., De Falco, G., Simeone, S., Montefalcone, M., Morri, C., Ferrari, M., and Bianchi, C. N. (2017). Biogeomorphology of the Mediterranean Posidonia oceanica seagrass meadows. Earth Surf. Process. Landf., 42, 42–54.
Vacchi, M., Montefalcone, M., Bianchi, C. N., Morri, C., and Ferrari, M. (2012). Hydrodynamic constraints to the seaward development of Posidonia oceanica meadows. Estuar. Coast. Shelf Sci. 97, 58–65. doi: 10.1016/j.ecss.2011.11.024
Keywords: seascape, seagrasses, dynamics, anthropogenic impacts, management, conservation
Citation: Abadie A, Richir J, Lejeune P, Leduc M and Gobert S (2019) Structural Changes of Seagrass Seascapes Driven by Natural and Anthropogenic Factors: A Multidisciplinary Approach. Front. Ecol. Evol. 7:190. doi: 10.3389/fevo.2019.00190
Received: 21 November 2018; Accepted: 09 May 2019;
Published: 31 May 2019.
Edited by:
Peter Convey, British Antarctic Survey (BAS), United KingdomCopyright © 2019 Abadie, Richir, Lejeune, Leduc and Gobert. This is an open-access article distributed under the terms of the Creative Commons Attribution License (CC BY). The use, distribution or reproduction in other forums is permitted, provided the original author(s) and the copyright owner(s) are credited and that the original publication in this journal is cited, in accordance with accepted academic practice. No use, distribution or reproduction is permitted which does not comply with these terms.
*Correspondence: Arnaud Abadie, arnaudabadie@aol.fr