Diatom DNA Metabarcoding for Biomonitoring: Strategies to Avoid Major Taxonomical and Bioinformatical Biases Limiting Molecular Indices Capacities
 Kálmán Tapolczai1,2*†
  François Keck3,4†
  Agnès Bouchez4,5 Frédéric Rimet4,5 Maria Kahlert3
  Valentin Vasselon6†
- 1Premium Postdoctoral Research Program, Hungarian Academy of Sciences, Budapest, Hungary
- 2Department of Limnology, University of Pannonia, Veszprém, Hungary
- 3Department of Aquatic Sciences and Assessment, Swedish University of Agricultural Sciences, Uppsala, Sweden
- 4INRA, UMR CARRTEL, Thonon-les-Bains, France
- 5University of Savoie Mont-Blanc, UMR CARRTEL, Le Bourget du Lac, France
- 6AFB, Pôle R&D “ECLA”, INRA, UMR CARRTEL, Thonon-les-Bains, France
Recent years provided intense progression in the implementation of molecular techniques in a wide variety of research fields in ecology. Biomonitoring and bioassessment can greatly benefit from DNA metabarcoding and High-Throughput Sequencing (HTS) methods that potentially provide reliable, high quantity and quality standardized data in a cost- and time-efficient way. However, DNA metabarcoding has its drawbacks, introducing biases at all the steps of the process, particularly during bioinformatics treatments used to prepare HTS data for ecological analyses. The high diversity of bioinformatics methods (e.g., OTU clustering, chimera detection, taxonomic assignment) and parameters (e.g., percentage similarity threshold used to define OTUs) make inter-studies comparison difficult, limiting the development of standardized and easy-accessible bioassessment procedures for routine freshwater monitoring. In order to study and overcome these drawbacks, we constructed four de novo indices to assess river ecological status based on the same biological samples of diatoms analyzed with morphological and molecular methods. The biological inventories produced are (i) morphospecies identified by microscopy, (ii) OTUs provided via metabarcoding and hierarchical clustering of sequences using a 95% similarity threshold, (iii) individual sequence units (ISUs) via metabarcoding and only minimal bioinformatical quality filtering, and (iv) exact sequence variants (ESVs) using DADA2 denoising algorithm. The indices based on molecular data operated directly with ecological values estimated for OTUs/ ISUs/ ESVs. Our study used an approach of bypassing taxonomic assignment, so bias related to unclassified sequences missing from reference libraries could be handled and no information on ecology of sequences is lost. Additionally, we showed that the indices based on ISUs and ESVs were equivalent, outperforming the OTU-based one in terms of predictive power and accuracy by revealing the hidden ecological information of sequences that are otherwise clustered in the same OTU (intra-species/intra-population variability). Furthermore, ISUs, ESVs, and morphospecies indices provided similar estimation of site ecological status, validating that ISUs with limited bioinformatics treatments may be used for DNA freshwater monitoring. Our study is a proof of concept where taxonomy- and clustering-free approach is presented, that we believe is a step forward a standardized and comparable DNA bioassessment, complementary to morphological methods.
Introduction
In the past several decades, use of bioindicator organisms has been widely adopted in order to monitor, maintain or develop the quality of water bodies worldwide. The permanently evolving field of freshwater ecology made freshwater biomonitoring an efficient tool, incorporated in national and international water management frameworks like the Clean Water Act (CWA; U.S. Congress, 1972) or the Water Framework Directive (WFD; European Commission, 2000).
The EU WFD uses four groups of organisms (i.e., Biological Quality Elements—BQEs) to assess ecological quality by comparing the community structure of the impacted sites to the community structure of a reference site considered not to be—or slightly—affected by anthropogenic alterations (Pardo et al., 2012). Experts faces several challenges depending on the BQE they are working on but they are all limited by the following factors: time consuming and costly sampling and preparation procedures, differences in expert knowledge and equipment for taxa identification, thus disharmony in taxa inventories among laboratories (Kahlert et al., 2012).
The recent intense development of DNA metabarcoding and High-Throughput Sequencing (HTS) techniques has set a new milestone in biomonitoring (Baird and Hajibabaei, 2012; Leese et al., 2016; Keck et al., 2017). Instead of the identification based on morphological features, this technique employs standard gene markers to identify taxa-specific sequences in the organism's DNA, serving as a barcode (Hebert et al., 2003). This method allows the simultaneous identification of multiple taxa from multiple environmental samples (Taberlet et al., 2012), being more time- and cost-effective than the classical methods, providing a fine-scale taxonomic characterization of communities, often revealing hidden diversity (Lindeque et al., 2013).
However, in order to use metabarcoding techniques as a routine biomonitoring tool, the standardization of the method is required. Extensive studies have been produced analyzing and suggesting solutions for the biases at each step of the metabarcoding process including the sampling, DNA extraction (Vasselon et al., 2017a), choice of the marker gene (Kermarrec et al., 2013) or the choice of the applied HTS technology (Loman et al., 2012; Shokralla et al., 2012). A further bias that can hamper the comparability among different analyses is the large variety of bioinformatic pipelines used to process HTS data. One step particularly critical is the clustering of the raw sequence data into operational taxonomic units (OTUs).
Molecular OTUs are widely used to describe microbial communities using HTS amplicon sequencing as proxies for species, generally using the 97% similarity threshold proposed initially for the 16S rRNA gene by Stackebrandt and Goebel (1994). Sequence clustering aims to reduce the noise in the data and provide a granularity close to that of the species delimitation. Clustering with a high sequence similarity threshold to create OTUs increases the risk of giving ecological sense to sequence errors and artifacts (Chen et al., 2013). However, Edgar (2018) proposed a recent update of this threshold to ~ 99–100% and several studies advocate the use of denoised DNA reads to avoid the biases linked to the choice of the clustering algorithm and the similarity threshold (Tikhonov et al., 2015; Edgar, 2016; Callahan et al., 2017). Exact Sequence Variant (ESV) are considered as unique DNA reads with biological meaning and they offer several advantages for community analyses compared to OTUs, including computational tractability, reproducibility of analysis and the possibility to perform meta-analyses from different studies (Callahan et al., 2017). Although the use of ESVs is an important step toward a better characterization of intraspecific genetic diversity (Elbrecht et al., 2018; Forster et al., 2019), they still rely on denoising algorithm that may introduce biases and lead to non-reproducible results (Nearing et al., 2018). In order to have the most reproducible bioinformatic treatments, one can also work with the so-called Individual Sequence Units (ISUs), composed by ESV and erroneous sequences that correspond to PCR and sequencing errors, thus applying strictly limited bioinformatic filters.
Biological indices based on the microalgae group, diatoms (Bacillariophyta phylum), are frequently used by scientists and environmental managers to assess the ecological status of ecosystems and their response to local pressures and global change. Numerous diatom indices are based on a simple equation that weights the ecological optimum of each detected species by its abundance and ecological tolerance (Zelinka and Marvan, 1961). In traditional indices, species ecological profiles (optimum and tolerance) are often directly obtained from a large set of data by using simple statistical descriptors of location (e.g., weighted mean) and dispersion (e.g., weighted standard deviation) along a pollution gradient. Interestingly, the morphospecies as a taxonomic unit of the traditional indices can be replaced by molecular taxonomic units, allowing to train a new type of biological indices, the so-called taxonomy-free indices (Apothéloz-Perret-Gentil et al., 2017; Tapolczai et al., 2019). So far, taxonomy-free indices have proved to be an efficient strategy to keep biological information carried by OTUs whose taxonomic assignment is otherwise not possible because of the incomplete reference library. Here, we propose to apply a similar strategy on ISU and ESV data, in order to limit the bias associated to OTU clustering and to improve the reproducibility and standardization of biomonitoring indices.
In our study, we compare different strategies to use biological data and provide quality assessment indices. Four diatom indices were developed, based on the ecological optimum and tolerance of morphospecies/OTUs/ISUs/ESVs calculated along an integrated environmental gradient, using the classical Zelinka-Marvan equation (1961). The first index is based on taxa inventory obtained via the microscopic identification of morphospecies and their relative abundance. The second index is based on OTU inventory without taxonomic assignment, obtained via DNA metabarcoding and hierarchical de novo clustering with 95% sequence similarity. The third strategy tested was the development of an index using ISUs. In this case no taxonomic assignment, nor clustering into OTUs were used. The last strategy used the DADA2 denoising algorithm to select ESVs from ISUs.
We hypothesize that by avoiding taxonomic assignment, clustering and denoising of ISUs, relevant sources of biases in the metabarcoding process are removed. This strategy is a step toward a standardized metabarcoding-based bioassessment without losing the indicator efficiency of the quality index and enabled to propose an easy transferable bioinformatics tool for stakeholders in charge of freshwater management.
Materials and Methods
Study Site and Sampling Network
The routine survey of the WFD monitoring network is carried out by French offices responsible for the monitoring and water quality assessment of rivers, including national agencies, and private consultancies. They are in charge of the chemical and biological surveys following the WFD recommendations, meaning that they realize the acquisition of physico-chemical parameters and the description of benthic diatom assemblages for each site.
Based on those available information, among the hundreds of French river sites annually surveyed for water quality assessment in the context of the WFD, 76 sites were selected from the 2016 national monitoring campaign following several criteria : (i) sites showed a gradient of pressure (e.g., organic pollution, turbidity, nutrients, etc.) allowing to obtain a water quality gradient from pristine to polluted conditions, (ii) sampling sites are distributed within the country (different river types), far enough to limit potential effects of non-independence among sampling sites during quality index construction, (iii) benthic diatom samples are available to perform morphological and molecular approaches and (iv) information on physico-chemical parameters is available for all the samples.
Physical and Chemical Parameters
For each site, environmental data were extracted from the French national database “Naïades” (http://www.naiades.eaufrance.fr/) over a period of 70 days (60 days preceding and 10 days following the biological sampling). For each environmental variable, we computed the mean value of all the records available during this time window. It resulted in a table of 76 rows (samples) and 15 columns (variables) without missing values. The environmental parameters kept are dissolved oxygen (O2), oxygen saturation (O2 sat), pH, Conductivity, nitrate (), nitrite (), ammonium (), total Kjeldahl nitrogen (TKN), total phosphorus (TP), phosphate (), temperature (T), total suspended solids (TSS), total organic carbon (TOC), biological oxygen demand (BOD5), and turbidity (Turb) (Table S1).
Diatom Sampling, Biofilm Sample Preparation, and Morphological Analysis
For each site, the biofilm containing benthic diatom communities was sampled from at least five submerged stones collected from the lotic parts of the rivers following European standards (European Committee for Standardization, 2016). The upper surface of the stones were scrubbed using a clean toothbrush at each sampling site and mixed into a tray. The samples were homogenized by manual shaking and divided into two subsamples, one for microscopic identification performed by national offices and one sent to our lab for molecular analysis. The subsamples were transferred into 50 mL Falcon tubes and preserved using 96% ethanol for a final ethanol concentration of at least 70% and stored at room temperature under dark conditions until preparation for morphological analysis and DNA extraction (performed within 6 months).
For the microscopic analysis, diatom samples were treated using 40% H2O2 and HCl according to the European standard (European Committee for Standardization, 2014). Permanent slides were prepared by mounting the cleaned diatom samples. Morphological analysis was carried out using microscope with 1,000x magnification objective. A minimum of 400 diatoms valves were determined using up to date identification literature.
Diatom DNA Metabarcoding
The preserved biofilm samples were homogenized by manual shaking and a volume of 2 mL of each sample was used as starter for DNA extraction. The samples were first centrifuged at 17,000 g during 30 min in order to remove the supernatant containing ethanol. Total genomic DNA was extracted from the remaining pellet using the Sigma-Aldrich GenEluteTM-LPA DNA precipitation protocol as described previously (e.g., Vasselon et al., 2017a) in a final elution volume of 30 μL.
PCR amplification of diatom communities was performed by targeting a short fragment (312 bp) of the Ribulose Bisphosphate Carboxylase Large subunit (rbcL) plastid gene, a DNA marker commonly used for diatom metabarcoding on lake and river samples (Rivera et al., 2018; Bailet et al., 2019; Chonova et al., 2019; Mortágua et al., 2019). The primer pair used to amplify the 312 bp rbcL region corresponds to the equimolar mix of 3 forward primer (Diat_rbcL_708F_1, Diat_rbcL_708F_2, Diat_rbcL_708F_3) and 2 reverse primers (R3_1, R3_2) as described in Vasselon et al. (2017b). Forward and reverse primers carry the 5′-CTTTCCCTACACGACGCTCTTCCGATCT-3′ and 5′-GGAGTTCAGACGTGTGCTCTTCCGATCT-3′ tails used to prepare Illumina libraries with a dual-step PCR approach (PCR1 and PCR2). For the PCR1, each DNA sample was amplified in triplicate in a final volume of 25 μL using the tailed rbcL primers and the Takara LA Taq® polymerase with PCR1 reaction mix and conditions detailed in the Table S2.
The 3 PCR1 replicates prepared for each DNA sample were pooled together and sent to the “GenoToul Genomics and Transcriptomics” facility (GeT-PlaGe, Auzeville, France) which performed: (i) the purification of PCR1 amplicons; (ii) the PCR2 amplification using PCR1 purified amplicon as template and Illumina-tailed primers allowing to add dual-index specific to each sample; (iii) the preparation of the final pool corresponding to an equimolar mix of the 76 PCR2 dual-indexed amplicons; (iv) the sequencing of the final pool on an Illumina MiSeq platform using the V3 paired-end sequencing kit (250 bp × 2).
Bioinformatics
Initial Bioinformatic Steps for ISUs and OTUs
The GeT-PlaGe sequencing platform assembled the MiSeq paired-end reads into full-length DNA sequences (paired sequences overlap >140 bp and mismatches <0.1%) and performed the demultiplexing of the 76 samples, providing 1 fastq file per sample. All the bioinformatics treatments were performed using Mothur software v1.39.5 (Schloss et al., 2009). Initial bioinformatic steps were applied to keep good quality DNA reads using the trim.seqs() command and the following parameters: a sequence length of 263 ± 10 bp (rbcL barcode length without primers), a Phred quality score ≥23 over a moving window of 25 bp, 0 ambiguities (“N”), a maximum homopolymer length of 8 bp, a maximum of 1 mismatch in the primer sequence. Remaining DNA reads were dereplicated into ISUs with the unique.seqs() command and the resulting files processed with two distinct bioinformatic strategies in order to prepare the final ISU and OTU tables used for the construction of water quality indices, as shown in Figure 1.
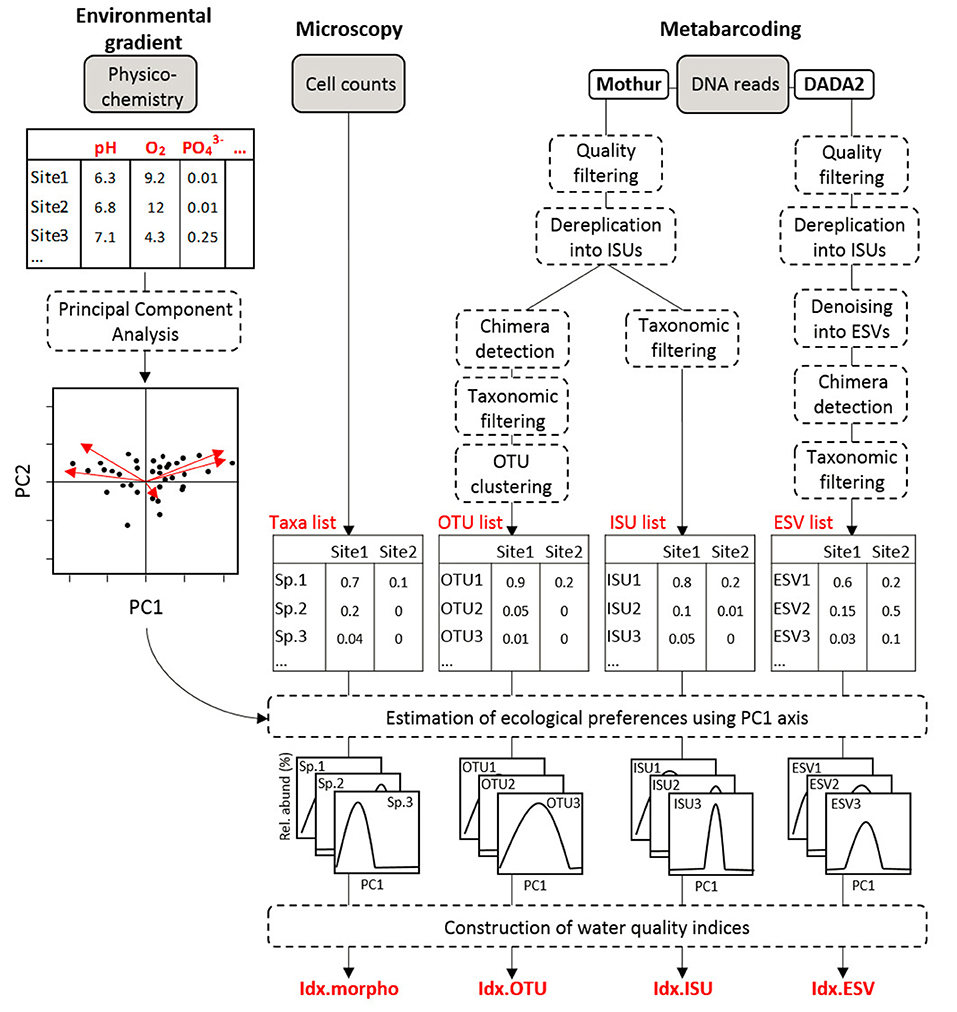
Figure 1. Overview of the analyses. The diagram indicates the steps to compute the four indices based on microscopic data (Idx_morph) and on metabarcoding data (Idx_OTU, Idx_ESV, and Idx_ISU).
Preparation of ISU Table
Even if the rbcL primers used for metabarcoding were designed to be diatom specific, the presence of degenerated bases in the primer sequence may introduced non-target organism amplification (Linhart and Shamir, 2002) In order to perform the most objective comparison between diatom morphospecies and ISUs water quality indices developed in this study, “non-diatom” ISUs must be removed as they can interfere, positively or negatively, on the predictive power of the ISU index. Thus, we used the classify.seqs() command (default parameters, cutoff = 75%) with the “diat.barcode” reference database (version v7: 23-02-2018, https://doi.org/10.15454/HYRVUH) to provide a taxonomy to each ISU and we applied the remove.lineage() command to remove the non-Bacillariophyta (phylum) ISUs (“Bacillaryophyta_unclassified” ISUs were also discarded).
The ISU abundance distributions along the environmental gradient were used to develop the ISU index (Idx_ISU), meaning that ISUs with low abundance and rare ISUs were automatically removed during the index development [see section Calculation of diatoms indices (Idx_morph, Idx_OTU, Idx_ISU, Idx_ESV)]. We decided to use the split.abund() command in order to keep only ISUs represented by at least 50 reads among the 79 samples. By this way, spurious ISUs were removed and the computing power required to create Idx_ISU was reduced, without affecting its efficiency.
Preparation of OTU Table
Using the files produced after the unique.seq() command (see section Initial Bioinformatic Steps for ISUs and OTUs), OTU table was created following the bioinformatic workflow detailed by Vasselon et al. (2017a) with some adjustments: (i) ISUs were aligned using the align.seqs() command and poorly aligned reads were removed using the command screen.seqs(start = 28, optimize = end, criteria = 90); (ii) we used the pre.cluster() command to denoise sequencing errors by preclustering rare ISUs with related more abundant ones (1 bp threshold); (iii) detection of chimeras was performed using the chimera.vsearch() command; (iv) removal of “non-diatom” ISUs was performed as presented above (section Preparation of ISU Table) using the classify.seqs() and the remove.lineage() commands; (v) ISUs represented by <3 reads were removed with the split.abund() command; (vi) a similarity distance matrix of ISUs was created with the command dist.seqs(); (vii) OTU clustering was performed using the cluster.split() command applying the furthest neighbor method with a 95% similarity threshold.
Preparation of ESV Table
The software package DADA2 was used to infer ESVs from demultiplexed MiSeq reads (one R1 and one R2 fastq file per sample) following the methods described by Callahan et al. (2016). The DADA2 pipeline adapted to diatom metabarcoding data and applied in this study is available on Github (https://github.com/fkeck/DADA2_diatoms_pipeline) and includes : (i) for each sample, primers sequences are removed from R1 and R2 reads using cutadapt (Martin, 2011); (ii) the R1 and R2 reads are truncated to 200 and 170 nucleotides, respectively in order to remove last poor quality nucleotides; (iii) R1 and R2 reads with 0 ambiguities (“N”) and a maximum of expected errors (maxEE) of 2 are conserved; (iv) after dereplication of R1 and R2 reads into ISUs, ESVs are selected based on the error rates model determined by the DADA2 denoising algorithm and paired reads merged into one sequence; (v) chimeric ESVs are removed; (vi) ESVs are taxonomically assigned using the DADA2 default parameters with an adapted version of the “diat.barcode” reference database (available on https://www6.inra.fr/carrtel-collection/Barcoding-database/Database-download); (vii) finally, a taxonomic filtering is applied in order to remove the non-Bacillariophyta (phylum) ESVs (“Bacillaryophyta_unclassified” ESVs were also discarded).
Correlation Between Community Data Tables
Prior to indices development, the correlation between morphospecies, OTU, ISU and ESV tables was assessed using the Procrustes superimposition method (Peres-Neto and Jackson, 2001). Non-metric multidimensional scaling (NMDS) on Bray-Curtis distances was used to derive a three-dimensional configuration of each table. The pairwise matching between NMDS ordinations was then measured using Procrustes correlation and tested by permutations (999 repetitions). Analyses were conducted with the metaMDS and protest functions of the R package “vegan” (R Development Core Team, 2008; Oksanen et al., 2016).
Index Development
Definition of the Reference Pressure Gradient
Principal component analysis (PCA) was executed using the prcomp function in R (Venables and Ripley, 2002) to study the structure of the 76 samples and their relationship to the environmental variables (Figure 2). Logarithmic transformation was applied on the environmental variables to ensure the normal distribution of data required for the PCA. The first principal component (PC1) represents the reference pressure gradient, i.e., the position of the samples along this gradient represent their reference quality. These values were then multiplied by −1 and then calibrated on a scale from 0 to 20, so that higher values representing better reference quality. Multiplication by −1 was necessary because higher values on the original PC1 were associated with high concentration of the variables, referring to “poor” quality.
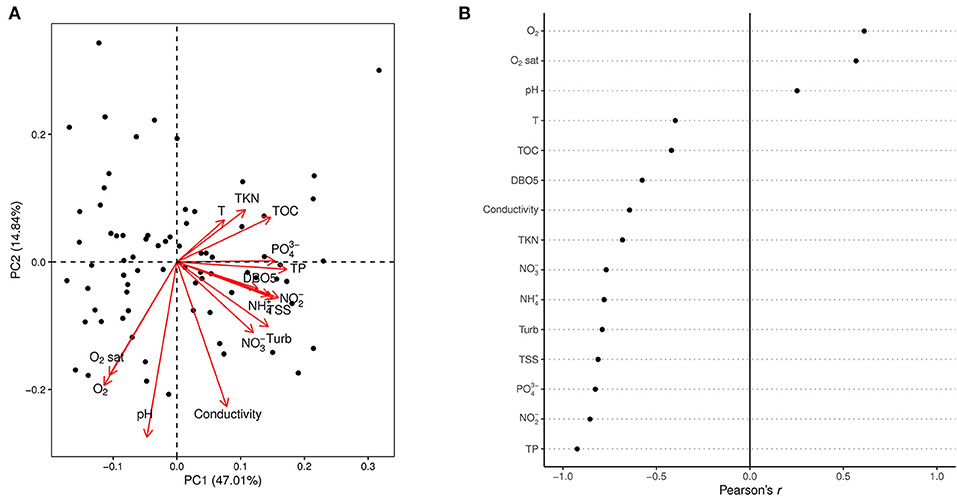
Figure 2. Principal component analysis of the environmental variables. The PCA biplot (A) shows the projection of the sites (black dots) and the variable loadings on the first two principal components (PC1 and PC2). The dotplot (B) indicates the correlation (Pearson's r) of each environmental variable with the first principal component (PC1) that was used as the reference gradient for the indices. High and low values indicate strong positive and negative correlation respectively, while values close to zero indicate weak correlations between PC1 and the given parameter.
Calculation of Diatoms Indices (Idx_morph, Idx_OTU, Idx_ISU, Idx_ESV)
The development of the four diatom indices followed the methodology described in Tapolczai et al. (2019). Both morphospecies inventory obtained via microscopic identification and sequence reads inventory obtained via HTS were transformed into relative abundances in order to ensure a comparable quantification among samples.
The four datasets according to the biological inventories (morphospecies, OTU, ISU and ESV lists) were randomly divided into: (i) a training datasets containing the randomly selected 75% of the samples, including their position along PC1 and their associated morphospecies (and OTUs, ISUs, ESVs) relative abundances; (ii) a test dataset containing the remaining 25% of the samples. Therefore, the indices could be tested on an independent dataset that was not included in the index development. This cross validation approach to randomly select training and test datasets was executed 100 times to measure the average and standard deviation of the values of the four indices at each sample instead of a single measure that could bias the results. This resulted in 100 indices tested for each of the four index types (Idx_morph, Idx_OTU, Idx_ISU, Idx_ESV) (400 indices in total).
Ecological profiles of the morphospecies, OTUs, ISUs, and ESVs in the training datasets were defined by modeling their relative abundances in the samples along PC1. Rare morphospecies, OTUs, ISUs, and ESVs were removed from the data tables and only those present in more than 5% of the samples in the training dataset were kept. This arbitrary limit, well-established in previous studies (Stenger-Kovács et al., 2007; Bere et al., 2014; Tapolczai et al., 2019), was necessary to keep a minimum number of samples based on which robust ecological profiles are ensured.
Weighted averages and standard deviations of the profiles were calculated to estimate the ecological optimum (s) and the tolerance (v) values. The Zelinka-Marvan equation (Zelinka and Marvan, 1961) was adapted to our data to define the four indices:
where Idx_morph/OTU/ISU/ESV are the indices based on morphospecies, OTUs, ISUs, and ESVs, respectively; aj is the relative abundance of morphospecies/OTU/ISU/ESV j; sj is the sensitivity or optimum of morphospecies/OTU/ISU/ESV j; and vj is the indicator value or tolerance of morphospecies/OTU/ISU/ESV j in the sample. Sensitivity and indicator values for each morphospecies, OTUs and ISUs were calculated using their abundance values plotted as functions of the samples' PC1 values. The two ecological values (sensitivity and indicator) comprised a database that was used together with the relative abundance values of the morphospecies, OTUs, ISUs, and ESVs in the samples for which the indices were calculated. Data of the training dataset was used to define these profiles. Idx_morph, Idx_OTU, Idx_ISU, and Idx_ESV for each sample in the test dataset were calculated and correlated with their corresponding PC1 values.
The R script used for the index development and data analysis is uploaded and freely available on Zenodo repository (https://doi.org/10.5281/zenodo.3463043).
Index Comparison
In order to assess and compare the performance of the four quality indices developed, several metrics were used. Correlation coefficients of the linear models fitted on mean data of quality values per sites were compared and significance tests were performed using the “cocor” package in R (R Development Core Team, 2008; Diedenhofen and Musch, 2015). The residuals of the four regression models were compared with Wilcoxon signed rank test and Bonferroni correction (Hollander and Wolfe, 1973) in order to measure the prediction performance of the models. Stability of the indices were estimated by comparing the standard deviation of index values per sites originated from the 100 iterations to select training and test datasets. It was tested with Wilcoxon signed rank test with Bonferroni correction.
Results
Reference Gradient
The first principal component of the PCA (Figure 2A), explaining the 47.01% of the total variation in the dataset was used as the reference gradient for the indices. Poor quality is associated with those parameters indicating higher nutrient concentration, organic matter concentration, turbidity. Good quality is represented by well-oxygenated waters. pH, oxygen concentration, oxygen saturation and conductivity are the main factors responsible for the distribution of sites on the second principal component, explaining the 14.84% of the total variation. All environmental variables correlated significantly with PC1 (p < 0.05) with Pearson's correlation coefficients (r) presented on Figure 2B.
Morphological Identification
A total of 355 diatom taxa were identified via microscopic analysis from which 321 at species level. The average number of taxa identified per sample was 28 (SD = 10) with a minimum of 4 and with a maximum of 56. Based on our criteria to remove rare taxa, the number of taxa kept in the training datasets and used for index development varied between 110 and 141 depending on the random selection of training and test datasets, with a mean taxa number of 122 (Table S3).
HTS Results
The 76 samples selected for this study were part of a MiSeq (2 × 250 bp) sequencing run composed of 284 rbcL diatoms libraries from freshwater biofilm samples and were analyzed in a joined analysis of 464 samples. In order to allow the bioinformatic reproducibility of our study, the global dataset corresponding to the 464 samples fastq files used for the Mothur and DADA2 bioinformatics analysis are available on the Zenodo repository system (https://doi.org/10.5281/zenodo.3244156). We will only present the results obtained for 76 samples studied here.
The sequencing platform performed the demultiplexing and the contig steps, providing one fastq file per sample which generated a total of 3,071,693 DNA reads for the 76 samples with an average of 40,417 reads per sample (min = 23,140; max = 67,292). After the application of the bioinformatic procedure to generate the OTU table, 1,426,272 DNA reads remained and were clustered into 856 OTUs (95% similarity threshold) with an average of 122 OTUs per sample (min = 49; max = 236) (Table S4). For the generation of the ISU table, bioinformatic procedure conserved 2,008,452 DNA reads corresponding to a total of 21,241 ISUs with an average of 2,214 ISUs per sample (min = 344; max = 4,244) (Table S5). Regarding the ESV table, DADA2 bioinformatic procedure conserved 2,852,542 DNA reads corresponding to a total of 1,266 ESVs with an average of 96 ESVs per sample (min = 31; max = 186) (Table S6). Detailed information regarding the effect of bioinformatic procedures on DNA reads are summarized in Table S7.
Morphospecies/OTU/ISUs/ESVs Community Structure Comparison
Basic summary data of the four biological inventories are presented in Table 1. Logically, both the total and mean richness per sample was much higher using molecular data; the number of OTUs detected (856) was almost 2.5 times higher than the total morphospecies richness (355). ESV richness was 1,266 in total and ISU richness was several fold higher with a total and mean richness per sample of 21,241 and 2,214 ISUs, respectively. Here we note that rarefaction was not used to set all the samples to the same read number as it was not mandatory for indices development. Values of morphospecies, OTUs, ESVs, and ISUs were converted into relative proportions in the different biological tables for the different indices development. Richness values are provided just as descriptive information and not for comparison.
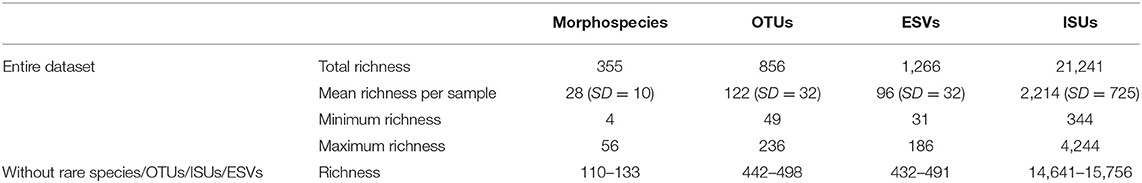
Table 1. Summary table indicating the number of distinct morphospecies, OTUs, ESVs, and ISUs in the entire dataset and the training datasets.
The four tables (morphospecies, OTU, ISU, and ESV) were all found to be correlated with each other (all p < 0.001). The strongest correlation was measured between the ISU and ESV tables (Procrustes correlation = 0.99). Both ISU and ESV tables were strongly correlated with the OTU table (0.87 and 0.86, respectively) and with the morphospecies table (0.78 and 0.77, respectively). Finally, the lowest correlation was found between the OTU and the morphospecies tables (Procrustes correlation = 0.67).
Distribution of Ecological Values
Ecological values (sensitivity and indicator) derived from the abundance distribution of the four kinds of biological units were defined (Tables S8–S11) and their distribution is presented in Figure 3. The general pattern for the four data types is similar to each other with a quasi-normal distribution of sensitivity values and a right skewed distribution pattern of the indicator values. Morphospecies inventory consists of the fewest data points while ISU database contains the most. Consequently, morphospecies inventory involves higher relative abundances of taxa than the abundances of unique sequences. Both the relative abundance per OTUs and the number of OTUs are between the morphospecies and ISU inventories.
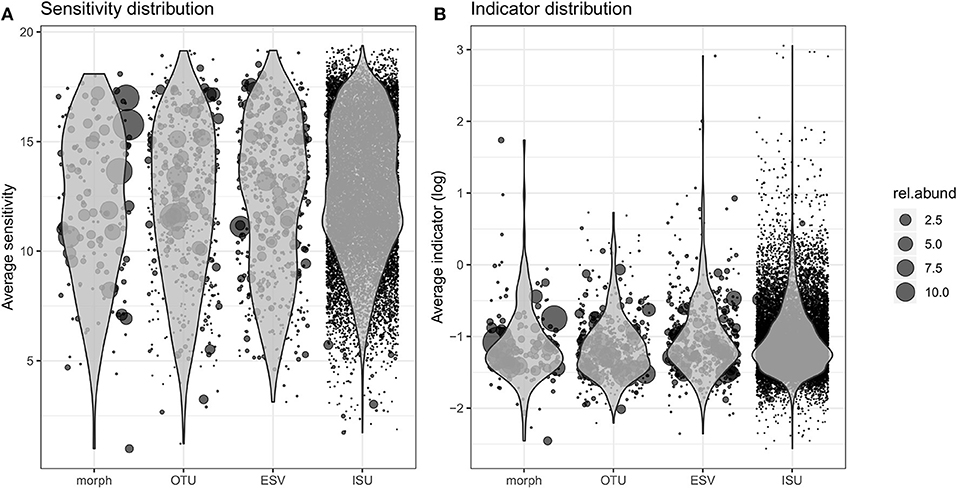
Figure 3. Distribution of the sensitivity (A) and indicator (B) values estimated for each morphospecies, OTU, ESV, and ISU during the training procedure. The position of each dot corresponds to its average sensitivity/indicator values (over 100 estimates) and the size indicates its relative abundance.
ISU composition and abundance within OTUs were further analyzed in order to reveal hidden ecological information and the results are presented on Figure 4 in the case of the ten most abundant OTUs. Within some OTUs (e.g., OTU00001, OTU00002, OTU0003, OTU00007, OTU00008, OTU00009, and OTU00010) the frequency distribution of ISU sensitivity and indicator values follow a unimodal pattern in which ecological values of the most abundant ISUs are very close to the ones of the OTU it belongs to. However, in other cases (OTU00004, OTU00005, and OTU00006), OTUs contain more abundant ISUs whose ecological values differ from the one of the OTU they belong to.
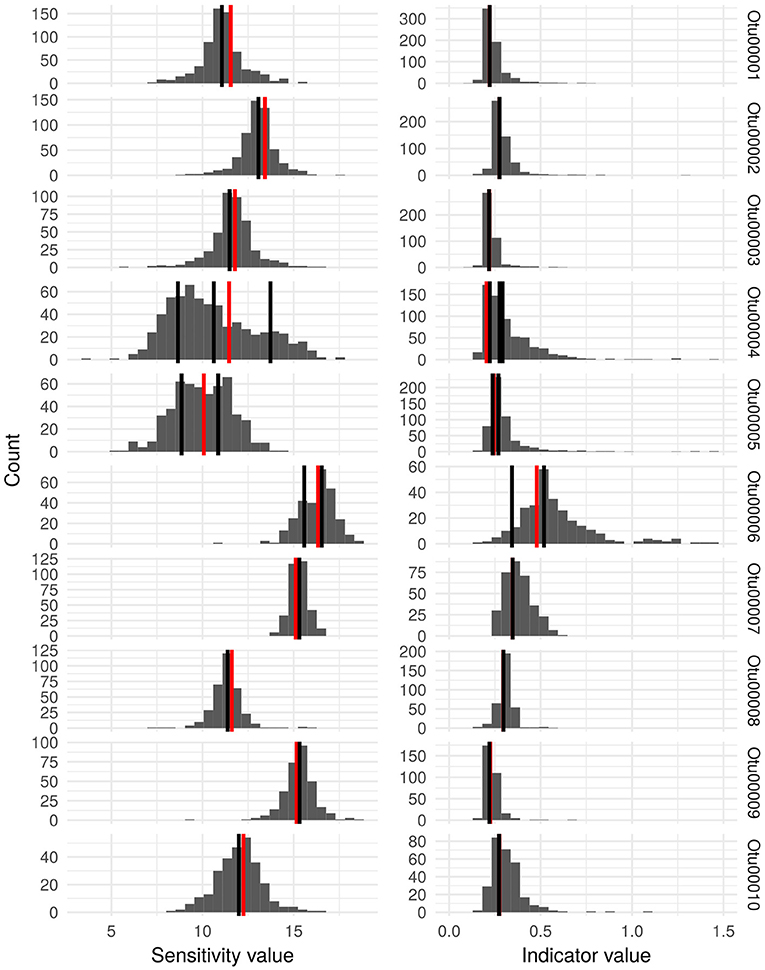
Figure 4. Histograms representing the distribution of the estimated sensitivity values and indicator values in the Idx_ISU for the ISU that were clustered into the 10 most abundant OTU. For each OTU, the vertical black lines indicate the ecological values of the most abundant ISU (relative abundance in the entire dataset >0.1%) and the vertical red line shows the ecological values estimated for the complete OTU (Idx_OTU).
Comparison of Indices' Values
The performance of the four indices (Idx_morph, Idx_OTU, Idx_ISU, and Idx_ESV) was assessed by fitting a linear model using the “lm” function in R (Chambers, 1992; R Development Core Team, 2008) on the relationship between the calculated index values and their corresponding reference pressure gradient values (PC1) (Figures 5A–D). The relationship was significant for each index (p < 0.01) with regression coefficient values of 0.84, 0.76, 0.84, and 0.84 for Idx_morph, Idx_OTU, Idx_ISU, and Idx_ESV, respectively. R2 values for the correlation between Idx_ISU and PC1, Idx_ESV and PC1 and finally, Idx_morph and PC1 were significantly higher than the R2 values of the correlation between Idx_OTU and PC1 (p < 0.05). The slope of the linear model however differed from the m = 1 value at each case, with slope values of m = 0.49, 0.45, 0.49, and 0.53 for Idx_morph, Idx_OTU, Idx_ESV, and Idx_ISU, respectively (Table 2). The Wilcoxon-test to compare prediction performance showed significantly higher MSE values (i.e., weaker prediction) for Idx_OTU (MSE = 8.73) than for all the other indices and both Idx_morph (MSE = 6.85) and Idx_ISU (MSE = 6.75) performed better in this aspect than Idx_ESV (MES = 6.98). Wilcoxon-test for the prediction instability assessed by the mean standard deviation due to the cross validation step showed that Idx_morph is more stable (mean SD from CV = 6.85) than Idx_OTU, Idx_ESV, and Idx_ISU (mean SD from CV = 0.58, 0.51, and 0.58, respectively).
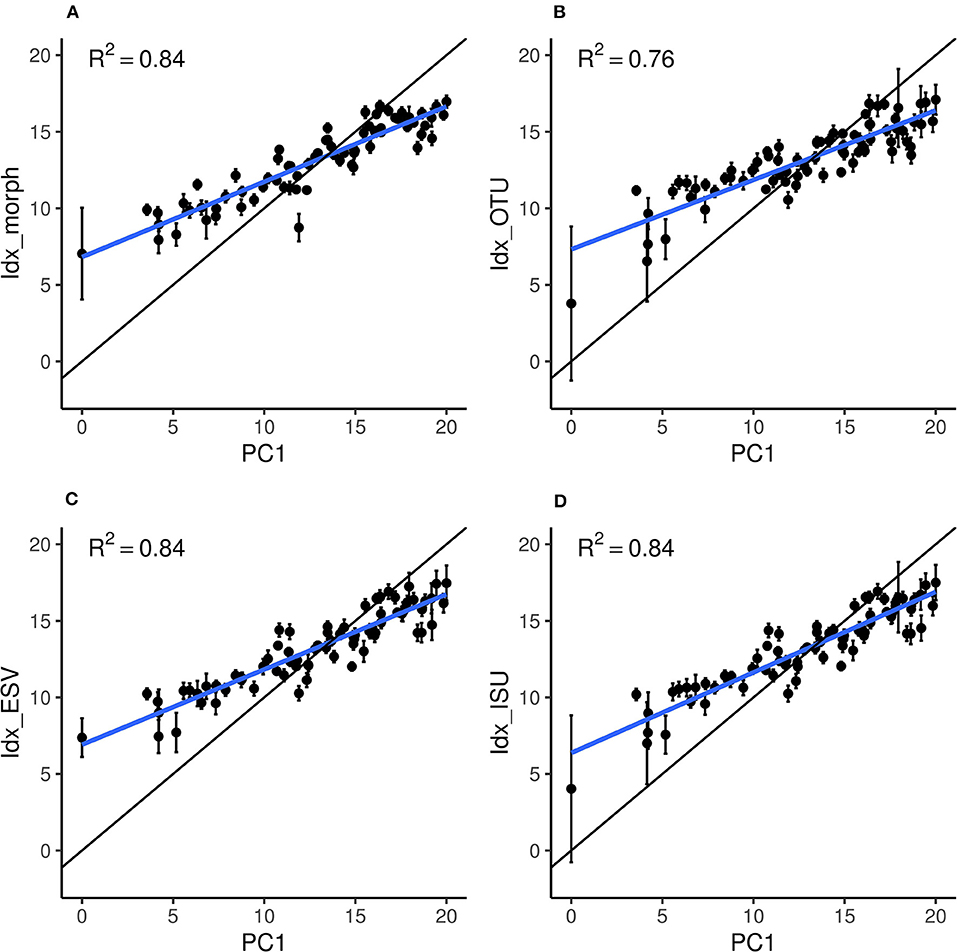
Figure 5. Relation between the site scores on the reference gradient (PC1) and the scores estimated by each index: (A) Idx_morph, (B) Idx_OTU, (C) Idx_ESV, and (D) Idx_ISU. Black dots and error bars represent the average and standard deviations, respectively, over the 100 training repetitions. The thick blue line represents the estimated linear regression between PC1 and the index values. The black line materialize the perfect equivalence between PC1 and the indices (i.e., the optimal 1:1 line).
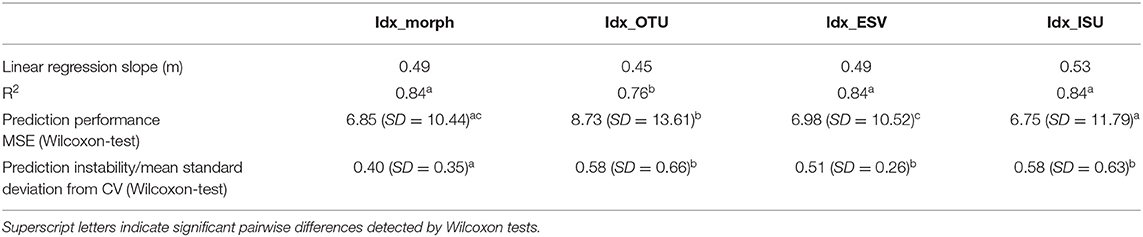
Table 2. Summary table of the performances of the four indices.
Discussion
De novo Construction of Morphological and Molecular Diatom Indices
In this study we developed, tested, and compared diatom indices based on morphospecies identified with microscopy and molecular taxonomic units based on metabarcoding. Similar studies aiming to develop quality indices using such approaches have been already conducted but their number is quite few (Apothéloz-Perret-Gentil et al., 2017; Cordier et al., 2017, 2018). Significant correlations in our study between the reference gradient and the predicted quality notes proved the validity of our approach the model developed on the training dataset using cross validation method could successfully be used on the test dataset. From a further aspect, we carried out a comparison of index performances based on molecular and microscopical inventories but also studied the differences within molecular methods, between OTU-, ISU-, and ESV- based indices.
Last decade(s) has seen a tremendous evolvement in implementing molecular-based methods in biomonitoring with the purpose to improve it in terms of standardization, cost- and time-efficiency, accuracy, etc. (Leese et al., 2016). The first step of this process was to imitate biomonitoring approaches already used with microscopic data by substituting morphospecies inventories with the ones obtained via metabarcoding. Numerous studies revealed characteristic features in which OTU taxonomic inventories perform differently than morphospecies, mainly regarding taxonomic coverage issues or the quantification of the biological signal (Zimmermann et al., 2015; Vasselon et al., 2017b, 2018). Molecular data was also used to create inventories for already existing diatom indices based on morphospecies with the common drawback of uncomplete reference libraries (Kermarrec et al., 2014; Visco et al., 2015; Pawlowski et al., 2016; Rivera et al., 2018). Recent studies have started to develop OTU-based, so-called taxonomy-free indices in order to test the possibility of using such approaches in diatom-based quality assessment (Apothéloz-Perret-Gentil et al., 2017; Tapolczai et al., 2019), with promising results.
It is worth to note that the literature makes a clear distinction between taxonomy-free indices and machine learning based indices (Cordier et al., 2017, 2018). For consistency and clarity we advocate that this dichotomy is not relevant and the term machine learning can be employed to refer to both approaches. Indeed, machine learning is a generic term for a very broad statistical approach (basically consisting in training predictive functions and testing their performance) rather than the application of a reduced set of learning algorithms. Although derived from a simple function, taxonomy-free indices based on Zelinka and Marvan equation are obtained by optimizing morphospecies/OTU/ISU/ESV weights with a training set or through cross validation. This procedure is typical of supervised machine learning.
In this study we take a step forward and assess the performance of de novo developed molecular diatom indices for the first time. We do not only assessed the performance of molecular methods compared to microscopic one but we reconsidered the already existing molecular methods too. We showed that beside being a step toward a more standardized biomonitoring, the Idx_ISU unveiled hidden ecological differences between ISUs that are otherwise grouped together into the same OTU due to their high genetic similarity, masking the bioindication signal. Thus, the construction of de novo indices enabled a fair comparison of different approaches for the improvement in bioassessment.
Currently used diatom indices, as the Trophic Diatom Index (TDI; Kelly and Whitton, 1995), the Biological Diatom Index (Jean Prygiel, 2002) or the Specific Pollution sensitivity Index (Coste, 1982), were developed using the ecological profile of species along particular physical and chemical parameters related to eutrophication, organic pollution, etc. Following the strategy of previous studies of the authors (Tapolczai et al., 2017, 2019), this study used another approach by applying the first principal component of a PCA, carried out on our dataset, as the reference gradient. It is a way to integrate the effect of the several environmental parameters affecting the position of samples on this gradient. We observed that all variables measured, except pH, correlated well with the defined reference gradient. This approach avoids completely the use of already existing index values based on morphology as reference (Apothéloz-Perret-Gentil et al., 2017) and serves perfectly the comparison of the effect of different biological inventories on a newly developed quality index. One technical disadvantage of this strategy is that the gradient, together with the taxa's ecological values are specific to our data and cannot be directly used in other studies. However, they can be always linked to values of environmental parameters via their correlation with PC1. It is important to note that the ecological validity of the use of a reference based on solely physical and chemical parameters to assess ecological quality is often contested (Kelly et al., 2009; Schneider et al., 2016). The main critic is that although the WFD introduced the new fundamental concept of the ecological quality defined by the status of the biota instead of physical and chemical parameters, the methods adopted are the already existing metrics based on old concepts.
To define the ecological optimum of species, the weighted average method was used. Even though it is sometimes criticized by the literature, we used this method due to its simplicity and the fact that the majority of the diatom indices are still based on this calculation. Since the weighted average assesses species optima the best where abundance distribution of species is symmetric and unimodal, it usually overestimates the quality note of poor quality sites and underestimates the quality of high quality sites where species distributions are strongly right- and left- skewed, respectively as already shown by Tapolczai et al. (2017). Potapova et al. (2004) proposed different strategies to improve the calculation of the optima including generalized linear models or giving multiple indicator values for species based on the probability that it can be found in the different quality classes, based on the “smoothed” distribution along the reference gradient.
Comparison of the Performance of the Four Indices
As highlighted in the previous section, the de novo morphological (Idx_morph) and molecular (Idx_OTU, Idx_ISU, Idx_ESV) diatom indices were all relevant to predict correctly the ecological status of the study sites using machine learning approach. Despite the relation between the site scores on the reference gradient and the scores estimated with the four indices are highly similar, the Idx_morph, Idx_ISU, and Idx_ESV performed equally and outperformed the Idx_OTU.
The biological information used to compute the four indices were based on diatom morphospecies (Idx_morph), OTU (Idx_OTU), ISU (Idx_ISU), and ESV (Idx_ESV) tables. Despite the methodological and biological biases introduced by molecular and morphological approaches applied to obtain those tables (Pawlowski et al., 2018), they were all derived from the same environmental diatom community. Thus, as we expected, the community structures revealed by the four matrices were highly correlated, as shown by the procrustean analyses and already observed in previous diatom metabarcoding studies (Vasselon et al., 2017b; Rivera et al., 2018). The highest correlation was observed between ESV and ISU structures, as they are based on the same metabarcoding data, and both correlated better with morphospecies than OTU. However, we would expect OTUs to be more related to morphospecies as OTUs are supposed to be proxies for species (Porter and Hajibabaei, 2018). This may be explained partially by (i) our OTU definition, determined by the choice of the OTU clustering algorithm and the genetic distance similarity threshold applied, which may not reflect properly the morphological diatom species concept (Hugerth and Andersson, 2017; Tapolczai et al., 2019); (ii) the bioinformatics biases introduced at the different steps used to proceed raw DNA reads into OTUs, like the alignment of DNA reads, the chimera detection or the OTU clustering algorithm (Mysara et al., 2015; Edgar, 2018; Hardge et al., 2018); (iii) the consistency of OTU, as genetically close taxa may be grouped within the same OTU, reducing the final resolution of the OTUs in comparison to ISUs and ESVs (Callahan et al., 2017).
In our study, the consistency of OTU is more likely to affect the efficiency of the Idx_OTU in comparison to the Idx_ISU and Idx_ESV. By confronting the distribution of the sensitivity and indicator values of each ISU (estimated with the Idx_ISU index) to the values of their corresponding OTU (estimated with the Idx_OTU index), we observed two patterns: (i) OTU composition is consistent: the OTU is dominated by one abundant ISU and both shared similar ecological preferences; (ii) OTU composition is not consistent: the OTU is dominated by several abundant ISUs which may have various ecological preferences, the ecological preferences of the OTU corresponding to an average of the dominant ISUs values. Among the 10 most dominant OTUs observed, 3 of them appeared to be inconsistent as they were composed by several abundant ISUs with different ecological preferences (e.g., OTU00004). As the calculation method used to create the quality index gives more weight to dominant taxa (Bigler et al., 2010), the misestimation of dominant OTU ecological preferences, due to their inconsistency, reduces the efficiency of the Idx_OTU in comparison of the Idx_ISU where estimation of ISU ecological preferences is more realistic.
OTU consistency is mainly affected by methodological biases introduced during the bioinformatics steps applied to create OTUs, like the choice of the clustering method (Schmidt et al., 2014). In our study we used the furthest neighbor method as implemented in Mothur, which is known to create numerous OTUs in comparison to recently developed clustering algorithm like Opticlust (Westcott and Schloss, 2017) or Swarm (Mahé et al., 2015). However, hierarchical complete linkage method, like furthest neighbor, enables to create more consistent OTUs with ecologically consistent partitions (Schmidt et al., 2014). The sequence similarity threshold applied to define OTUs can also affect their consistency, the smaller the threshold, the greater the risk of merging genetically and ecologically diverse taxa. As we used a 95% similarity threshold, this risk is increased, however a previous study shown that the use of a threshold between 95 and 99%, using furthest neighbor clustering method, has a limited effect on the efficiency of the computed OTU index (Tapolczai et al., 2019). Furthermore, we observed that the dominant ISUs belonging to the same OTU (e.g., OTU0004) were genetically distant of only 2 or 3 nucleotides, corresponding to 1–2% of differences. So even if we had applied the 97% similarity threshold, the problem would have remained. There are some clustering algorithms though, with strategies avoiding the use of a global similarity threshold. These methods, e.g., Swarm (Mahé et al., 2015) with a d parameter equal to one would potentially separate this ecological signal. Similarly, OTU clustering based on sequence distribution among samples (Preheim et al., 2013) or the application of post-clustering curation procedure to denoise OTUs (Frøslev et al., 2017) are attempts to handle the bias of using sequence similarity threshold. However, in comparison to OTUs, ISUs and ESVs are able to take into account intra-species and intra-population variability which provide relevant ecological information for freshwater biomonitoring.
Finally, even if the Idx_ISU and Idx_ESV outperformed the Idx_OTU, it provided similar predictive power than the Idx_morph with a higher correlation slope between the expected gradient and the estimated index values, but appeared to be significantly less stable. The highest prediction instability was observed for sites corresponding to the extreme situation on the physico-chemical reference gradient characterized by few sites (particularly on polluted sites). It was already described that the instability of the index development is related to the cross validation process, used for defining training and test datasets, which is sensitive to the size of the dataset and the presence of outliers (Tapolczai et al., 2019). Even if this bias also occurred in the Idx_morph, the highest instability was observed for the Idx_ISU certainly due to the high number of ISUs obtained which fragmented the ecological signal. Furthermore, highly impacted sites are usually characterized by lower diatom richness and can contribute to increase the instability of indices based on molecular data (Tapolczai et al., 2019). This problem should be mitigated by increasing the size of the dataset.
The Place of Molecular Metabarcoding Approaches Within Actual Freshwater Biomonitoring
In the context of freshwater biomonitoring and WFD, we need transferable tools. We have shown that all indices produced (Idx_morph, Idx_OTU, Idx_ISU, Idx_ESV) are suitable to evaluate the ecological status of rivers using diatoms. However, they do not perform equally in terms of routine monitoring applicability. We already introduced the limitations related to morphological approaches (time-consuming, limiting spatio-temporal surveys, high expertise required), justifying the development of molecular biomonitoring approaches. However, these new molecular tools are not yet straightforward for stakeholders and water managers. In this study we showed that ISUs, after applying bioinformatic limited filtering steps, provide enough resolution for monitoring and offer several transferable advantages in comparison to OTUs or ESVs: (i) analysis are more reproducible as ISUs correspond to the basic untransformed unit produced with metabarcoding, without affecting their composition with algorithm (e.g., chimera detection, denoiser, clustering); (ii) they are consistent from one study to another as their identifier is the DNA sequence itself (unlike OTU); (iii) with less bioinformatics steps they are faster to analyze, require less computing power and thus tools are more easily transferable; (iv) like ESVs, they allow a higher resolution as they include intraspecific/intrapopulation level.
A further advantage of new molecular approaches is the detection of rare biosphere which might be of interest for freshwater biomonitoring. In this context, if new molecular indices are developed based on this rare biosphere, efficiency of filtered ISUs should be validated as sequencing errors may bias the ecological assessment. However, as discussed by Elbrecht et al. (2018), the increasing number of metabarcoding data obtained from freshwater sampling sites mitigates sequencing errors and the need of denoising algorithm. With this data deluge, machine learning methods combined with molecular approaches like metabarcoding will change our way to perform biomonitoring (Bohan et al., 2017).
Molecular approaches offer the possibility to increase spatial and temporal survey of freshwater monitoring networks. On the other hand, morphological approaches offer the possibility to work with ecologically meaningful information relevant for biomonitoring and not achieved by molecular ones, like morphological features observed at different life-stages of organisms, the detection of teratologic forms, as well as traits or ecosystem functions. The final objective is to improve our ability to survey and protect freshwater ecosystems, which can not be achieved with molecular based approaches alone for now. Stability of those methods is still scarce due to permanent technological and methodological evolution, meaning that molecular and morphological approaches must be used in a complementary way.
Data Availability Statement
The datasets generated for this study can be found in the https://doi.org/10.5281/zenodo.3244156, https://doi.org/10.5281/zenodo.3463043.
Author Contributions
KT, FK, MK, FR, AB, and VV contributed to the study design and the construction of the article. KT, FK, and VV performed analysis and wrote the paper.
Funding
We thank COST Action DNAqua-Net (CA15219), supported by the COST (European Cooperation in Science and Technology) program which supported this work, especially through a Short-Term Scientific Mission grant. We would like to thank the Agence Française pour la Biodiversité (AFB) which founded the studies realized on the French rivers and the Institut National pour la Recherche Agronomique (INRA) which leaded the project research. We further thank the Premium Postdoctoral Research Program of the Hungarian Academy of Sciences (PPD2018-026/2018) for partly funding the study.
Conflict of Interest
The authors declare that the research was conducted in the absence of any commercial or financial relationships that could be construed as a potential conflict of interest.
Acknowledgments
We acknowledge all the people and institutions in charge of the French freshwater monitoring survey (governmental agencies, private consultancies) who collaborate actively to the project:
- DREALs: Aquitaine (Delphine Sagnet), Auvergne (Franck Véry), Bourgogne (Valérie Peeters), Bretagne (Gael Gicquiaud), Centre (Simon Saadat, Chafika Karabaghli), Corse (Isabelle Boulier), Franche-Comté (Eric Parmentier), Ile-de-France (Odile Cortial), Limousin (Jean Marc Vouters), Lorraine (David Heudre), Midi-Pyrénées (Eléonore Seigneur), Pays-de-la-Loire (Didier Guillard), Rhône-Alpes (Rémy Chavaux), Normandie (Frédéric Pétel), PACA (Véronique Vassal), Picardie (David Fouré), Nord-Pas-de-Calais (Nathalie Zydek).
- Water governmental agencies: Artois-Picardie (Christophe Lesniak), Rhône-Méditerranée et Corse (Loïc Imbert, Franck Repellini), Adour-Garonne (Majlis Durand, Jean-Pierre Rebillard, Margaux Saut), Rhin-Meuse (Jean-Luc Matte, Guillaume Demortier), Loire-Bretagne (Jacky Durocher), Seine-Normandie (Marie Berdoulay).
- Private consultancies: AQUABIO (Rémy Marcel, Bruno Fontan), AQUASCOP (Jessica Vizinet), ECOMA (Lénaïg Kermarrec), SAGE (Anne Rolland, Jean-Philippe Vulliet, Carole Geret), GREBE (Philippe Prompt), Eurofins Expertises Environnementales (Léa Feret).
Supplementary Material
The Supplementary Material for this article can be found online at: https://www.frontiersin.org/articles/10.3389/fevo.2019.00409/full#supplementary-material
Table S1. Description of the 15 physico-chemical parameters used to compute the principal component analysis (PCA) and to define the reference gradient.
Table S2. rbcL primers, PCR1 Mix, and thermal cycler condition used for diatom DNA metabarcoding.
Table S3. Morphospecies list of the 76 samples used as input to compute the Idx_morph. Proportions correspond to relative abundance of diatom valves counted under microscope.
Table S4. OTU list of the 76 samples used as input to compute the Idx_OTU. Proportions correspond to relative abundance of DNA reads.
Table S5. ISU list of the 76 samples used as input to compute the Idx_ISU. Proportions correspond to relative abundance of DNA reads.
Table S6. ESV list of the 76 samples used as input to compute the Idx_ESV. Proportions correspond to relative abundance of DNA reads.
Table S7. Effect of the different bioinformatics steps applied to produce OTU and ISU list on the DNA reads number.
Table S8. Ecological preferences of each individual morphospecies estimated during the training test phase of the Idx_morph, represented by the sensitivity and the indicator value. Each value corresponds to an average of the values obtained during the 100 times cross validation procedure.
Table S9. Ecological preferences of each individual OTU estimated during the training test phase of the Idx_OTU, represented by the sensitivity and the indicator value. Each value corresponds to an average of the values obtained during the 100 times cross validation procedure.
Table S10. Ecological preferences of each individual ISU estimated during the training test phase of the Idx_ISU, represented by the sensitivity and the indicator value. Each value corresponds to an average of the values obtained during the 100 times cross validation procedure.
Table S11. Ecological preferences of each individual ESV estimated during the training test phase of the Idx_ESV, represented by the sensitivity and the indicator value. Each value corresponds to an average of the values obtained during the 100 times cross validation procedure.
References
Apothéloz-Perret-Gentil, L., Cordonier, A., Straub, F., Iseli, J., Esling, P., and Pawlowski, J. (2017). Taxonomy-free molecular diatom index for high-throughput eDNA biomonitoring. Mol. Ecol. Resour. 17, 1231–1242. doi: 10.1111/1755-0998.12668
Bailet, B., Bouchez, A., Franc, A., Frigerio, J.-M., Keck, F., Karjalainen, S.-M., et al. (2019). Molecular versus morphological data for benthic diatoms biomonitoring in Northern Europe freshwater and consequences for ecological status. Metabarcod. Metagenom. 3:e34002. doi: 10.3897/mbmg.3.34002
Baird, D. J., and Hajibabaei, M. (2012). Biomonitoring 2.0: a new paradigm in ecosystem assessment made possible by next-generation DNA sequencing. Mol. Ecol. 21, 2039–2044. doi: 10.1111/j.1365-294X.2012.05519.x
Bere, T., Mangadze, T., and Mwedzi, T. (2014). The application and testing of diatom-based indices of stream water quality in Chinhoyi Town, Zimbabwe. Water SA 40:503. doi: 10.4314/wsa.v40i3.14
Bigler, C., Gälman, V., and Renberg, I. (2010). Numerical simulations suggest that counting sums and taxonomic resolution of diatom analyses to determine IPS pollution and ACID acidity indices can be reduced. J. Appl. Phycol. 22, 541–548. doi: 10.1007/s10811-009-9490-1
Bohan, D. A., Vacher, C., Tamaddoni-Nezhad, A., Raybould, A., Dumbrell, A. J., and Woodward, G. (2017). Next-generation global biomonitoring: large-scale, automated reconstruction of ecological networks. Trends Ecol. Evol. 32, 477–487. doi: 10.1016/j.tree.2017.03.001
Callahan, B. J., McMurdie, P. J., and Holmes, S. P. (2017). Exact sequence variants should replace operational taxonomic units in marker-gene data analysis. ISME J. 11, 2639–2643. doi: 10.1038/ismej.2017.119
Callahan, B. J., McMurdie, P. J., Rosen, M. J., Han, A. W., Johnson, A. J. A., and Holmes, S. P. (2016). DADA2: high-resolution sample inference from illumina amplicon data. Nat. Methods 13, 581–583. doi: 10.1038/nmeth.3869
Chambers, J. M., and Hastie, T. J. (eds.). (1992). “Linear models,” in Statistical Models (Wadsworth & Brooks/Cole Advanced Books & Software), 608.
Chen, W., Zhang, C. K., Cheng, Y., Zhang, S., and Zhao, H. (2013). A comparison of methods for clustering 16S rRNA sequences into OTUs. PLoS ONE 8:e70837. doi: 10.1371/journal.pone.0070837
Chonova, T., Kurmayer, R., Rimet, F., Labanowski, J., Vasselon, V., Keck, F., et al. (2019). Benthic diatom communities in an alpine river impacted by waste water treatment effluents as revealed using DNA metabarcoding. Front. Microbiol. 10:653. doi: 10.3389/fmicb.2019.00653
Cordier, T., Esling, P., Lejzerowicz, F., Visco, J., Ouadahi, A., Martins, C., et al. (2017). Predicting the ecological quality status of marine environments from eDNA metabarcoding data using supervised machine learning. Environ. Sci. Technol. 51, 9118–9126. doi: 10.1021/acs.est.7b01518
Cordier, T., Forster, D., Dufresne, Y., Martins, C. I. M., Stoeck, T., and Pawlowski, J. (2018). Supervised machine learning outperforms taxonomy-based environmental DNA metabarcoding applied to biomonitoring. Mol. Ecol. Resour. 18, 1381–1391. doi: 10.1111/1755-0998.12926
Coste, M. (1982). Etude des méthodes biologiques quantitatives d'appréciation de la qualité des eaux. Rapport Division Qualité des Eaux Lyon. Agence financiè de Bassin Rhone-Méditerarée Corse∧ ePierre-Bénite Pierre-Bénite
Diedenhofen, B., and Musch, J. (2015). cocor: a comprehensive solution for the statistical comparison of correlations. PLoS ONE 10:e0121945. doi: 10.1371/journal.pone.0121945
Edgar, R. C. (2016). UNOISE2: improved error-correction for Illumina 16S and ITS amplicon sequencing. bioRxiv 081257. doi: 10.1101/081257
Edgar, R. C. (2018). Updating the 97% identity threshold for 16S ribosomal RNA OTUs. Bioinformatics 34, 2371–2375. doi: 10.1093/bioinformatics/bty113
Elbrecht, V., Vamos, E. E., Steinke, D., and Leese, F. (2018). Estimating intraspecific genetic diversity from community DNA metabarcoding data. PeerJ 6:e4644. doi: 10.7717/peerj.4644
European Commission (2000). Directive 2000/60/EC of the European parliament and of the Council of 23 October 2000 establishing a framework for community action in the field of water policy. Off. J. Eur. Commun. 327, 1–73.
European Committee for Standardization (2014). Water Quality - Guidance Standard for the Identification, Enumeration and Interpretation of Benthic Diatom Samples from Running Waters. Brussels.
European Committee for Standardization (2016). Water Quality - Guidance Standard for the Routine Sampling and Pretreatment of Benthic Diatoms from Rivers. Brussels.
Forster, D., Lentendu, G., Filker, S., Dubois, E., Wilding, T. A., and Stoeck, T. (2019). Improving eDNA-based protist diversity assessments using networks of amplicon sequence variants. Environ. Microbiol. doi: 10.1111/1462-2920.14764. [Epub ahead of print].
Frøslev, T. G., Kjøller, R., Bruun, H. H., Ejrnæs, R., Brunbjerg, A. K., Pietroni, C., et al. (2017). Algorithm for post-clustering curation of DNA amplicon data yields reliable biodiversity estimates. Nat. Commun. 8:1188. doi: 10.1038/s41467-017-01312-x
Hardge, K., Neuhaus, S., Kilias, E. S., Wolf, C., Metfies, K., and Frickenhaus, S. (2018). Impact of sequence processing and taxonomic classification approaches on eukaryotic community structure from environmental samples with emphasis on diatoms. Mol. Ecol. Resour. 18, 204–216. doi: 10.1111/1755-0998.12726
Hebert, P. D., Cywinska, A., Ball, S. L., and deWaard, J. R. (2003). Biological identifications through DNA barcodes. Proc. R. Soc. Lond. B Biol. Sci. 270, 313–321. doi: 10.1098/rspb.2002.2218
Hollander, M., and Wolfe, D. A. (1973). Nonparametric Statistical Methods. 2nd Edn. New York, NY: Wiley.
Hugerth, L. W., and Andersson, A. F. (2017). Analysing microbial community composition through amplicon sequencing: from sampling to hypothesis testing. Front. Microbiol. 8:1561. doi: 10.3389/fmicb.2017.01561
Jean Prygiel, P. C. (2002). Determination of the biological diatom index (IBD NF T 90–354): results of an intercomparison exercise. J. Appl. Phycol. 14, 27–39. doi: 10.1023/A:1015277207328
Kahlert, M., Kelly, M., Albert, R.-L., Almeida, S. F. P., Bešta, T., Blanco, S., et al. (2012). Identification versus counting protocols as sources of uncertainty in diatom-based ecological status assessments. Hydrobiologia 695, 109–124. doi: 10.1007/s10750-012-1115-z
Keck, F., Vasselon, V., Tapolczai, K., Rimet, F., and Bouchez, A. (2017). Freshwater biomonitoring in the information age. Front. Ecol. Environ. 15, 66–274. doi: 10.1002/fee.1490
Kelly, M., King, L., and Ní Chatháin, B. (2009). The conceptual basis of ecological-status assessments using diatoms. Biol. Environ. Proc. R. Ir. Acad. 109, 175–189. doi: 10.3318/BIOE.2009.109.3.175
Kelly, M. G., and Whitton, B. A. (1995). The trophic diatom index: a new index for monitoring eutrophication in rivers. J. Appl. Phycol. 7, 433–444
Kermarrec, L., Franc, A., Rimet, F., Chaumeil, P., Frigerio, J.-M., Humbert, J.-F., et al. (2014). A next-generation sequencing approach to river biomonitoring using benthic diatoms. Freshw. Sci. 33, 349–363. doi: 10.1086/675079
Kermarrec, L., Franc, A., Rimet, F., Chaumeil, P., Humbert, J. F., and Bouchez, A. (2013). Next-generation sequencing to inventory taxonomic diversity in eukaryotic communities: a test for freshwater diatoms. Mol. Ecol. Resour. 13, 607–619. doi: 10.1111/1755-0998.12105
Leese, F., Altermatt, F., Bouchez, A., Ekrem, T., Hering, D., Meissner, K., et al. (2016). DNAqua-net: developing new genetic tools for bioassessment and monitoring of aquatic ecosystems in Europe. Res. Ideas Outcomes 2:e11321. doi: 10.3897/rio.2.e11321
Lindeque, P. K., Parry, H. E., Harmer, R. A., Somerfield, P. J., and Atkinson, A. (2013). Next generation sequencing reveals the hidden diversity of zooplankton assemblages. PLoS ONE 8:e81327. doi: 10.1371/journal.pone.0081327
Linhart, C., and Shamir, R. (2002). The degenerate primer design problem. Bioinformatics 18, S172–S181. doi: 10.1093/bioinformatics/18.suppl_1.S172
Loman, N. J., Misra, R. V., Dallman, T. J., Constantinidou, C., Gharbia, S. E., Wain, J., et al. (2012). Performance comparison of benchtop high-throughput sequencing platforms. Nat. Biotechnol. 30, 434–439. doi: 10.1038/nbt.2198
Mahé, F., Rognes, T., Quince, C., Vargas, C., and de Dunthorn,, M. (2015). Swarm v2: highly-scalable and high-resolution amplicon clustering. PeerJ 3:e1420. doi: 10.7717/peerj.1420
Martin, M. (2011). Cutadapt removes adapter sequences from high-throughput sequencing reads. EMBnet. J. 17, 10–12. doi: 10.14806/ej.17.1.200
Mortágua, A., Vasselon, V., Oliveira, R., Elias, C. L., Chardon, C., Bouchez, A., et al. (2019). Applicability of DNA metabarcoding approach in the bioassessment of Portuguese rivers using diatoms. Ecol. Indic. 106:105470. doi: 10.1016/j.ecolind.2019.105470
Mysara, M., Saeys, Y., Leys, N., Raes, J., and Monsieurs, P. (2015). CATCh, an ensemble classifier for chimera detection in 16S rRNA sequencing studies. Appl. Environ. Microbiol. 81, 1573–1584. doi: 10.1128/AEM.02896-14
Nearing, J. T., Douglas, G. M., Comeau, A. M., and Langille, M. G. I. (2018). Denoising the denoisers: an independent evaluation of microbiome sequence error-correction approaches. PeerJ 6:e5364. doi: 10.7717/peerj.5364
Oksanen, J., Blanchet, F. G., Friendly, M., Kindt, R., Legendre, P., McGlinn, D., et al. (2016). vegan: Community Ecology Package. Available online at: https://CRAN.R-project.org/package=vegan (accessed September 27, 2019).
Pardo, I., Gómez-Rodríguez, C., Wasson, J.-G., Owen, R., van de Bund, W., Kelly, M., et al. (2012). The European reference condition concept: a scientific and technical approach to identify minimally-impacted river ecosystems. Sci. Total Environ. 420, 33–42. doi: 10.1016/j.scitotenv.2012.01.026
Pawlowski, J., Kelly-Quinn, M., Altermatt, F., Apothéloz-Perret-Gentil, L., Beja, P., Boggero, A., et al. (2018). The future of biotic indices in the ecogenomic era: integrating (e)DNA metabarcoding in biological assessment of aquatic ecosystems. Sci. Total Environ. 637–638, 1295–1310. doi: 10.1016/j.scitotenv.2018.05.002
Pawlowski, J., Lejzerowicz, F., Apotheloz-Perret-Gentil, L., Visco, J., and Esling, P. (2016). Protist metabarcoding and environmental biomonitoring: time for change. Eur. J. Protistol. 55, 12–25. doi: 10.1016/j.ejop.2016.02.003
Peres-Neto, P. R., and Jackson, D. A. (2001). How well do multivariate data sets match? The advantages of a procrustean superimposition approach over the mantel test. Oecologia 129, 169–178. doi: 10.1007/s004420100720
Porter, T. M., and Hajibabaei, M. (2018). Scaling up: a guide to high-throughput genomic approaches for biodiversity analysis. Mol. Ecol. 27, 313–338. doi: 10.1111/mec.14478
Potapova, M. G., Charles, D. F., Ponader, K. C., and Winter, D. M. (2004). Quantifying species indicator values for trophic diatom indices: a comparison of approaches. Hydrobiologia 517, 25–41. doi: 10.1023/B:HYDR.0000027335.73651.ea
Preheim, S. P., Perrotta, A. R., Martin-Platero, A. M., Gupta, A., and Alm, E. J. (2013). Distribution-based clustering: using ecology to refine the operational taxonomic unit. Appl. Environ. Microbiol. 79, 6593–6603. doi: 10.1128/AEM.00342-13
R Development Core Team (2008). R: A language and Environment for Statistical Computing. Vienna: R Fondation for Statistical Computing. Available online at: http://www.r-project.org (accessed September 27, 2019).
Rivera, S. F., Vasselon, V., Jacquet, S., Bouchez, A., Ariztegui, D., and Rimet, F. (2018). Metabarcoding of lake benthic diatoms: from structure assemblages to ecological assessment. Hydrobiologia 807, 37–51. doi: 10.1007/s10750-017-3381-2
Schloss, P. D., Westcott, S. L., Ryabin, T., Hall, J. R., Hartmann, M., Hollister, E. B., et al. (2009). Introducing mothur: open-source, platform-independent, community-supported software for describing and comparing microbial communities. Appl. Environ. Microbiol. 75, 7537–7541. doi: 10.1128/AEM.01541-09
Schmidt, T. S. B., Rodrigues, J. F. M., and Mering, C. v. (2014). Ecological consistency of SSU rRNA-based operational taxonomic units at a global scale. PLoS Comput. Biol. 10:e1003594. doi: 10.1371/journal.pcbi.1003594
Schneider, S. C., Hilt, S., Vermaat, J. E., and Kelly, M. (2016). The “Forgotten” Ecology Behind Ecological Status Evaluation: Re-Assessing the Roles of Aquatic Plants and Benthic Algae in Ecosystem Functioning. Available online at: http://link.springer.com/10.1007/124_2016_7 (accessed June 24, 2016).
Shokralla, S., Spall, J. L., Gibson, J. F., and Hajibabaei, M. (2012). Next-generation sequencing technologies for environmental DNA research. Mol. Ecol. 21, 1794–1805. doi: 10.1111/j.1365-294X.2012.05538.x
Stackebrandt, E., and Goebel, B. M. (1994). Taxonomic note: a place for DNA-DNA reassociation and 16S rRNA sequence analysis in the present species definition in bacteriology. Int. J. Syst. Evol. Microbiol. 44, 846–849. doi: 10.1099/00207713-44-4-846
Stenger-Kovács, C., Buczk,ó, K., Hajnal, É., and Padisák, J. (2007). Epiphytic, littoral diatoms as bioindicators of shallow lake trophic status: Trophic Diatom Index for Lakes (TDIL) developed in Hungary. Hydrobiologia 589, 141–154. doi: 10.1007/s10750-007-0729-z
Taberlet, P., Coissac, E., Pompanon, F., Brochmann, C., and Willerslev, E. (2012). Towards next-generation biodiversity assessment using DNA metabarcoding. Mol. Ecol. 21, 2045–2050. doi: 10.1111/j.1365-294X.2012.05470.x
Tapolczai, K., Bouchez, A., Stenger-Kovács, C., Padisák, J., and Rimet, F. (2017). Taxonomy- or trait-based ecological assessment for tropical rivers? Case study on benthic diatoms in Mayotte island (France, Indian Ocean). Sci. Total Environ. 607–608, 1293–1303. doi: 10.1016/j.scitotenv.2017.07.093
Tapolczai, K., Vasselon, V., Bouchez, A., Stenger-Kovács, C., Padisák, J., and Rimet, F. (2019). The impact of OTU sequence similarity threshold on diatom-based bioassessment: a case study of the rivers of Mayotte (France, Indian Ocean). Ecol. Evol. 9, 166–179. doi: 10.1002/ece3.4701
Tikhonov, M., Leach, R. W., and Wingreen, N. S. (2015). Interpreting 16S metagenomic data without clustering to achieve sub-OTU resolution. ISME J. 9, 68–80. doi: 10.1038/ismej.2014.117
Vasselon, V., Bouchez, A., Rimet, F., Jacquet, S., Trobajo, R., Corniquel, M., et al. (2018). Avoiding quantification bias in metabarcoding: application of a cell biovolume correction factor in diatom molecular biomonitoring. Methods Ecol. Evol. 9, 1060–1069. doi: 10.1111/2041-210X.12960
Vasselon, V., Domaizon, I., Rimet, F., Kahlert, M., and Bouchez, A. (2017a). Application of high-throughput sequencing (HTS) metabarcoding to diatom biomonitoring: do DNA extraction methods matter? Freshw. Sci. 36, 162–177. doi: 10.1086/690649
Vasselon, V., Rimet, F., Tapolczai, K., and Bouchez, A. (2017b). Assessing ecological status with diatoms DNA metabarcoding: scaling-up on a WFD monitoring network (Mayotte island, France). Ecol. Indic. 82, 1–12. doi: 10.1016/j.ecolind.2017.06.024
Venables, W. N., and Ripley, B. D. (2002). Modern Applied Statistics with S. 4th Edn. New York, NY: Springer. Available online at: http://www.stats.ox.ac.uk/pub/MASS4 (accessed September 27, 2019).
Visco, J. A., Apothéloz-Perret-Gentil, L., Cordonier, A., Esling, P., Pillet, L., and Pawlowski, J. (2015). Environmental monitoring: inferring the diatom index from next-generation sequencing data. Environ. Sci. Technol. 49, 7597–7605. doi: 10.1021/es506158m
Westcott, S. L., and Schloss, P. D. (2017). OptiClust, an improved method for assigning amplicon-based sequence data to operational taxonomic units. mSphere 2:e00073–17. doi: 10.1128/mSphereDirect.00073-17
Zelinka, M., and Marvan, P. (1961). Zur präzisierung der biologischen klassifikation der reinheit flies sender gewässer. Arch. Hydrobiol. 57, 389–407.
Keywords: bioassessment, biomonitoring, diatoms, high-throughput sequencing, metabarcoding
Citation: Tapolczai K, Keck F, Bouchez A, Rimet F, Kahlert M and Vasselon V (2019) Diatom DNA Metabarcoding for Biomonitoring: Strategies to Avoid Major Taxonomical and Bioinformatical Biases Limiting Molecular Indices Capacities. Front. Ecol. Evol. 7:409. doi: 10.3389/fevo.2019.00409
Received: 14 June 2019; Accepted: 10 October 2019;
Published: 29 October 2019.
Edited by:
Dominique Gravel, Université de Sherbrooke, CanadaReviewed by:
Anastasija Zaiko, Cawthron Institute, New ZealandTristan Cordier, Université de Genève, Switzerland
Copyright © 2019 Tapolczai, Keck, Bouchez, Rimet, Kahlert and Vasselon. This is an open-access article distributed under the terms of the Creative Commons Attribution License (CC BY). The use, distribution or reproduction in other forums is permitted, provided the original author(s) and the copyright owner(s) are credited and that the original publication in this journal is cited, in accordance with accepted academic practice. No use, distribution or reproduction is permitted which does not comply with these terms.
*Correspondence: Kálmán Tapolczai, tapolczai.kalman@gmail.com
†These authors have contributed equally to this work