Lord of the Diptera (and Moths and a Spider): Molecular Diet Analyses and Foraging Ecology of Indiana Bats in Illinois
 Devon R. O'Rourke1*†
  Matthew T. Mangan2
  Karen E. Mangan2
  Nicholas A. Bokulich3
  Matthew D. MacManes1
  Jeffrey T. Foster1†
- 1Department of Molecular, Cellular, and Biomedical Sciences, University of New Hampshire, Durham, NH, United States
- 2US Fish and Wildlife Service, Cypress Creek National Wildlife Refuge, Ullin, IL, United States
- 3Laboratory of Food Systems Biotechnology, Institute of Food, Nutrition, and Health, ETH Zürich, Zurich, Switzerland
Effective management of endangered or threatened wildlife requires an understanding of how foraging habitats are used by those populations. Molecular diet analysis of fecal samples offers a cost-effective and non-invasive method to investigate how diets of wild populations vary with respect to spatial and temporal factors. For the federally endangered Indiana bat (Myotis sodalis), documenting its preferred food sources can provide critical information to promote effective conservation of this federally endangered species. Using cytochrome oxidase I amplicon sequence data from Indiana bat guano samples collected at two roosting areas in Cypress Creek National Wildlife Refuge, we found that dipteran taxa (i.e., flies) associated with riparian habitats were the most frequently detected taxon and represented the majority of the sequence diversity among the arthropods sampled. A select few arthropods from other taxa—especially spiders—are also likely important to Indiana bat diets in this refuge. A supervised learning analysis of diet components suggest only a small fraction of the frequently detected taxa are important contributors to spatial and temporal variation. Overall, these data depict the Indiana bat as a generalist consumer whose diet includes some prey items associated with particular seasonal or spatial components, along with other taxa repeatedly consumed throughout the entire foraging season. These molecular diet analyses suggest that protecting foraging resources specifically associated with the riparian habitat of Cypress Creek National Wildlife Refuge is essential to promote effective Indiana bat conservation.
Introduction
The Indiana bat, Myotis sodalis, has the dubious distinction of being the first North American bat listed under the Endangered Species Preservation Act (Udall, 1967). The historically broad distribution of Indiana bats once spanned much of the eastern United States (Thomson, 1982), however populations were dramatically reduced through decades of anthropogenic effects on habitat and required regional and national efforts to mitigate declines (Brady et al., 1983; O'Shea and Bogan, 2003; Lewis, 2007). Indiana bat populations appeared stable from the 1980s through the early 2000s (Thogmartin et al., 2012; King, 2019), but the emergence of White-Nose Syndrome (WNS)—an infectious disease caused by a fungal pathogen (Lorch et al., 2011; Warnecke et al., 2012)—has decimated several bat species, resulting in near complete loss of some species at particular hibernation sites (Frick et al., 2010; Turner et al., 2011). WNS has been particularly devastating to Indiana bats in the Northeastern U.S. (Thogmartin et al., 2012; Jachowski et al., 2014; King, 2019), and populations are currently concentrated primarily in just four states; Kentucky, Missouri, Indiana, and Illinois populations constitute over 95% of all Indiana bats detected in winter 2019 (King, 2019).
Effective bat conservation requires protecting critical resources such as winter and summer habitats (Lewis, 2007; Johnson and King, 2018). Importantly, these summer habitat resources consist of both maternity colony sites as well as foraging areas. Understanding the particular foraging habitats used by bats from maternity colony roosts, for example, has led to refined strategies by policy-holders to engage with land managers (Johnson and King, 2018). However, Indiana bats occupy distinct territories within a landscape and often travel several kilometers between foraging habitats and roost sites (Garner and Gardner, 1992; Murray and Kurta, 2004). Thus, research that identifies preferences about roost site selection, for example Jachowski et al. (2016), provides essential information for guiding conservation practices, but does not fully convey the habitat needs of the species. Understanding food preferences may identify unique and additional required habitat in need of protection.
Radio-telemetry has identified foraging preferences of Indiana bats for forested areas in largely agricultural (Menzel et al., 2005; Womack et al., 2013) and urban (Sparks et al., 2005) landscapes. These studies highlight the growing importance of protecting the increasingly fragmented forested environments these bats use for both maternity colony roosts as well as foraging. Nevertheless, telemetry data may underestimate the home range used by Indiana bats (Womack et al., 2013) and discriminating which parts of the landscape are required habitat for the primary prey items is inherently challenging. For example, a bat may be infrequently detected over water, but aquatic prey items may be essential to the bat's diet. Alternatively, diet analysis can offer insights into the particular taxa consumed by the bat species, and thus further refine which habitats are essential for foraging, and therefore in greatest need of management and protection.
Previous studies using visual identification of arthropods in bat guano suggest that Indiana bats are frequent consumers of dipterans (flies), coleopterans (beetles), and lepidopterans (moths and butterflies) (Sparks et al., 2005; Tuttle et al., 2006), as well as trichopterans (caddisflies) in certain conditions (Murray and Kurta, 2004). However, such studies are limited by the number of samples analyzed and the specificity of the diet components identified: manual inspection requires substantial taxonomic expertise and time to classify arthropod contents. Further, even expert visual identification of arthropods in bat diets are typically limited to order or family-level specificity, and can fail to identify some prey completely—particularly soft bodied taxa (Kunz and Whitaker, 1983). The lack of precise taxonomic identification of food items makes it challenging to translate observations into detailed management strategies. Fortunately, adopting a molecular approach to diet analysis can provide the necessary taxonomic resolution to detail the breadth and specificity of Indiana bat foraging behaviors, and therefore give a more complete understanding of the habitat needs of the species. Furthermore, this workflow scales efficiently to hundreds or thousands of samples without requiring months or years of time invested, and can provide detailed information of arthropod diet composition regardless of the particular bat species. This allows for a comprehensive evaluation of diet and therefore foraging habitat requirements for many of the critically endangered bat species in North America. In the case of the Cypress Creek National Wildlife Refuge, this information can be used to inform the particular habitats in most need of protection.
Located in between the Ohio and Mississippi Rivers in Southern Illinois, Cypress Creek National Wildlife Refuge contains riparian bottomland hardwood forests—ideal summer roosting habitats (Cable et al., 2020). In addition, it is within 8 km of a large Indiana bat hibernaculum (Brown and Melius, 2014). However, concerns about habitat loss and limited roost availability served as an impetus to evaluate if artificial roost structures installed in the refuge would expand roosting use to areas that were otherwise not suitable for maternity colonies (Mangan and Mangan, 2017). Prior mist-netting and radio-telemetry surveys of the region indicated that bats occupied a particular stretch of riparian habitat surrounded by agricultural landscapes (Mangan and Mangan, 2019a). In fact, this radio-tracking led to confirmation of an Indiana bat occupying one of Egner roosts, which served as an impetus for conducting this diet work. These results indicated the area as suitable roosting habitat for bat maternity colonies, but it was unclear whether or not the same habitat was important for bat foraging.
DNA barcoding (or metabarcoding) provides a cost-effective method to rapidly generate datasets rich with taxonomic information (Valentini et al., 2009; Pompanon et al., 2012; Alberdi et al., 2018, 2019; Nielsen et al., 2018). Molecular diet analyses have been widely applied to a range of systems and organisms, although the methodology is not without challenges and biases (Nielsen et al., 2018; Alberdi et al., 2019). Early bat diet studies using a molecular approach described greater breadth and specificity of prey items consumed compared to traditional microscopy (Clare et al., 2009; Zeale et al., 2011). While both in silico (Clarke et al., 2014) and empirical (Hope et al., 2014) studies have identified potential taxa that may be missed due to PCR biases, recent modifications of primer sequences have resolved many of the amplification issues for certain taxa (Jusino et al., 2019). Subsequent applications using this molecular method have revealed key features of bat foraging in several Myotis species that can be used to optimize management decisions regarding habitat preservation. For instance, the genus or species-level taxonomic resolution using these molecular methods indicates prey specificity for Myotis septentrionalis (Dodd et al., 2012) and M. daubentonii (Vesterinen et al., 2016); protections for the habitats that sustain these prey items would ensure these bats have available food resources.
Metabarcoding has improved both the specificity of bat diet contents as well as potential spatial and temporal changes in foraging patterns. For example, studies of M. lucifugus indicate that core dietary components can vary both by location (Clare et al., 2011) and season (Clare et al., 2014), suggesting that incorporating diet information into conservation efforts may require factoring in regional and temporal variation into management considerations. However, metabarcoding diet interpretations are complicated by whether or not a researcher chooses to link the sequence data (i.e., counts of amplicons) to species abundances (Alberdi et al., 2019; Deagle et al., 2019). We conducted our diversity analyses using both abundance-unweighted and weighted means to provide an example of how the inclusion or exclusion of sequence count information can potentially alter the subsequent inferences made from the data.
In addition, management policy would benefit by moving beyond simple lists of prey items detected in batches of guano, and evaluate if specific diet components are important to particular classes of metadata. We applied a Random Forest classifier—a supervised learning tool (a type of machine learning)—to determine what bat diet components were most important in predicting the location or site a sample was collected. These data can assist in identifying whether the same foraging areas are needed to be protected at all points of the year, and whether or not particular locations are more important for conservation with respect to Indiana bat foraging. This form of supervised learning has been applied to a range of 16S rRNA and ITS amplicon studies including identifying origins of ballast water (Gerhard and Gunsch, 2019), predicting taxonomic signatures of host fecal microbiomes (Roguet et al., 2018), understanding maternal microbiome patterns associated with preterm delivery (Dahl et al., 2017), and predicting wine metabolite profiles (Bokulich et al., 2016). Rather than summarizing the unique sequence variants of the data directly (e.g., through ordination), important sequences are identified in Random Forest classifiers by quantifying their relative contribution to the predictive accuracy of a model (Breiman, 2001; Bokulich et al., 2018b).
Guano collected as part of this study afforded an opportunity to provide the first molecular analysis of Indiana bat diets. Indiana bats are one of several threatened or endangered species in need of significant protections, and identifying trends in foraging habits serve to complement ongoing efforts to identify relevant habitat to preserve. The methods described herein offer one such means to attain improved species protections based on a detailed understanding of diet and foraging.
Materials and Methods
Data Availability
Data, figures, and scripts applied are Available online at the GitHub repository for this project: https://github.com/devonorourke/mysosoup. Supplementary Tables 1–3 referred to herein are available online at this repository in the “Supplementary Material” directory. We provide additional documentation for sequencing processing, database curation, classification, and diversity estimates in a “docs” folder within that GitHub repository—see the bioinformatics sections below for links to each of these documents. Raw sequences for this project are Available online at BioProject PRJNA548356. Database files are stored in the Open Source Frameworks repo of this project: https://osf.io/qju3w/. A Zenodo archive of this repository is available for download here: https://zenodo.org/badge/latestdoi/176534517.
Site Selection and Guano Collection
The Cache River Watershed comprises thousands of acres of riparian wetland forests essential to Indiana Bat foraging and roosting, and is contained within the current ~17,000 acre Cypress Creek National Wildlife Refuge. The sampling sites were on two tracts of land approximately three miles apart: Hickory Bottoms and Egner (Figure 1). Each tract contained four artificial Brandenbark™ roosting habitats (Adams et al., 2015); installation of the structures was completed in 2014. These tracts consist of agricultural land mixed with mature bottomland forests containing live and standing dead trees or snags with exfoliated bark or crevices suitable for Indiana bat roosts. Both locations have adjacent riparian habitat, with Egner roosts abutting the Cache River, and Hickory Bottoms abutting Cypress Creek. Use of these structures by Indiana bats was determined through fieldwork conducted in July and August 2016 at the refuge using mist-netting, radio-telemetry, and acoustic surveys (Mangan and Mangan, 2019a).
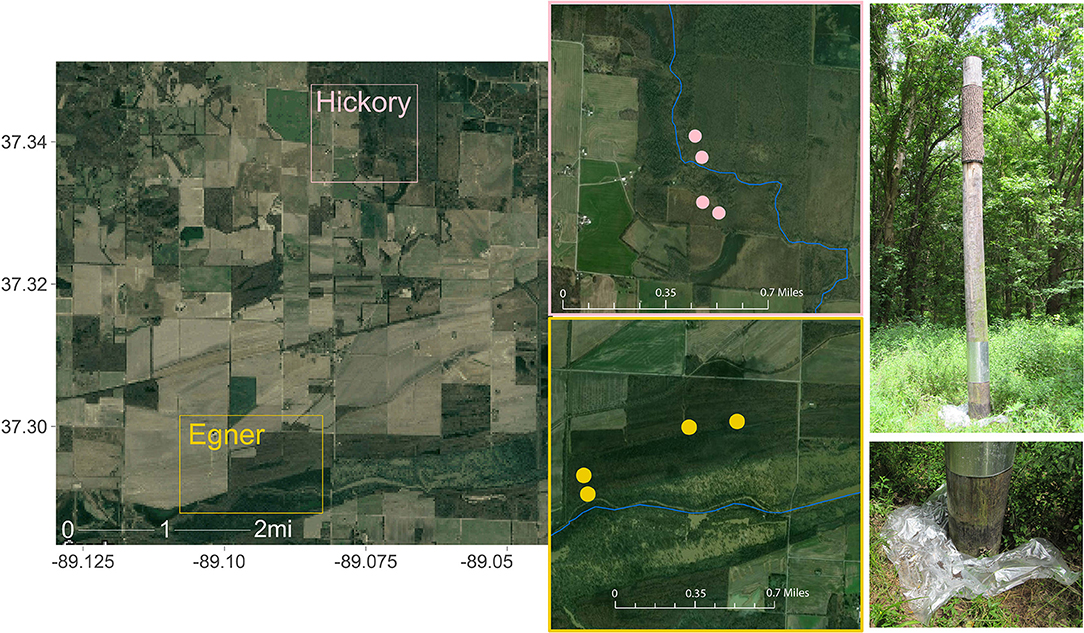
Figure 1. Collection sites within Cypress Creek National Wildlife Refuge (CCNWR), which is situated in southern Illinois and consists of ~17,000 acres of wetland, forested, and grassland habitats. The Cache River Unit comprises just 1,136 acres of riparian wetland forests essential to Indiana Bat foraging and roosting. Guano was collected from two locations ~3 miles apart: Hickory Bottoms (Hickory) and Egner. Each collection area contained 4 artificial roosting habitats, depicted as points on each inset map. Sources: Google, ESRI, DigitalGlobe, GeoEye, Earthstar Geographics, CNES/Airbus DS, USDA, USGS, AeroGRID, IGN, and the GIS User Community.
Guano was collected at each of the eight roosts June 21, July 27, and September 15, 2017. These dates correspond to the periods prior to or during parturition and weaning in June and July respectively, and in September during expected fall migration. Plastic sheets were placed at the base of each roost the night prior to collection and replaced with new sheets before the next collection date. Up to ten guano pellets were obtained at each roost at each date using sterile forceps and were stored individually in microcentrifuge tubes. All guano was sent to the University of New Hampshire and stored at −80°C until DNA extraction. We limited our analyses to single-pellet guano samples, although bulk samples of guano containing many pellets were also collected.
DNA Extraction
Guano pellets were extracted using the Qiagen DNeasy PowerSoil kits (Qiagen, Hilden, Germany) following manufacturer guidelines. Two 96-well plates were used to process 175 individual pellets and included either 5 or 9 negative control wells. The remaining 41 individual pellets were processed with single tube extractions using the same kit chemistry. All samples were eluted with 100 μL of elution buffer.
Metabarcoding
Concentrations of guano extract DNA were estimated with a Nanodrop spectrophotometer (Thermo Fisher, Waltham, MA, USA) to guide the appropriate volumes of sample to add for subsequent normalization with SequalPrep plates following manufacturer guidelines (Applied Biosystems, Foster City, CA, USA). Highly concentrated samples were diluted so that samples were standardized to ~2 ng/μL prior to normalization. Normalized DNA was used as input for our overlap extension PCR method that targets arthropod COI fragments. Arthropod COI gene fragments are targeted for amplification using primers detailed in Cable et al. (2020). We modified the original primer sequences to preserve the COI-specific regions, but added 5′ extensions of 17 and 19 bp, respectively. The constructs below illustrate these additional tails (bold underlined bases) as part of the modified oligos using the original Jusino sequences (not underlined):
UT-ANML-LCO1490: 5′-ACCCAACTGAATGGAGCGGTCAACAAATCATAAAGATATTGG-3′
UT-ANML-CO1-CFMRa: 5′-ACGCACTTGACTTGTCTTCGGTCAACAAATCATAAAGATATTGGGGWACTAATCAATTTCCAAATCC-3′.
Samples were amplified in 15 μL reactions, with 3 μL of normalized guano DNA extract added to 12 μL of solution containing 0.2 μM of the forward and reverse primers, 0.16 μg/μL BSA, 0.03 U/μL Platinum Taq, 0.2 mM dNTPs, 1.5 mM MgCl2, and 1.5 μL of 10X buffer (Invitrogen, Carlsbad, CA, USA). Thermal cycler settings for the reaction consisted of an initial 5 min denaturation at 94°C, followed by 5 cycles of 60 s at 94°C, 90 s at 45°C, and 90 s at 72°C; an additional 35 cycles of 60 s at 94°C, 90 s at 50°C, and 60 s at 72°C; and finally a 10 min extension at 72°C.
PCR reactions were subjected to a 1X AMPure XP bead cleanup (Agilent Technologies, Santa Clara, CA, USA) and 10 μL of the concentrated solution was normalized in SequalPrep plates (Applied Biosystems, Foster City, CA, USA). These normalized PCR products were then subject to a second amplification using custom oligos that contained the requisite Illumina adapters, a distinct 8mer barcode, and the complementary sequence to overlap with the 5′ terminus of the amplicon. The example below illustrates an example of these constructs, where the underlined portion represents an 8mer barcode, with the Illumina adapters upstream of the barcode, and the complementary overlap downstream from the barcode (in bold) to facilitate polymerase extension of the original PCR product:
Indexed-UT1-example_pair1a: 5′-AATGATACGGCGACCACCGAGATCTACACCACACAAAGCTGGTCATCGTACCCAACTGAATGGAGC-3′
Indexed-UT1-example_pair1b:
5′-CAAGCAGAAGACGGCATACGAGATTTTGTGTGAGTCAGTCAGCCACGCACTTGACTTGTCTTC-3′.
We added 2 μL of normalized PCR products (from the initial amplification) with 0.4 μM of each index primer in 25 μL reaction volumes using KAPA HiFi HotStart ReadyMix (KAPA Biosystems, Wilmington, MA, USA). Reaction conditions consisted of a 2 min denaturation at 98°C, followed by 10 cycles of 30 s at 98°C, 20 s at 60°C, and 30 s at 72°C, and a final extension for 5 min at 72°C. These final PCR products were subject to another 1X bead cleanup and normalization following the same methods described above. We created the final library by pooling 10 μL of normalized PCR products into a single tube and concentrated to 40 μL with a 1X bead cleanup.
Library concentration was quantified by qPCR using the KAPA ROX Low Complete Kit (KAPA Biosystems, Wilmington, MA, USA). An Illumina MiSeq sequencer (Illumina, San Diego, CA, USA) with v3 chemistry generated 600 cycles of 2 × 300 bp paired-end reads.
Bioinformatics
Sequence Denoising and Filtering
Demultiplexed sequences were trimmed using Cutadapt v.1.18 (Martin, 2011) using “-m 100 –trimmed-only” parameters to retain only sequences at least 100 base pairs in length and with a detectable primer sequence. Trimmed reads were imported into a QIIME 2 v2019.10 environment (Bolyen et al., 2019) and representative sequences were identified using DADA2 v1.6.0 (Callahan et al., 2016) via the q2-dada2 QIIME 2 plugin function “qiime dada2 denoise-paired” that included retaining only the first 175 bases of the forward and reverse sequences via the “–p-trunc-len” parameter. Full details regarding sequence processing commands are described here: https://github.com/devonorourke/mysosoup/blob/master/docs/sequence_processing.md.
Because 7 of the 15 control samples (from 96-well plate DNA extractions) retained denoised sequences, we investigated whether the sequence variants present in control samples were due to contamination either through DNA extraction or PCR amplification. We found no evidence of systemic contamination, and removed the negative control samples from subsequent analysis. We justify this decision using the strategies discussed here: https://github.com/devonorourke/mysosoup/blob/master/docs/contamination_investigations.md.
Construction of Databases for Taxonomic Classification
The primers used in this study were shown previously to amplify bat COI (Jusino et al., 2019). To identify which bats contributed the guano collected in the experiment, we created a host database consisting of sequences derived from all known bat species in the region. In addition, we included all other known host reference sequences from other guano-related projects in our lab as a precaution for potential cross contamination (ultimately no unexpected host sequences were detected). Full details regarding host database design are documented here: https://github.com/devonorourke/mysosoup/blob/master/docs/host_database.md.
A second (larger) database was constructed as an additional method to identify any bat DNA missing from our smaller custom database, as well as to classify all other sequence features present in our dataset. We collected reference sequences and associated taxonomy information from two resources: BOLD (Ratnasingham and Hebert, 2007) and a GenBank-derived dataset curated by Terri Porter (Porter and Hajibabaei, 2018). Reference sequences included COI records from arthropod, chordate, and other animal taxa, as well as fungal, protist, and other microeukaryote COI records. We dereplicated the initial collection of sequences, then applied a Least Common Ancestor (LCA) process using a consensus approach to classify records that shared identical sequence information but differed with respect to taxonomic information. Additional filters included discarding references with non-standard IUPAC DNA characters, removing sequences <100 bp, and retaining only references that contained at least family-level names. The final dataset included 2,181,331 distinct sequences. The construction of this database is described here: https://github.com/devonorourke/mysosoup/blob/master/docs/database_construction.md.
Taxonomic Classification
We identified host sequences using a combination of alignment and machine learning approaches to independently confirm what bat species contributed to the guano in this experiment. The denoised representative sequences were initially aligned to our custom host database of bat sequences using VSEARCH (Rognes et al., 2016) to identify and separate host ASVs from non-host ASVs. Candidate matches were subsequently queried with NCBI BLAST (Camacho et al., 2009) to confirm host identities. We then used our larger COI database as a third means with which to discriminate among host and non-host sequences. Sequence features were classified using two methods available through the QIIME 2 plugin q2-feature-classifier (Bokulich et al., 2018a,b): first, a VSEARCH global alignment approach followed by least common ancestry taxonomy assignment with “qiime feature-classifier classify-consensus-vsearch”; and second, a supervised learning naive Bayes classifier with “qiime feature-classifier classify-sklearn.” All methods identified a common set of bat-associated ASVs from the original dataset, and were used to determine the proportion of the various bat species detected in the guano. Importantly, we found that nearly all sequence data classified as host DNA belonged to M. sodalis, the species we expected from previous (Mangan and Mangan, 2019a) and subsequent (Mangan and Mangan, 2019b) surveillance work that concluded that the Indiana bat was the primary occupant of the artificial roosts where guano was collected. We discarded samples from our analyses for instances in which a bat host other than M. sodalis was assigned specifically to that sample.
For our diet analyses, representative sequences were further clustered with “qiime vsearch cluster-features-de-novo” using a 98.5% identity. Clustered sequence variants were classified using a hybrid approach that involved assigning taxonomic names using both naive Bayes and VSEARCH+LCA classifier methods in q2-feature-classifier. This approach prioritizes those records with exact alignments first using VSEARCH (those taxa with 100% identity and at least 94% coverage), and any clustered sequence variants that remained unclassified following this initial alignment are then classified using the naive Bayes method approach. Only those clustered sequences assigned to the Arthropoda phylum, with at least family-level taxonomic names, were retained for diversity estimates and supervised learning analyses.
Full details describing the host identification methods are described here: https://github.com/devonorourke/mysosoup/blob/master/docs/classify_sequences.md.
Diversity Estimates
We used several different approaches to generate diversity estimates, with careful attention to the suitability of the estimator in relation to the data type, making sure comparisons controlled for factors such as sequencing depth, and correcting for multiple comparisons. The dietary components identified as representative sequence clusters were rarefied to 10,000 sequences per sample for diversity estimates. Observed richness and Shannon's entropy values were calculated for these representative sequence clusters. Because the subsequent values did not follow a normal distribution (p-values <0.01 using Shapiro-Wilks test), we applied a Kruskal-Wallis non-parametric test to compare whether there were differences between groups collected in particular Site + Month combinations (e.g., Egner in June, Egner in July, Hickory in September, etc.). Significance values of pairwise differences were calculated using a Wilcoxon rank sum test, using a Benjamini-Hochberg correction for multiple testing.
Community composition among diet components was assessed using two different approaches: one using a presence-absence analysis of the sequence variants detected in each sample, and one incorporating the abundance information associated with the counts of sequence variants. Specifically, dissimilarities in composition of representative sequence variants were evaluated with non-phylogenetic binary (Dice-Sorensen) and abundance-weighted (Bray-Curtis) distances, as well as phylogeny-weighted binary and abundance-weighted distances. We explored these dissimilarities using Principal Coordinates Analysis, visualizing the first two principal components for each distance metric. Main effects of site and month on community composition were tested using the Vegan “Adonis” function; we also performed an analysis of multivariate homogeneity of group dispersions with the Vegan “betadisper” function.
Full details describing associated sequence processing, and associated R scripts used in generating the figures and data tables presented herein are described here:
https://github.com/devonorourke/mysosoup/blob/master/docs/diversity_workflow.md.
Core Features and Supervised Learning
Non-rarefied clustered sequence data was filtered to identify those variants present in at least 10% (20 or more) of guano samples using the QIIME2 “feature-table core-features” function. These core sequence variants were used in a custom R script to generate the summary figure and tables comparing the frequency of occurrence and sequence abundances for each OTU among samples.
These “core” sequence features were used in the subsequent supervised learning approach via the QIIME 2 “classify-samples-ncv” pipeline (part of the q2-sample-classifier (Pedregosa et al., 2011; Bokulich et al., 2018b) plugin) to train Random Forest classifiers. This nested cross-validation approach works in a similar fashion to standard splitting of data into testing and training subsets, but repeats the testing/training process k-times. In reshuffling the data we ensure that all sequence features are tested for relative importance to a model. Three classifiers were built and tested: a model for site, a model for month, and a model for site + month metadata classes. We increased the number of decision trees available to the model from the default (100) to 1,000 estimators, with the intention of improving the predictive accuracy. In addition, we selected an option to identify optimal feature selection (–p-parameter-tuning) which automatically selects the number of features considered during node splits on a given decision tree. Complete details for QIIME functions and associated R scripts visualizing the output are documented here:
https://github.com/devonorourke/mysosoup/blob/master/docs/diversity_workflow.md.
Additional software
Figures and statistical analyses were performed in R (R Core Team, 2018) using multiple libraries (Paradis et al., 2004; Wickham, 2007, 2017, 2018, 2019; Chamberlain and Szöcs, 2013; Kahle and Wickham, 2013; Chamberlain et al., 2014; Lumley, 2016; Ren and Russel, 2016; Wilke, 2017; Bates and Maechler, 2018; Bisanz, 2018; Garnier, 2018; Kassambara, 2018; Ogle et al., 2018; Pedersen and Crameri, 2018; Slowikowski, 2018; Graves et al., 2019; Oswaldo, 2019; Pedersen and Robinson, 2019; Wickham et al., 2020). QIIME 2 plugins for data processing and diversity analyses were also utilized (McKinney, 2010; Price et al., 2010; McDonald et al., 2012; Weiss et al., 2017; Robeson et al., 2020).
Results
We applied a metabarcoding technique to amplify arthropod COI gene fragments and generated sequence data from hundreds of bat guano samples collected at artificial roosts erected at two locations in the Cypress Creek National Wildlife Refuge during the summer of 2017 (Figure 1). Although the primers used to amplify COI fragments were designed for arthropod sequences, other COI sequences such as host DNA often amplify as well. Thus, we first identified and separated host from non-host sequence variants. In 144 of our 196 single-pellet samples sequence variants classified exclusively to one of three bat species: Indiana bat (M. sodalis), little brown bat (M. lucifugus), and evening bat (Nycticeius humeralis) (Supplementary Table 1). The vast majority of these were classified as Indiana bat (137 samples), with rare detections of little brown bat (5 samples) and evening bat (2 samples). Those seven samples classified uniquely to little brown and evening bats were disarded from our diet analyses. In addition, 11 samples contained sequence variants from two or more species, all of which included the Indiana bat; these were included in the diet analysis. We included guano samples that lacked host classification, as many samples did not generate any host sequences. These findings corroborate previous field observations (Mangan and Mangan, 2017, 2019a) that while other species transiently occupy similar roosts, the Indiana bat is the primary occupant of the colonies where guano was collected. We acknowledge that a minor fraction of arthropod data may have come from the diet of a bat species other than Indiana bat.
The breadth of arthropod taxa detected across all samples was substantial, with 1,070 unique sequence clusters classified to 19 arthropod orders among the 189 guano samples. However, a particular subset of arthropods was much more likely to be observed than others. Eight orders of arthropods were identified in more than 10% of samples: Araneae, Coleoptera, Diptera, Ephemeroptera, Hemiptera, Lepidoptera, Psocodea, and Trichoptera (Table 1). Among these taxa, just two arthropod orders represented more than half of all sequence clusters. OTUs are defined as the most abundant exact sequence variant observed in our data amongst all exact sequences within a 98.5% identity threshold. Diptera (397 OTUs representing over 37% of all classified taxa) and Lepidoptera (248 OTUs, 23% of taxa). Interestingly, the number of distinct sequence clusters classified to a particular order did not necessarily correlate with frequency of detection. Thus, while flies and moths were detected in the most samples and contained the greatest number of unique sequence clusters, nearly as many samples contained other detectable orders, but those particular orders contained far fewer distinct sequence clusters within that particular group. Spiders, for example, were detected in 175 samples (92%) despite representing only ~8% of all arthropod sequence clusters.
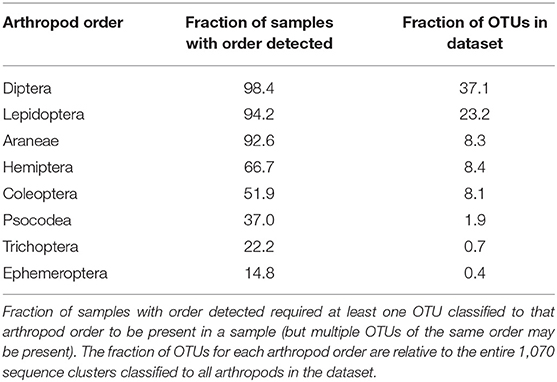
Table 1. Eight arthropod orders detected in at least 10% of samples.
Despite generating a taxonomically broad collection of arthropod amplicons, only a small fraction of these were routinely identified. Just 56 of the 1,070 arthropod sequence clusters were identified in at least 10% of our samples, with several OTUs containing common taxonomic labels (Table 2). Among these “core” sequence clusters, two-thirds were classified as dipteran (37 OTUs). These dipteran OTUs are dominated by taxa known to inhabit the native riparian habitat. For example, we detected limoniid craneflies such as Epiphragma solatrix (112 samples) and Erioptera caliptera (101 samples), and tipulids such as Nephrotoma ferruginea (76 samples). Mosquitoes such as Culex erraticus (121 samples) and Coquillettidia perturbans (58 samples) were also frequently detected. While the majority of the core sequence clusters were classified as flies, an orb-weaving spider classified to the genus Eustala was the most frequently detected sequence cluster in the entire dataset (146 samples). Non-dipteran core OTUs were distributed among seven arthropod orders with just three orders containing more than one representative sequence cluster: Araneae (7 OTUs), Lepidoptera (5 OTUs) and Psocodea (2 OTUs). These molecular-level data suggest Indiana bats in the Cypress Creek National Wildlife Refuge routinely eat a diverse assortment of flies, along with a particular few representative species of other arthropods, and especially orb-weaving spiders in the genus Eustala.
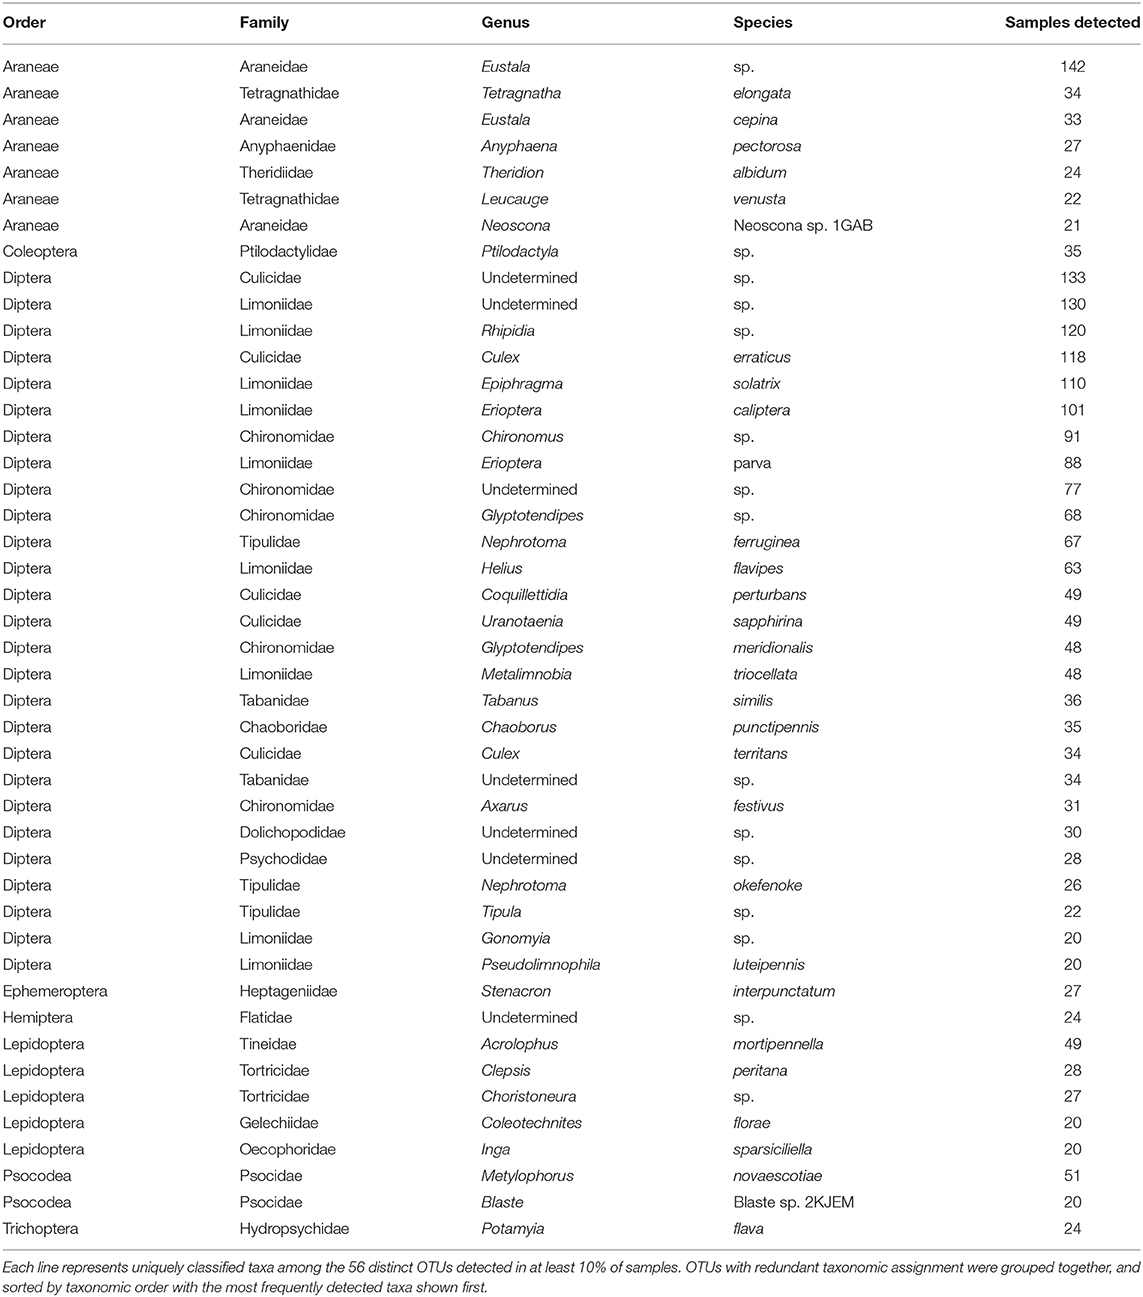
Table 2. Taxonomic information assigned to prevalent sequence clusters (OTUs) detected in Indiana bat guano.
We calculated the observed richness and Shannon's entropy of samples to investigate whether diet components were associated with the site and date a sample was collected (Figure 2). We applied a Kruskal-Wallis test to determine if the mean rank sums of diversity estimates of each site-date group varied, and found a significant difference for observed richness [H(5) = 25.389, p < 0.001], but not for Shannon's entropy [H(5) = 2.174, p = 0.825]. A Wilcoxon signed-rank test was applied to determine pairwise differences of the site-date group diversity estimate. Observed richness was higher among samples collected at Egner in June than either site in September, however, no differences in Shannon's diversity were detected among any site-date pair (Figure 2).
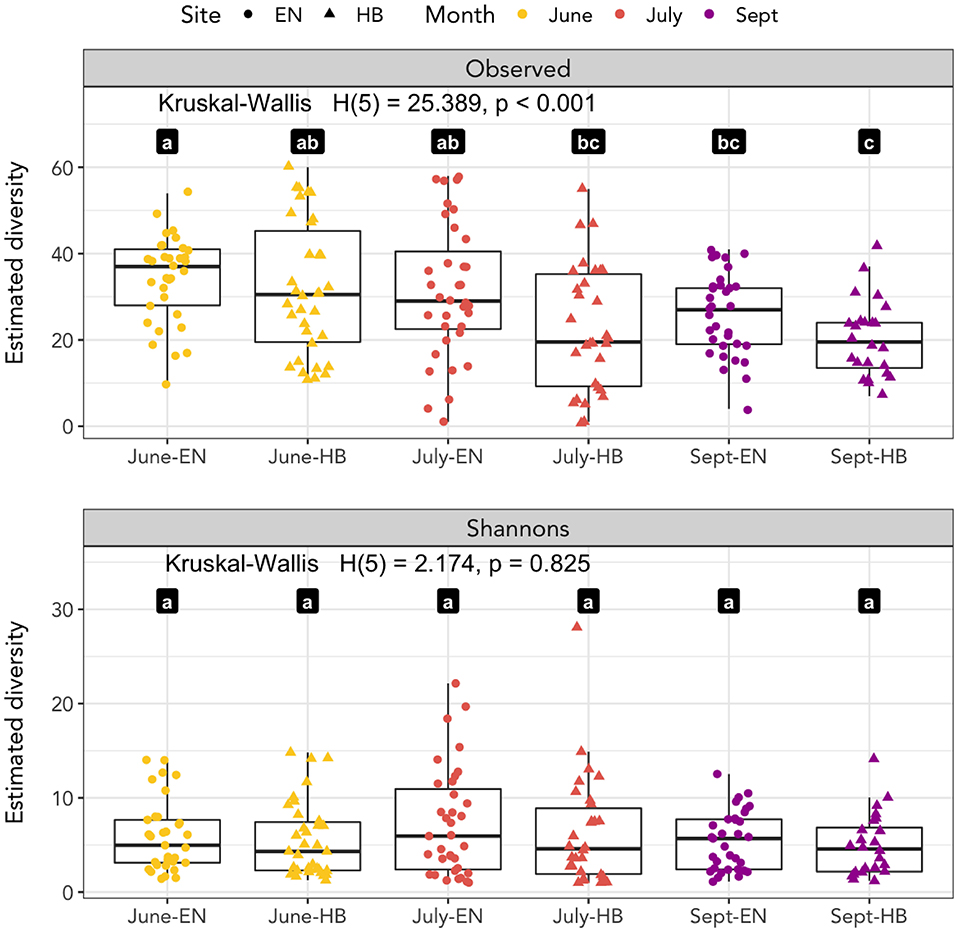
Figure 2. Species richness as measured by observed richness and Shannon's entropy. Significant differences between groups of samples collected at each site-date (Egner, “EN”; Hickory Bottoms, “HB”) represented by distinct lettered values.
We next explored how community composition varied among site+date groups, and evaluated the effect of using abundance and/or phylogenetic-weighted metrics. Using a multifactorial PERMANOVA (Adonis) to test for group differences in spatial median, we found significant effects (p < 0.01) for both site and date using every distance metric evaluated: Dice-Sorensen (non-abundance, non-phylogenetic), Bray-Curtis (abundance-weighted, non-phylogenetic), unweighted UniFrac (non-abundance, phylogenetic-weighted), and weighted UniFrac (abundance-weighted, phylogenetic-weighted) (Supplementary Table 2). We also tested for dispersion differences for each group using a univariate ANOVA, PERMDISP (betadisper), and found that the effect of site (p = 0.462) but not date (p < 0.001) were non-significant for weighted UniFrac. Group dispersions for all other metrics were significant at a threshold of p < 0.01, while the effect of date on dispersions of Bray-Curtis distances was marginally higher at p = 0.048 (Supplementary Table 3). Because we used a balanced design, these results suggest that month and site variability in community composition occur both because of spatial group median and dispersion differences for unweighted-abundance metrics. However, the non-significant dispersion result for the Weighted UniFrac group dispersion for the effect of site suggest that there are true compositional differences between collection sites. A Principal Coordinates Analysis of these distance measures indicate that these abundance-weighted metrics provided the greatest proportion of variance in the first two principal component axes (Figure 3), with samples associating more by site than by date. Nevertheless, the relatively small proportion of variation shown in these ordinations also support the notion that many of the prey items that bats consume are present throughout the entire sampling period of the study, thus the overall impact of month or site differences appear minor.
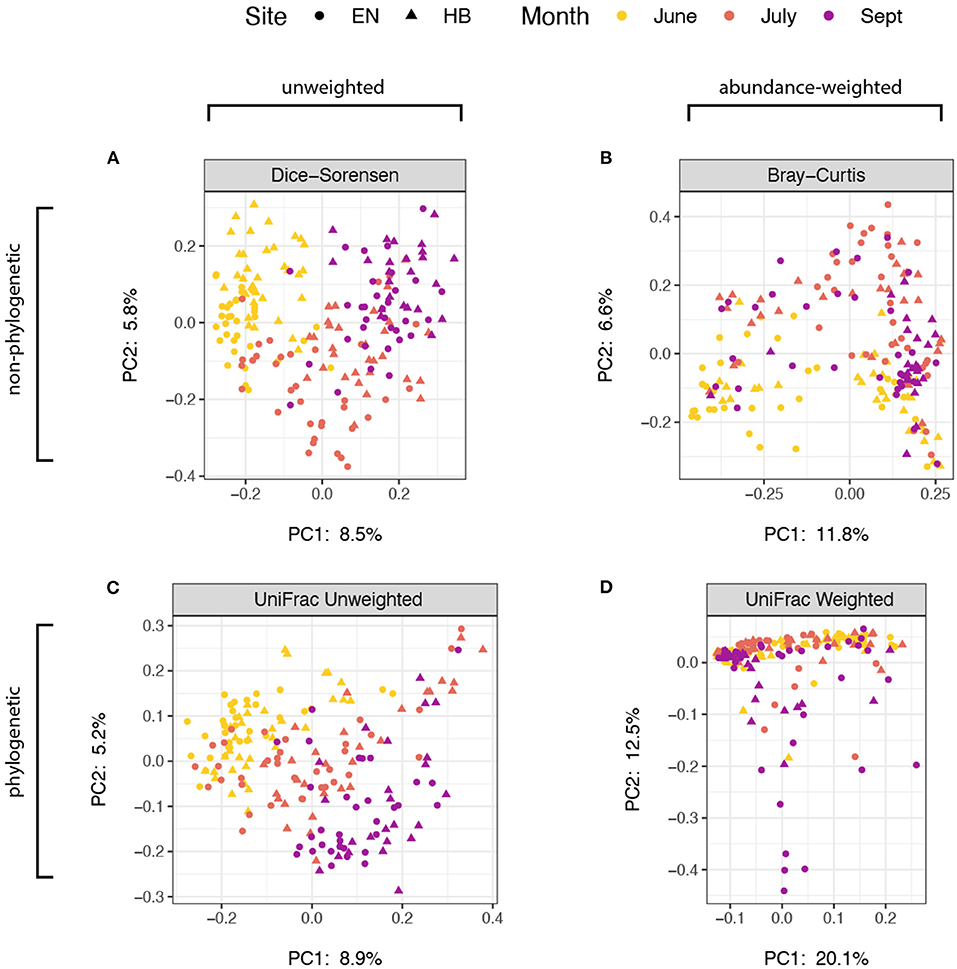
Figure 3. Principal coordinates analysis of distance estimate ordinated with samples distinguished by sampling site as points (Egner, “EN”; Hickory Bottoms, “HB”) and sampling month as colors. The four distance metrics varied with respect to sequence abundance and phylogenetic weights: (A) Dice-Sorensen, unweighted abundance and unweighted phylogenetic; (B) Bray-Curtis, weighted-abundance and unweighted phylogenetic; (C) UniFrac Unweighted, unweighted abundance, weighted phylogenetic; (D) UniFrac Weighted, weighted abundance and weighted phylogenetic. The proportion of variance captured by each of the first two principal component axes are shown.
A supervised learning regime was applied to the core sequence clusters by training Random Forest classifiers to each group (site, date, or site-date). For each group, we determined the accuracy of the model (that is, how often did a sample get assigned to its expected group), as well as calculated the relative importance of each OTU in building the model (OTUs with the greatest importance are those that best discriminate samples for a grouping variable). All three classifier models were successful in predicting a sample's grouping variable from the 56 core OTUs. The model correctly predicted a sample's collection month more than 85% of the time (Figure 4A), as well as the site for 75% of samples (Figure 4B), and the specific site+date for 77% of samples (Figure 4C). Most of these core OTUs do not play a significant role in discriminating samples between the site and date groups, as represented by their low relative importance to each model (Figure 4D). More than 50% of the overall importance to each model was accounted for by a few sequence clusters: 11 OTUs for site-date, 10 OTUs for site, and just 8 OTUs for date. These highly discriminant OTUs spanned a broad range of taxa, despite dipteran sequences dominating the overall dataset with respect to detections per sample and sequence cluster richness. For example, a barklice species, Metylophorus novaescotiae (OTU-1 in Figure 4D), was the most important sequence cluster for September samples at both sites (in fact, it had the highest individual importance score of any OTU for any model). A moth, Acrolophus mortipennella (OTU-2), was indicative of samples collected at both sites in June. A net spinning caddisfly, Potamyia flava (OTU-43), was the strongest indicator of a sample originating from the Hickory site. Dipteran sequence clusters were also relevant at discriminating between sampling date or site. For example, sequence clusters classified to Glyptotendipes (OTUs 19 and 33) predicted the sampling site, while a pair of mosquitoes, Uranotaenia sapphirina (OTU-4) and Culex erraticus (OTU-7) were discriminant for sampling date. Notably, the remaining core OTUs that failed to discriminate site or sampling month does not suggest their lack of importance to the Indiana bat diet—they simply share similar detection frequencies and sequence abundances frequencies, and therefore do not help the model differentiate a grouping variable.
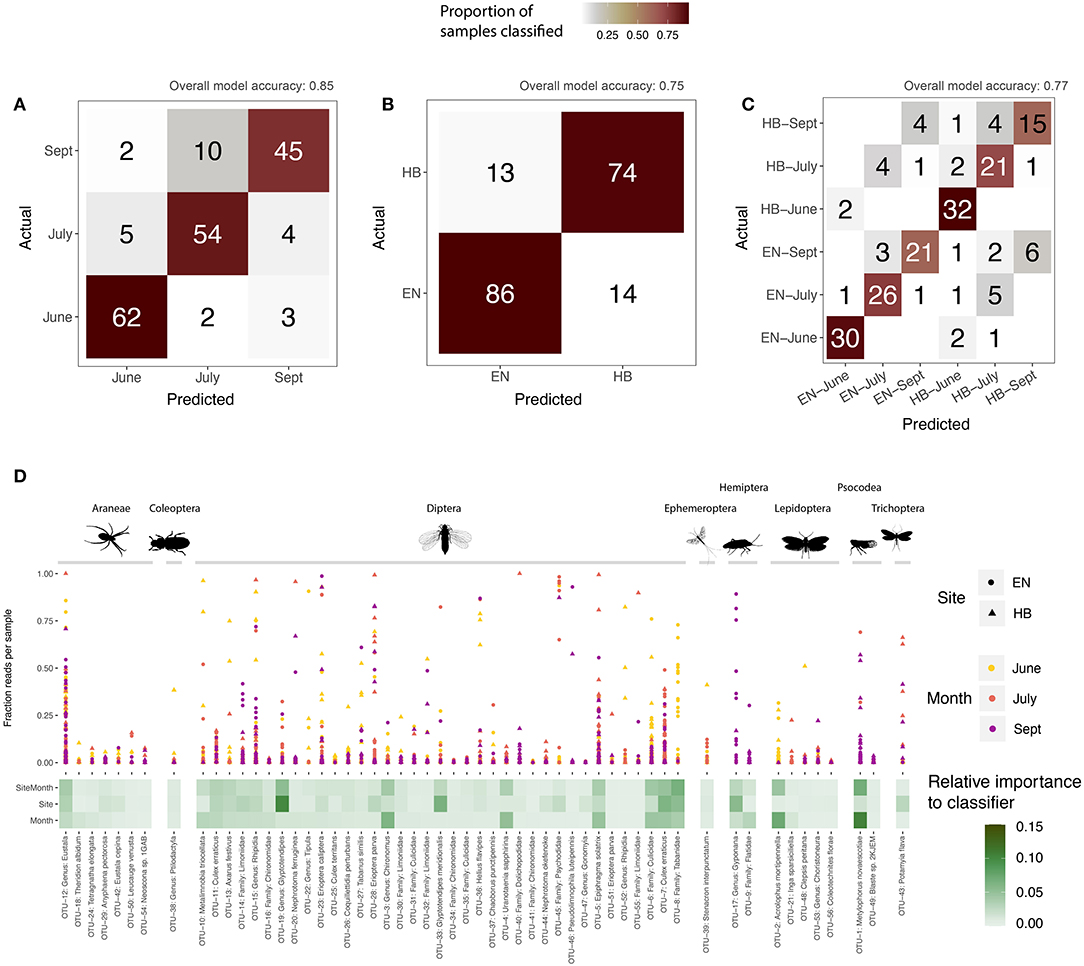
Figure 4. Supervised learning of core sequence clusters (OTUs) using Random Forest classifiers. Confusion matrices illustrate model accuracy, showing the number of samples predicted for each group: (A) sampling month; (B) sampling site (Egner, “EN”; Hickory Bottoms, “HB”); (C) sampling site and month. Overall accuracy for each model shown at top of confusion matrix. The relative importance of each OTU, for each model, is shown in (D), along with the proportion of sequences comprised of that OTU for each sample, defined by its sampling site and month.
Discussion
Much of existing bat conservation policy in North America focuses on identifying and conserving winter hibernacula and summer maternity roosts. With the decline of insects globally, and the direct impact on aerial insectivores such as bats, the need to connect diet and foraging to habitat needs is clear. For the Indiana bat specifically, a framework to understand the particular resources essential for foraging habitats is still being developed. We found that the molecular techniques applied herein offer a rapid and cost-effective solution that is capable of achieving a greater taxonomic resolution of bat diets than previous morphological estimates. Collectively, these molecular data indicate Indiana bats are generalist predators, confirming earlier morphological analyses of guano contents that this bat species' diet consists of Coleoptera, Diptera, and Lepidoptera. However, we observed dipteran taxa as the largest proportion of fecal content using molecular methods, while most of the morphological analyses suggest Indiana bat guano consists of coleopteran and lepidopteran taxa [see Figure 1 in Sparks et al. (2005) for a review]. This disparity was also depicted in a survey conducted in Shawnee National Forest—just 20 miles east of our location—suggesting that Indiana bats consume largely moths and beetles (Feldhamer et al., 2009). While it is probable that these differences are partly due to prey availability in the different sites, it is also likely that the interpretation of Indiana bat diet is influenced by the analytical tools applied.
Guano samples were collected in June, July, and September—periods aligning with the timing of parturition, weaning, and fall migration, respectively (Humphrey et al., 1977). Previous visual identification of Indiana bat guano contents from maternity colonies in Indiana demonstrated temporal shifts in diet, with increasing lepidopterans and decreasing trichopterans from June through August (Brack, 1983). Likewise, molecular diet analyses of Little brown bat maternity colonies demonstrated seasonal changes in diet (Clare et al., 2011), progressing from dipteran to lepidopteran taxa from May through September. However, we found little evidence of substantial change in diet composition across the foraging season. Instead, particular taxa were detected throughout the entire foraging season: Culicidae, Limoniidae, and Chironomidae families in the dipteran order, as well as an orb-weaving spider in the genus Eustala. The lack of seasonal turnover in the most frequently detected prey is likely a consequence of the proximity of the roost sites to the Cache River, and a reflection of the robust aquatic dipteran taxa available throughout the foraging season. It appears that positioning these artificial roosts within a riparian habitat—a preferred landscape for Indiana bat maternity colonies (Humphrey et al., 1977; Garner and Gardner, 1992) but not necessarily male Indiana bats (LaVal et al., 1977)—is both sufficient for recruiting Indiana bats as well as promoting local foraging.
It is unclear whether the relatively higher proportion of dipteran and aranean-classified sequence counts are a reflection of foraging preference (i.e., biomass of prey) or an artifact of experimental design. Incorporating abundance information into fecal analyses is challenging for several reasons, including different digestion rates of arthropod prey or DNA extraction biases (Deagle et al., 2019). Observed differences in sequencing depths can also be impacted by the particular molecular tools applied. For example, in silico analyses (Clarke et al., 2014) and empirical tests (Braukmann et al., 2019; Jusino et al., 2019) suggest that primer choice can influence observed taxonomic diversity, as can the various choices of sequencing platform and depth of coverage (Braukmann et al., 2019), or sequence processing software (O'Rourke et al., 2020). Nevertheless, the primers we employed in this experiment were previously tested using biological mock communities and indicated only minor bias among particular arthropod orders [see Figure 1 in Jusino et al. (2019)]. Interestingly, these previously reported biases lead to marginally greater identification of coleopteran and lepidopteran sequences rather than dipteran, making it unlikely that our frequently detected spider and fly sequences are a result of preferential template binding. Thus, it does not appear that the relatively large fraction of fly and spider taxa we detected is due to a particular molecular bias.
Furthermore, we observed high proportions of sequences for individual samples among multiple core arthropod orders including OTUs classified to Araneae, Ephemeroptera, Lepidoptera, Psocodea, and Trichoptera (Figure 4D). Therefore, both in terms of sequence abundances and in terms of frequency of detection, the core prey items identified in these Indiana bats are congruent. Additionally, while our study may differ in prevalence of the most frequently detected arthropod orders, our work concurs with previous diet studies (for a helpful summary, see Lewis, 2007) describing Indiana bats as engaging in aerial foraging activity. Interestingly, this likely applies even to the prevalent spider detected in our study, which was classified to the genus, Eustala, and is known for ballooning behavior (Bell et al., 2005). Perhaps, as has been previously suggested in other bat species (Segura-Trujillo et al., 2016; Wray et al., 2020), these Indiana bats are more aptly characterized as arthropodivores.
Despite these molecular tools confirming and expanding the historical understanding of Indiana bat diets, using these data to inform actionable management practices requires further consideration regarding whether or not the relative abundances of sequences are applied in the analysis. In a presence-absence context, we find significant differences with respect to observed richness between sampling sites and dates, whereas an abundance-based measure of diversity via Shannon's entropy suggested no such difference (Figure 2). If the management goal was to identify priority conservation sites to optimize foraging success, and we considered optimal locations in areas where a more diverse set of taxa are available, the two frameworks may lead to alternative actions. A presence-absence context would suggest placing greater priority on sites in the Egner tract over the Hickory Bottoms tract (i.e., Egner had higher overall observed richness for each sampling month). However, a relative abundance context indicates that all sites and locations are equally useful, and no additional prioritization would be necessary. Incorporating abundance information was also a relevant factor when interpreting whether sampling site or date affects community composition. A greater proportion of variance was captured in the first two principal component axes when abundance information was applied (Figure 3). Analyzing these data in a presence-absence context would again imply significant site and date differences, whereas abundance-based measures point to far greater overlap in spatial and temporal dimensions.
However, these data are interpreted, our molecular diet analysis concurs with earlier work advocating for the protection of the wetland and riparian habitat of the Cypress Creek National Wildlife Refuge because of its critical role in supporting Indiana bat foraging [in particular, see Chapter 4 of Brown and Melius (2014)]. The artificial roosts used in this study were positioned between aquatic and agricultural environments (Figure 1), thus it was possible that a variety of taxa found in both landscapes might be routinely detected in our data. Instead, the majority of the Indiana bat samples contained dipterans like craneflies, mosquitoes, and non-biting midges, as well as caddisflies, mayflies, and other aquatic invertebrates known to inhabit the Cache River area. Furthermore, these core taxa—sequence clusters identified in at least 10% of samples—are dominated by aquatic insects (Figure 4D). Few of these core diet components were important to the supervised learning models built to classify samples to a particular site or date, indicating that there is an extensive dietary overlap in both season and location among these regularly consumed taxa (Figure 4D). Notably, the sequence clusters important to a given model often fit an expected life history for the organism. For example, populations of barklice M. novaescotiae are known to build throughout the season and emerge as adults on the wing in large cohorts in late summer (M. Jeffords, Personal communication).
Because our study did not conduct insect trapping at the time of guano collection it is unclear to what extent differences in spatial or temporal variability are due to selective foraging or prey availability. Clarifying such distinctions can further inform management criteria. For example, if these Indiana bats are largely selective toward particular aquatic taxa, those aquatic habitats are likely of conservation interest. Yet thoroughly sampling the available prey—particularly for a mobile and generalist consumer like the Indiana bat—is an intensive task that was beyond the scope of our study. Nevertheless, our molecular methods have identified a broad range of taxa that can assist future studies when determining what trap types are necessary to accurately capture the true extent of abundance and distribution of available prey. Indeed, a recent molecular diet study of the Little brown bat, M. lucifugus, found prey abundance was generally unrelated to prey consumption (Wray et al., 2020), however the authors note that their black-light trapping method likely was unable to attract certain taxa. Given the propensity for these Indiana bats to consume orb-weaving spiders, as well as some dipteran (e.g., Limoniidae) and ephemeropteran species, a combination of trap types are likely necessary to properly survey the prey items available to Indiana bats in Cypress Creek.
As with many wildlife conservation challenges, the best plans will have strong partnerships with a variety of stakeholders (Mosher et al., 2020). Molecular methods are a valuable addition to understanding the foraging requirements of the Indiana bat, but are most valuable when contextualized with contributions from land managers, field ecologists, and wildlife experts. We hope our wet bench and bioinformatic methods offer a template to bring the molecular tools into the discussion of future conservation management plans.
Data Availability Statement
The datasets presented in this study can be found in online repositories. The names of the repository/repositories and accession number(s) can be found in the article/Supplementary Material.
Author Contributions
Conceptualization performed by MTM, KM, and JF. Guano collection by KM and MTM. Data curation, Bioinformatics, Formal analysis, Visualization, Writing—original draft, was performed by DO'R. Writing—review & editing performed by NB, JF, MTM, KM, and MDM. All authors contributed to the article and approved the submitted version.
Conflict of Interest
The authors declare that the research was conducted in the absence of any commercial or financial relationships that could be construed as a potential conflict of interest.
Acknowledgments
We thank Ryelan McDonough for performing DNA extraction and preparing libraries for sequencing, and Katy Parise for multiple levels of data management and troubleshooting. We also thank Mike Jeffords, Illinois Natural History Survey, for his perspectives describing particular arthropod life histories in the Cache River area.
Supplementary Material
The Supplementary Material for this article can be found online at: https://www.frontiersin.org/articles/10.3389/fevo.2021.623655/full#supplementary-material
References
Adams, J., Roby, P., Schwierjohann, J., Gumbert, M., and Brandenburg, M. (2015). Success of BrandenbarkTM, an artificial roost structure designed for use by Indiana Bats (Myotis sodalis). J. Am. Soc. Min. Reclam. 4, 1–15. doi: 10.21000/JASMR15010001
Alberdi, A., Aizpurua, O., Bohmann, K., Gopalakrishnan, S., Lynggaard, C., Nielsen, M., et al. (2019). Promises and pitfalls of using high-throughput sequencing for diet analysis. Mol. Ecol. Resour. 19, 327–348. doi: 10.1111/1755-0998.12960
Alberdi, A., Aizpurua, O., Gilbert, M. T. P., and Bohmann, K. (2018). Scrutinizing key steps for reliable metabarcoding of environmental samples. Methods Ecol. Evol. 9, 134–147. doi: 10.1111/2041-210X.12849
Bell, J. R., Bohan, D. A., Shaw, E. M., and Weyman, G. S. (2005). Ballooning dispersal using silk: world fauna, phylogenies, genetics and models. Bull. Entomol. Res. 95, 69–114. doi: 10.1079/BER2004350
Bokulich, N., Dillon, M., Bolyen, E., Kaehler, B., Huttley, G., and Caporaso, J. (2018b). q2-sample-classifier: machine-learning tools for microbiome classification and regression. J. Open Source Softw. 3:934. doi: 10.21105/joss.00934
Bokulich, N. A., Collins, T. S., Masarweh, C., Allen, G., Heymann, H., Ebeler, S. E., et al. (2016). Associations among wine grape microbiome, metabolome, and fermentation behavior suggest microbial contribution to regional wine characteristics. mBio 7:e00631-16. doi: 10.1128/mBio.00631-16
Bokulich, N. A., Kaehler, B. D., Rideout, J. R., Dillon, M., Bolyen, E., Knight, R., et al. (2018a). Optimizing taxonomic classification of marker-gene amplicon sequences with QIIME 2's q2-feature-classifier plugin. Microbiome 6:90. doi: 10.1186/s40168-018-0470-z
Bolyen, E., Rideout, J. R., Dillon, M. R., Bokulich, N. A., Abnet, C. C., Al-Ghalith, G. A., et al. (2019). Reproducible, interactive, scalable and extensible microbiome data science using QIIME 2. Nat. Biotechnol. 37, 852–857. doi: 10.1038/s41587-019-0209-9
Brack, V. W. (1983). The Nonhibernating Ecology of Bats in Indiana With Emphasis on the endangered Indiana Bat, Myotis Sodalis (Dissertation). Purdue University, West Lafayette, IN, USA.
Brady, J. T., LaVal, R. K., Kunz, T. H., Tuttle, M. D., Wilson, D. E., and Clawson, R. L. (1983). Recovery plan for the Indiana Bat. United States Fish and Wildlife Service. Available online at: https://www.fws.gov/midwest/endangered/mammals/inba/pdf/inba_recplan.pdf (accessed December 31, 2020).
Braukmann, T. W. A., Ivanova, N. V., Prosser, S. W. J., Elbrecht, V., Steinke, D., Ratnasingham, S., et al. (2019). Metabarcoding a diverse arthropod mock community. Mol. Ecol. Resour. 19, 711–727. doi: 10.1111/1755-0998.13008
Brown, M., and Melius, T. O. (2014). Cypress Creek National Wildlife Refuge Habitat Management Plan. Cypress Creek National Wildlife Refuge Ullin, IL: United States Fish and Wildlife Service. Available online at: https://www.fws.gov/WorkArea/DownloadAsset.aspx?id=2147557022 (accessed December 31, 2020).
Cable, A. B., O'Keefe, J. M., Deppe, J. L., Hohoff, T. C., Taylor, S. J., and Davis, M. A. (2020). Habitat suitability and connectivity modeling reveal priority areas for Indiana bat (Myotis sodalis) conservation in a complex habitat mosaic. Landsc. Ecol. doi: 10.1007/s10980-020-01125-2
Callahan, B. J., McMurdie, P. J., Rosen, M. J., Han, A. W., Johnson, A. J. A., and Holmes, S. P. (2016). DADA2: high-resolution sample inference from illumina amplicon data. Nat. Methods 13, 581–583. doi: 10.1038/nmeth.3869
Camacho, C., Coulouris, G., Avagyan, V., Ma, N., Papadopoulos, J., Bealer, K., et al. (2009). BLAST+: architecture and applications. BMC Bioinformatics 10:421. doi: 10.1186/1471-2105-10-421
Chamberlain, S., Szocs, E., Boettiger, C., Ram, K., Bartomeus, I., Baumgartner, J., et al. (2014). Taxize: Taxonomic Information from Around the Web. Available online at: https://cran.r-project.org/web/packages/taxize/index.html (accessed September 17, 2020).
Chamberlain, S. A., and Szöcs, E. (2013). Taxize: taxonomic search and retrieval in R. F1000Research 2:191. doi: 10.12688/f1000research.2-191.v1
Clare, E. L., Barber, B. R., Sweeney, B. W., Hebert, P. D. N., and Fenton, M. B. (2011). Eating local: influences of habitat on the diet of little brown bats (Myotis lucifugus): molecular detection of variation in diet. Mol. Ecol. 20, 1772–1780. doi: 10.1111/j.1365-294X.2011.05040.x
Clare, E. L., Fraser, E. E., Braid, H. E., Fenton, M. B., and Hebert, P. D. N. (2009). Species on the menu of a generalist predator, the eastern red bat (Lasiurus borealis): using a molecular approach to detect arthropod prey. Mol. Ecol. 18, 2532–2542. doi: 10.1111/j.1365-294X.2009.04184.x
Clare, E. L., Symondson, W. O. C., Broders, H., Fabianek, F., Fraser, E. E., MacKenzie, A., et al. (2014). The diet of Myotis lucifugus across Canada: assessing foraging quality and diet variability. Mol. Ecol. 23, 3618–3632. doi: 10.1111/mec.12542
Clarke, L. J., Soubrier, J., Weyrich, L. S., and Cooper, A. (2014). Environmental metabarcodes for insects: in silico PCR reveals potential for taxonomic bias. Mol. Ecol. Resour. 14, 1160–1170. doi: 10.1111/1755-0998.12265
Dahl, C., Stanislawski, M., Iszatt, N., Mandal, S., Lozupone, C., Clemente, J. C., et al. (2017). Gut microbiome of mothers delivering prematurely shows reduced diversity and lower relative abundance of Bifidobacterium and Streptococcus. PLoS ONE 12:e0184336. doi: 10.1371/journal.pone.0184336
Deagle, B. E., Thomas, A. C., McInnes, J. C., Clarke, L. J., Vesterinen, E. J., Clare, E. L., et al. (2019). Counting with DNA in metabarcoding studies: how should we convert sequence reads to dietary data? Mol. Ecol. 28, 391–406. doi: 10.1111/mec.14734
Dodd, L. E., Chapman, E. G., Harwood, J. D., Lacki, M. J., Rieske, L. K., and Stevens, R. D. (2012). Identification of prey of Myotis septentrionalis using DNA-based techniques. J. Mammal. 93, 1119–1128. doi: 10.1644/11-MAMM-A-218.1
Feldhamer, G. A., Carter, T. C., and Whitaker, J. O. (2009). Prey consumed by eight species of insectivorous bats from Southern Illinois. Am. Midl. Nat. 162, 43–51. doi: 10.1674/0003-0031-162.1.43
Frick, W. F., Pollock, J. F., Hicks, A. C., Langwig, K. E., Reynolds, D. S., Turner, G. G., et al. (2010). An emerging disease causes regional population collapse of a common North American bat species. Science 329, 679–682. doi: 10.1126/science.1188594
Garner, J. D., and Gardner, J. E. (1992). Determination of Summer Distribution and Habitat Utilization of the Indiana Bat (Myotis sodalis) in Illinois. Division of Natural Heritage Illinois Department of Conservation; Center for Biogeographic Information (Illinois Natural History Survey). Available online at: https://www.ideals.illinois.edu/bitstream/handle/2142/10287/inhscbiv01992i00002_opt.pdf (accessed December 31, 2020).
Gerhard, W. A., and Gunsch, C. K. (2019). Metabarcoding and machine learning analysis of environmental DNA in ballast water arriving to hub ports. Environ. Int. 124, 312–319. doi: 10.1016/j.envint.2018.12.038
Graves, S., Piepho, H.-P., and Selzer, L. (2019). multcompView: Visualizations of Paired Comparisons. Available online at: https://CRAN.R-project.org/package=multcompView (accessed September 17, 2020).
Hope, P. R., Bohmann, K., Gilbert, M. T. P., Zepeda-Mendoza, M., Razgour, O., and Jones, G. (2014). Second generation sequencing and morphological faecal analysis reveal unexpected foraging behaviour by Myotis nattereri (Chiroptera, Vespertilionidae) in winter. Front. Zool. 11:39. doi: 10.1186/1742-9994-11-39
Humphrey, S. R., Richter, A. R., and Cope, J. B. (1977). Summer habitat and ecology of the endangered Indiana bat, Myotis sodalis. J. Mammal. 58, 334–346. doi: 10.2307/1379332
Jachowski, D. S., Dobony, C. A., Coleman, L. S., Ford, W. M., Britzke, E. R., and Rodrigue, J. L. (2014). Disease and community structure: white-nose syndrome alters spatial and temporal niche partitioning in sympatric bat species. Divers. Distrib. 20, 1002–1015. doi: 10.1111/ddi.12192
Jachowski, D. S., Rota, C. T., Dobony, C. A., Ford, W. M., and Edwards, J. W. (2016). Seeing the forest through the trees: considering roost-site selection at multiple spatial scales. PLoS ONE 11:e0150011. doi: 10.1371/journal.pone.0150011
Johnson, C. M., and King, R. A. (2018). Beneficial Forest Management Practices for WNS-affected Bats: Voluntary Guidance for Land Managers and Woodland Owners in the Eastern United States. White-nose Syndrome Conservation and Recovery Working Group. Available online at: https://s3.us-west-2.amazonaws.com/prod-is-cms-assets/wns/prod/393b6360-f27c-11e8-87d8-09a30749711d-Final_Forestry_BFMPs_May31-2018.docx (accessed December 31, 2020).
Jusino, M. A., Banik, M. T., Palmer, J. M., Wray, A. K., Xiao, L., Pelton, E., et al. (2019). An improved method for utilizing high-throughput amplicon sequencing to determine the diets of insectivorous animals. Mol. Ecol. Resour. 19, 176–190. doi: 10.1111/1755-0998.12951
Kahle, D., and Wickham, H. (2013). ggmap: spatial visualization with ggplot2. R J. 5, 144–161. doi: 10.32614/RJ-2013-014
King, A. (2019). 2019 Indiana Bat (Myotis sodalis) Population Status Update. Indiana Ecological Services Field Office: United States Fish and Wildlife Service. Available online at: https://www.fws.gov/midwest/Endangered/mammals/inba/pdf/2019_IBat_Pop_Estimate_6_27_2019a.pdf (accessed December 31, 2020).
Kunz, T. H., and Whitaker, J. O. (1983). An evaluation of fecal analysis for determining food habits of insectivorous bats. Can. J. Zool. 61, 1317–1321. doi: 10.1139/z83-177
LaVal, R. K., Clawson, R. L., LaVal, M. L., and Caire, W. (1977). Foraging behavior and nocturnal activity patterns of Missouri bats, with emphasis on the endangered species Myotis grisescens and Myotis sodalis. J. Mammal. 58, 592–599. doi: 10.2307/1380007
Lewis, L. (2007). Indiana Bat (Myotis sodalis) Draft Recovery Plan: First Revision. Fort Snelling: United States Fish and Wildlife Service. Available online at: https://www.govinfo.gov/content/pkg/FR-2007-04-16/pdf/07-1866.pdf (accessed December 31, 2020).
Lorch, J. M., Meteyer, C. U., Behr, M. J., Boyles, J. G., Cryan, P. M., Hicks, A. C., et al. (2011). Experimental infection of bats with Geomyces destructans causes white-nose syndrome. Nature 480, 376–378. doi: 10.1038/nature10590
Lumley, T. (2016). xkcdcolors: Color Names from the XKCD Color Survey. Available online at: https://CRAN.R-project.org/package=xkcdcolors (accessed September 17, 2020).
Mangan, K., and Mangan, M. T. (2017). Bat Use of Artificial Roosting Structures (3rd Annual Report). Southern Illinois Sub-Office, Marion, IL: United States Fish and Wildlife Service.
Mangan, K., and Mangan, M. T. (2019a). 2016 Indiana Bat Survey Report. Southern Illinois Ecological Services Sub-Office, Marion, IL: United States Fish and Wildlife Service. Available online at: https://www.fws.gov/midwest/endangered/mammals/inba/surveys/pdf/2016IndianaBatSummerSurveyGuidelines11April2016.pdf (accessed December 31, 2020).
Mangan, K., and Mangan, M. T. (2019b). 2018 Indiana Bat Survey Report. Southern Illinois Ecological Services Sub-Office, Marion, IL: United States Fish and Wildlife Service.
Martin, M. (2011). Cutadapt removes adapter sequences from high-throughput sequencing reads. EMBnet. J. 17, 10–12. doi: 10.14806/ej.17.1.200
McDonald, D., Clemente, J. C., Kuczynski, J., Rideout, J. R., Stombaugh, J., Wendel, D., et al. (2012). The biological observation matrix (BIOM) format or: how I learned to stop worrying and love the ome-ome. GigaScience 1:7. doi: 10.1186/2047-217X-1-7
McKinney, W. (2010). “Data structures for statistical computing in python,” in Proceedings of the 9th Python in Science Conference (Austin, TX), 56–61. doi: 10.25080/Majora-92bf1922-00a
Menzel, J. M., Ford, W. M., Menzel, M. A., Gardner, J. E., Garner, J. D., and Hofmann, J. E. (2005). Summer habitat use and home-range analysis of the endangered Indiana bat. J. Wildl. Manag. 69, 430–436. doi: 10.2193/0022-541X(2005)069<0430:SHUAHA>2.0.CO;2
Mosher, B. A., Bernard, R. F., Lorch, J. M., Miller, D. A., Richgels, K. L., White, C. L., et al. (2020). Successful molecular detection studies require clear communication among diverse research partners. Front. Ecol. Environ. 18:2141. doi: 10.1002/fee.2141
Murray, S. W., and Kurta, A. (2004). Nocturnal activity of the endangered Indiana bat (Myotis sodalis). J. Zool. 262, 197–206. doi: 10.1017/S0952836903004503
Nielsen, J. M., Clare, E. L., Hayden, B., Brett, M. T., and Kratina, P. (2018). Diet tracing in ecology: method comparison and selection. Methods Ecol. Evol. 9, 278–291. doi: 10.1111/2041-210X.12869
O'Rourke, D. R., Bokulich, N. A., Jusino, M. A., MacManes, M. D., and Foster, J. T. (2020). A total crapshoot? Evaluating bioinformatic decisions in animal diet metabarcoding analyses. Ecol. Evol. 10, 9721–9739. doi: 10.1002/ece3.6594
O'Shea, T. J., and Bogan, M. A. (2003). Monitoring Trends in Bat Populations of the United States and Territories: Problems and Prospects. Fort Collins Science Center: U.S. Geological Survey. Available online at: https://pubs.er.usgs.gov/publication/itr030003 (accessed December 31, 2020).
Oswaldo, S. B. (2019). ggsn: North Symbols and Scale Bars for Maps Created with “ggplot2” or “ggmap.” Available online at: https://CRAN.R-project.org/package=ggsn (accessed September 17, 2020).
Paradis, E., Claude, J., and Strimmer, K. (2004). APE: analyses of phylogenetics and evolution in R language. Bioinformatics 20, 289–290. doi: 10.1093/bioinformatics/btg412
Pedersen, T. L., and Crameri, F. (2018). scico: Colour Palettes Based on the Scientific Colour-Maps. Available online at: https://CRAN.R-project.org/package=scico (accessed September 17, 2020).
Pedersen, T. L., and Robinson, D. (2019). gganimate: A Grammar of Animated Graphics. Available online at: https://CRAN.R-project.org/package=gganimate (accessed September 17, 2020).
Pedregosa, F., Varoquaux, G., Gramfort, A., Michel, V., Thirion, B., Grisel, O., et al. (2011). Scikit-learn: machine learning in python. J. Mach. Learn. 12, 2825–2830. doi: 10.5555/1953048.2078195
Pompanon, F., Deagle, B. E., Symondson, W. O. C., Brown, D. S., Jarman, S. N., and Taberlet, P. (2012). Who is eating what: diet assessment using next generation sequencing. Mol. Ecol. 21, 1931–1950. doi: 10.1111/j.1365-294X.2011.05403.x
Porter, T. M., and Hajibabaei, M. (2018). Automated high throughput animal CO1 metabarcode classification. Sci. Rep. 8, 1–10. doi: 10.1038/s41598-018-22505-4
Price, M. N., Dehal, P. S., and Arkin, A. P. (2010). FastTree 2 – Approximately maximum-likelihood trees for large alignments. PLoS ONE 5:e9490. doi: 10.1371/journal.pone.0009490
R Core Team (2018). R: A Language and Environment for Statistical Computing. Vienna: R Foundation for Statistical Computing. Available online at: https://www.R-project.org/ (accessed December 31, 2020).
Ratnasingham, S., and Hebert, P. D. N. (2007). bold: the barcode of life data System (http://www.barcodinglife.org). Mol. Ecol. Notes 7, 355–364. doi: 10.1111/j.1471-8286.2007.01678.x
Ren, K., and Russel, K. (2016). formattable: Create “Formattable” Data Structures. Available online at: https://CRAN.R-project.org/package=formattable (accessed September 17, 2020).
Robeson, M., O'Rourke, D. R., Kaehler, B., Ziemski, M., Dillon, M. R., Foster, J. T., et al. (2020). RESCRIPt: Reference Sequence Annotation and Curation Pipeline. doi: 10.5281/zenodo.3891931
Rognes, T., Flouri, T., Nichols, B., Quince, C., and Mahé, F. (2016). VSEARCH: a versatile open source tool for metagenomics. PeerJ 4:e2584. doi: 10.7717/peerj.2584
Roguet, A., Eren, A. M., Newton, R. J., and McLellan, S. L. (2018). Fecal source identification using random forest. Microbiome 6:185. doi: 10.1186/s40168-018-0568-3
Segura-Trujillo, C. A., Lidicker, W. Z. Jr., and Álvarez-Castañeda, S. T. (2016). New perspectives on trophic guilds of arthropodivorous bats in North and Central America. J. Mammal. 97, 644–654. doi: 10.1093/jmammal/gyv212
Sparks, D. W., Ritzi, C. M., Duchamp, J. E., and Whitaker, J. O. (2005). Foraging habitat of the Indiana bat (Myotis sodalis) at an urban-rural Interface. J. Mammal. 86, 713–718. doi: 10.1644/1545-1542(2005)0860713:FHOTIB2.0.CO
Thogmartin, W. E., King, R. A., McKann, P. C., Szymanski, J. A., and Pruitt, L. (2012). Population-level impact of white-nose syndrome on the endangered Indiana bat. J. Mammal. 93, 1086–1098. doi: 10.1644/11-MAMM-A-355.1
Turner, G. G., Reeder, D. M., and Coleman, J. T. H. (2011). A five-year assessment of mortality and geographic spread of white-nose syndrome in North American bats and a look to the future. Bat Res. News 52, 13–27.
Tuttle, N. M., Benson, D. P., and Sparks, D. W. (2006). Diet of the Myotis sodalis (Indiana Bat) at an urban/rural interface. Northeast. Nat. 13, 435–442. doi: 10.1656/1092-6194(2006)13435:DOTMSI2.0.CO;2
Udall, S. L. (1967). Endangered Species Act. Fed. Regist. 32. Available online at: https://www.fws.gov/endangered/species/pdf/32FedReg_pg%204001.pdf (accessed December 31, 2020).
Valentini, A., Pompanon, F., and Taberlet, P. (2009). DNA barcoding for ecologists. Trends Ecol. Evol. 24, 110–117. doi: 10.1016/j.tree.2008.09.011
Vesterinen, E. J., Ruokolainen, L., Wahlberg, N., Peña, C., Roslin, T., Laine, V. N., et al. (2016). What you need is what you eat? Prey selection by the bat Myotis daubentonii. Mol. Ecol. 25, 1581–1594. doi: 10.1111/mec.13564
Warnecke, L., Turner, J. M., Bollinger, T. K., Lorch, J. M., Misra, V., Cryan, P. M., et al. (2012). Inoculation of bats with European Geomyces destructans supports the novel pathogen hypothesis for the origin of white-nose syndrome. Proc. Natl. Acad. Sci. U.S.A. 109, 6999–7003. doi: 10.1073/pnas.1200374109
Weiss, S., Xu, Z. Z., Peddada, S., Amir, A., Bittinger, K., Gonzalez, A., et al. (2017). Normalization and microbial differential abundance strategies depend upon data characteristics. Microbiome 5:27. doi: 10.1186/s40168-017-0237-y
Wickham, H. (2007). Reshaping data with the reshape package. J. Stat. Softw. 21, 1–20. doi: 10.18637/jss.v021.i12
Wickham, H. (2019). rvest: Easily Harvest (Scrape) Web Pages. Available online at: https://CRAN.R-project.org/package=rvest (accessed September 17, 2020).
Wickham, H., Henry, L., Pedersen, T. L., Luciani, T. J., Decorde, M., and Lise, V. (2020). svglite: An “SVG” Graphics Device. Available online at: https://CRAN.R-project.org/package=svglite (accessed September 17, 2020).
Womack, K. M., Amelon, S. K., and Thompson, F. R. (2013). Resource selection by Indiana bats during the maternity season. J. Wildl. Manag. 77, 707–715. doi: 10.1002/jwmg.498
Wray, A. K., Peery, M. Z., Jusino, M., Kochanski, J. M., Banik, M. T., Palmer, J. M., et al. (2020). Predator preferences shape the diets of arthropodivorous bats more than quantitative local prey abundance. Mol. Ecol. doi: 10.1111/mec.15769
Keywords: animal diets, metabarcoding, cytochrome oxidase, myotis sodalis, bat diet
Citation: O'Rourke DR, Mangan MT, Mangan KE, Bokulich NA, MacManes MD and Foster JT (2021) Lord of the Diptera (and Moths and a Spider): Molecular Diet Analyses and Foraging Ecology of Indiana Bats in Illinois. Front. Ecol. Evol. 9:623655. doi: 10.3389/fevo.2021.623655
Received: 30 October 2020; Accepted: 06 January 2021;
Published: 16 February 2021.
Edited by:
Susana Caballero, University of Los Andes, ColombiaReviewed by:
Bruce D. Patterson, Field Museum of Natural History, United StatesŁukasz Kajtoch, Institute of Systematics and Evolution of Animals (PAN), Poland
Copyright © 2021 O'Rourke, Mangan, Mangan, Bokulich, MacManes and Foster. This is an open-access article distributed under the terms of the Creative Commons Attribution License (CC BY). The use, distribution or reproduction in other forums is permitted, provided the original author(s) and the copyright owner(s) are credited and that the original publication in this journal is cited, in accordance with accepted academic practice. No use, distribution or reproduction is permitted which does not comply with these terms.
*Correspondence: Devon R. O'Rourke, devon@outermostlab.com
†Present address: Devon R. O'Rourke, Pathogen and Microbiome Institute, Northern Arizona University, Flagstaff, AZ, United States