A Model and Simulation of the Influence of Temperature and Amplicon Length on Environmental DNA Degradation Rates: A Meta-Analysis Approach
 Tatsuya Saito
 Hideyuki Doi
- Graduate School of Simulation Studies, University of Hyogo, Kobe, Japan
Environmental DNA (eDNA) analysis can detect aquatic organisms, including rare and endangered species, in a variety of habitats. Degradation can influence eDNA persistence, impacting eDNA-based species distribution and occurrence results. Previous studies have investigated degradation rates and associated contributing factors. It is important to integrate data from across these studies to better understand and synthesize eDNA degradation in various environments. We complied the eDNA degradation rates and related factors, especially water temperature and amplicon lengths of the measured DNA from 28 studies, and subjected the data to a meta-analysis. In agreement with previous studies, our results suggest that water temperature and amplicon length are significantly related to the eDNA degradation rate. From the 95% quantile model simulation, we predicted the maximum eDNA degradation rate in various combinations of water temperature and amplicon length. Predicting eDNA degradation could be important for evaluating species distribution and inducing innovation (e.g., sampling, extraction, and analysis) of eDNA methods, especially for rare and endangered species with small population size.
Introduction
Environmental DNA (eDNA) methods are innovative methods developed for monitoring macroorganisms, especially aquatic species (Ficetola et al., 2008; Minamoto et al., 2012; Taberlet et al., 2012; Takahara et al., 2012; Ushio et al., 2018; Kakuda et al., 2019; Tsuji et al., 2019). The eDNA method is used to investigate species distribution. It is less invasive to organisms, and is especially useful for rare and endangered species, which generally have low tolerance to sampling disturbance and may be difficult to detect. Consequently, eDNA methods have been used to detect rare and endangered species in various taxa, such as fish, salamander, and aquatic insects (Fukumoto et al., 2015; Sigsgaard et al., 2015; Pfleger et al., 2016; Doi et al., 2017; Sakata et al., 2017).
Environmental DNA, which is compromised of DNA fragments released by organisms into environments such as water or soil, is thought to be derived from mixtures of feces (Martellini et al., 2005), skin cells (Ficetola et al., 2008), mucus (Merkes et al., 2014), and secretions (Bylemans et al., 2018) of organisms. Previous studies have suggested that eDNA is mainly derived from fractions of cells or cellular organs (i.e., mitochondria and nuclei), but it can also be derived from fragmented DNA (degraded DNA) in the water (Turner et al., 2014; Minamoto et al., 2016).
Many points regarding the general behavior of eDNA in water (reviewed in Barnes and Turner, 2016) are still unclear, especially the state (fragment length) and degradation of eDNA (Turner et al., 2015; reviewed in Barnes and Turner, 2016). Understanding eDNA states and degradation is essential for the effective sampling and storage of eDNA, and may provide pertinent information to better interpret the results of species distribution and abundance and biomass estimations. This may be especially problematic for rare and endangered species, which are thought to have small populations and small amounts (or concentrations) of DNA (Fukumoto et al., 2015; Sigsgaard et al., 2015; Pfleger et al., 2016; Doi et al., 2017; Sakata et al., 2017). Both factors can influence eDNA persistence, potentially inducing false negatives which impact accuracy in occurrence and distribution data.
Many experiments have been conducted to reveal the detailed states and degradation rates of eDNA under various conditions (Thomsen et al., 2012; Barnes et al., 2014; Maruyama et al., 2014; Tsuji et al., 2017; Jo et al., 2019). In most cases, the eDNA degradation curves declined exponentially and quickly, often in less than a week (Thomsen et al., 2012; Barnes et al., 2014). Earlier meta-analyses for eDNA degradation (Collins et al., 2018) found that water conditions, such as salinity (Collins et al., 2018), water temperature (Tsuji et al., 2017; Jo et al., 2019), and pH (Barnes et al., 2014; Tsuji et al., 2017), influenced the eDNA degradation rate. In addition, the characteristics of DNA itself, such as its measured amplicon length, affected the eDNA degradation rate (Bylemans et al., 2018; Jo et al., 2019). From the data so far (temperature and amplification length), it seems possible to predict the approximate degradation rate and estimate the state of eDNA. Therefore, we conducted a novel meta-analysis to model the effects of water conditions and DNA amplicon length on the eDNA degradation rate using data generated in previous eDNA degradation studies. The previous meta-analysis (Collins et al., 2018) used the half-life of the degradation curve as an index of degradation. Although half-life has the advantage of being more intuitively meaningful, we instead used here the degradation rate constants “k” because our model uses the degradation rate, not half-life.
Using this approach, we aimed to evaluate the effects of water conditions (i.e., ecosystem, source, temperature, and pH), and target DNA region on eDNA degradation in previously published data. Also, we tested the relationship between DNA amplicon length and eDNA degradation because degradation may differ with amplicon length. Specifically, we conducted a simulation to predict the maximum degradation rate using quantile regression modeling with temperature and DNA amplicon length.
Materials and Methods
Search Strategy
A Google Scholar search on September 9, 2020, using the search terms “eDNA” OR “environmental DNA” AND “degradation” OR “decay” OR “decomposition,” returned 11,300 hits. The initial filtering of the articles was based on their title; any articles that obviously had no relevance to eDNA degradation were discarded. After title screening, 1,000 articles remained. After abstract screening, 42 articles remained. We manually inspected these remaining articles and selected papers describing the degradation rate of eDNA using experiments or field settings (Supplementary Table 1). Upon completion of the screening process, we obtained relevant eDNA data from 28 articles (Table 1 and Supplementary Table 1) for the meta-analysis.
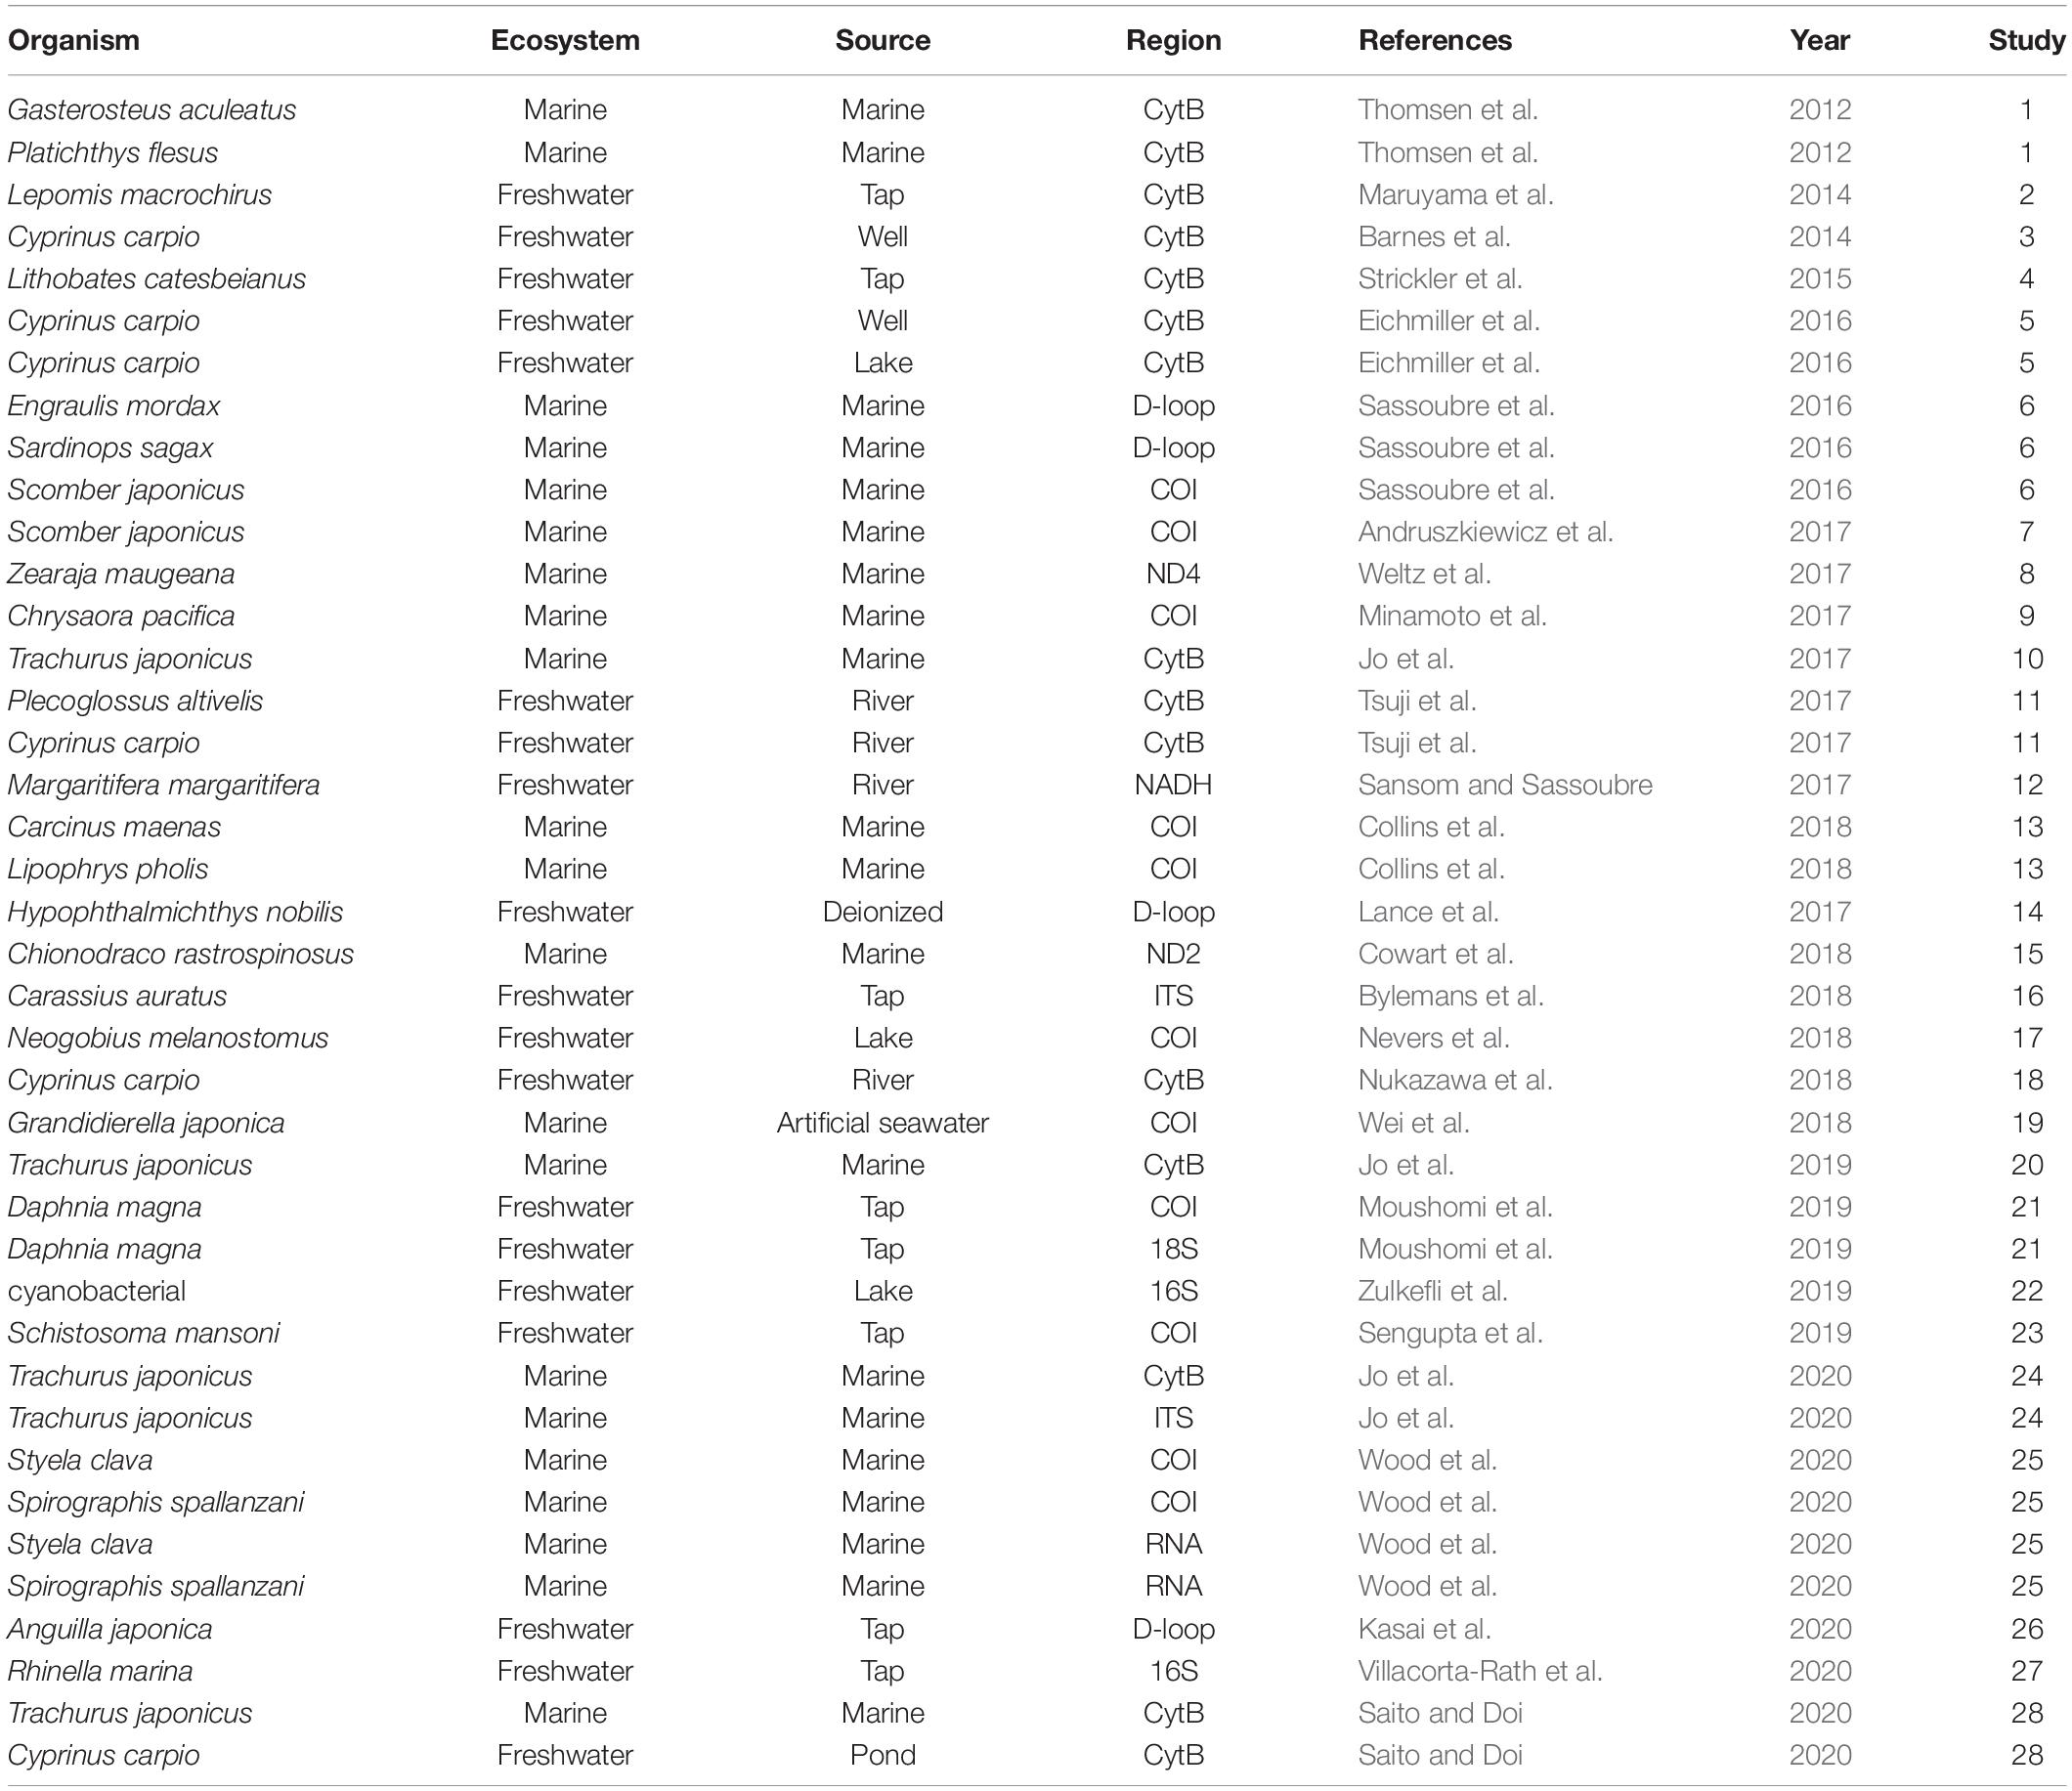
Table 1. The organisms, ecosystem types (Ecosystem), water source (Source), and PCR-amplified DNA regions by quantitative PCR (Region) for all papers analyzed in this meta-analysis.
Data Extraction
From the selected publications, we assembled a list of factors for eDNA degradation (Supplementary Table 1). We collected the following factors and categories: “Ecosystem” was divided into marine and freshwater. “Source” was categorized into water sources (Freshwater: river, lake, well water, pond, tap water, and deionized water; Marine: marine and artificial seawater). “Temperature” and “pH” refer to the water temperature and pH of the water sample for each experiment, respectively. “Region” and “Amplicon length” refer to the amplified DNA region used for quantitative PCR (qPCR) and the number of amplified-DNA bases targeted by the qPCR reaction (bp). “Region” was divided into mtDNA (COI, CytB, 16s, 18s, D-loop, NADH, ND2, ND4), nuDNA (ITS), and RNA. “DNA type” was divided into spike (i.e., the DNA contained in the environment water) and organism. “Experiment type” was divided into “in tank” and “in field.”
We extracted the simple exponential slope (hereafter referred to as “degradation rate”) from the article contents and/or plots according to the simple exponential equation (Motulsky and Christopoulos, 2003) in each experiment:
where C0 is the eDNA concentration at time 0 (i.e., the initial eDNA concentration), and k is the degradation slope (rate) constant per hour. We used the standardized degradation rate per hour. The degradation rate by day was divided by 24 to calculate the degradation rate per hour.
Statistical Analysis and Simulation
We performed the statistical analysis and graphics using R ver. 4.0.2 (R Core Team, 2020). We tested the differences in the eDNA degradation rate in measured DNA regions and water resources using a linear mixed-effect model (LMM) using “lme4” ver. 1.1.23 package with “lmerTest” ver. 3.1.2 package in R. We excluded data points without temperature information in the statistical analyses. We set each study as a random effect. Jo et al. (2020) compared the degradation of mtDNA and nuDNA and found the difference. However, we could not analyze mtDNA and nuDNA due to the limited data.
We performed quantile models (QM) for 0.1, 0.5, and 0.95 quantiles for the regression. By performing 0.95 and 0.1 quantiles for the regression, we evaluated the maximum and minimum degradation rate. The 0.5-quantile used median for the regression, so almost similar to simple linear regression. We employed the Bayesian mixed-effect quantile model using the “lqmm” function of “lqmm” package ver. 1.5.5 in R. In the QM, we set water temperature and amplicon length as explanatory effects and each study as the random effect. We performed the Nelder–Mead algorithm using 10000 MCMC permutations with the Gauss–Hermite quadrature approach. We set the statistical alpha as 0.05 for parameter evaluation. We did not find a significant interaction (p > 0.1) between water temperature and amplicon length, so we used the model excluding the interaction, i.e., eDNA degradation rate = water temperature + amplicon length. We evaluated the QM models using the Akaike information criteria (AIC), in which the best QM is identified by having the lowest AIC.
We simulated the combined effects of water temperature and amplicon length, using the obtained 0.95-quantile QM. We generated 100,000 random values for the combination of water temperature (ranging in published values from −1 to 35 °C; see the results) and amplicon length used for the experiments (ranging in published values from 70 to 719) using “runif” function in R, which generates a random number from the Mersenne-Twister method. We used 100,000 random values to predict the eDNA degradation rate from the 0.95-quantile QM (see results).
Results
Degradation Rate Experiments From Literature
The number of obtained time points for the eDNA degradation data ranged from 3 to 25 (mean: 8.3, median: 8.0, Supplementary Table 1). Details of the sites are listed as water sources (Table 1). In total there were 21 marine sites, 1 artificial marine site, and 19 freshwater sites. Within the freshwater sites, there were 9 experiments that used tap or deionized water, 4 river sites, 3 lake sites, 2 well water sites, and 1 pond site. The temperature for the experiments ranged from −1 to 35 °C (mean: 19, median: 20, Supplementary Table 1). The amplicon length used for the experiments ranged from 70 to 719 bp (mean: 150, median: 131, Supplementary Table 1), and the DNA fragment regions used were mainly Cyt B or COI regions in mtDNA (Table 1). Degradation experiments of nuDNA and RNA were very few data compared to mtDNA.
Degradation Rate
The observed degradation rate for the previously published eDNA data ranged from 0.0005 to 0.7010 (mean: 0.1317, median: 0.0440, Supplementary Table 1). Differences in PCR regions did not affect the rate of DNA degradation, nor did differences in water sources (Figures 1A,B). Although the degradation rates for Tap and Marine water sources appear much higher than that observed for other sources, there were no significant differences among water sources, nor among taxa or PCR regions (LMM, t < 1.859, p > 0.07, Figure 1 and Supplementary Figure 1, respectively). With the limited data excluded, such as ND2, ND4 for PCR region and pond for water source, there were no significant differences among water sources (LMM, t < 1.965, p > 0.06, Supplementary Figure 2, respectively), but significant differences among PCR region (LMM, t = −3.414, p = 0.002538, Supplementary Figure 2).
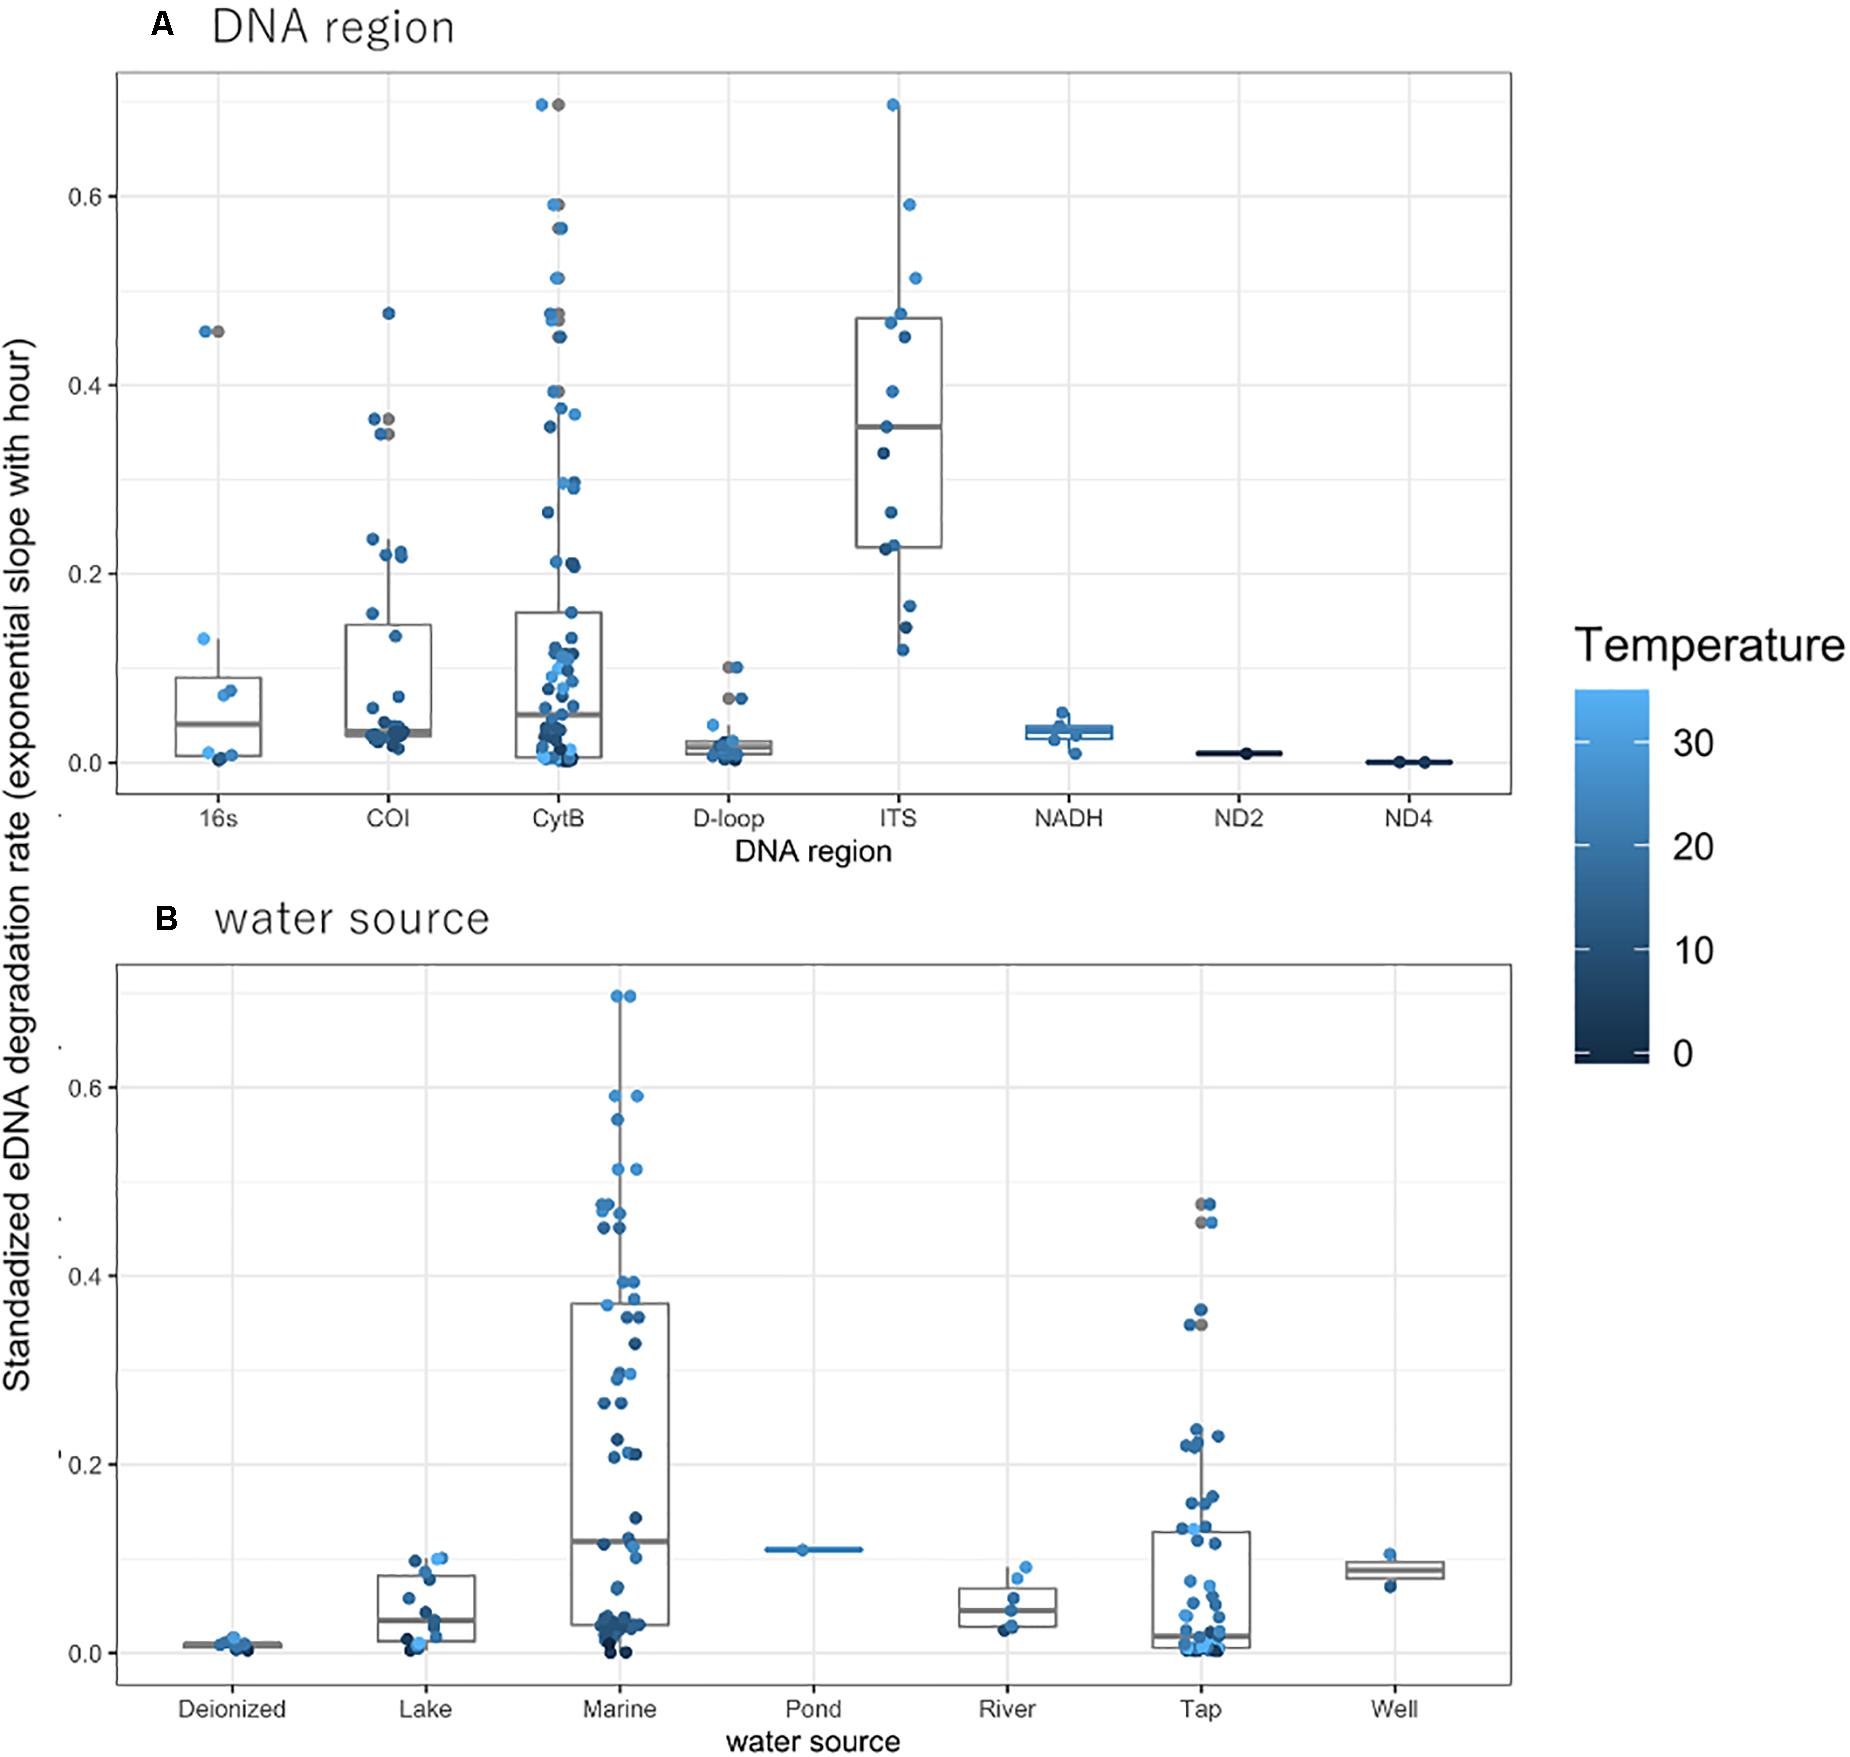
Figure 1. The eDNA degradation rate (simple exponential slope) with (A) DNA region and (B) water source. The degradation rate without temperature data in the experiment were excluded in the plot. The dots indicate the individual eDNA degradation rate in each experiment in different ecosystems. The boxes and bars in the box plot indicate median ± inter-quartiles and ± 1.5 × inter-quartiles, respectively.
Quantile Model for Temperature and Amplicon Length
The relationship between eDNA degradation rate and water temperature was significant in 0.95- quantile and showed that higher water temperatures accelerated eDNA degradation (Figure 2A, p = 0.02004 and 0.5761 for 0.95- and 0.5- quantiles, respectively). Upon comparing the QM of 0. 1-, 0. 5-, and 0.95- quantiles, the QM with 0.95-quantile was observed to have the lowest AIC value (0.1-quantile: 41.82, 0.5-quantile: −120.78, and 0.95-quantile: −161.26), indicating that the best model for the relationship. Therefore, we simulated these data using the QM with a 0.95-quantile with a positive slope (slope = 0.020, Figure 2A). The relationship between eDNA degradation rate and amplicon length suggests that longer amplicon length undergo greater eDNA degradation (Figure 2B). For amplicon length, as for water temperature, the QM with 0.95-quantile had the lowest AIC value (0.1-quantile: 155.1, 0.5-quantile: −110.2, and 0.95-quantile: −145.6). Therefore, we simulated and discussed these data using the QM with a 0.95-quantile with a positive slope (slope = 0.225). We also showed the categories of water temperature range (divided into four levels: −1, 0–10, 11–20, and > 21 °C) and amplicon length (divided into three levels: 0–100, 101–200, and > 201 bp) with eDNA degradation rate (Supplementary Figures 3,4 respectively) with similar trends of Figure 2.
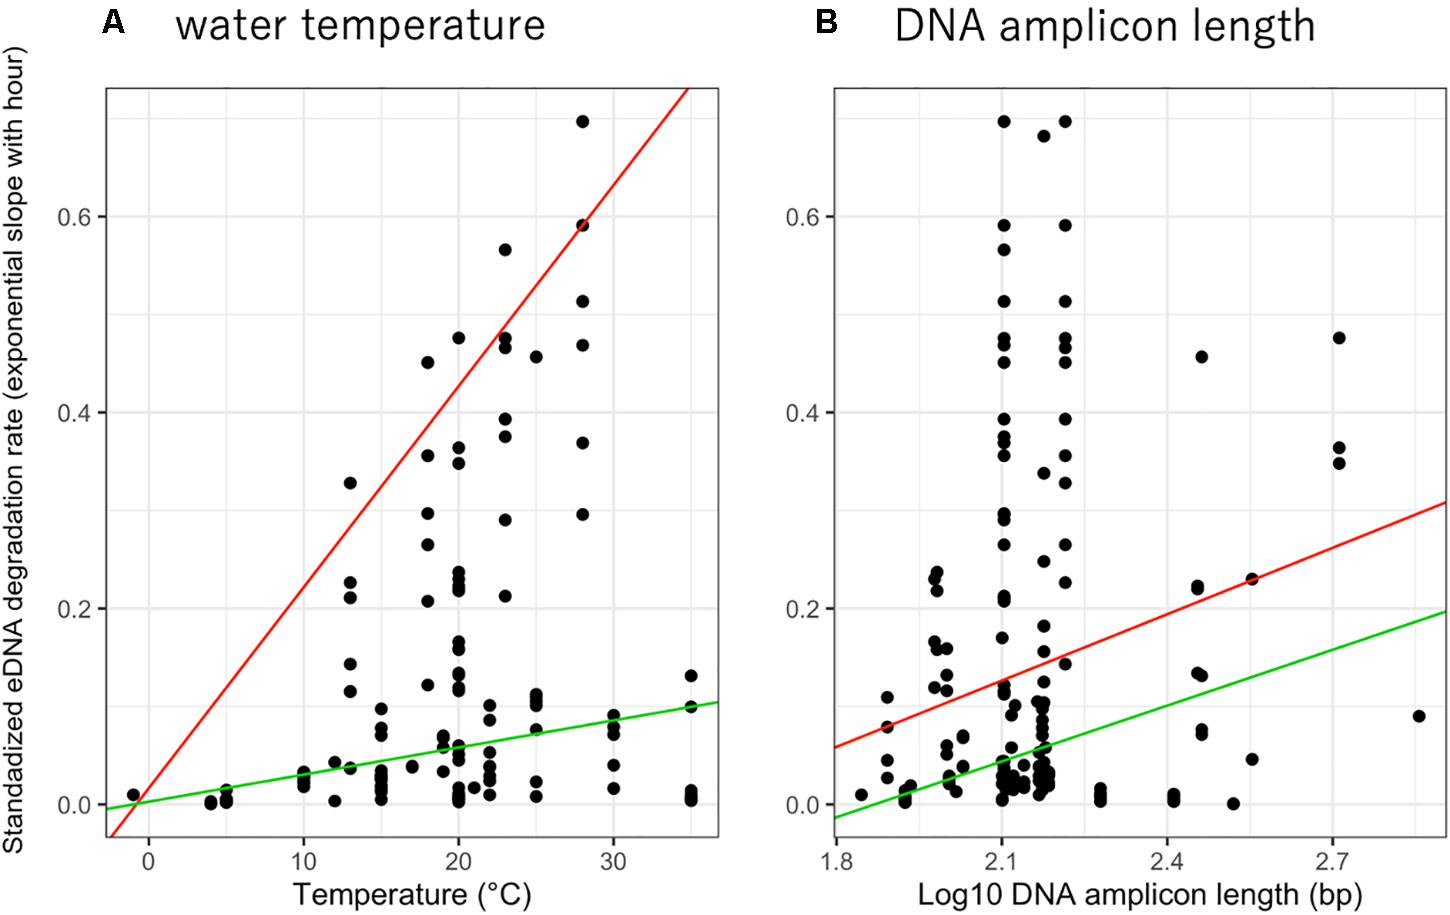
Figure 2. The relationship between standardized eDNA degradation rate per hour (simple exponential slope) with (A) water temperature and (B) DNA amplicon length. The red and green lines show 0.95 and 0.5- quantile mixed-effect quantile models for each factor.
eDNA Degradation Simulation
Our QM simulation lead to plotting the eDNA degradation on a matrix of water temperature and amplicon length (Figure 3), which showed that the water temperature had a great influence on the eDNA degradation rate. At lower (e.g., −1 to 5 °C) and higher (e.g., 15 to 35 °C) water temperatures, our model predicted that amplicon length would have a smaller effect on the eDNA degradation rate, while at moderate (e.g., 5 to 15 °C) water temperatures, our prediction more clearly showed that the longer amplicon length would have a faster degradation rate. Thus, at moderate water temperatures, the amplicon length should also be considered in evaluating eDNA degradation.
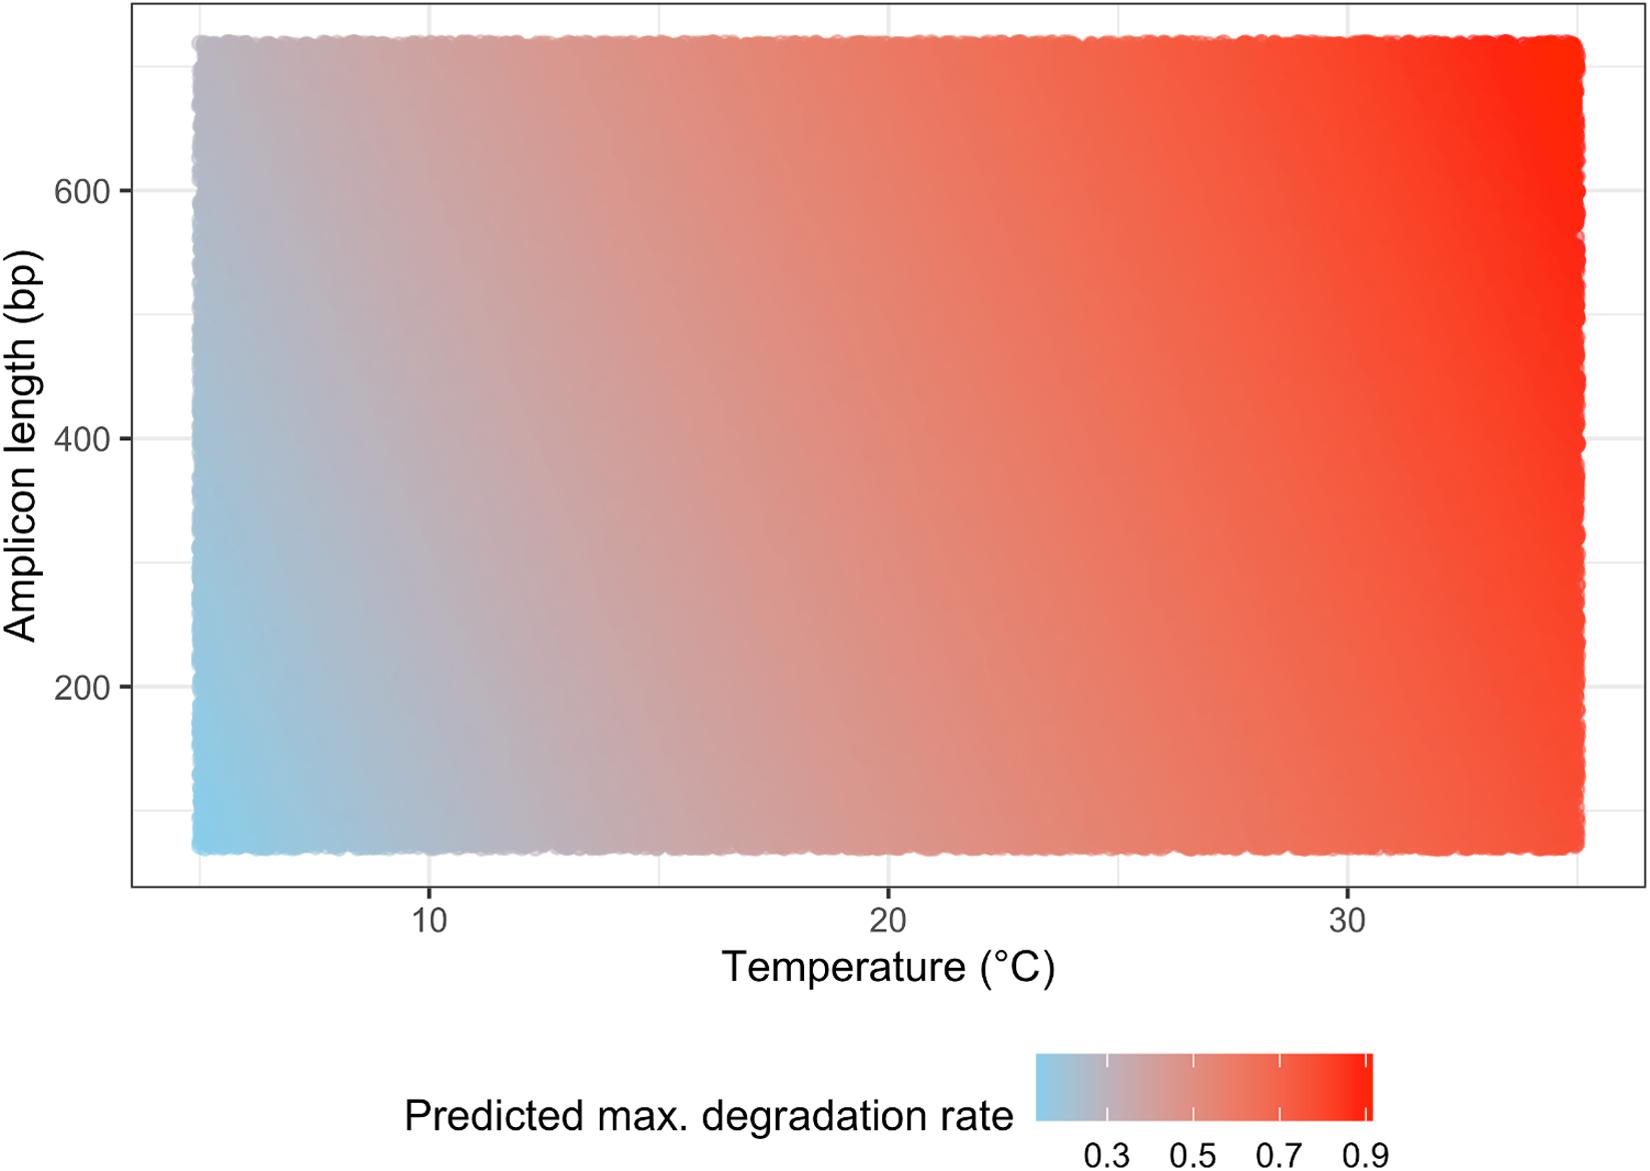
Figure 3. The simulation result for predicting eDNA degradation rate on the matrix of water temperature and amplicon length.
Discussion
Our meta-analysis results showed that eDNA degradation was accelerated in higher water temperatures and in longer amplicon length. These generally supported the effect of water temperature on the eDNA degradation rate in previous hypotheses for each condition and species (e. g., Strickler et al., 2015; Eichmiller et al., 2016; Lance et al., 2017; Tsuji et al., 2017; Jo et al., 2019; Kasai et al., 2020). Previous studies have assumed that water temperature does not directly affect eDNA degradation, but indirectly affects it through enzymatic hydrolysis by microbes and extracellular nucleases (reviewed in Barnes and Turner, 2016). At high temperatures, with increasing activity of microorganisms and extracellular enzymes, the eDNA in water would degrade more quickly (reviewed in Barnes and Turner, 2016). Our meta-analysis results showed that there were no significant differences between laboratory water (purified or tap water) and environmental water (seawater or freshwater). This may indicate the enzymes and bacteria possessed by experimental organisms affected the eDNA degradation. In fact, the degradation experiment, which intracellular DNA and fragmented DNA were added to purified water, showed that intracellular and fragments DNA were not degraded in the water for a week (Saito and Doi, 2020).
Evidence from previous studies suggested that, in eDNA samples, long amplicon length are less likely to be detected than short amplicon (Jo et al., 2017). Our meta-analysis supports these previous results. A possible explanation is provided by Jo et al. (2017), in which it was suggested that the DNA degradation rate was higher in longer amplicon length (719 bp) than in shorter amplicon (127 bp). Our simulation by QM indicated that shorter amplicon lengths were more likely to be detected when eDNA degradation was less affected by water temperature. When the eDNA degradation rates were very fast or very slow due to water temperature (e.g., 15 to 35 °C or 0 to 5°C, respectively), the amplicon length had a smaller effect on eDNA degradation than at other water temperature ranges. In higher temperatures, microbial activity that breaks down DNA is occurring fast on both large and short DNA fragments, such that both classes of fragments are not detectable by either a large or small fragment amplicon assay at a similar rate. Whereas in colder temperatures, both fragment classes are degraded at lower rates, and thus it is possible that the longer fragments are able to last longer than under warmer conditions, thus remaining detectable for longer (suggesting a slower decay rate).
In our meta-analysis, we evaluated amplicon lengths ranging from 70 to 719 bp, but there were no experiments in which longer amplicon were measured. Recently, however, long range PCR was used to amplify full mitogenomes from eDNA samples (Deiner et al., 2017a,b). Additional investigation is needed to better understand retention of such extremely long DNA (>16,000 bps), and the role of degradation in these cases.
Conclusion
In conclusion, our meta-analysis results showed that eDNA degradation was accelerated in higher water temperatures and in longer DNA amplicon. We predicted the combined effects of water temperature and amplicon length on the maximum eDNA degradation rate. Our meta-analysis and simulation provided new insights for future eDNA studies. We should note the limitations: The number of papers used for our meta-analysis was limited to 28 studies, and the data was limited especially for other environmental factors, such as UV, pH, and salinity, which are important factors for eDNA degradation (Barnes et al., 2014; Lance et al., 2017; Tsuji et al., 2017; Collins et al., 2018; Mächler et al., 2018). When data such as UV, pH, and salinity are obtained in addition to water temperature, more complex phenomena can be evaluated to determine the eDNA degradation rate in water. A greater understanding and accumulation of eDNA degradation data would improve future eDNA methods.
Data Availability Statement
The original contributions presented in the study are included in the article/Supplementary Material, further inquiries can be directed to the corresponding author.
Author Contributions
TS and HD designed the study, analyzed the data, interpreted the results, and wrote the manuscript. TS collected the data. Both authors contributed to the article and approved the submitted version.
Funding
This study was supported by the Environment Research and Technology Development Fund (JPMEERF20204004).
Conflict of Interest
The authors declare that the research was conducted in the absence of any commercial or financial relationships that could be construed as a potential conflict of interest.
Acknowledgments
We thank the authors of all the articles used for the meta-analysis.
Supplementary Material
The Supplementary Material for this article can be found online at: https://www.frontiersin.org/articles/10.3389/fevo.2021.623831/full#supplementary-material
Supplementary Figure 1 | The eDNA degradation rate (simple exponential slope) with the targeted taxon group. The dots indicate the individual eDNA degradation rate in each experiment. The boxes and bars in the box plot indicate median ± inter-quartiles and ± 1.5 × inter-quartiles, respectively.
Supplementary Figure 2 | The eDNA degradation rate (simple exponential slope) with (A) DNA region and (B) water source. In the plot, the limited data were excluded; NADH, D-loop, ND2, and ND4 for PCR region and pond, well for water source. The dots indicate the individual eDNA degradation rate in each experiment in different ecosystems. The boxes and bars in the box plot indicate median ± inter-quartiles and ± 1.5 × inter-quartiles, respectively.
Supplementary Figure 3 | The eDNA degradation rate (simple exponential slope) with temperature category. The temperature categories are divided into four levels: −1, 0–10, 11–20, and > 21 °C. The dots indicate the individual eDNA degradation rate in each experiment in different ecosystems. The boxes and bars in the box plot indicate median ± inter-quartiles and ± 1.5 × inter-quartiles, respectively.
Supplementary Figure 4 | The eDNA degradation rate (simple exponential slope) with amplicon length category. The amplicon length categories are divided into three levels: 0–100, 101–200, and > 201. The dots indicate the individual eDNA degradation rate in each experiment in different ecosystems. The boxes and bars in the box plot indicate median ± inter-quartiles and ± 1.5 × inter-quartiles, respectively.
Supplementary Table 1 | All data analyzed in this meta-analysis.
References
Andruszkiewicz, E. A., Sassoubre, L. M., and Boehm, A. B. (2017). Persistence of marine fish environmental DNA and the influence of sunlight. PLoS One 12:e0185043. doi: 10.1371/journal.pone.0185043
Barnes, M. A., and Turner, C. R. (2016). The ecology of environmental DNA & implications for conservation genetics. Conserv. Genet. 17, 1–17. doi: 10.1007/s10592-015-0775-4
Barnes, M. A., Turner, C. R., Jerde, C. L., Renshaw, M. A., Chadderton, W. L., and Lodge, D. M. (2014). Environmental conditions influence eDNA persistence in aquatic systems. Environ. Sci. Technol. 48, 1819–1827. doi: 10.1021/es404734p
Bylemans, J., Furlan, E. M., Gleeson, D. M., Hardy, C. M., and Duncan, R. P. (2018). Does size matter? An experimental evaluation of the relative abundance and decay rates of aquatic environmental DNA. Environ. Sci. Technol. 52, 6408–6416. doi: 10.1021/acs.est.8b01071
Collins, R. A., Wangensteen, O. S., O’Gorman, E. J., Mariani, S., Sims, D. W., and Genner, M. J. (2018). Persistence of environmental DNA in marine systems. Commun. Biol. 1, 1–11. doi: 10.1038/s42003-018-0192-6
Cowart, D. A., Murphy, K. R., and Cheng, C. H. C. (2018). Metagenomic sequencing of environmental DNA reveals marine faunal assemblages from the West Antarctic Peninsula. Mar. Genom. 37, 148–160. doi: 10.1016/j.margen.2017.11.003
Deiner, K., Bik, H. M., Mächler, E., Seymour, M., Lacoursière-Roussel, A., Altermatt, F., et al. (2017a). Environmental DNA metabarcoding: transforming how we survey animal and plant communities. Mol. Ecol. 26, 5872–5895. doi: 10.1111/mec.14350
Deiner, K., Renshaw, M. A., Li, Y., Olds, B. P., Lodge, D. M., and Pfrender, M. E. (2017b). Long-range PCR allows sequencing of mitochondrial genomes from environmental DNA. Methods Eco. Evol. 8, 1888–1898. doi: 10.1111/2041-210X.12836
Doi, H., Katano, I., Sakata, Y., Souma, R., Kosuge, T., Nagano, M., et al. (2017). Detection of an endangered aquatic heteropteran using environmental DNA in a wetland ecosystem. R. Soc. Open Sci. 4:170568. doi: 10.1098/rsos.170568
Eichmiller, J. J., Best, S. E., and Sorensen, P. W. (2016). Effects of temperature and trophic state on degradation of environmental DNA in lake water. Environ. Sci. Technol. 50, 1859–1867. doi: 10.1021/acs.est.5b05672
Ficetola, G. F., Miaud, C., Pompanon, F., and Taberlet, P. (2008). Species detection using environmental DNA from water samples. Biol. Lett. 4, 423–425. doi: 10.1098/rsbl.2008.0118
Fukumoto, S., Ushimaru, A., and Minamoto, T. (2015). A basin-scale application of environmental DNA assessment for rare endemic species and closely related exotic species in rivers: a case study of giant salamanders in Japan. J. Appl. Ecol. 52, 358–365. doi: 10.1111/1365-2664.12392
Jo, T., Arimoto, M., Murakami, H., Masuda, R., and Minamoto, T. (2020). Estimating shedding and decay rates of environmental nuclear DNA with relation to water temperature and biomass. Environ. DNA 2, 140–151. doi: 10.1002/edn3.51
Jo, T., Murakami, H., Masuda, R., Sakata, M. K., Yamamoto, S., and Minamoto, T. (2017). Rapid degradation of longer DNA fragments enables the improved estimation of distribution and biomass using environmental DNA. Mol. Ecol. Resour. 17, e25–e33. doi: 10.1111/1755-0998.12685
Jo, T., Murakami, H., Yamamoto, S., Masuda, R., and Minamoto, T. (2019). Effect of water temperature and fish biomass on environmental DNA shedding, degradation, and size distribution. Ecol. Evol. 9, 1135–1146. doi: 10.1002/ece3.4802
Kakuda, A., Doi, H., Souma, R., Nagano, M., Minamoto, T., and Katano, I. (2019). Detection of environmental DNA of the invasive red-eared slider in ponds for evaluating their distribution with comparison to water quality. PeerJ 7:e8155. doi: 10.7717/peerj.8155
Kasai, A., Takada, S., Yamazaki, A., Masuda, R., and Yamanaka, H. (2020). The effect of temperature on environmental DNA degradation of Japanese eel. Fish. Res. 86, 465–471. doi: 10.1007/s12562-020-01409-1
Lance, R. F., Klymus, K. E., Richter, C. A., Guan, X., Farrington, H. L., Carr, M. R., et al. (2017). Experimental observations on the decay of environmental DNA from bighead and silver carps. Manag. Biol. Invasions 8:343. doi: 10.3391/mbi.2017.8.3.08
Mächler, E., Osathanunkul, M., and Altermatt, F. (2018). Shedding light on eDNA: neither natural levels of UV radiation nor the presence of a filter feeder affect eDNA-based detection of aquatic organisms. PLoS One 13:e0195529. doi: 10.1371/journal.pone.0195529
Martellini, A., Payment, P., and Villemur, R. (2005). Use of eukaryotic mitochondrial DNA to differentiate human, bovine, porcine and ovine sources in fecally contaminated surface water. Water Res. 39, 541–548. doi: 10.1016/j.watres.2004.11.012
Maruyama, A., Nakamura, K., Yamanaka, H., Kondoh, M., and Minamoto, T. (2014). The release rate of environmental DNA from juvenile and adult fish. PLoS One 9:e114639. doi: 10.1371/journal.pone.0114639
Merkes, C. M., McCalla, S. G., Jensen, N. R., Gaikowski, M. P., and Amberg, J. J. (2014). Persistence of DNA in carcasses, slime and avian feces may affect interpretation of environmental DNA data. PLoS One 9:e0113346. doi: 10.1371/journal.pone.0113346
Minamoto, T., Fukuda, M., Katsuhara, K. R., Fujiwara, A., Hidaka, S., Yamamoto, S., et al. (2017). Environmental DNA reflects spatial and temporal jellyfish distribution. PLoS One 12:e0173073. doi: 10.1371/journal.pone.0173073
Minamoto, T., Naka, T., Moji, K., and Maruyama, A. (2016). Techniques for the practical collection of environmental DNA: filter selection, preservation, and extraction. Limnology 17, 23–32. doi: 10.1007/s10201-015-0457-4
Minamoto, T., Yamanaka, H., Takahara, T., Honjo, M. N., and Kawabata, Z. I. (2012). Surveillance of fish species composition using environmental DNA. Limnology 13, 193–197. doi: 10.1007/s10201-011-0362-4
Motulsky, H. J., and Christopoulos, A. (2003). Fitting Models to Biological Data Using Linear and Nonlinear Regression: A Practical Guide to Curve Fitting. San Diego: GraphPad Software, Inc. Available online at: www.graphpad.com
Moushomi, R., Wilgar, G., Carvalho, G., Creer, S., and Seymour, M. (2019). Environmental DNA size sorting and degradation experiment indicates the state of Daphnia magna mitochondrial and nuclear eDNA is subcellular. Sci. Rep. 9, 12500. doi: 10.1038/s41598-019-48984-7
Nevers, M. B., Byappanahalli, M. N., Morris, C. C., Shively, D., Przybyla-Kelly, K., Spoljaric, A. M., et al. (2018). Environmental DNA (eDNA): a tool for quantifying the abundant but elusive round goby (Neogobius melanostomus). PLoS One 13:e0191720. doi: 10.1371/journal.pone.0191720
Nukazawa, K., Hamasuna, Y., and Suzuki, Y. (2018). Simulating the advection and degradation of the environmental DNA of common carp along a river. Environ. Sci. Technol. 52, 10562–10570. doi: 10.1021/acs.est.8b02293
Pfleger, M. O., Rider, S. J., Johnston, C. E., and Janosik, A. M. (2016). Saving the doomed: using eDNA to aid in detection of rare sturgeon for conservation (Acipenseridae). Glob. Ecol. Conserv. 8, 99–107. doi: 10.1016/j.gecco.2016.08.008
R Core Team (2020). R: A Language and Environment for Statistical Computing. Vienna: R Foundation for Statistical Computing.
Saito, T., and Doi, H. (2020). Degradation modeling of water environmental DNA: experiments on multiple DNA sources in pond and seawater. bioRxiv [Preprint], doi: 10.1101/2020.04.03.023283
Sakata, M. K., Maki, N., Sugiyama, H., and Minamoto, T. (2017). Identifying a breeding habitat of a critically endangered fish, Acheilognathus typus, in a natural river in Japan. Sci. Nat. 104:100. doi: 10.1007/s00114-017-1521-1
Sansom, B. J., and Sassoubre, L. M. (2017). Environmental DNA (eDNA) shedding and decay rates to model freshwater mussel eDNA transport in a river. Environ. Sci. Technol. 51, 14244–14253. doi: 10.1021/acs.est.7b05199
Sassoubre, L. M., Yamahara, K. M., Gardner, L. D., Block, B. A., and Boehm, A. B. (2016). Quantification of environmental DNA (eDNA) shedding and decay rates for three marine fish. Environ. Sci. Technol. 50, 10456–10464. doi: 10.1021/acs.est.6b03114
Sengupta, M. E., Hellström, M., Kariuki, H. C., Olsen, A., Thomsen, P. F., Mejer, H., et al. (2019). Environmental DNA for improved detection and environmental surveillance of schistosomiasis. Proc. Natl. Acad. Sci. U.S.A. 116, 8931–8940. doi: 10.1073/pnas.1815046116
Sigsgaard, E. E., Carl, H., Møller, P. R., and Thomsen, P. F. (2015). Monitoring the near-extinct European weather loach in Denmark based on environmental DNA from water samples. Biol. Conserv. 183, 46–52. doi: 10.1016/j.biocon.2014.11.023
Strickler, K. M., Fremier, A. K., and Goldberg, C. S. (2015). Quantifying effects of UV-B, temperature, and pH on eDNA degradation in aquatic microcosms. Biol. Conserv. 183, 85–92. doi: 10.1016/j.biocon.2014.11.038
Taberlet, P., Coissac, E., Pompanon, F., Brochmann, C., and Willerslev, E. (2012). Towards next-generation biodiversity assessment using DNA metabarcoding. Mol. Ecol. 21, 2045–2050. doi: 10.1111/j.1365-294X.2012.05470.x
Takahara, T., Minamoto, T., Yamanaka, H., Doi, H., and Kawabata, Z. I. (2012). Estimation of fish biomass using environmental DNA. PLoS One 7:e035868. doi: 10.1371/journal.pone.0035868
Thomsen, P. F., Kielgast, J., Iversen, L. L., Møller, P. R., Rasmussen, M., and Willerslev, E. (2012). Detection of a diverse marine fish fauna using environmental DNA from seawater samples. PLoS One 7:e41732. doi: 10.1371/journal.pone.0041732
Tsuji, S., Takahara, T., Doi, H., Shibata, N., and Yamanaka, H. (2019). The detection of aquatic macroorganisms using environmental DNA analysis—A review of methods for collection, extraction, and detection. Environ. DNA 1, 99–108. doi: 10.1002/edn3.21
Tsuji, S., Yamanaka, H., and Minamoto, T. (2017). Effects of water pH and proteinase K treatment on the yield of environmental DNA from water samples. Limnology 18, 1–7. doi: 10.1007/s10201-016-0483-x
Turner, C. R., Miller, D. J., Coyne, K. J., and Corush, J. (2014). Improved methods for capture, extraction, and quantitative assay of environmental DNA from Asian bigheaded carp (Hypophthalmichthys spp.). PLoS One 9:e114329. doi: 10.1371/journal.pone.0114329
Turner, C. R., Uy, K. L., and Everhart, R. C. (2015). Fish environmental DNA is more concentrated in aquatic sediments than surface water. Biol. Conserv. 183, 93–102. doi: 10.1016/j.biocon.2014.11.017
Ushio, M., Murakami, H., Masuda, R., Sado, T., Miya, M., Sakurai, S., et al. (2018). Quantitative monitoring of multispecies fish environmental DNA using high-throughput sequencing. Metabarcoding Metagenom 2:e23297. doi: 10.3897/mbmg.2.23297
Villacorta-Rath, C., Adekunle, A. I., Edmunds, R. C., Strugnell, J. M., Schwarzkopf, L., and Burrows, D. (2020). Can environmental DNA be used to detect first arrivals of the cane toad, Rhinella marina, into novel locations? Environ. DNA 2, 635–646. doi: 10.1002/edn3.114
Wei, N., Nakajima, F., and Tobino, T. (2018). A microcosm study of surface sediment environmental DNA: decay observation, abundance estimation, and fragment length comparison. Environ. Sci. Technol. 52, 12428–12435. doi: 10.1021/acs.est.8b04956
Weltz, K., Lyle, J. M., Ovenden, J., Morgan, J. A., Moreno, D. A., and Semmens, J. M. (2017). Application of environmental DNA to detect an endangered marine skate species in the wild. PLoS One 12:e0178124. doi: 10.1371/journal.pone.0178124
Wood, S. A., Biessy, L., Latchford, J. L., Zaiko, A., von Ammon, U., Audrezet, F., et al. (2020). Release and degradation of environmental DNA and RNA in a marine system. Sci. Total Environ. 704:135314. doi: 10.1016/j.scitotenv.2019.135314
Keywords: environmental DNA, polymerase chain reaction, degradation rate, quantile model, meta-analysis
Citation: Saito T and Doi H (2021) A Model and Simulation of the Influence of Temperature and Amplicon Length on Environmental DNA Degradation Rates: A Meta-Analysis Approach. Front. Ecol. Evol. 9:623831. doi: 10.3389/fevo.2021.623831
Received: 30 October 2020; Accepted: 19 February 2021;
Published: 19 March 2021.
Edited by:
Katy Klymus, United States Geological Survey (USGS), United StatesReviewed by:
Catherine Richter, Columbia Environmental Research Center, United States Geological Survey, United StatesSheena Feist, Engineer Research and Development Center (ERDC), United States
Copyright © 2021 Saito and Doi. This is an open-access article distributed under the terms of the Creative Commons Attribution License (CC BY). The use, distribution or reproduction in other forums is permitted, provided the original author(s) and the copyright owner(s) are credited and that the original publication in this journal is cited, in accordance with accepted academic practice. No use, distribution or reproduction is permitted which does not comply with these terms.
*Correspondence: Tatsuya Saito, tatwoeight630@icloud.com