 Zhi Wang
 Wanggu Xu
- Nanjing Institute of Environmental Sciences, MEE, Nanjing, China
Variations in landscape patterns can provide key information on the effects human activity has on landscapes, and consequently, have received increased attention in recent years. This paper mainly deals with the spatio-temporal variation and driving force of the landscape pattern on the Yancheng coast using remote sensing and GIS. The results indicate the following: (1) The landscape was mostly farmland from 1984 to 2008, not wetlands. The landscape matrix changed from a situation in which the natural landscape was equal to the artificial landscape in 1984, while the latter was dominant between 1990 and 2008. The area of natural landscape decreased considerably—the proportion of natural landscapes was 51.07% in 1984, while it decreased to 28.82% in 2008. Artificial landscapes increased significantly—the majority of the increased artificial landscapes were farmland and aquaculture ponds. (2) The changes in these landscapes showed a trend, changing from natural landscapes to artificial landscapes. Salinity is the decisive factor of this fixed route o the landscape successions of the coast. (3) Although Yancheng wetland nature reserve was established in 1984 and was designated as a National Nature Reserve in 1992, anthropogenic activities on the Yancheng coast continue apace, and the trend of natural landscape loss has not changed. (4) According to the analysis of the landscape transition rate of the Yancheng coast during each phase, we concluded that the main driving force of coastal landscape succession was anthropogenic activities. Our method provides a novel quantitative method to assess the driving forces behind landscape successions.
Introduction
Landscape pattern variations can provide crucial information on the effects of anthropogenic activity on landscapes, and this topic has consequently received much attention in recent years (Baus et al., 2014; Currin et al., 2015; Skilodimou et al., 2018). The coast is an ecotone with interactions between marine effects, land, and atmospheric processes, biological effects, and anthropogenic activities (Noble et al., 2003; Lee et al., 2006). It is also a fragile ecotone that is sensitive to environmental changes (Rosenberger et al., 2008; Kong et al., 2015). The coast is a suitable habitat for many endangered waterfowl used for breeding and wintering, and plays a significant role in environmental regulation and biodiversity conservation. On the other hand, anthropogenic activities have become the main factors of coastal landscape succession. With population increases and rapid economic development, coastal resources have been over-developed by tideland reclamation, coastal projects, and so on (Lei and Zhang, 2005; Chen et al., 2017), which can lead to the invasion of alien species and coastal pollution.
The Millennium Ecosystem Assessment shows that the coast suffers more interference. In particular, natural habitats have decreased significantly, which poses a serious threat to biodiversity on the coast [Millennium Ecosystem Assessment [MEA], 2005]. All around the world, coastlines are subjected to the contradiction between resource exploitation and environment protection, which is the main reason that integrated coastal management has become a global hot topic in recent years (Farmer and Parent, 1997; Hu and Xiao, 1999; Falcucci et al., 2007; Garza, 2008; Schwemmer et al., 2008). Therefore, the analysis of landscape spatial changes and its driving forces during different periods of the coast has become the latest trend, and is important for better understanding the evolution of the regional environment and changes in the global environment (Wang et al., 1996; Xiao et al., 2001; Li et al., 2002; Ou and Yang, 2003; Hu et al., 2004; Wang and Li, 2006; Zhang et al., 2009). It is also an issue that needs to be studied urgently to promote better conservation.
The analysis on the driving forces of landscape change is a sort of directional study, and therefore there is no specific method or framework. Statistical analysis is helpful in identifying correlations between landscape changes and driving forces. Some studies have only qualitatively analyzed the causes of natural habitat changes in coast (Cheng et al., 2019). Some studies try to use landscape pattern change to analyze driving factors (Plieninger et al., 2016; Yan et al., 2019). The problems of management and conservation policy are widely known, but quantitative information about the driving force of deterioration is deficient. Although most current achievements do not fully explain the causal relationship and driving mechanism between factors and changes, they lay a good foundation for the future of research in this field.
Some natural coastal ecosystems are being continuously altered, transformed, or destroyed. Can the development of nature reserves prevent the change in landscape patterns? Although nature reserves are generally believed to be the cornerstones of biodiversity conservation and the safest strongholds of wilderness (Noss, 1996), human encroachments and threats are still very common in many nature reserves. Liu et.al found that Wolong Nature Reserve, located in the mountains, has become more fragmented and less suitable for giant panda habitation after the reserve’s establishment (Liu et al., 2001). It is not clear whether protected coastal areas are effectively protected because there is little research comparing ecological degradation after the protected areas were established.
This study evaluated landscape changes of the coastal ecosystems at the Yancheng coast from 1984 to 2008. With landscape pattern changes at the Yancheng coast, certain ecological problems have emerged, such as wetland degradation and habitat loss. The quantitative analysis of landscape changes is necessary to solve the ecological problems resulting from landscape changes. The main goals of this study are: (1) to analyze the route of landscape succession at the Yancheng coast, (2) to identify the conservation effectiveness of a nature reserve, and (3) to evaluate the main driving forces of landscape succession.
Study Area
The Yancheng coast is a typical muddy beach with accretion and is located in the central coastal areas of Jiangsu, which is an underdeveloped region in the Yangtze River Delta region. The coast has been strongly influenced by human activities, especially in the last 30 years. A series of ecological problems, such as large-scale land reclamation, pollution, over-exploitation, and biological invasion (Wang et al., 2007) have significantly impacted biodiversity conservation. The natural landscape area has been gradually reduced, and the landscape patterns have changed dramatically. The quality of the habitat for endangered birds has decreased. Experts have carried out extensive research, but quantitative analysis on spatiotemporal variation and the driving mechanisms of landscape patterns on the Yancheng coast have been lacking.
The benign climate and favorable natural environment of the Yancheng coast have led to the development of rich biological resources. It is not only an important migration route for East Asia-Australasia migratory birds, but it is also the world’s largest wintering ground for red-crowned cranes—listed as Chinese first-class protected wild animals. In 2002, it was designated as a RAMSAR site.
To analyze the dynamic changes in the landscapes in different years, we set the study area to the same as the boundaries of the Yancheng Wetland National Nature Reserve, which is the main part of the Yancheng coast. We selected the 1992 west, south, and north boundaries of the Reserve and the east boundary as it was adjusted in 2006. The area covers 5,515km2 and includes five counties of Yancheng, namely, Xiangshui, Binhai, Sheyang, Dafeng, and Dongtai (Figure 1).
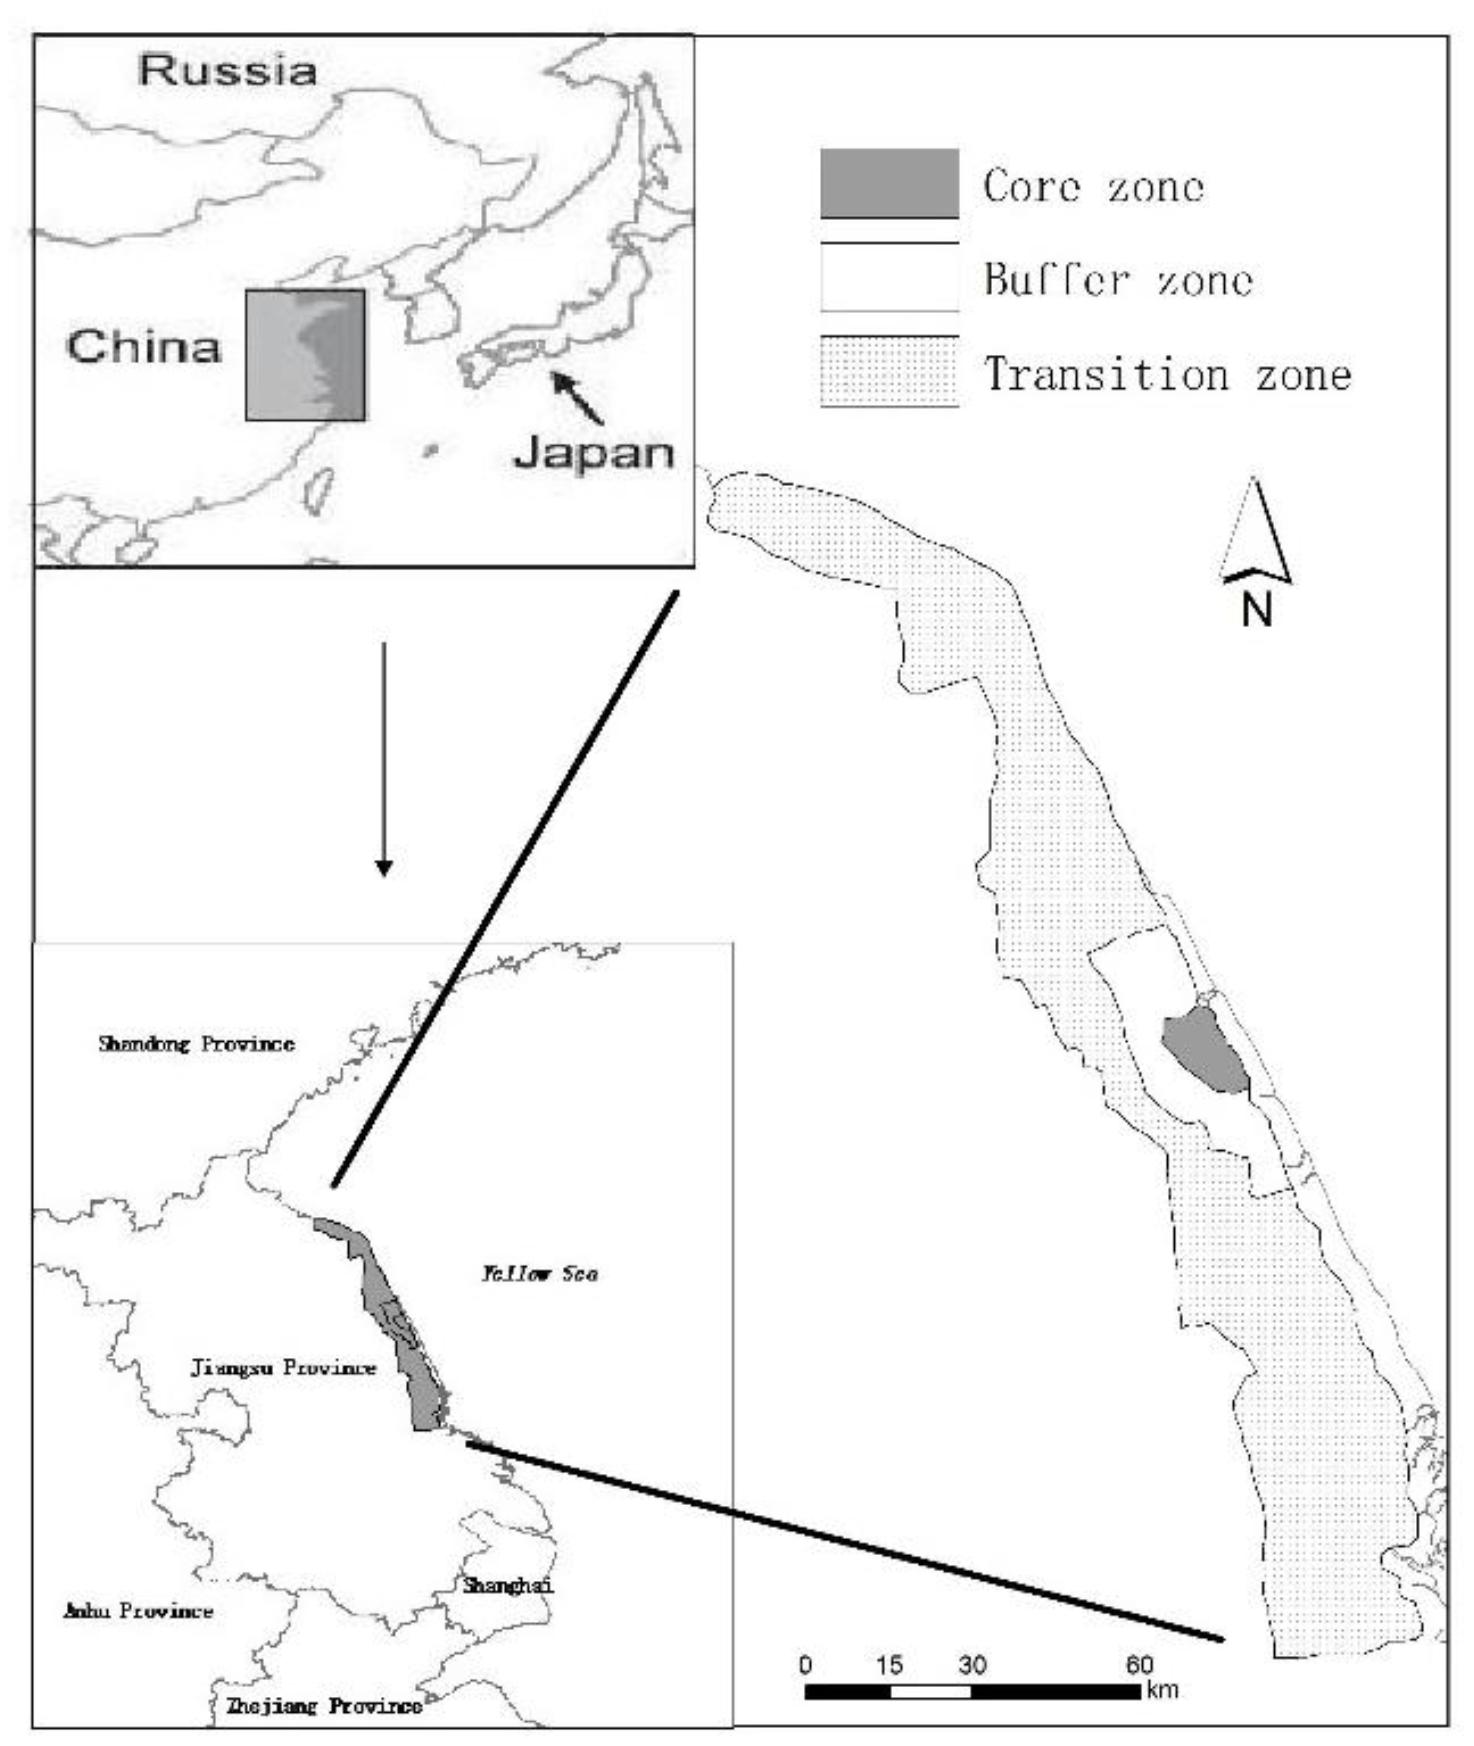
Figure 1. Study area.
Materials and Methods
Data Collection
We combined expert classification and supervised classification methods to extract the land cover information of the study area and corrected the classification result using ground survey data in ERDAS Imagine 8.5 and ArcGIS 9.3. We then obtained four landscape pattern figures of the study area.
We devised a generalized classification scheme of the landscape which includes 10 types: reed fields (Phragmitesaustralis), Suaeda fields (Suaeda salsa), Spartinaalterniflora fields, mudflats, river, sea, aquaculture ponds, salt ponds, farmland, and residential areas. To eliminate the influence of tides, we selected the border of the land area covered by the maximum extent on each image as the eastern boundary of mudflats. The area to the east of the mudflats was classified as the sea.
Regarding landscape classification, most studies divided the study area into many landscapes by the land-use/land-cover method or divided the coast into wetland and non-wetland landscapes, and then divided wetland landscapes into natural wetlands and artificial wetlands (Wang et al., 1997; Li et al., 2006; Ding et al., 2009; Hao et al., 2010). To reveal the driving mechanism of landscape changes more effectively, this study divided the area into natural and artificial landscapes. The natural landscapes include reed fields, Suaeda fields, Spartinaalterniflora fields, mudflats, rivers, and the sea. The artificial landscape includes aquaculture ponds, salt ponds, farmland, and residential areas.
Methods
To explore the structure and the change of landscape patterns during 1982–2008, we calculated the landscape transfer matrix of the Yancheng coast in three phases. We then calculated some parameters in different steps, such as the dynamic transfer rate of single land use (Wang and Bao, 1999), the retention rate of the landscape, the contribution rate of a specific landscape transfer process, and the contribution rate of major landscape transfer processes (Zeng et al., 2003; Liu et al., 2009).
The dynamic transfer rate of single land use was calculated to reveal the changes in the type of land use within a specific time in the study area. It is calculated as:
where K is the dynamic transfer rate of single land use during the study period, Ua and Ub are the quantity of a type of land-use at the beginning and end of the study period, respectively, T is the length of the study period (when the time period of T is set as year), and the value of K is the annual transfer rate of single land-use in the study area.
The retention rate of the landscape was used to analyze the stability of the main landscape in different periods. It refers to the ratio of the area of a single landscape that had not been transferred at the beginning and end of the study period.
where BRi is the retention rate of the ith landscape in a certain period, TAi is the area of the ith landscape at the beginning of the study period, and BAi is the unchanged area of the ith landscape during the study period.
The contribution rate of a specific landscape transfer process refers to the proportion of the transfer area of a transfer process to the total amount of transfer occurring in the landscape. It can be used to compare the importance of several specific landscape transfer processes.
where Tpi is the contribution rate of a specific landscape transfer process, Aij is the area transferred from the ith landscape to the jth landscape, and At is the total area of landscape transfer occurring in time t.
The contribution rate of the major landscape transfer process can describe the distribution of the area reduction of the dynamic transfer processes of major landscapes in the study area.
where ORij is the contribution rate of the transfer from the ith landscape to the jth landscape, Aij is the area of the ith landscape transferred to the jth landscape, and n is the number of types transferred from the ith landscape.
Results
Landscape Characteristics
Table 1 shows the landscape of the Yancheng coast in 1984, 1992, 2000, and 2008 (Figures 2–5). Unexpectedly, the primary landscape type has always been farmland, not wetlands. In 1984, the natural landscape proportion was similar to that of the artificial landscape, but the natural landscape had a slight advantage. Its area was 280,000c, accounting for 51.07% of the study area (Tables 1, 2). In 2008, the natural landscape area was 160,000 hm2, accounting for 28.82% of the study area. The artificial landscape area increased annually and became the dominant landscape. Farmland and aquaculture ponds were the major landscape types in 2008. The majority of the artificial landscapes are aquaculture ponds and farmlands.
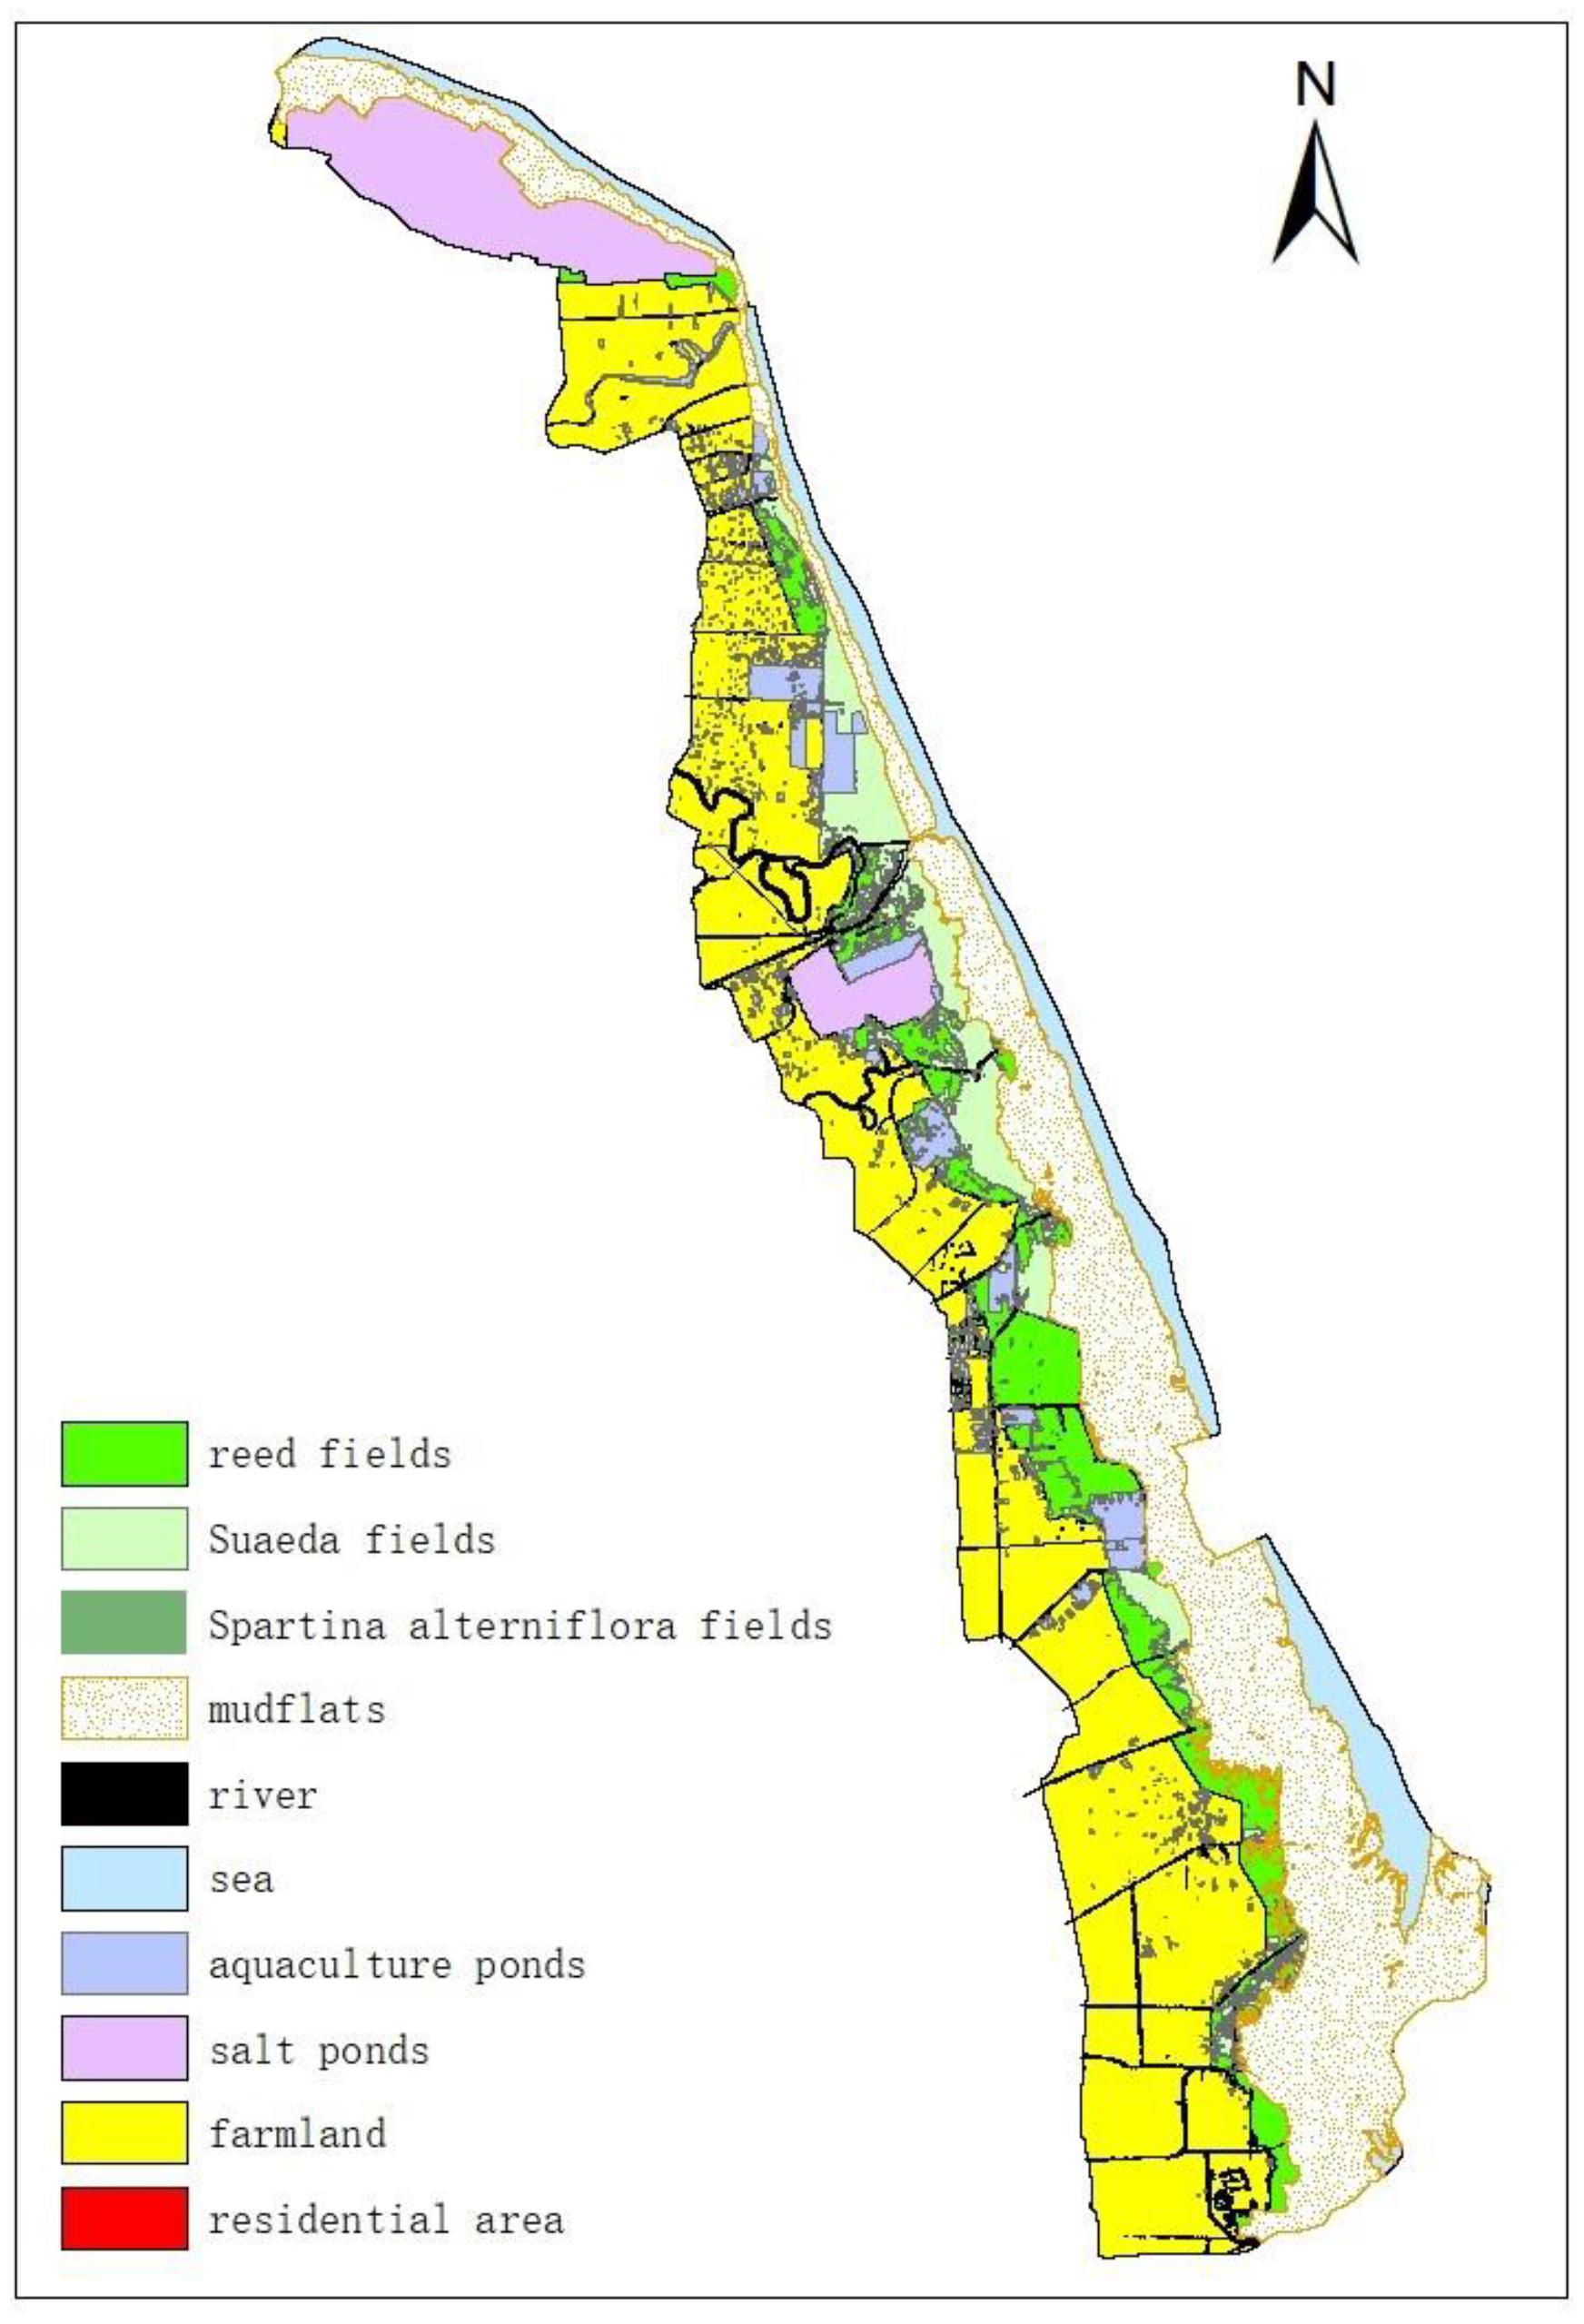
Figure 2. Landscape map of Yancheng coast in 1984.
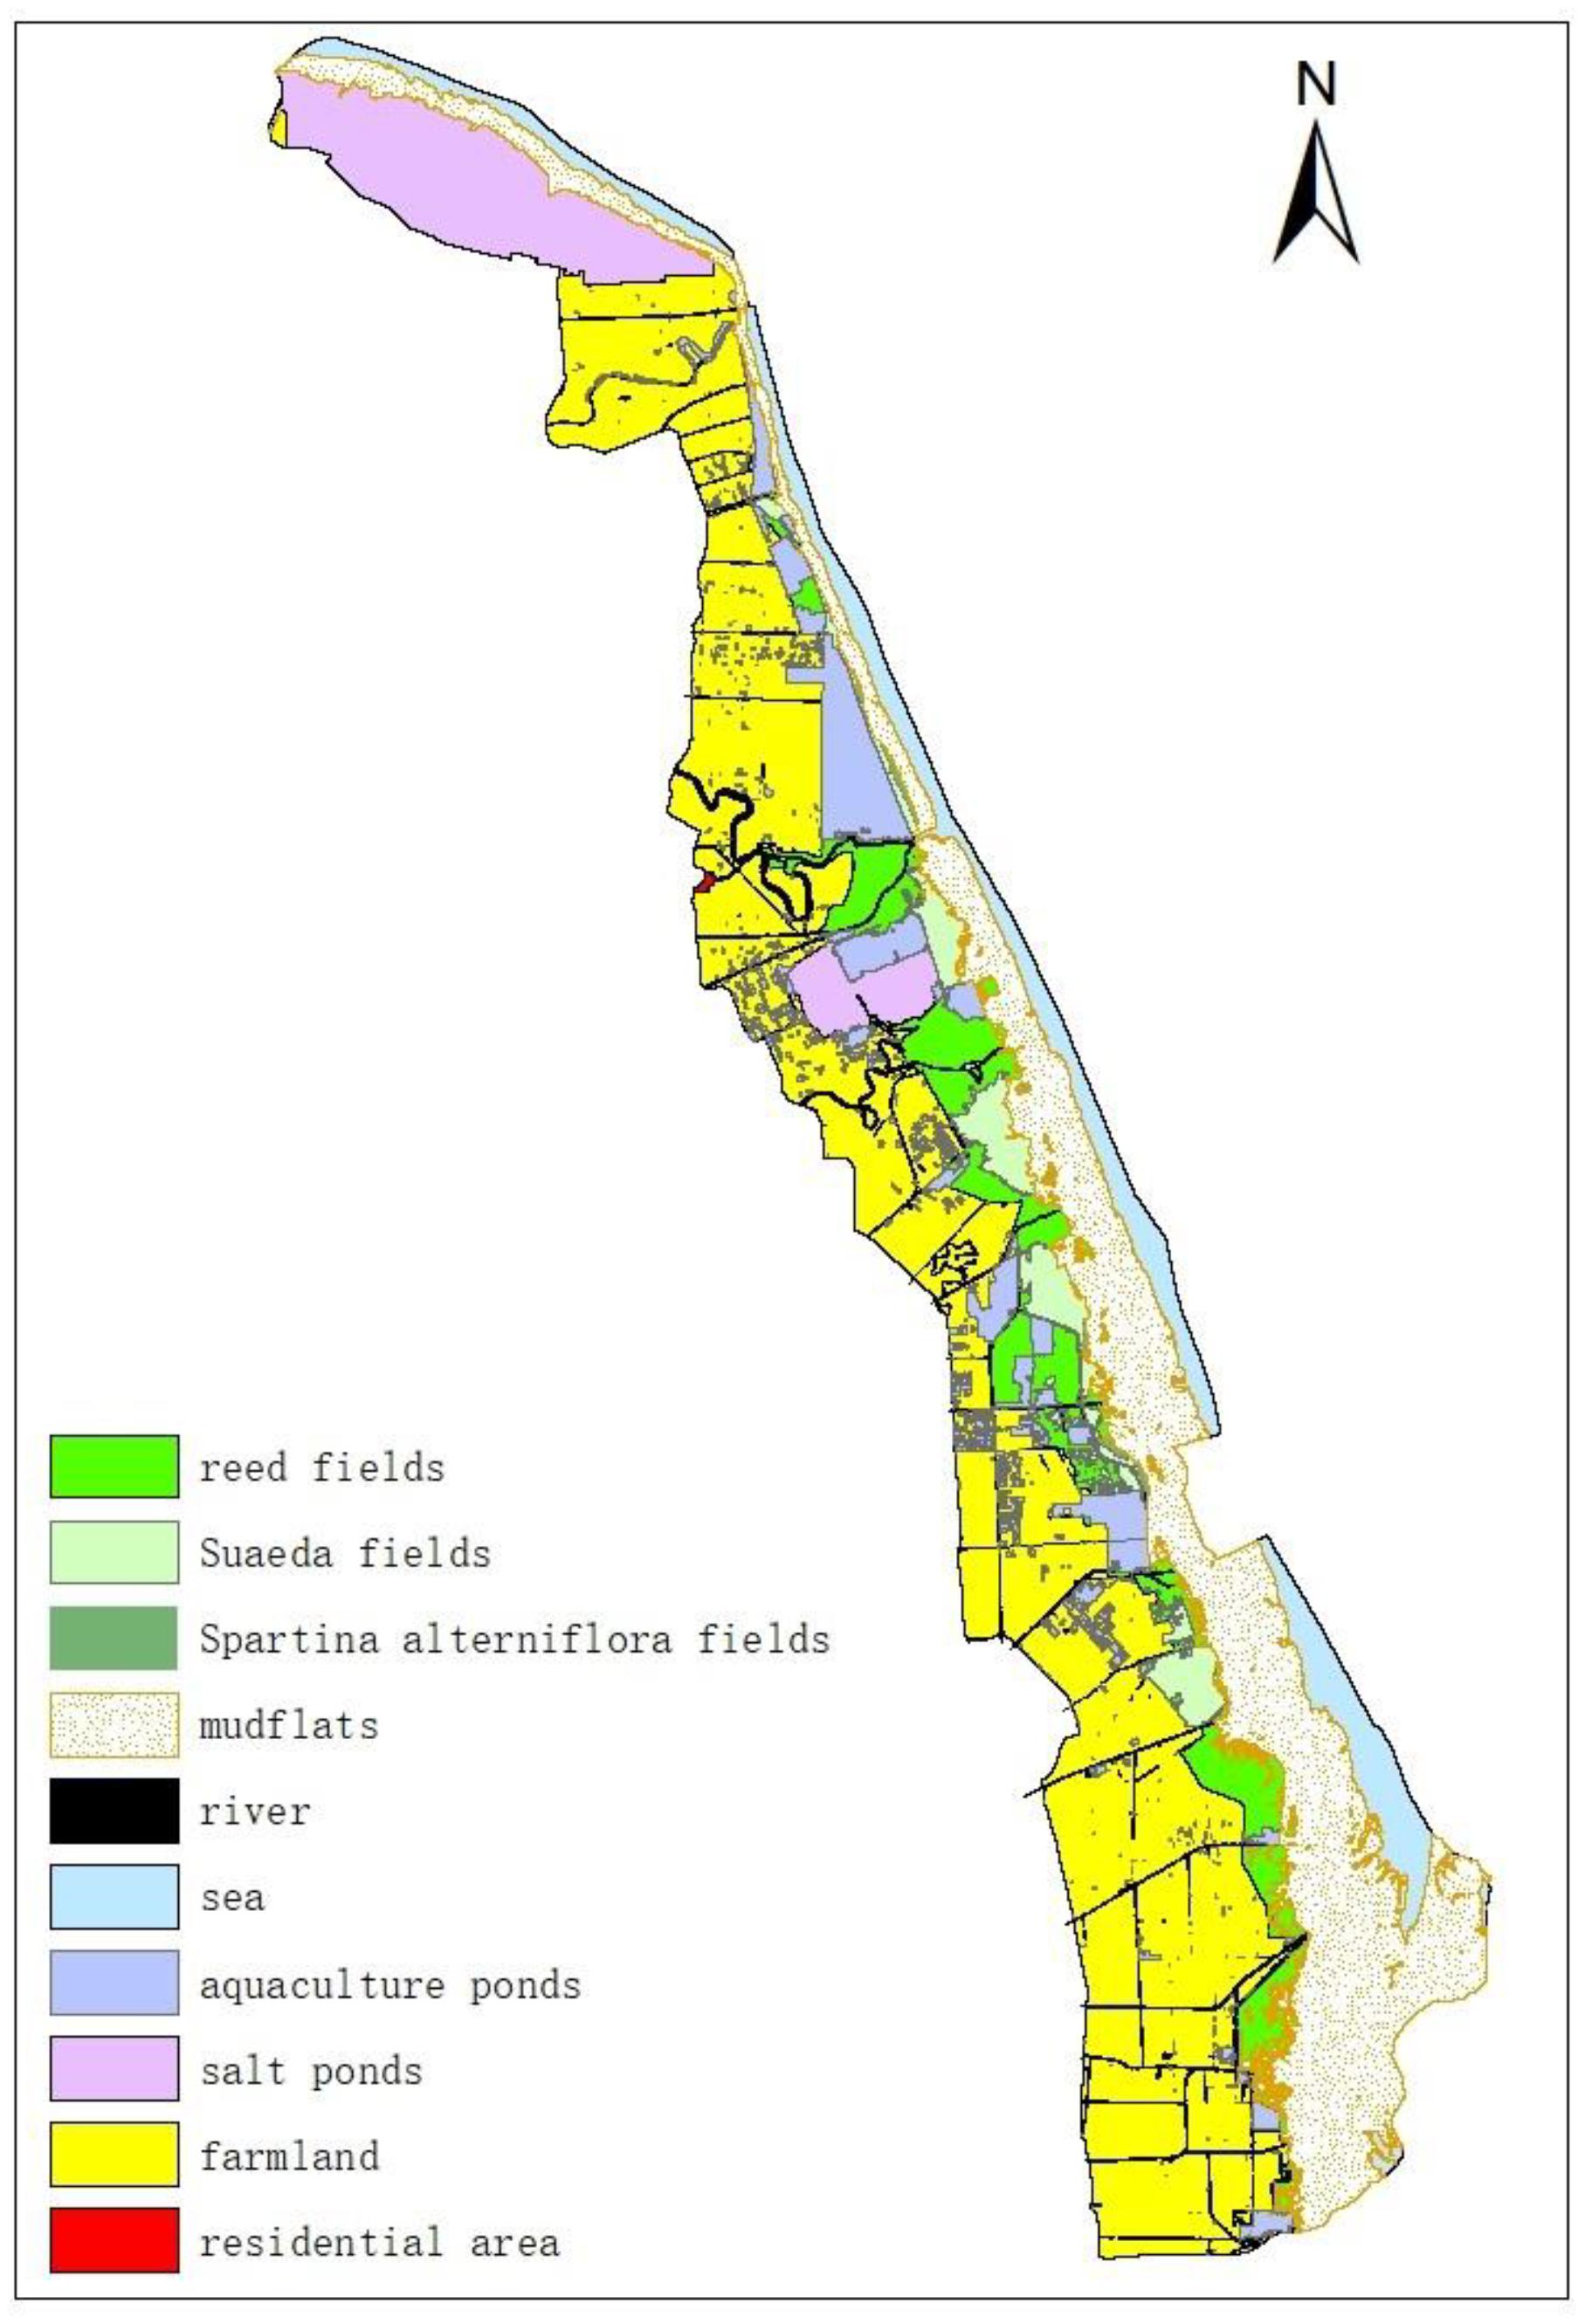
Figure 3. Landscape map of Yancheng coast in 1992.
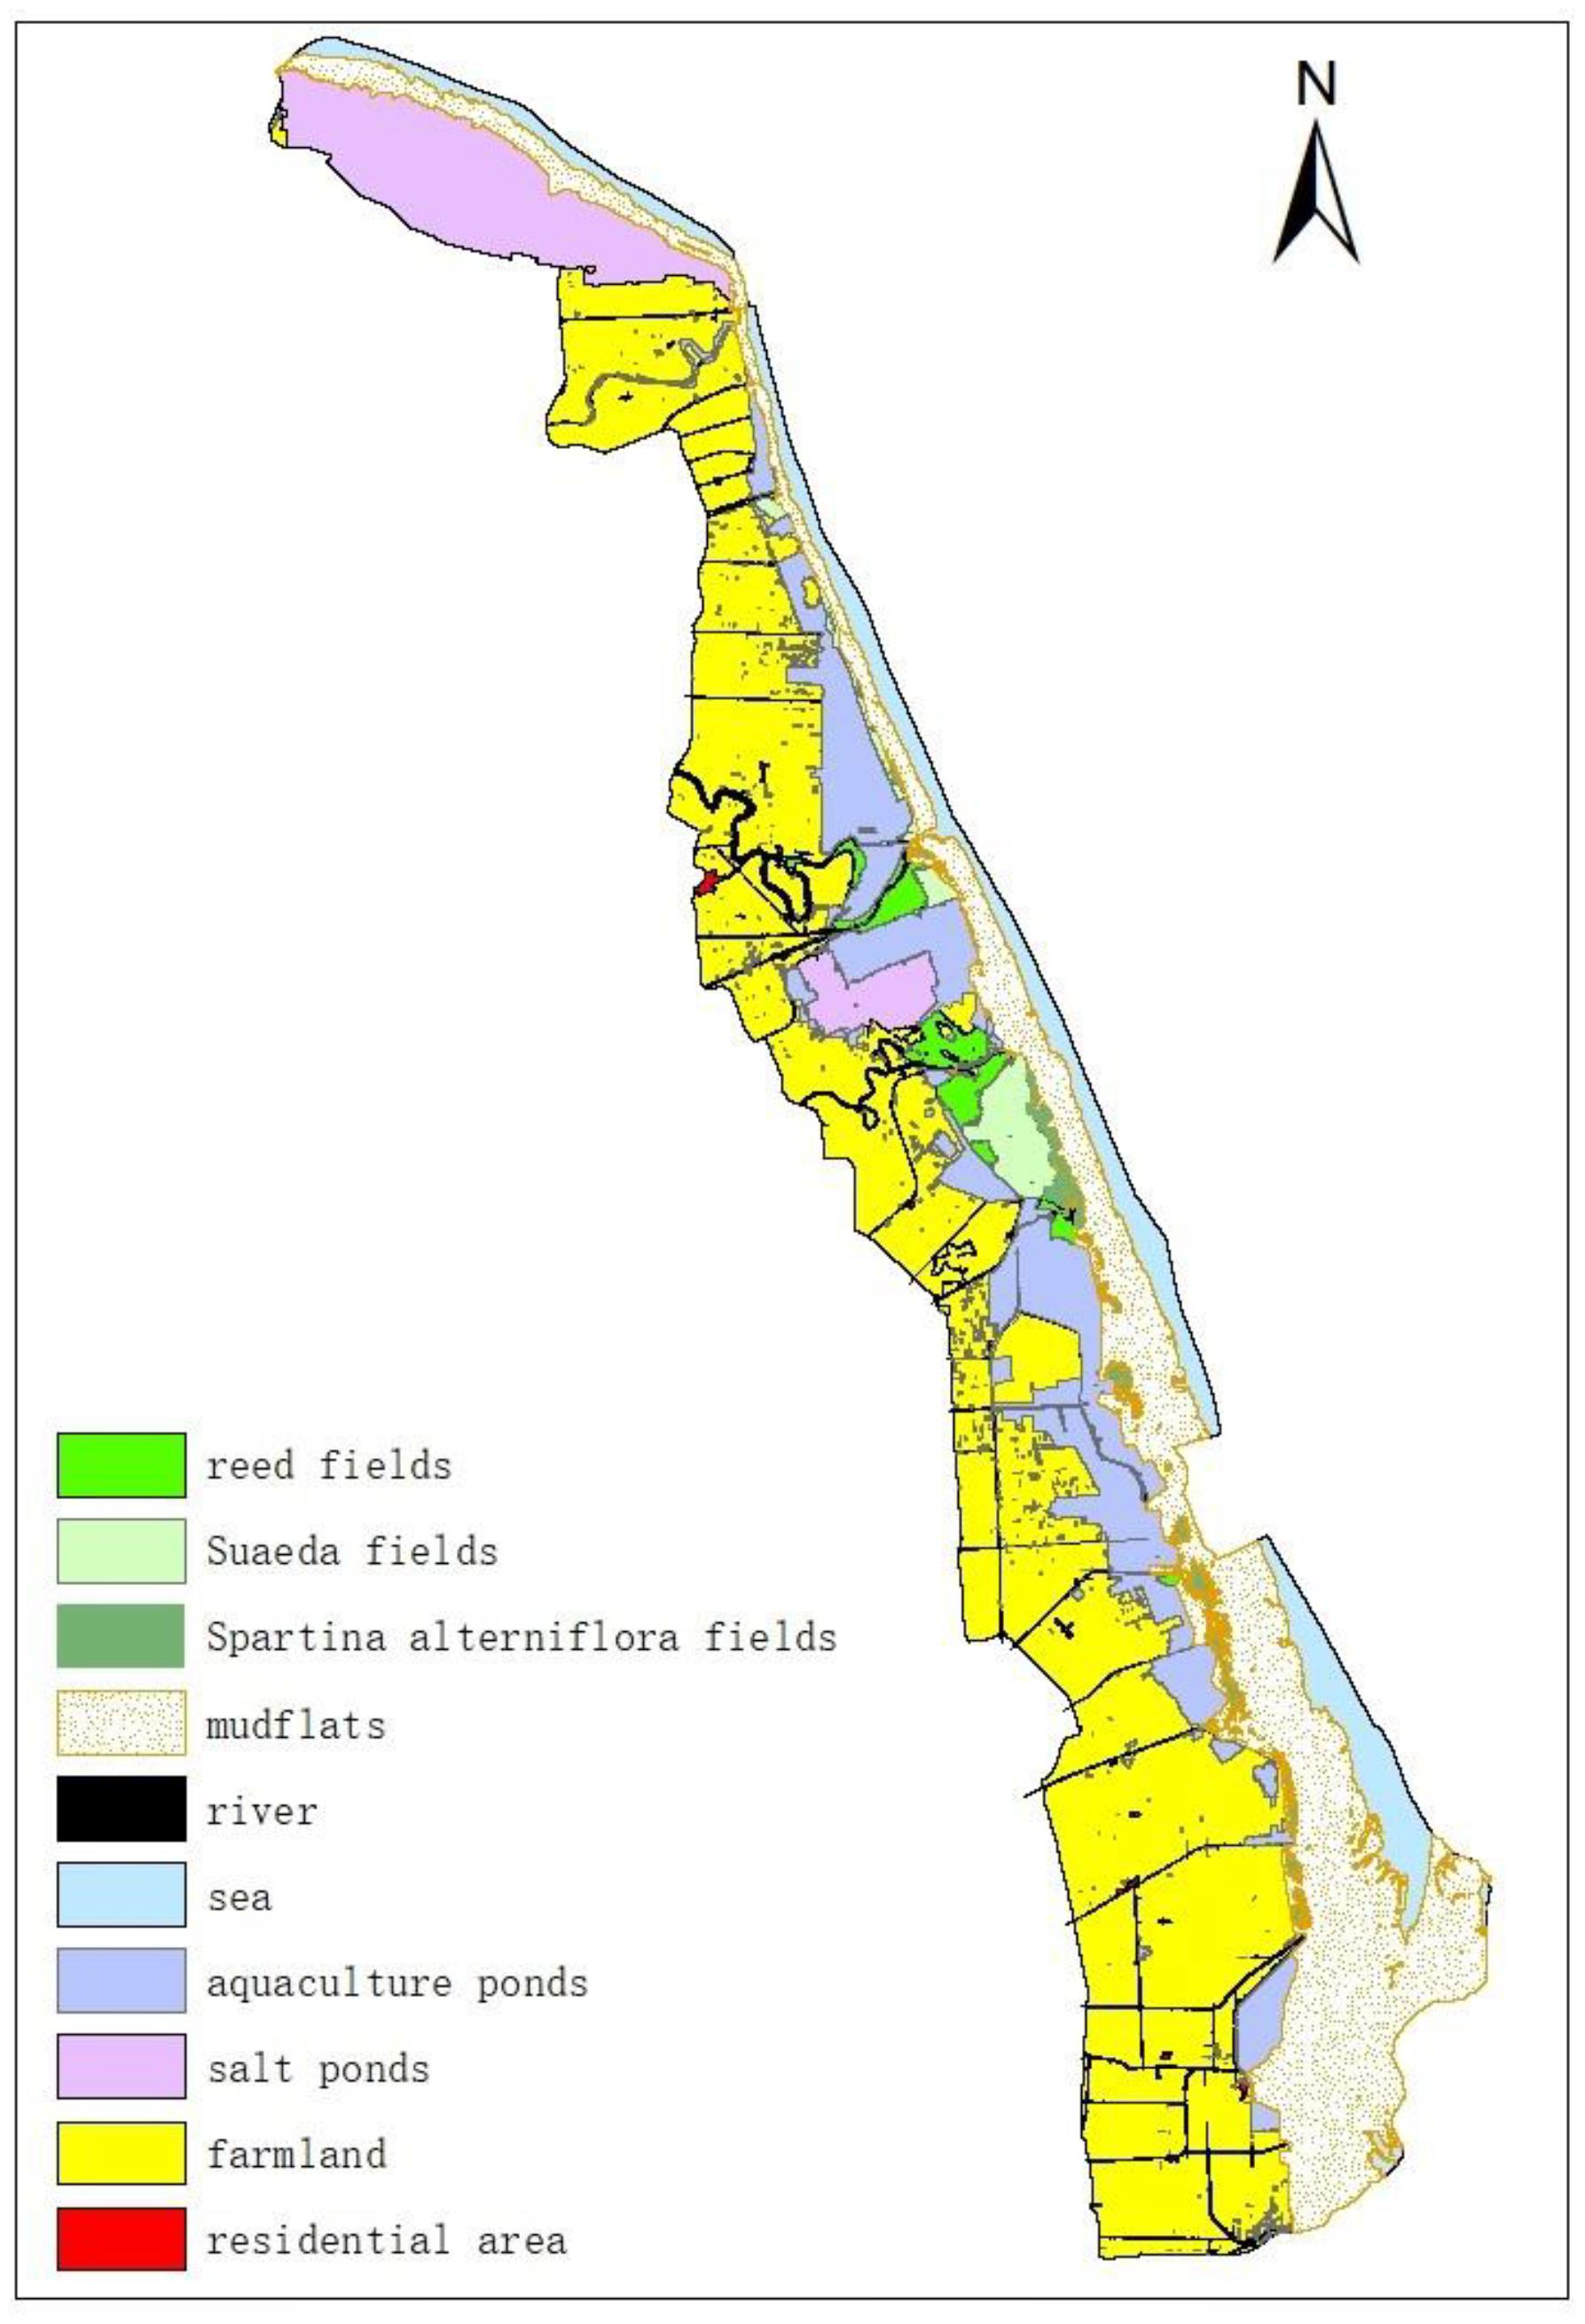
Figure 4. Landscape map of Yancheng coast in 2000.
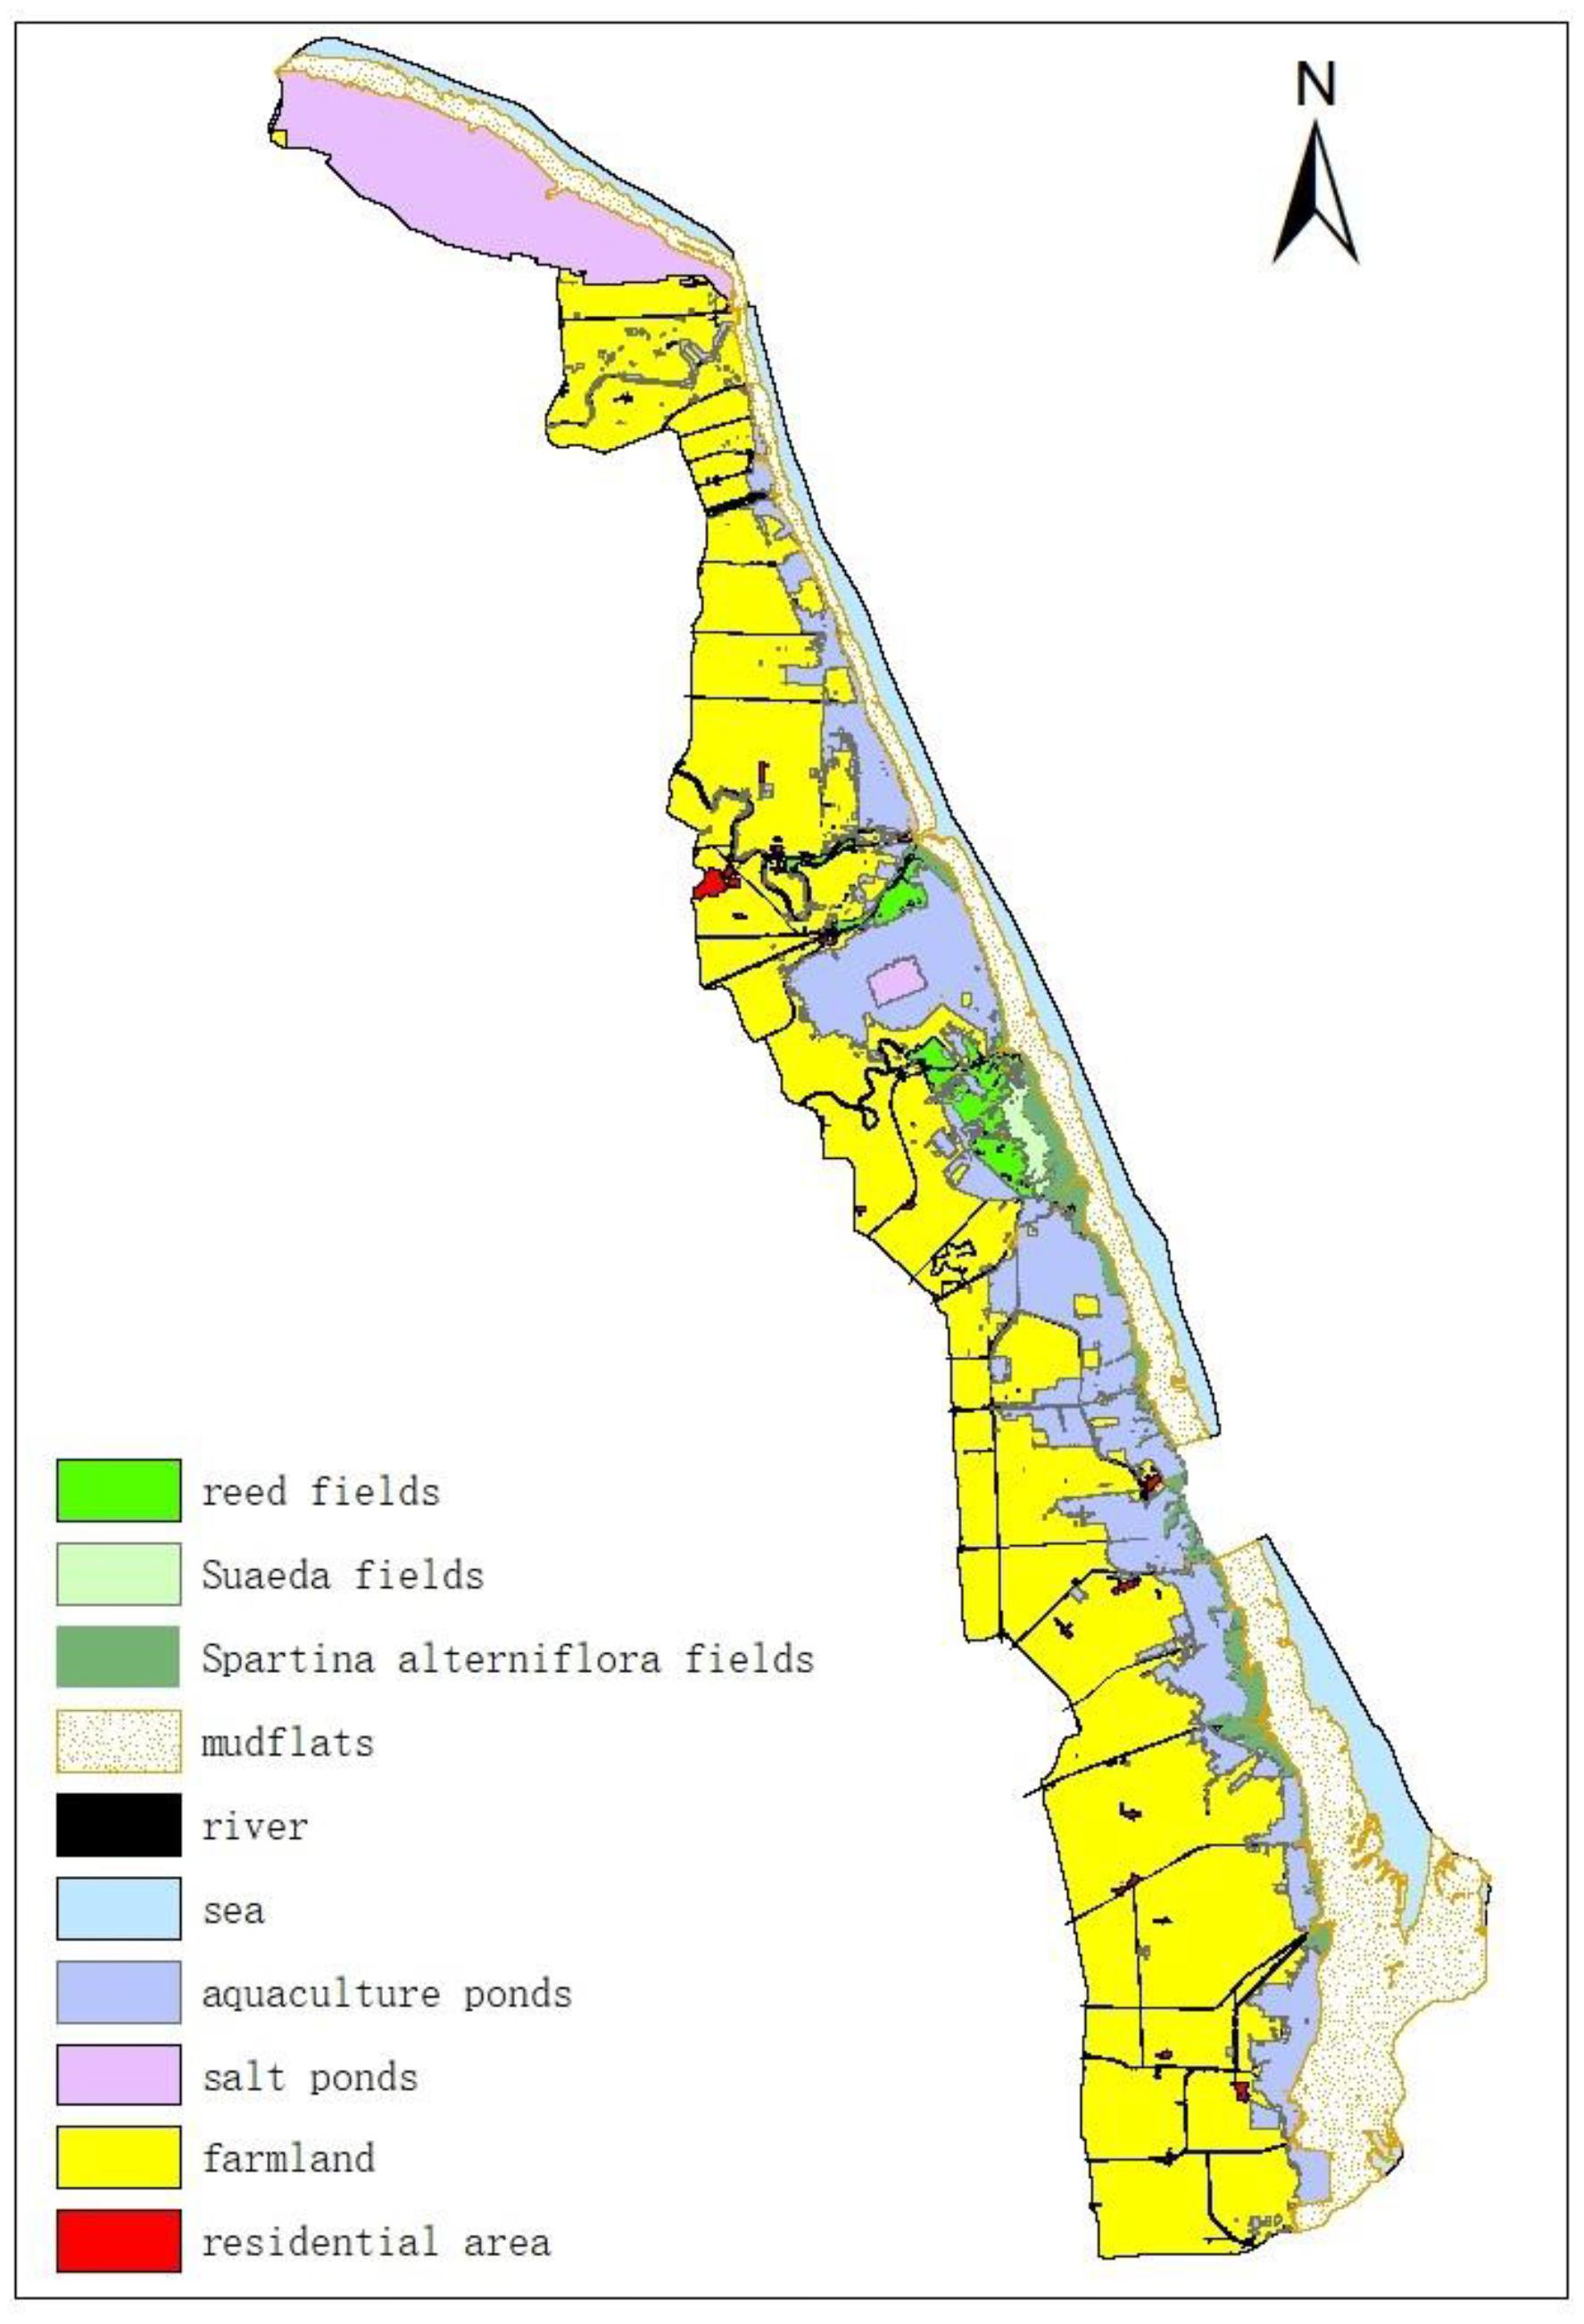
Figure 5. Landscape map of Yancheng coast in 2008.
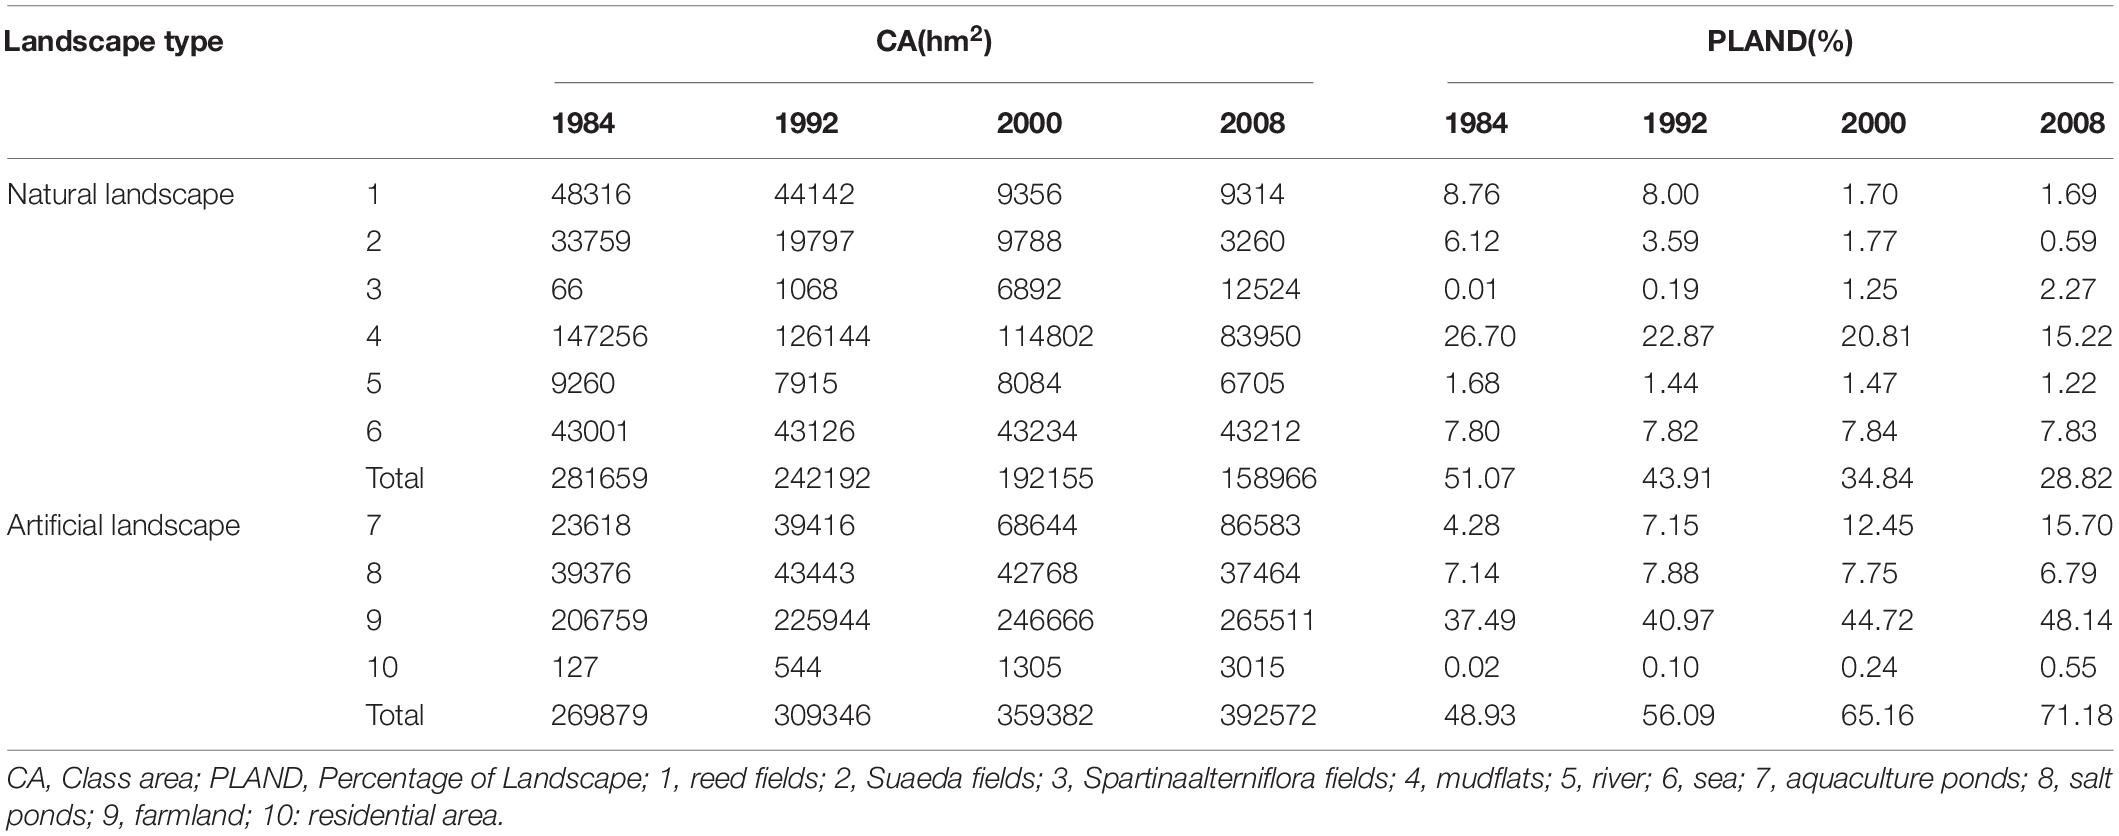
Table 1. Area statistic of landscape types in Yancheng coast.
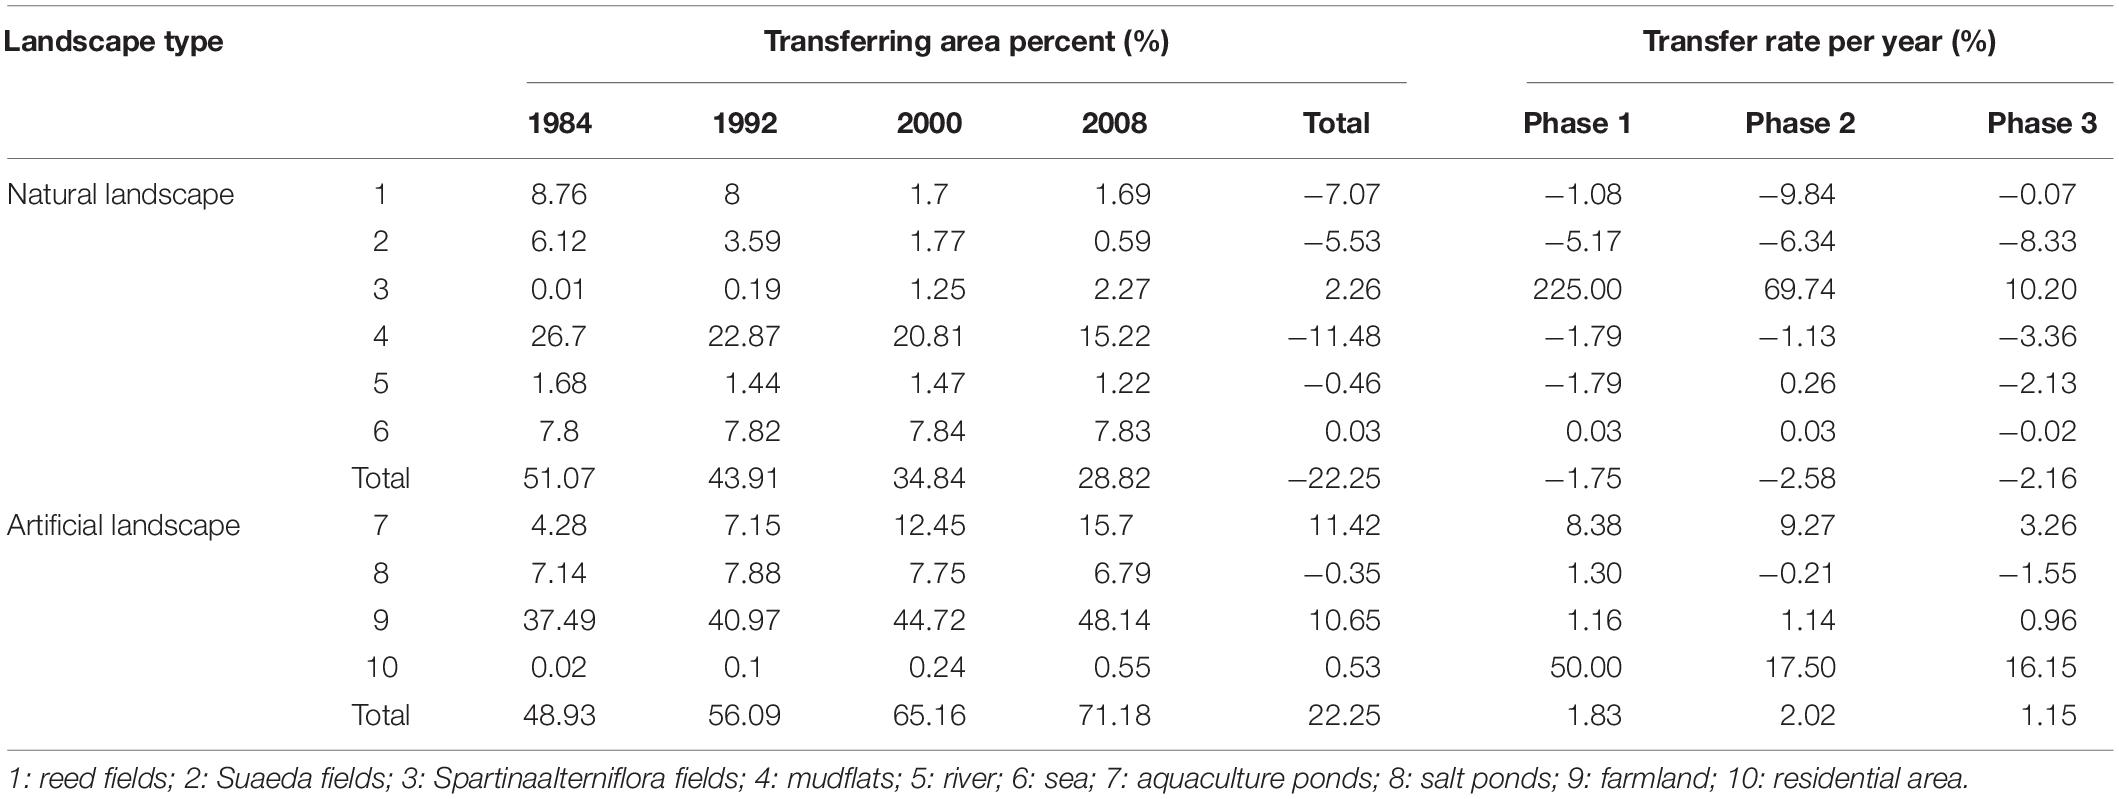
Table 2. Dynamic transfer rate of land-use in Yancheng coast.
The natural landscape area continued to decline with 281,700 hm2, 242,200 hm2, 192,200 hm2, and 159,000 hm2 in 1984, 1992, 2000, and 2008, respectively. Throughout the three phases, the area of natural landscape was reduced by 39,500 hm2, 50,000 hm2, and 33,200 hm2, and declined by 122,700 hm2 in total. The proportion of the natural landscape in the study area was reduced from 51.07% to 28.82%. The rest of the natural landscape showed a downward trend, except for the area of Spartinaalterniflora fields, which showed an increase of 189 times because it is an alien invasive species (Table 1). Mudflats had the maximum amount of reduced area, with a decrease of more than 60,000 hm2, and a decline of 42.99%. The area of reed fields declined drastically, especially in the phase of 1992–2008. The extent of reed fields dropped from third (8.76%) to seventh place (1.69%), and the area shrunk to 1/5 of the original area, with a decline of 80.72%. The total decrease accounted for 28.40% of the total negative flow area. The area of Suaeda fields dropped from seventh place (6.12%) to ninth place (0.59%), the largest extent of the decline. The Suaeda field area shrunk to less than 1/10 of its original extent, with a decline of 90.34%.
The proportion of artificial landscape areas has continued to rise. The extent of the artificial landscape displayed a significant growth trend, except for the salt ponds, which showed a slight decrease. The area of the aquaculture ponds was promoted from eighth (4.28%) to second place (15.7%), with the maximum amount of area growth (62,965 hm2). The total growth accounted for 11.42% of the study area. Farmland always constitutes the largest landscape type in this region. The total growth in farmland accounted for 10.65% of the entire study area. From 1984 to 2008, the farmland area grew by 58,753 hm2, an increase of 28.42%. The residential area expanded from 126.72 hm2 (1984) to 3,014.55 hm2 (2008), an increase of 22.79 times.
The Relationship of Spatial-Temporal Variation of Landscape
By analyzing the transfer matrix of the Yancheng coast landscape in 1984 and 2008, we found the spatial-temporal variation in landscape types. Reed fields were converted to farmland (31,322 hm2) and aquaculture ponds (13,233 hm2). Suaeda fields were converted to aquaculture ponds (16,665 hm2), farmland (10,146 hm2), and Spartinaalterniflora fields (5,216 hm2). Mudflats were generally converted to aquaculture ponds (37,857 hm2) and Spartinaalterniflora fields (12,166 hm2) and then converted into farmland (5,779 hm2) and salt ponds (3,881 hm2). Rivers were primarily converted into farmland (2,193 hm2). There was little change in the extent of seawater. Aquaculture ponds and farmland were converted into each other, but conversion to farmland dominated (11,315 hm2). Salt ponds were mainly converted to aquaculture ponds (6,223 hm2). The growth of residential areas was primarily caused by changes in the agricultural landscape, with a net transfer area of 2200 hm2.
Considering the changes in landscape patterns in the study area, the transition rates of the landscape were 17.46% (1984–1992), 16.57% (1992–2000), and 15.03% (2000–2008), respectively. The results showed that the change in the overall landscape patterns was large, but the rate of change was stable, with the highest rate of change in the first phase.
According to a comprehensive analysis of the characteristics of the transfer matrix of landscape areas in the three different phases (1984–1992, 1992–2000, 2000–2008), the changes in main landscape of the Yancheng coast showed a fixed route, from natural landscapes to artificial landscapes (Figure 6). First, mudflats were converted to Spartinaalterniflora fields, salt ponds, Suaeda fields, reed fields, and aquaculture ponds. Second, Spartinaalterniflora fields and salt ponds were converted into aquaculture ponds. Third, Suaeda fields were converted into aquaculture ponds and reed fields. Fourth, reed fields were converted into aquaculture ponds and farmland. Fifth, aquaculture ponds and rivers are converted to farmland. Sixth, farmland was converted to residential areas.
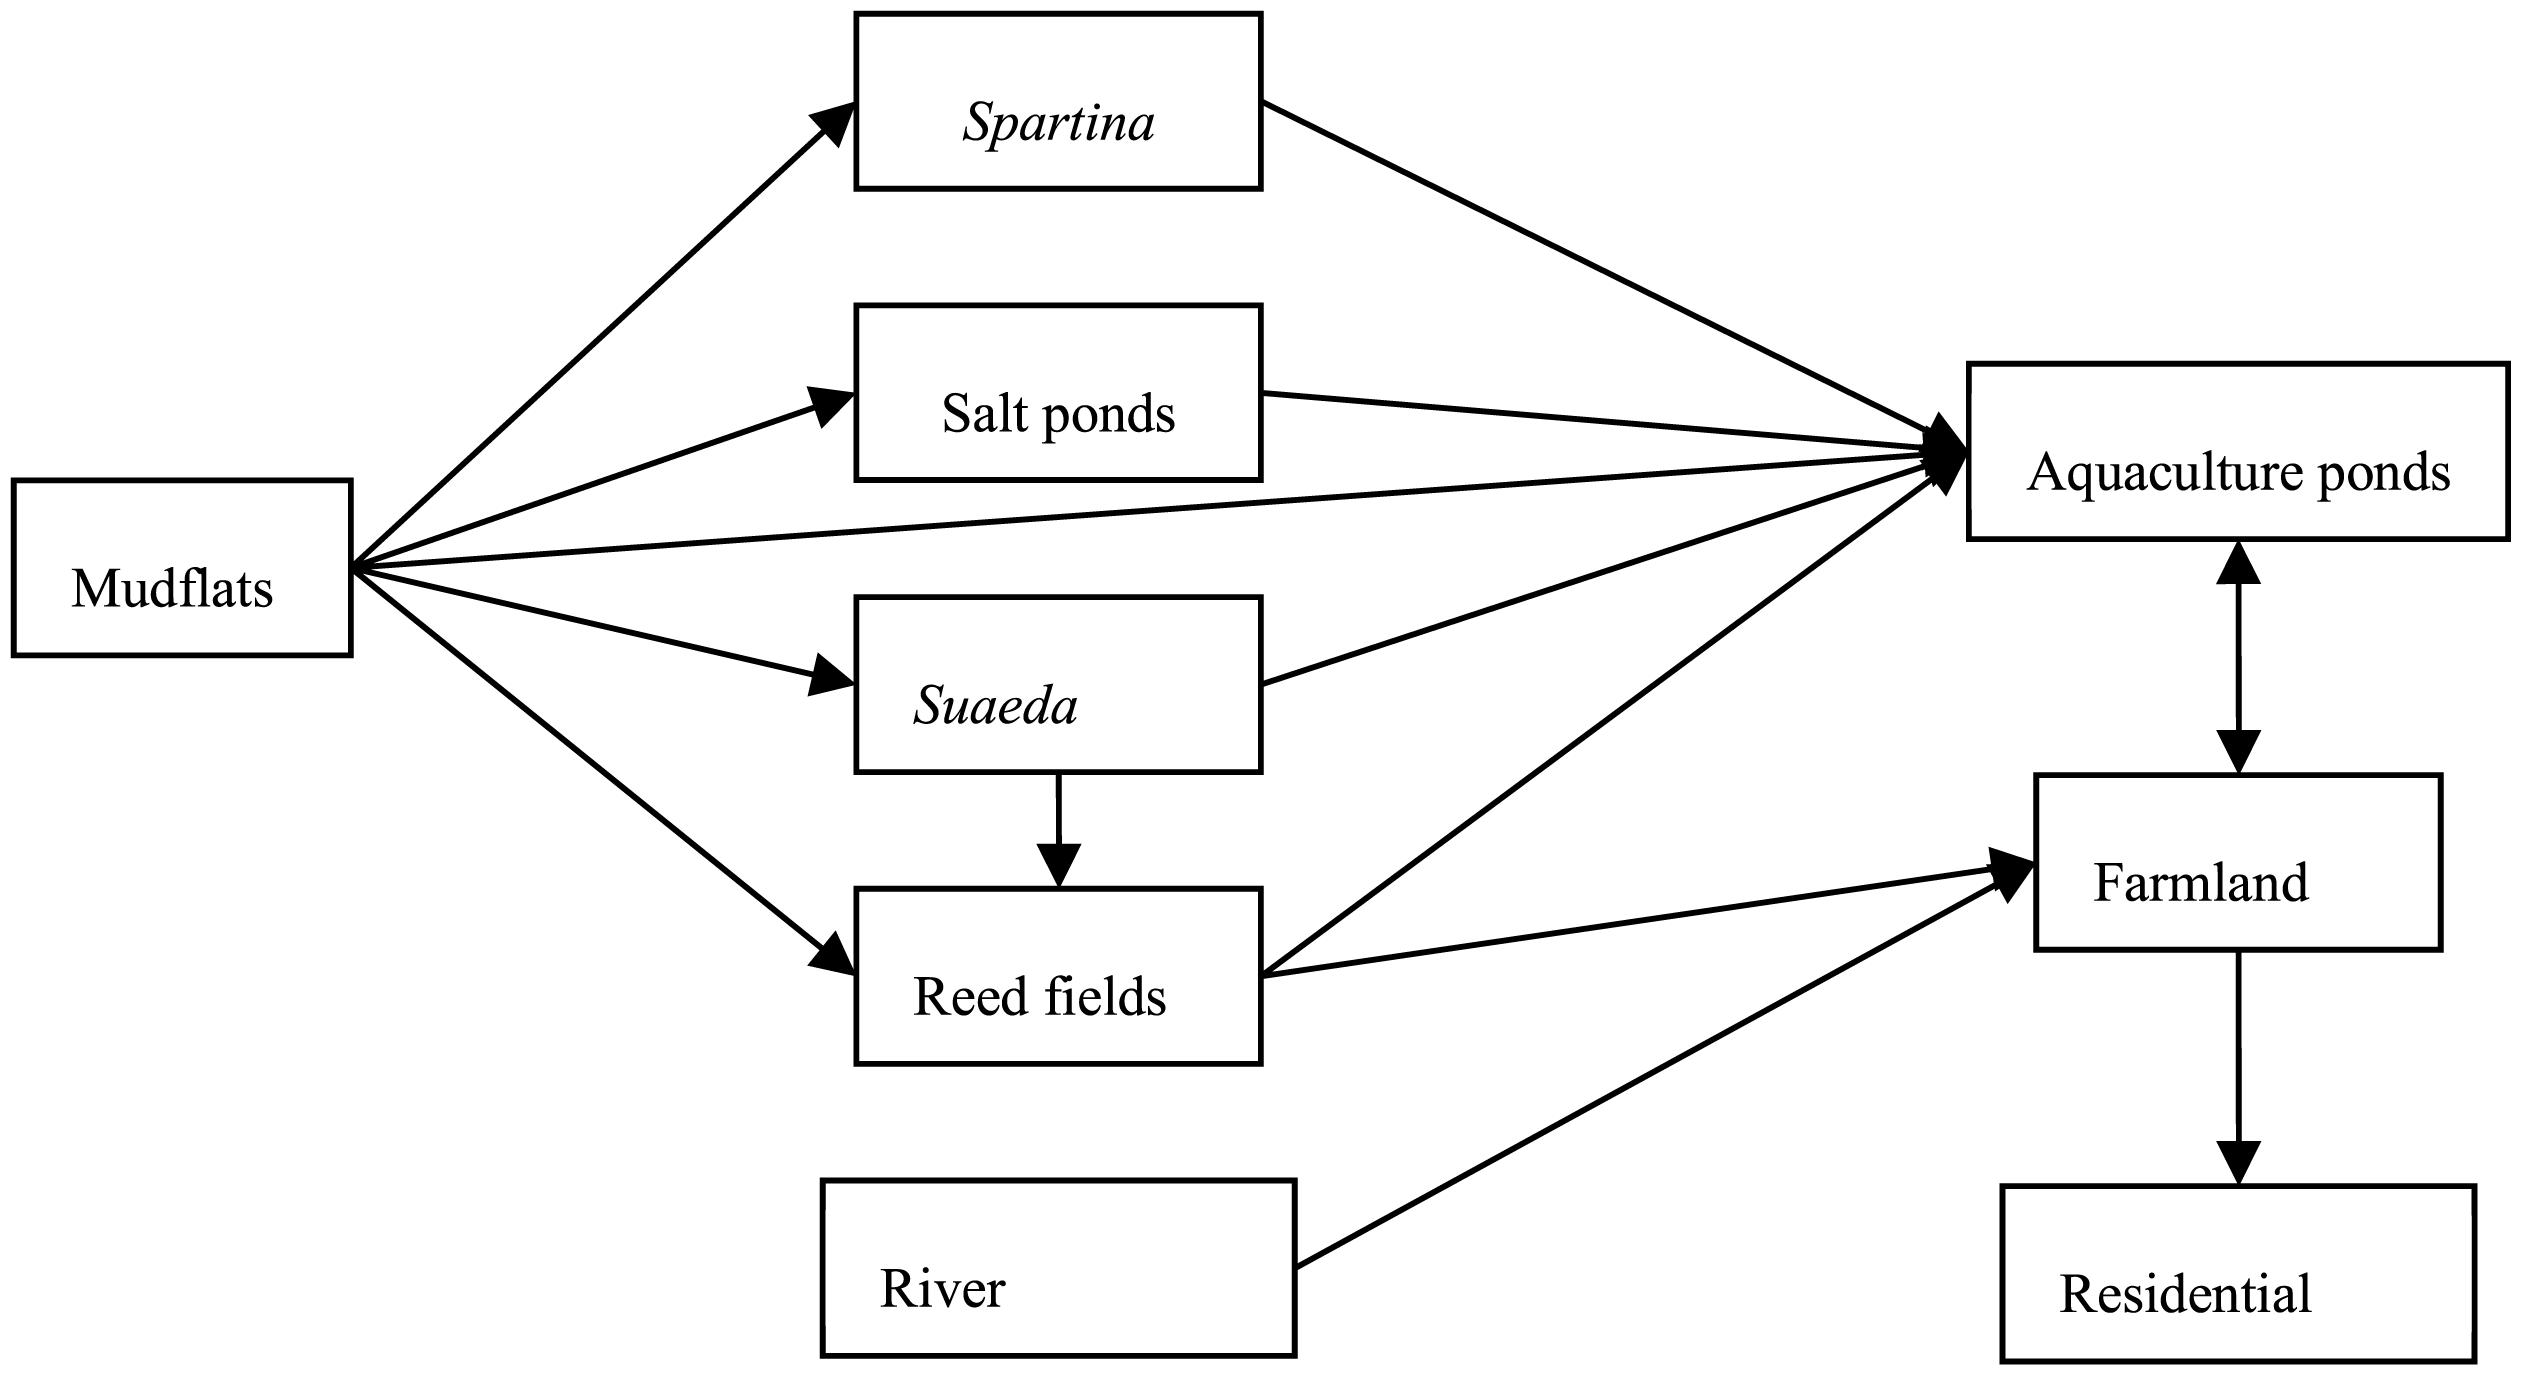
Figure 6. Succession of main landscapes in Yancheng coast.
Investigation found that salinity is the decisive factor of the fixed route for landscape successions of coast. In the early stage of reclamation, a large number of soil salinization was caused by water evaporation, and the soil with higher salinity could only be used for Mariculture or salt field development. Due to rain shower deposition and the introduction of fresh water by irrigation, the salinity of the tidal-flat area was reduced. Land can be used for large-scale farmland cultivation and freshwater aquaculture.
Landscape Temporal Change Analysis Process
During 1984–2008, the reed fields and Suaeda field landscape retention rate was always low. During 1992–2000, there were more reed field changes, and its landscape retention rate was 18.20%. In contrast to other natural landscapes, Spartinaalterniflora spread quickly into the mudflats. On the other hand, reclamation, expansion of ponds, and other human activities occupy part of the Spartinaalterniflora fields. Its retention rate in the landscape was higher in the first phase but lower in the second and third phases. Compared with natural landscapes, the retention rate of artificial landscapes is higher and has good stability. The retention rate of the aquaculture pond landscape was over 50% in three phases, and the retention rate of the landscape of farmland, salt ponds, and residential area was over 85% (Figure 7).
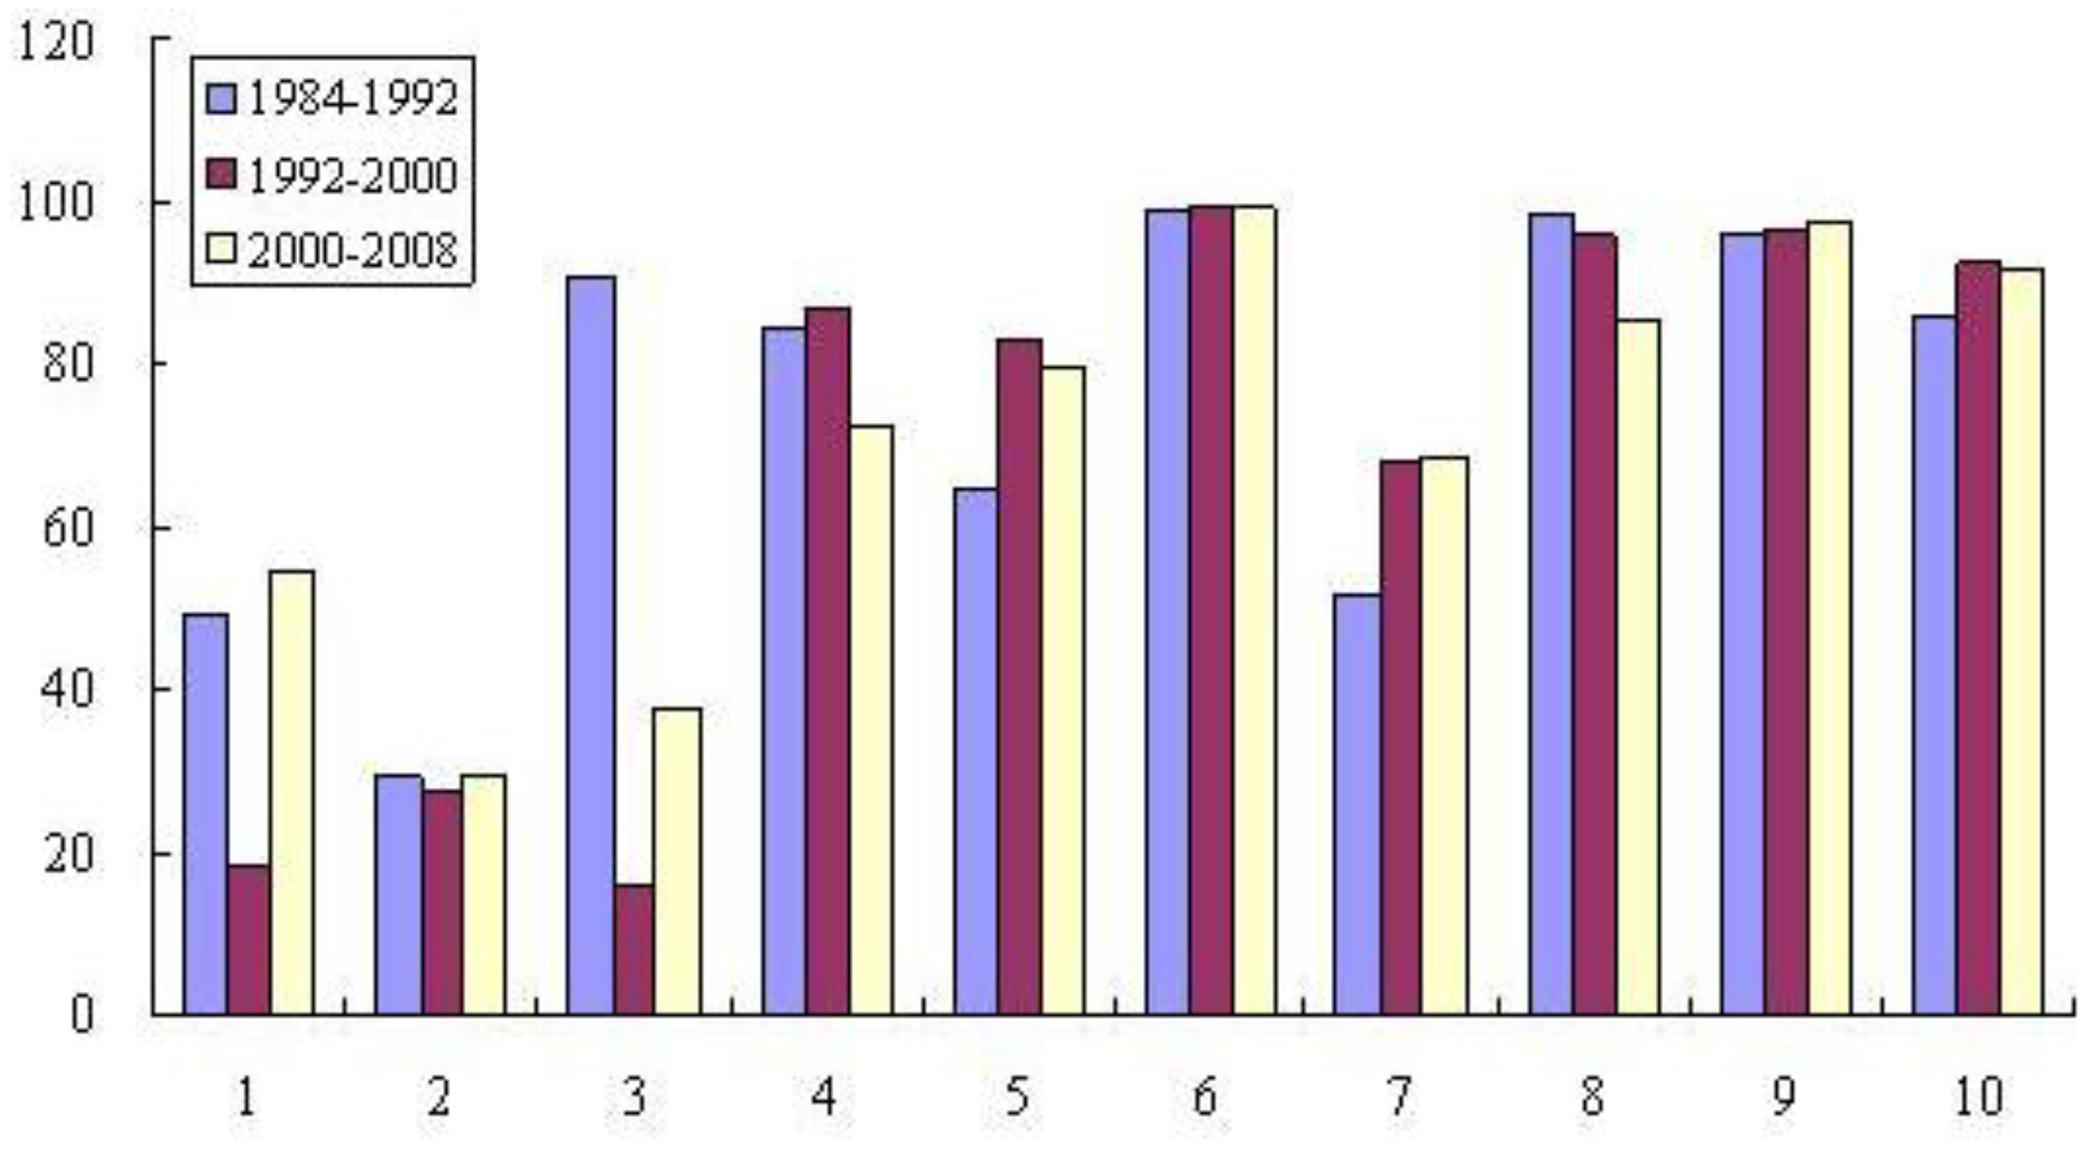
Figure 7. Retention rate of main landscapes on Yancheng coast.
Table 3 shows the changes in the advantage transfer type of the Yancheng coast in three phases. In the first phase, where the cumulative contribution rate of the transfer process of natural landscape reclamation was 31.03%, reed fields were mainly converted to farmland, Suaeda fields changed to reed fields, and Suaeda fields and reed fields changed to aquaculture ponds. In the second phase, in which the cumulative contribution rate of the transfer process of natural landscape reclamation was 53.48%, there were three dominant transferring processes: reed fields were converted to aquaculture ponds and farmland, Suaeda fields changed to aquaculture ponds, and aquaculture ponds changed to farmland. In the third phase, where the cumulative contribution rate of the transfer process of natural landscape reclamation was 32.48%, the major transfer process was mudflats converted to aquaculture ponds, aquaculture ponds to farmland, and mudflats to Spartinaalterniflora fields. It is evident that the human reclamation effects on the natural landscapes are significant in all three phases. In particular, the interference influence of natural landscape reclamation was the greatest in the second phase.
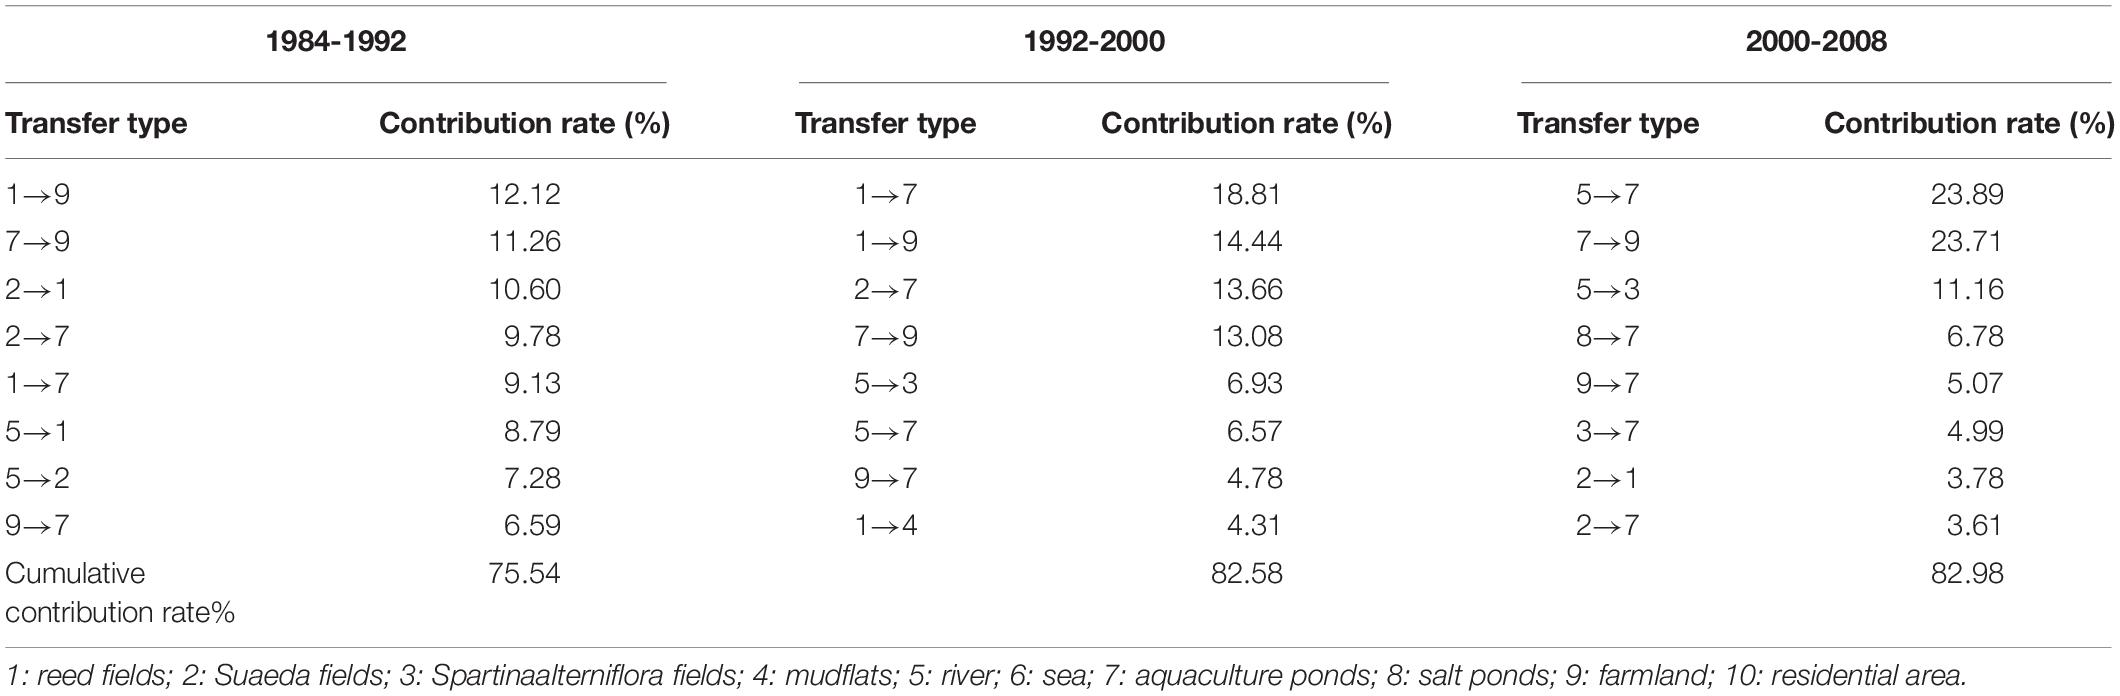
Table 3. The dominant transfer process and its contribution rate.
The overall landscape change rates are 17.46%, 16.57%, and 15.03% in 1984–1992, 1992–2000, and 2000–2008, respectively. These percentages indicated that while the landscape pattern changes were relatively great, the rate of change steadily decreased, with the highest rate in the first phase.
This finding indicates that, Yancheng wetland nature reserve was established in 1984 and designated a National Nature Reserve in 1992, but anthropogenic activities on the Yancheng coast continue apace, and the trend of natural landscape loss did not change. Although the regulations on nature reserves stipulates that nature reserves are strictly protected and prohibits reclamation, it has not been seriously implemented.
The Driving Mechanism of Landscape Succession
Driven by endogenous and exogenous factors in different spatial and temporal scales, the landscape is always in a state of dynamic change (Cheng et al., 2019). Recent research has focused on the reasons behind the landscape changes and the “driving forces” have been developed into a fundamental concept (Plieninger et al., 2016). It can be divided into specific natural driving forces and anthropogenic driving forces (Pearsell and Mulamoottil, 1994; Day et al., 2000; Fu et al., 2006).
The natural driving forces mainly include dynamic marine conditions, sediment supply, and Spartina proliferation, which drive landscape succession as natural factors. Between 1984 and 2008, the natural driving force was reflected in the mudflats converting to Suaeda fields (first phase), mudflats to Spartinaalterniflora fields (the second and third phases), Suaeda fields to reed fields (first and third phases), and mudflats to reed fields (first phase). This finding suggests that Suaeda occupied part of the mudflats during 1984–1992. However, being an invasive plant, Spartina replaced Suaeda after 1992, when it expanded rapidly along the Yancheng coast. It inhibited the growth of Suaeda, and the conversion rate from mudflats to Spartinaalterniflora fields continues to increase after 1992, when it expanded rapidly along the Yancheng coast (Shen et al., 2002). Due to the expansion of Spartinaalterniflora, the injection of seawater was blocked and coupled with the introduction of fresh water by irrigation, the salinity of the tidal-flat area was reduced, and has created a large expanse of reed fields, which are adapted to low-salinity wetland conditions.
The anthropogenic driving forces mainly include resource development, public policies, construction of large projects, increasing population pressure, natural landscape reclamation, and the internal transfer of artificial landscapes. It is reflected mainly in the reed fields converted to farmland (first and second phases), Suaeda fields to aquaculture ponds (first, second, and third phases), the reed fields to aquaculture ponds (first and second phases), aquaculture ponds to farmland (the second and third phases), and mudflats to aquaculture ponds (the second and third phases).
To make a quantitative evaluation of the impact of natural and anthropogenic driving forces according to the landscape classification in this study, the landscape configuration change can be divided into four different circumstances. These four categories include the internal transformation of natural landscapes, natural landscapes converted to artificial landscapes, artificial landscapes to natural landscapes, and internal transformation of artificial landscapes.
The natural landscape changed the most: 78.24%, 76.24%, and 59.19% of the total transfer area in the three phases, respectively, which consists of the internal transformation of natural landscapes and natural landscapes converted to artificial landscapes. There was a large-scale transformation from natural landscape to artificial landscape, accounting for 43.94%, 57.57%, and 42.23% of the transfer area in the three phases (Table 4). In the artificial landscape, a large area of aquaculture ponds was converted to farmland, and salt ponds into aquaculture ponds. Only a minimal area of artificial landscapes converted to natural landscape. The main reason for this latter conversion was sea erosion, which caused some salt ponds and aquaculture ponds to be destroyed.
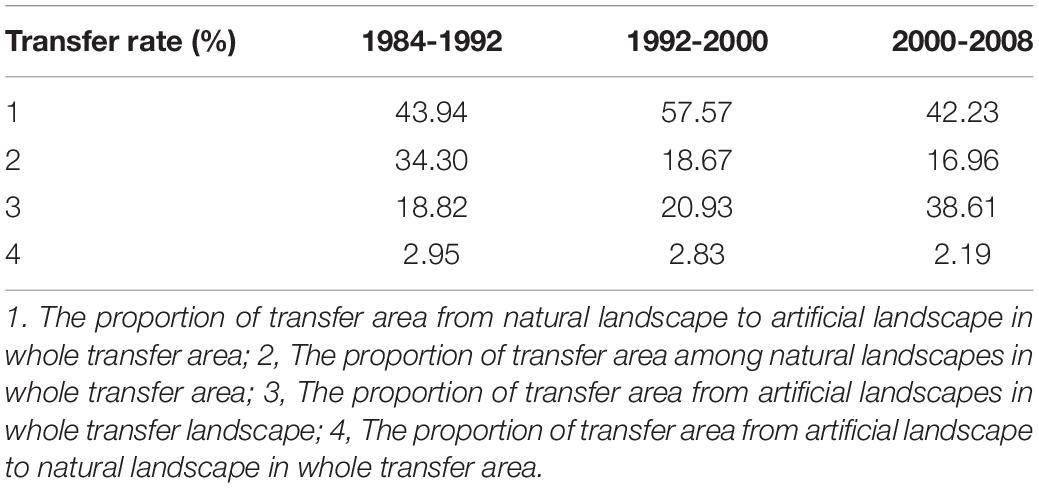
Table 4. The transition rate of landscape in study region.
An analysis of the forces driving the entire landscape change in the study area showed that both the internal transformation of natural landscape and artificial landscape transformed to natural landscape could be classified as the effect of natural driving forces. Natural landscapes are converted to artificial landscapes, and the internal transformation of artificial landscapes can be classified as the result of anthropogenic driving forces. Therefore, the transferred area resulting from anthropogenic driving forces was 62.76%, 78.50%, 80.84% of the total transfer area in three phases, respectively (Table 4). In summary, the changes in the Yancheng coastal landscape pattern were driven primarily by human forces. The impact of anthropogenic driving forces was significantly greater than natural driving forces, and it gradually increased during 1984–2008.
Conclusion
Coastal Landscape Pattern
We analyzed the evolution trends and driving forces in the three phases of the Yancheng coast transformation during 1984–2008. The major landscape has been farmland from 1984 to 2008, not wetland. The Yancheng coastal landscape pattern has changed significantly. The landscape matrix has changed from a situation in which the natural landscape was equal to the artificial landscape in 1984, and the latter was dominant during 1990–2008. The proportion of natural landscape in the study area is declining, while the proportion of artificial landscape is increasing, and the area of natural landscape has been substantially reduced. The area of artificial landscape has increased significantly, comprising farmland and aquaculture ponds. The total area of the natural landscape gradually decreased from 281,700 hm2 in 1984 to 159,000 hm2 in 2008, and the proportion of natural landscape in the study area decreased from 51.07% to 28.82%. To obtain more profit, a large amount of unused land, such as mudflats and Suaeda fields, has been developed.
Although there is a national nature reserve in Yancheng coast, anthropogenic activities on the reserve continue apace, and the trend of natural landscape loss did not change during 1984–2008. Disorderly reclamation for economic development is the main reason for the loss of natural habitat in the coast, and the lack of supervision and law enforcement encouraged it.
Landscape Succession
The changes in these landscapes of Yancheng coast showed a fixed succession route, from natural landscapes to artificial landscapes. The succession is closely related to the physical and chemical properties of the soil and water in the region. Salinity is the decisive factor of the fixed route for landscape successions of the coast. Mudflats converted to salt ponds and aquaculture ponds (seawater) are based on seawater use on land. Spartinaalterniflora fields and salt ponds converted to aquaculture ponds (freshwater), and Suaeda fields transformed into aquaculture ponds and reed fields reflect land-use changes after the highly saline soils have been flushed with fresh water, causing soil and water salinity to be reduced. The changes from reed fields to aquaculture ponds (freshwater) and farmland, from aquaculture ponds and rivers to farmland, further indicate that newly developed land has been used for higher value-added industries after soil improvement.
Driving Force
Anthropogenic activity is the primary reason for the reduction of the natural element in the Yancheng coastal landscape. Many natural landscapes were transferred to artificial landscapes between 1984 and 2008. The impact of the anthropogenic driving forces is significantly greater than that of the natural driving force. In future, we need to make full use of high-resolution remote sensing data to identify landscape changes, combined with the field survey to refined the driving force of landscape change, so as to better understand its landscape succession.
In the light of these results, we make the following conservation recommendations. On the one hand, we suggest strengthening the protection of existing natural landscapes. First, enhance law enforcement. The existing natural landscape should be effectively protected by law. Second, all construction projects should be subject to the most rigorous environmental impact assessments prior to inception. Third, we emphasize the importance of protecting and rebuilding the natural habitats of the red-crowned cranes and other birds. Fourth, engineering measures for Spartinaalterniflora control should be taken.
On the other hand, we suggest strengthening the management of artificial landscapes. We recommend that the government used the policies of subsidies, leases, land purchase, which encourage community residents to change wheat fields to reed ponds or aquaculture ponds, and prohibit the use of chemical fertilizers, pesticides, insecticides, herbicides, and other toxic substances. Second, aquaculture ponds should be planted with more emergent plants. Third, reed harvesting should be completed before the red-crowned cranes and other migratory birds arrive, and part of the reed fields should be retained. Fourth, farmland should be kept unplowed (Lee et al., 2007) or kept unplowed until the red-crowned cranes leave in early March. Fifth, we should strictly limit the expansion of human activities (Wang et al., 2011), especially residential areas and industrial sites, and punish the surrounding businesses that have contaminated the Yancheng wetland nature reserve and its wildlife to discourage them from doing further damage.
Data Availability Statement
The original contributions presented in the study are included in the article/supplementary material, further inquiries can be directed to the corresponding author.
Author Contributions
ZW and JZ designed the study and methodology. WX, JZ, and XX extracted and compiled the data. JZ analyzed the data with the help of HY and YL. ZW wrote the manuscript with substantial input from WX, JZ, XX, and HY. All authors contributed to the article and approved the submitted version.
Funding
We received financial support from the Chinese Key Technology R&D Program (No. SQ2020YFF0426320), the Research Program for Public Welfare Scientific Projects of Environmental Protection (No. 201509042), the National Social Science Fund of China (No. 20BFX176), and the Research Program of Ministry of Ecology and Environment of China (No. HBSY0915) in the design of study, fieldwork, sample collection, and data analysis.
Conflict of Interest
The authors declare that the research was conducted in the absence of any commercial or financial relationships that could be construed as a potential conflict of interest.
Acknowledgments
We thank Zhigang Jiang and Mingkang Jiang, for their kind suggestions about this study. We also thank Changwei Zhuang, Zhongqiu Li, Hui Wang for helpful discussions. We also thank the reviewers for their invaluable comments on our manuscript.
References
Baus, P., Kovac, U., Pauditsova, E., and Kohutková, I. (2014). Identification of interconnections between landscape pattern and urban dynamics—case study Bratislava, Slovakia. Ecol. Indic. 42, 104–111. doi: 10.1016/j.ecolind.2013.12.011
Chen, W. G., Wang, D. C., Huang, Y., Chen, L. D., Zhang, L. H., Wei, X. W., et al. (2017). Monitoring and analysis of coastal reclamation from 1995-2015 in Tianjin Binhai New Area, China. Sci. Rep. 7:3850. doi: 10.1038/s41598-017-04155-0
Cheng, M., Huang, B., Kong, L., and Ouyang, Z. (2019). Ecosystem spatial changes and driving forces in the bohai coastal zone. Int. J. Environ. Res. Public Health 16, 39–49.
Currin, C. A., Davis, J., Baron, L. C., Malhotra, A., and Fonseca, M. (2015). Shoreline change in the New River Estuary, North Carolina: rates and consequences. J. Coastal. Res. 31, 1069–1077. doi: 10.2112/JCOASTRES-D-14-00127.1
Day, J. W., Britsch, L. D., Hawes, S. R., Shaffer, G. P., Reed, D. J., and Cahoon, D. (2000). Pattern and process of land loss in the Mississippi Delta: a Spatial and temporal analysis of wetland habitat change. Estuaries 23, 425–438. doi: 10.2307/1353136
Ding, J. J., Wang, L., Ji, Y. H., Ding, Y. H., and Li, R. J. (2009). Landscape Pattern Change of Yancheng coastal Wetland in Jiangsu. Wetland Sci. 7, 202–207. doi: 10.13248/j.cnki.wetlandsci.2009.03.005
Falcucci, A., Maiorano, L., and Boitani, L. (2007). Changes in land-use/land-cover patterns in Italy and their implications for biodiversity conservation. Landscape Ecol. 22, 617–631. doi: 10.1007/s10980-006-9056-4
Farmer, A. H., and Parent, A. H. (1997). Effects of the landscape on shorebird movements at spring migration stopovers. Condor 99, 698–707. doi: 10.2307/1370481
Fu, B. J., Zhao, W. W., and Chen, L. D. (2006). Progress and perspective of geographical-ecological processes. Acta Geogr. Sin. 61, 1123–1131. doi: 10.3321/j.issn:0375-5444.2006.11.001
Garza, C. (2008). Relating spatial scale to patterns of polychaete species diversity in coastal estuaries of the western United States. Landscape Ecol. 23, 107–121.
Hao, J. F., Liu, H. Y., Li, Y. F., Hu, H. B., and An, J. (2010). Spatio-temporal variation and driving forces of the coastal wetland resources based on the transition matrix in Jiangsu province. J. Nat. Resour. 25, 1918–1929.
Hu, Y. M., Shu, Y., Li, X. Z., Wang, L., Li, Y. X., and Yang, Y. C. (2004). Change of red–crowned crane breeding habitat and the analysis of breeding capacity in Shuangtai-hekou National Nature Reserve. Chin. J. Ecol. 23, 7–12. doi: 10.13292/j.1000-4890.2004.0145
Hu, Y. M., and Xiao, D. N. (1999). Behavioral fragmentation of waterfowl habitat and its landscape ecological design in Shuangtai-hekou Reserve, Liaoning, China. J. Environ. Sci. 11, 231–235.
Kong, D. X., Miao, C. Y., Borthwick, A. G. L., and Duan, Q. Y. (2015). Evolution of the Yellow River Delta and its relationship with runoff and sediment load from 1983 to 2011. J. Hydrol. 520, 157–167. doi: 10.1016/j.jhydrol.2014.09.038
Lee, S. D., Jablonski, P. G., and Higuchi, H. (2007). Winter foraging of threatened cranes in the Demilitarized Zone of Korea: behavioral evidence for the conservation importance of unplowed rice fields. Biol. Conserv. 138, 286–289.
Lee, S. Y., Dunn, R. J. K., Young, R. A., Connolly, R. M., Dale, P. E. R., Dehayr, R., et al. (2006). Impact of urbanization on coastal wetland structure and function. Austral Ecol. 31, 149–163. doi: 10.1111/j.1442-9993.2006.01581.x
Lei, K., and Zhang, M. X. (2005). The wetland resources in China and the conservation advices. Wetland Sci. 3, 81–86. doi: 10.13248/j.cnki.wetlandsci.2005.02.001
Li, J. L., Zhao, H. B., Cao, Y. G., and Liu, C. (2006). Analysis on change of landscape pattern of wetland in Liaohe delta. Urban Environ. Urban Ecol 19, 5–7.
Li, X. W., Xiao, D. N., and Hu, Y. M. (2002). The analysis and evaluation of landuse scenarios in the Liaohe River Delta wetlands. Acta Ecol. Sin. 22, 224–232. doi: 10.3321/j.issn:1000-0933.2002.02.012
Liu, C. Y., Zhang, S. Q., Jiang, H. X., Wang, H., and Sun, Y. (2009). Spatio-temporal dynamics of coastal wetland landscape patterns in Yancheng, Jiangsu province. Remote Sens. Land Resour. 21, 78–83. doi: 10.6046/gtzyyg.2009.03.16
Liu, J., Linderman, M., Ouyang, Z., An, L., Yang, J., and Zhang, H. (2001). Ecological Degradation in Protected Areas: the Case of Wolong Nature Reserve for Giant Pandas. Science 292, 98–101.
Millennium Ecosystem Assessment [MEA]. (2005). Ecosystems and human well-being: Wetlands and water synthesis. Washington, DC: World Resources Institute.
Noble, R. T., Weisberg, S. B., Leecaster, M. K., Mcgee, C. D., Dorsey, J., Vainik, P., et al. (2003). Storm effects on regional beach water quality along the southern California shoreline. J. Water Health 1, 23–31. doi: 10.2166/wh.2003.0004
Noss, R. F. (1996). “Protected areas: how much is enough?,” in National Parks and Protected Areas: Their Role in Environmental Protection, ed. R. G. Wright (Cambridge, MA: Blackwell Science), 91–120.
Ou, X. W., and Yang, G. S. (2003). Progress in the study on coastal environment evolvement consequence of land use/cover change. Prog. Geogr. 22, 360–368. doi: 10.3969/j.issn.1007-6301.2003.04.004
Pearsell, G., and Mulamoottil, G. (1994). Wetland boundary and land-use planning in southern Ontario, Canada. Environ. Manage. 18, 865–870. doi: 10.1007/BF02393616
Plieninger, T., Draux, H., Fagerholm, N., Fagerholm, N., Bieling, C., Bürgi, M., et al. (2016). The driving forces of landscape change in Europe: a systematic review of the evidence. Land Use Policy 57, 204–214.
Rosenberger, E. E., Hampton, S. E., Fradkin, S. C., and Kennedy, B. P. (2008). Effects of shoreline development on the nearshore environment in large deep oligotrophic lakes. Freshw. Biol. 53, 1673–1691. doi: 10.1111/j.1365-2427.2008.01990.x
Schwemmer, P., Garthe, S., and Mundry, R. (2008). Area utilization of gulls in a coastal farmland landscape: habitat mosaic supports niche segregation of opportunistic species. Landscape Ecol. 23, 355–367. doi: 10.1007/s10980-008-9194-y
Shen, Y. M., Liu, Y. M., and Chen, Q. Z. (2002). Analysis of the expanding process of the Spartina alterniflora loisel salt marsh on Jiangsu province coast by remote sensing. J. Plant Resour. Environ. 11, 33–38. doi: 10.3969/j.issn.1674-7895.2002.02.008
Skilodimou, H. D., Bathrellos, G. D., Koskeridou, E., Soukis, K., and Rozos, D. (2018). Physical and anthropogenic factors related to landslide activity in the Northern Peloponnese, Greece. Land 7, 437–440. doi: 10.3390/land7030085
Wang, L., Xing, W., Ji, Y. H., and Li, R. J. (2007). Progress in the research of coastal wetland in Jiangsu province-A review. J. Jiangsu Forest Sci. Technol. 34, 52–54.
Wang, X. L., and Bao, Y. H. (1999). Study on the methods of land use dynamic change research. Prog. Geogr. 18, 81–87. doi: 10.3969/j.issn.1007-6301.1999.01.012
Wang, X. L., Bu, R. C., Hu, Y. M., and Xiao, D. N. (1996). Analysis on landscape fragment of Liaohe Delta wetlands. Chin. J. Appl. Ecol. 7, 299–304. doi: 10.13287/j.1001-9332.1996.0060
Wang, X. L., Xiao, D. N., Bu, R. C., and Hu, Y. M. (1997). Analysis on landscape patterns of Liaohe Delta wetland. Acta Ecol. Sin. 17, 317–323.
Wang, X. Q., and Li, L. (2006). The degradation and protective countermeasures of the wetland in the Liaohe River Delta. Ecol. Environ. 15, 650–653. doi: 10.16258/j.cnki.1674-5906.2006.03.042
Wang, Z., Li, Z. Q., Guy, B., and Jiang, Z. G. (2011). Flock size and human disturbance affect vigilance of endangered red-crowned cranes (Grus japonensis). Biol. Conserv. 144, 101–105. doi: 10.1016/j.biocon.2010.06.025
Xiao, D. N., Li, X. W., and Wang, L. P. (2001). Landscape dynamics and sustainable land use of coastal wetlands resources in Liaohe Delta. Resour. Sci. 23, 31–36. doi: 10.3321/j.issn:1007-7588.2001.02.007
Yan, X., Yan, X., Zhong, J., Han, Z., and Liu, M. (2019). Driving Forces Analysis and Landscape Succession Features of Coastal Wetland Both Outside and Inside Reclamation Areas in the Northern Liaodong Bay, China in Recent 40 Years. Sci. Geogr. Sin. 39, 1155–1165. doi: 10.13249/j.cnki.sgs.2019.07.014
Zeng, H., Gao, L. Y., and Xia, J. (2003). Dynamic analysis of urban landscape using a modified conversion matrix method: a case study in Nanchang city. Acta Ecol. Sin. 23, 2201–2209. doi: 10.3321/j.issn:1000-0933.2003.11.001
Keywords: landscape pattern, driving force, natural landscape, artificial landscape, Yancheng coast, landscape succession, nature reserve
Citation: Wang Z, Xu W, Xia X, Yu H, Lv Y and Zhang J (2021) Novel Quantitative Method for Assessing Driving Forces of Landscape Succession: Case Study From Yancheng Coast, China. Front. Ecol. Evol. 9:632331. doi: 10.3389/fevo.2021.632331
Received: 23 November 2020; Accepted: 06 May 2021;
Published: 07 July 2021.
Edited by:
Yi Zou, Xi’an Jiaotong-Liverpool University, ChinaReviewed by:
Xu Pan, Institute of Wetland Research, ChinaYang Gao, Xi’an University of Technology, China
Copyright © 2021 Wang, Xu, Xia, Yu, Lv and Zhang. This is an open-access article distributed under the terms of the Creative Commons Attribution License (CC BY). The use, distribution or reproduction in other forums is permitted, provided the original author(s) and the copyright owner(s) are credited and that the original publication in this journal is cited, in accordance with accepted academic practice. No use, distribution or reproduction is permitted which does not comply with these terms.
*Correspondence: Jianliang Zhang, MTUyMDEzMDkyNjBAMTYzLmNvbQ==