Participatory Qualitative Modeling to Assess the Sustainability of a Coastal Socio-Ecological System
 Sophie Gourguet1*
  Martin Pierre Marzloff2
  Cedric Bacher2
  Pierre Boudry3
  Philippe Cugier2
  Jeffrey Mark Dambacher4 Nicolas Desroy5 Aline Gangnery2,6 Patrick Le Mao5 Léa Monnier1 José A. Pérez Agúndez1 Olivier Thébaud1
- 1Ifremer, Univ Brest, CNRS, UMR 6308, AMURE, Unité d’Economie Maritime, IUEM, Plouzané, France
- 2Ifremer, DYNECO, Plouzané, France
- 3Ifremer, Univ Brest, CNRS, IRD, LEMAR, Plouzané, France
- 4Commonwealth Scientific and Industrial Research Organisation (CSIRO), Hobart, TAS, Australia
- 5Ifremer, LITTORAL, Dinard, France
- 6Ifremer, LITTORAL, Port-en-Bessin, France
Assessing the sustainability of socio-ecological systems requires understanding the interactions between numerous ecological, economic and social components. Models are often used to investigate how interactions shape system feedbacks and drive the complex dynamics at play in such systems. However, building these models is a non-trivial exercise, which often neglects stakeholder knowledge and perceptions. We adopted a participatory approach that relies on conducting workshops to engage stakeholders into the development of qualitative models of system feedback. This type of participatory qualitative modeling is well suited to address the complexity of socio-ecological systems in a holistic manner, identify key stakes and feedbacks, and predict responses to perturbations. We use this approach to investigate the factors that condition sustainability of the socio-ecological system associated with shellfish aquaculture in the Normand-Breton Gulf in France. Six region-specific workshops were organized with shellfish producers, managers and other stakeholders to identify and describe key components, interactions and pressures that contribute to overall socio-ecological dynamics. Differences and commonalities in system perceptions were identified across the different regions and focus groups. We reconciled stakeholder-specific discrepancies in model structure into a synthetic representation that conciliates alternative views of the system. Next, we predicted how the system might respond to alternative scenarios of change. Overall, our participatory qualitative modeling exercise identified key drivers of the system under study that constitute effective management levers to maintain system sustainability. For instance, low social acceptability of the aquaculture industry generally appears to be a major constraint on the sustainability of shellfish aquaculture in the Normand-Breton Gulf, while reducing rearing density appears to be a key driver of sustainability.
Introduction
In his view of economic, ecological, and social system complexity, Holling (2001) proposed a theoretical framework that allows assessing how internal factors and external drivers interact to determine systemic sustainability. He argued that an efficient framework should be as simple as possible, should embrace uncertainty and unpredictability, and should be based on dynamic processes rather than be only descriptive. Understanding the structure and the dynamics of socio-ecological systems (SES) calls for interdisciplinary approaches coping with the interactions between ecological, economic and social components (Beder, 2011). Therefore, there is a growing need to move from monodisciplinary approaches that provide knowledge on a specific issue toward inter- and transdisciplinary approaches. Transdisciplinary approaches involve the integration of different disciplines as well as non-academic knowledge related to a certain field of research (Tress et al., 2005). These scientific approaches thus require involvement of stakeholders to guarantee that the issues addressed are close to reality and that the answers provided are operational. Tress et al. (2005) defined participatory research as “projects that involve academic researchers and non-academic participants to solve a problem.” Among participatory approaches, modeling with stakeholders has been increasingly used (Voinov and Bousquet, 2010; Schlüter et al., 2012; Dutra et al., 2015; Fulton et al., 2015; Voinov et al., 2016). Some authors have listed a number of elementary principles underlying such modeling (Barreteau et al., 2003), which should be: (i) structured around a question that a set of actors take ownership of in order to address collectively; (ii) focused on the objective of allowing sharing perspectives during collective and sub-group discussion times; (iii) enabling all identified points of view and knowledge to be considered; (iv) using modeling to make the points of view explicit and formal. Collective implementation of these principles aims to produce a shared representation of the functioning of the system under study and provides a space for discussion of the limits and possible contradictions between points of view (Etienne, 2013).
Integrating information across social, cultural and economic dimensions of SES within a modeling approach may be challenging. Difficulties of scientific integration are often reinforced by the lack of data and information, heterogeneity of data (e.g., qualitative vs. quantitative, non-homogeneous collection frequencies), or biased information regarding some of the components under study. In this context, qualitative modeling of system feedback (also known as Puccia and Levins’ loop analysis) consists of the analysis of graphs representing causal relationships within the SES (Puccia and Levins, 1985; Dambacher et al., 2007). The approach can explicitly represent variables and processes related to different dimensions of socio-ecological dynamics (e.g., physical, biological, ecological, economic and social), which is an essential step in the elaboration of SES representations. Loop analysis, which is only one of many possible qualitative methods (Justus, 2006), can predict the effects of a sustained change in one variable on other components. Analyses of system feedback can also help inform system-level properties related to stability (Dambacher et al., 2003b; Justus, 2006). Such qualitative modeling has been applied—among other fields—in the context of ecosystem approaches to fisheries and aquaculture. For instance, some analyses used qualitative models to explore responses of coastal ecosystems to the addition of suspended mussel culture under environmental scenarios (Forget et al., 2020), or to investigate bivalve aquaculture-environment interactions (Reum et al., 2015). Other studies used qualitative models to integrate fisheries information on environmental, ecological and human dimensions into a common analytical framework to examine linkages among those components (Zador et al., 2017). The approach also proved useful to perform integrated ecosystem assessments (DePiper et al., 2017) or to develop a “balanced” representation of a SES in the sense that it evenly captures system variables across the ecological and social dimensions (Haraldsson et al., 2020). While these studies did not involve participation of non-academic participants, qualitative modeling of system feedback has several advantages for stakeholders’ engagement. First, a model can be represented as a graph that can be drawn and modified in a stepwise and interactive manner: graphical representations of both variables and sign-oriented links between them (negative or positive) can be developed in real-time during discussions with stakeholders. It is therefore visual, and easily understandable by participants. In addition, the nature of the relationships (positive or negative) between the elements of the system represented is often known to stakeholders, even if they do not always have direct experience of these and/or cannot quantify them. This makes it possible to involve a wide range of stakeholders. Therefore, qualitative modeling facilitates transdisciplinarity because representations can relatively easily integrate different components and dimensions (environmental, economic and social for example). Finally, alternative representations of a system can be explored, which makes it possible to take into account the opinions of each participant on the functioning of the reality represented in a workshop setting. Qualitative modeling of system feedback is therefore a particularly powerful tool to establish a multi-stakeholder perspective on the key characteristics of a socio-ecological system and its sustainability.
Here, we address the sustainability of shellfish aquaculture in the Normand-Breton Gulf (NBG, France) using loop analysis to support a participatory approach and analyze some qualitative properties of this system. NBG territory faces multiple issues regarding natural and cultural heritage, the protection of ecosystem functions and the sustainable development of a large range of human activities in the coastal area. NBG is famous for its Mont-Saint-Michel and bay that belong to a World Heritage Site designated by UNESCO. It also supports a high biodiversity (including emblematic species) due to a variety of marine benthic habitats that provide major ecological functions. Among human activities that play a structuring socio-ecological role, shellfish aquaculture (dominated by Pacific oyster Crassostrea gigas and blue mussel Mytilus edulis) takes center stage, with an important role in the local economy and particular sensitivity to a number of environmental stressors, as well as to conflicts over the uses of the coastal ecosystem. In this context, our main goals were to (i) elicit information from stakeholders about the Normand-Breton Gulf socio-ecological system associated with the shellfish aquaculture industry, (ii) compare and reconcile the alternative representations of this system elaborated by different stakeholder groups (including a group of scientists), (iii) develop a holistic understanding of the system dynamics, and specifically assess the response of the system to selected scenarios of changes, and (iv) identify actions to improve the sustainability of shellfish aquaculture.
Materials and Methods
Case Study: Shellfish Aquaculture in the Normand-Breton Gulf, France
The Normand-Breton Gulf (NBG) is located in the north-west of France along the English Channel with a coastline about 450 km for a total marine area of ca. 14,000 km2 (Le Mao et al., 2019). It is a biogeographical entity whose main characteristics are strong tidal ranges, which are the source of intense tidal currents, as well as its shallow depth and vast foreshores. The NBG is managed by two administrative departments (Ille-et-Vilaine and La Manche) belonging themselves to two different regions: Brittany and Normandy. Our study area comprises two adjacent areas: the Bay of Mont-Saint-Michel (BMSM), which extends ashore from Cancale to Granville, and the West Cotentin coast, from Granville to Flamanville including the Chausey archipelago (Figure 1). The Bay of Mont-Saint-Michel extends over two administrative regions, but shellfish farming is mainly present in the intertidal zone that is managed by the Direction Départementale des Territoires et de la Mer (DDTM) of Ille-et-Vilaine in Brittany and the West Cotentin site is managed by the DDTM of La Manche in Normandy. We therefore refer hereafter to the Bay of Mont-Saint-Michel site as the Brittany site, and to the Western Cotentin site as the Normandy site.
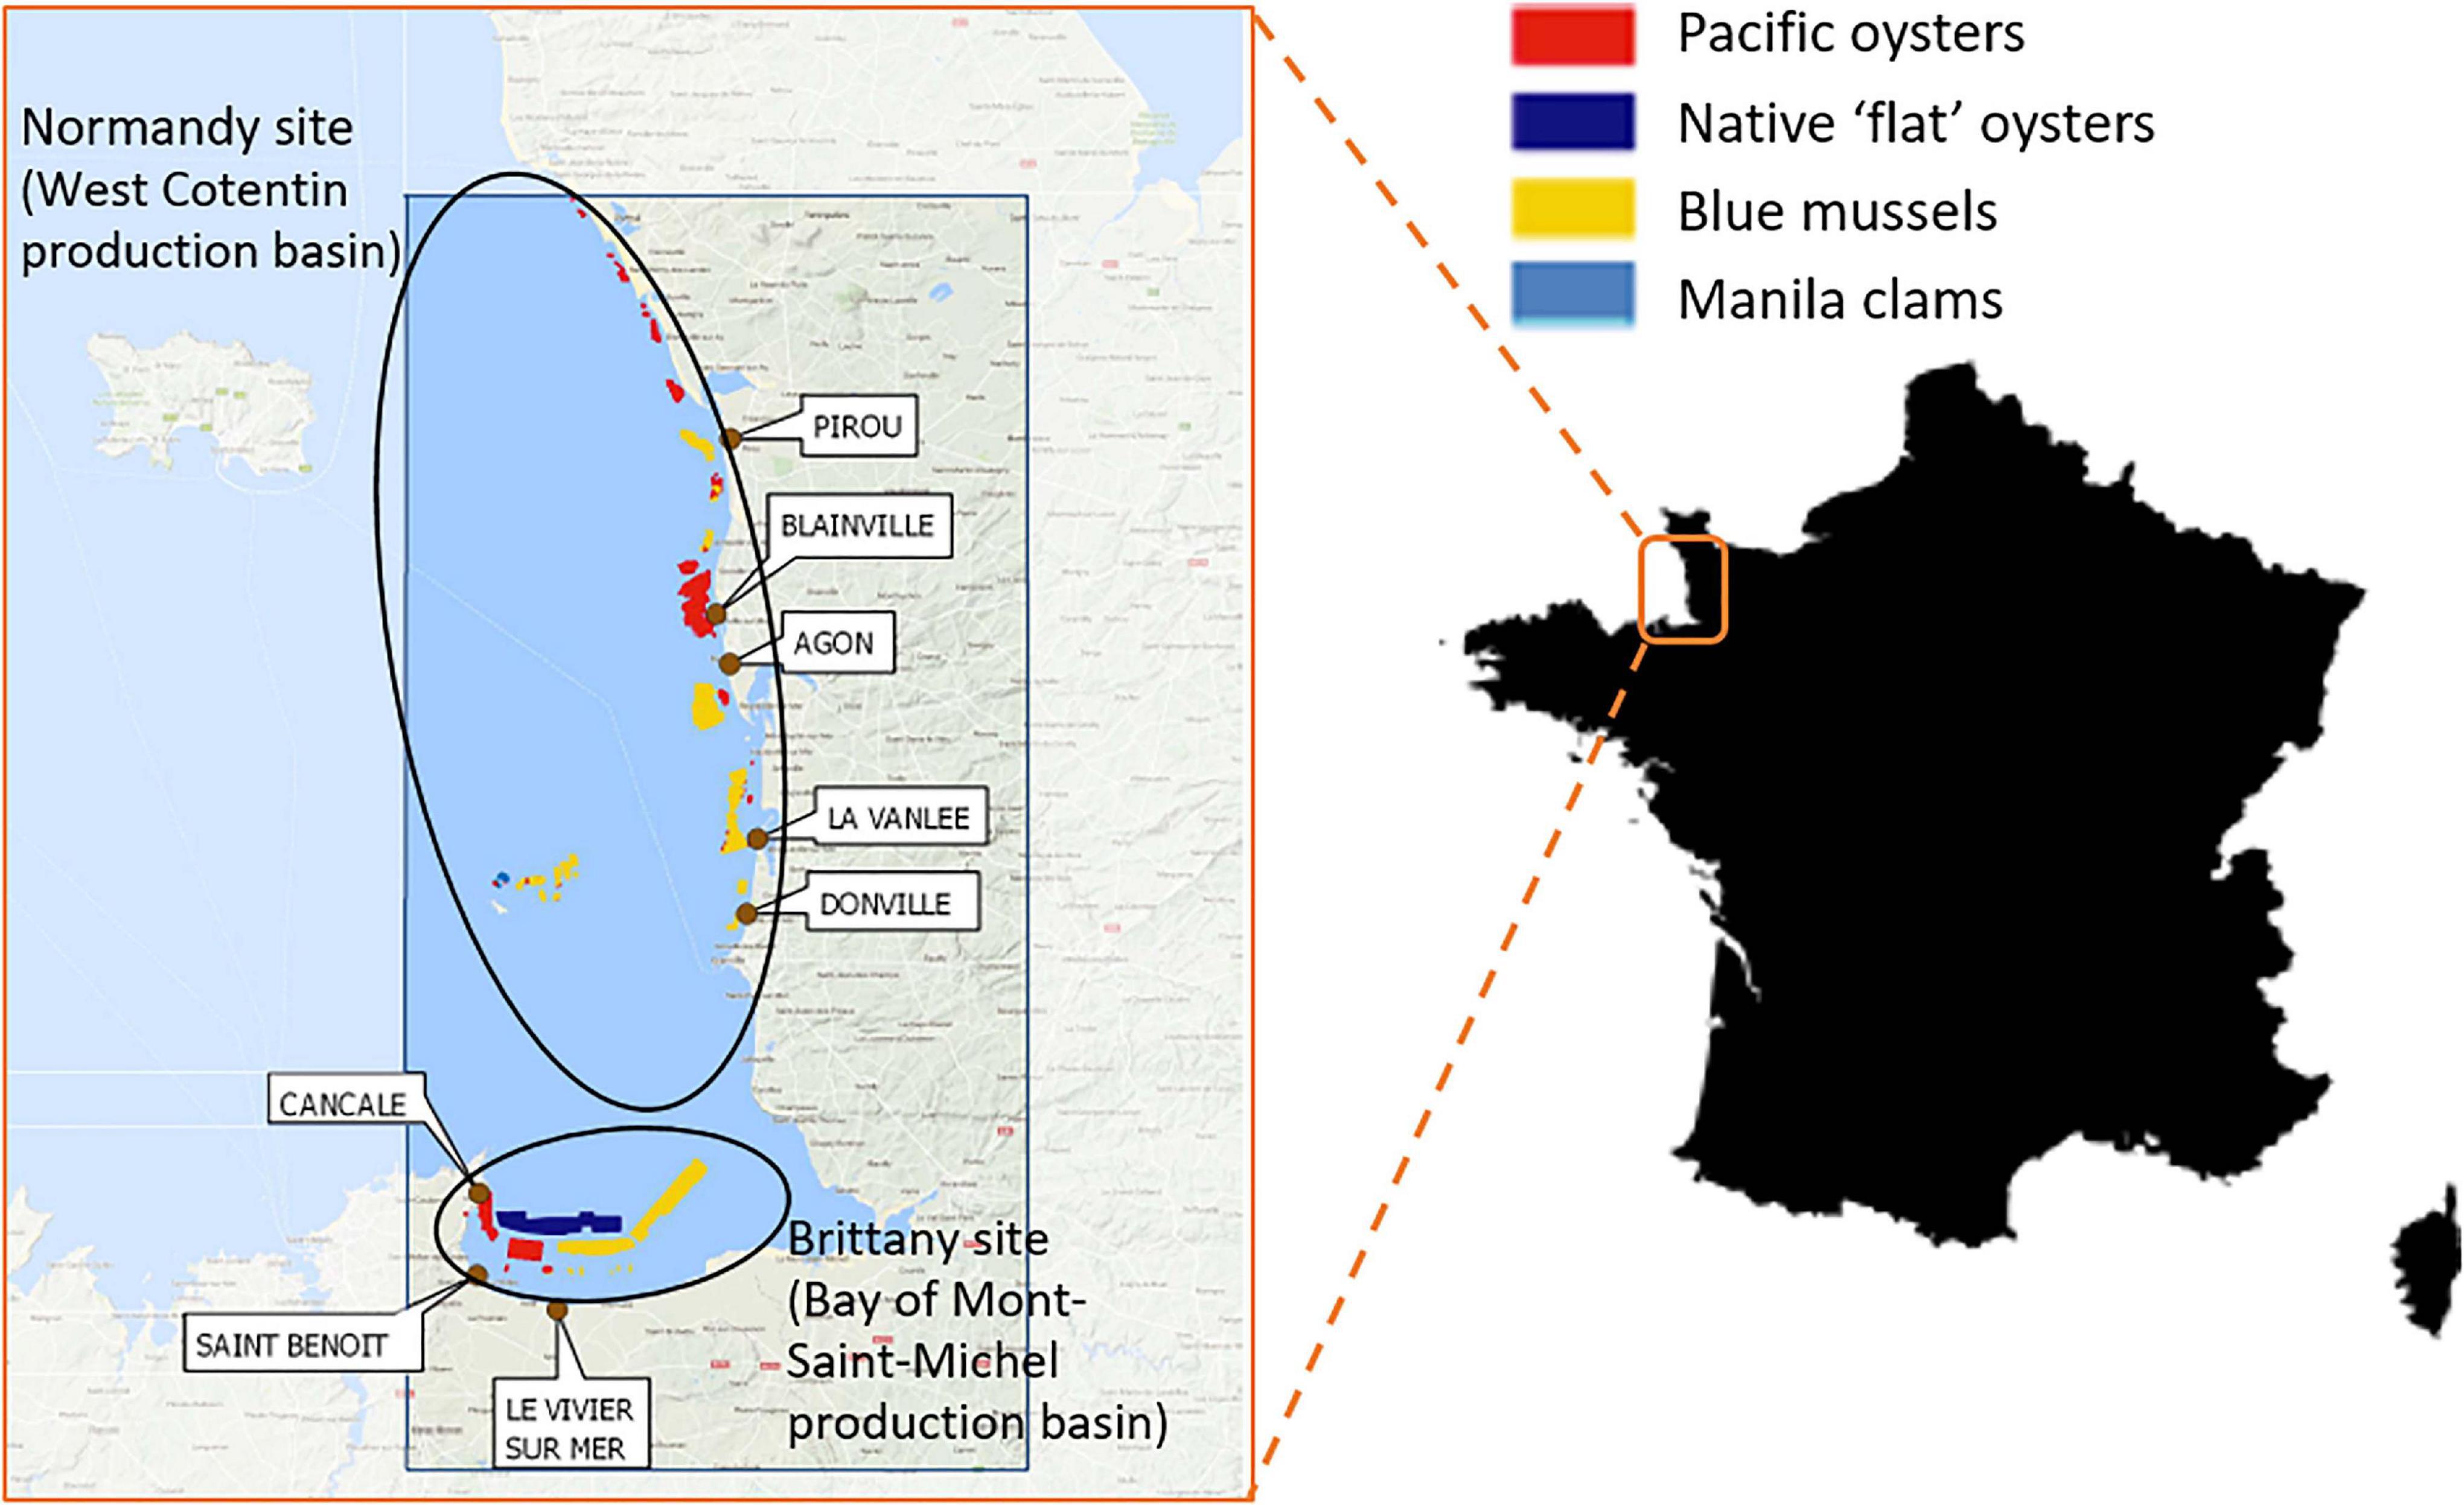
Figure 1. Official layout of shellfish growing areas (cadastre) of the studied territory. Data source: DDTM35 (2014) and DDTM50 (2017).
Among human activities in the NBG, aquaculture largely contributes to the local economy, which makes its sustainability essential to local livelihoods. In this specific area, bivalve farming largely dominates aquaculture and is usually located in sheltered and intertidal areas (bays, estuaries). Two species are mainly cultivated: the Pacific oyster, introduced in Europe for aquaculture production in the early 1970’s and the native blue mussel, with annual productions around 13,100 and 26,000 tons, respectively (Le Mao et al., 2019). In comparison, Manila clam (Ruditapes philippinarum) farming represents a production varying between 80 and 240 tons per year, concentrated around the Chausey Islands (Conseil Départemental de la Manche, 2015). It is important to note that the bouchot mussel of the Bay of Mont-Saint-Michel has been subjected to a Protected Designation of Origin (PDO) “Moules de bouchot de la baie du Mont-Saint-Michel” since 2011. It is the first seafood product to benefit from such a label. The benefits for producers associated with a strong demand for high quality bouchot mussels largely compensate for the production constraints associated with this label. This approach also proves to be effective in managing the resource by adapting production levels to the carrying capacity of the basin. At present, all mussel farmers from our Brittany site adhere to the PDO (called certification hereafter), and the vast majority of mussels are marketed under PDO. While mussels in Normandy, also produced on bouchots, are not subject to this PDO certification, they have benefited since 2013 from the STG sign (Spécialité Traditionnelle Garantie) referring to the cultivation process.
Figure 1 illustrates the official layout of shellfish growing areas. This shellfish aquaculture cadastre evolved over time, the most recent and major evolution dating from 2003. A productivity gradient exists in the bay, which is increasing from west to east (Cugier et al., 2010b), and improvements in water quality allowed extending the mussel farming areas toward the east from that year onwards. This restructuring of the cadastre made it possible to improve shellfish growth, and to invest in new areas in the eastern part of the bay with the overall objective of maintaining the total production carrying capacity of the basin while also improving the quality of products and work. The space which was freed up by mussel farming in the process is now occupied by foreshore oyster farming.
The involvement of multiple stakeholders in the NBG adds to an already complex governance system. Sharing of the trophic resource (i.e., phytoplankton) is an important issue for shellfish farmers, as it depends on nutrient inputs coming from the catchment areas and sustaining primary production. In addition to shellfish aquaculture, several economic and social activities potentially compete for the use of coastal and marine space. These include commercial fisheries, tourism (including diverse nautical activities, recreational fisheries and cultural tourism), extraction of mineral and energy resources (sand gravel extraction, tidal power plant, water cooling of nuclear power plant), maritime traffic, agriculture (various crop and animal productions), and urban development. Due to remarkable landscapes and emblematic living species, the area also receives multiple levels of environmental protections. The different management issues identified include the protection of key marine habitats, understanding and preserving coastal ecosystems in relation to ecosystem functions and land/sea interactions, maintaining the diversity of seabirds and marine mammals, improving water quality and maintaining the primary productivity of coastal areas, and coping with invasive species that affect coastal biodiversity and productivity (AAMP, 2009). Improving the coherence and transparency of decision-making process regarding coastal zone management; developing new uses in the coastal zone; and promoting sustainable activities, including aquaculture and fisheries, are also identified as important issues (Gangnery et al., 2020).
During the last two decades, scientific studies based on stakeholder interests focused on the estimation of the ecosystem carrying capacity by using hydrodynamic and ecological modeling tools to test prospective scenarios (Cugier et al., 2010a,b; Gangnery et al., 2015). In the bay of Mont-Saint-Michel, filter-feeders including cultivated species dominate macrobenthic communities, share primary production (suggesting competition between species) and even control it (both native and invasive species) (Cugier et al., 2010b). Cugier et al. (2010a) showed that modulating rearing density of cultivated species could enhance food availability and partly counteract a potential continuous increase of the invasive species Crepidula fornicata (slipper limpet). In parallel, on the West coast of Cotentin, mussel growers observed a decrease of mussel growth and quality. Results from Gangnery et al. (2015) showed the footprint of cultivated mussels on primary production and the connections between the different culture areas illustrating the importance of space occupation.
To assess the sustainability of aquaculture development in this geographical area, it appeared thus necessary to reconcile multiple perceptions and concerns to develop a shared vision of the main issues at stake. Emergence of a consensus on socio-ecological representation is a prerequisite to support effective local management strategies. Thus, we implemented a participatory approach to consolidate existing scientific knowledge and foster interactions between stakeholders and scientists with a dedicated focus on sustainable aquaculture in the NBG.
Participatory Stakeholder Workshops
We adopted a participatory qualitative modeling approach to elicit multiple representations of the NBG shellfish aquaculture socio-ecological system by different groups of stakeholders, in separate workshops. These workshops were organized in the two administrative regions (Brittany and Normandy), with homogeneous focus groups of stakeholders of limited size (<10 participants).
As described above, shellfish aquaculture activity in the NBG is part of a complex socio-ecological system. The activity interacts strongly with its environment and with other uses of the coastal zone, which can lead to conflicts between different stakeholders. The regulation and management of the shellfish aquaculture activity therefore concern multiple stakeholders. We identified three groups of stakeholders in each region: (i) “shellfish producers” including shellfish (mussel and oyster) farmers and their representatives (Regional Committee of Shellfish farming, trade unions), (ii) “managers” including (local) environmental and maritime administrations, NBG delegation of French Agency for Biodiversity, elected officials, water agencies, and coastal conservatory; and (iii) “other stakeholders” with representatives from other uses of the gulf (professional and recreational fishers) and environmental Non-Governmental Organizations (NGOs).
We independently held six participatory workshops in March 2017 to elicit key components, interactions and pressures viewed as significant to socio-ecological dynamics in the NBG. The workshops addressed three main questions: (i) “what are the current issues faced by the shellfish production sector?” (ii) “what are the important interactions between ecosystem, shellfish production activity and other uses of the ecosystem in relation to these issues?” and (iii) “what are the levers of action for the shellfish aquaculture sector?” Prior to these six workshops, we organized a pilot workshop in June 2016 involving researchers to address the same questions. Table 1 summarizes the characteristics of the workshops.
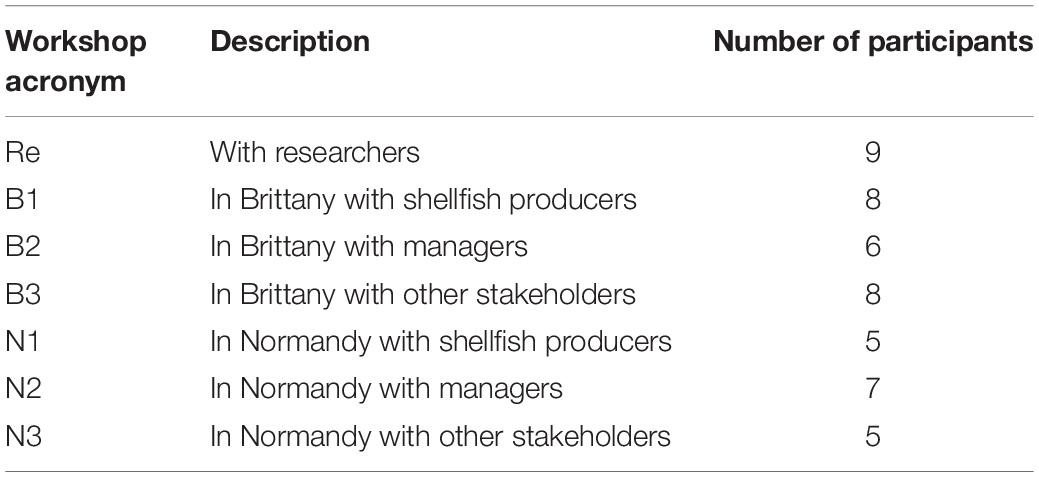
Table 1. Characteristics of the seven workshops.
We presented the formalism of the qualitative model approach (described in section “Qualitative Modeling of System Feedback”) to participants to collaboratively develop representations of the socio-ecological system of the Normand-Breton Gulf based on collective inputs. We then asked the workshop participants to first elicit key components and pressures viewed as significant to socio-ecological dynamics, and then specify key interactions between these variables, step-by-step, by drawing a qualitative representation on a whiteboard. These workshops led to the construction of seven conceptual models representing the vision of the different groups of stakeholders and scientists of the NBG socio-ecological system.
Synthetic Representation
Because the workshop participants did not work from a predetermined list of variables, they named some variables differently in different models even though the variables had the same meaning. We therefore harmonized the terminology of the variables following the workshops to make all models comparable, and we aggregated the variables into three broad dimensions: environmental, economic and social.
We then developed a synthetic representation with the variables appearing in at least three of the six models obtained during the stakeholder workshops, i.e., the variables mentioned in at least half of the focus groups. The synthetic model is based solely on stakeholders’ representations and thus excludes the perceptions of researchers. Indeed, while the researchers’ model was developed during a pilot workshop to test the elicitation methodology, the main objective of our study was to compare and reconcile alternative representations of the NBG system elaborated by different stakeholder groups.
The stakeholders validated this synthetic representation and the analysis of the model responses during a final meeting held in June 2017. This final meeting gathered in one place the participants in the six workshops organized in March 2017.
Qualitative Modeling of System Feedback
Qualitative modeling of system feedback (or loop analysis) is one modeling method that allows assessing stability and dynamics of a system (Puccia and Levins, 1985; Dambacher and Ramos-Jiliberto, 2007). A system can be represented as a sign-directed graph (Puccia and Levins, 1985) where key variables are shown as nodes, which are interconnected by interactions shown as oriented edges (−>, or –o, for a positive or a negative interaction, respectively). This graph captures key interactions between system components and provides a suitable media for collaborative development of qualitative models.
Mathematical analysis of a qualitative model can also provide some insights on the scenarios and conditions that can contribute to the sustainability of a socio-ecological system. Indeed, a sign-directed graph can then be mathematically written as an interaction or community matrix, where each coefficient ai,j corresponds to the effect of variable j on variable i. Thus, each coefficient ai,j is either negative, positive or null according to the nature of the interaction between i and j. Based on formal analyses of system feedback, the approach provides an assessment of system stability (Dambacher et al., 2003b), and responses of variables to sustained perturbation (Puccia and Levins, 1985; Dambacher et al., 2002, 2003a,b).
Qualitative Predictions of Responses to Sustained Perturbation
A qualitatively specified community matrix can be defined symbolically (Dambacher and Ramos-Jiliberto, 2007; Marzloff et al., 2011) or numerically (Dambacher et al., 2003a; Hosack et al., 2008; Melbourne-Thomas et al., 2012; Marzloff et al., 2016). The adjoint of a community matrix tracks how feedback structure contributes to responses to sustained perturbation. Importantly, the sign of the element bi,j in the adjoint matrix indicates how variable i qualitatively responds to a sustained positive input to variable j (Puccia and Levins, 1985; Dambacher et al., 2002). When all the effects of variable j on i are of the same sign, then the response sign is fully determined as either positive, negative or neutral (when there is no effect). However, when both positive and negative effects contribute to the response, sign prediction becomes ambiguous, since it depends on the relative magnitude of positive and negative effects involved.
Here, we adopted a numerical approach based on Monte-Carlo simulations to determine variable responses to perturbation scenarios (Melbourne-Thomas et al., 2012; Marzloff et al., 2016). In short, n = 5,000 quantitative matrices, all of which conform to the sign structure of the system’s community matrix, are drawn randomly: interactions are drawn in]0,1] if positive; in [−1,0[if negative; or are equal to 0 if nil. Qualitative sign predictions are then estimated for each variable as the proportion of response signs (positive, negative or nil) across the n adjoint matrices under a given perturbation scenario. Predicted variable responses to perturbation scenarios are computed using the red-gray-blue color scaling described in Marzloff et al. (2016): if all predicted responses for a given variable are of the same sign across all n matrices, its response sign is fully determined and shown in white if no effect, in dark blue if negative, or in dark red if positive. If the n randomly drawn matrices predict different response signs then there is an ambiguity in the response sign due to the counteracting effect of the different feedback loops involved. Ambiguous responses are shown in faded colors as ambiguity increases (red or blue for positive and negative responses, respectively), and appear in dark gray if less than 2/3 of the signs predicted are consistent. As a convention, when displaying results across several models, missing elements (when a variable is missing from a given model) are shown in black.
Uncertainty in Qualitative Predictions
Uncertainty in qualitative model predictions can arise from various sources, including (i) uncertainty in model structure (when the study system is not described by a single structure but rather by a suite of alternative representations that capture different levels of complexity or explicitly consider different processes), and (ii) sign indeterminacy in predictions of a given model (when the predicted sign of a response depends on the relative magnitude of counteracting effects; see section “Qualitative Predictions of Responses to Sustained Perturbation” explaining emergence of ambiguity in qualitative model predictions). Here, we accounted for model structure uncertainty by eliciting multiple representations of the socio-ecological system into alternative models, which capture how discrepancies in stakeholders’ perception translates into differences in model structure. A final set of results aims at quantifying both of these sources of uncertainty: first, we estimated variability in qualitative predictions across alternative models to characterize model structure uncertainty; second, we summarized the proportion of ambiguous predictions associated with each variable across the different models and scenarios.
To visualize overall consistencies in qualitative predictions across all models, we performed a Principal Component Analysis (PCA) on predicted responses to alternative scenarios. A two-dimensional matrix containing 10 rows corresponding to response variables and 33 columns associated with combinations of alternative models and alternative scenarios was consolidated to perform the PCA. Each matrix element contains a numeric value related to a model-specific prediction of a given variable response sign to a given scenario. Numeric values vary between −1 (when 100% of responses are negative) and 1 (when 100% of responses are positive). When a variable did not respond to a given scenario, its predicted response was equal to 0, while missing values (i.e., absence of predictions when a variable is missing from a given model) were replaced by the mean variable response to a given scenario across other models.
Finally, to quantify uncertainty associated with each variable, we reformatted the matrix described above to estimate, for each variable under each scenario, the proportion of ambiguous predictions across all models, and the Simpson index that captures sign-consistency across alternative model predictions. The Simpson index provides an estimate of evenness in four prediction categories (classified as positive, negative, neutral or ambiguous) across models. It is written as where p_c is the proportion of predictions in category c. Thus, Simpson index will be equal to 1 if all models are sign-consistent, or equal to 0.25 if sign predictions are inconsistent (i.e., evenly distributed across the four categories).
Results
Alternative Representations of the Socio-Ecological System
Table 2 summarizes the characteristics of the seven models built during each workshop (see Supplementary Material for representations of the seven models and variable definitions). The entry variable of the model corresponds to the first variable chosen by the workshop participants to start building the model (Table 2). While these entry variables were identical (i.e., “rearing density”) for all but two models, the total number of variables varies across models from 13 (B3 model) to 24 variables (B2 model). In addition, the number of variables involved in feedback loops (as opposed to those variables included as “giving” or “receiving” only) ranges from 7 (N1 and N2 models) to 12 variables (B3 and N3 models). The models developed during the “other stakeholders” focus groups in Brittany and Normandy (B3 and N3 models) differed the most from others. The B3 model had a different entry variable compared to the other stakeholder models and included only one environmental variable (“undersized organic waste”), while the N3 model focused mainly on biological processes and included only one economic variable (“rearing density”). This is consistent with the fact that the N3 workshop was mainly composed of people with a background in biology, unlike the B3 participatory workshop.
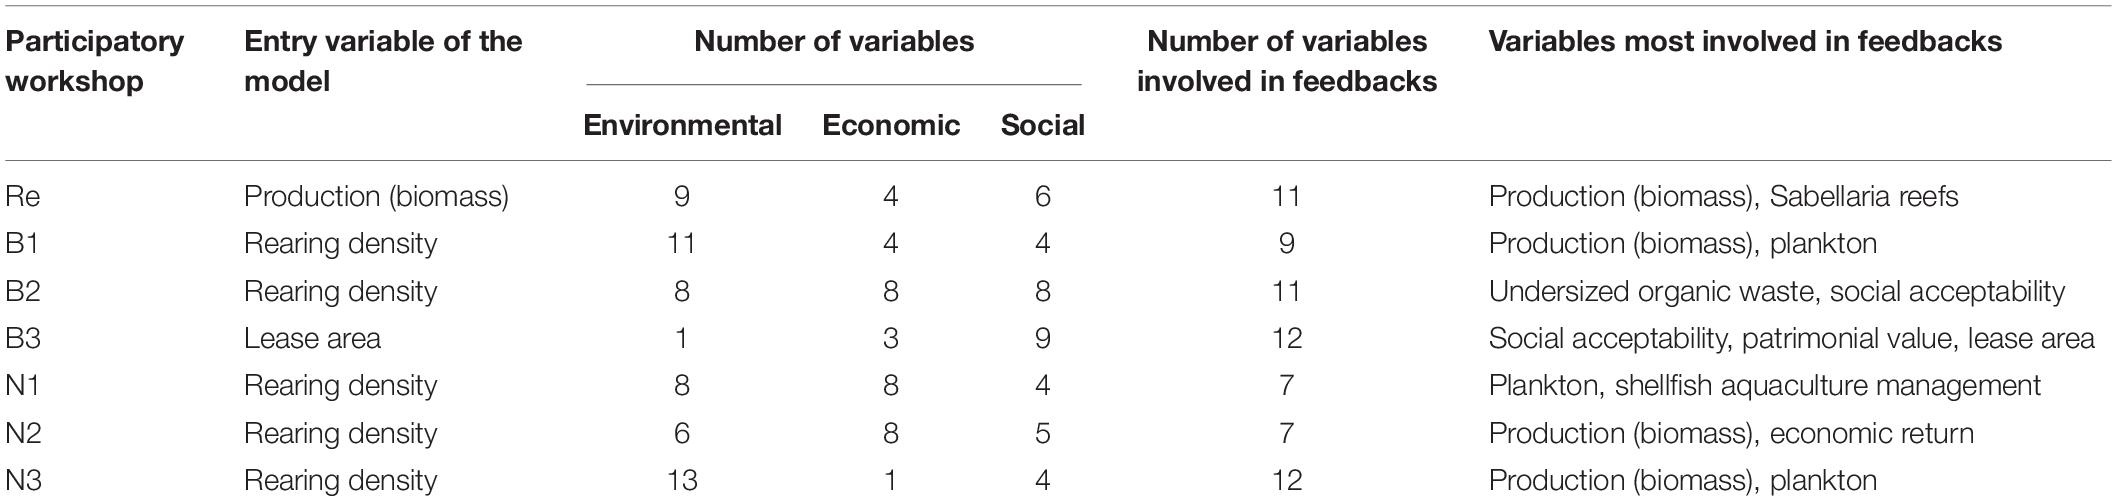
Table 2. Characteristics of the models built in the seven workshops.
All models represented the three environmental, economic and social dimensions, which is a crucial point for integrated modeling.
While no one variable occurred in all seven models, some variables were more commonly included across models (e.g., “plankton,” “production,” “shellfish aquaculture management,” and “rearing density” variables) and others were rarely included (Figure 2). Some variables were specific to a model, as illustrated in Figure 3. While no variables were specific to the B1 model and the B2 model had only one unique variable (“infrastructure processing”), B3, N1, N2, and N3 models had several variables specific to these models; as is the case for “stealing,” “boating,” “conflicts with beach users,” and “response to mortality” that were unique to the Normandy managers’ representation (i.e., the variables present only in the N2 model; Figure 3). Other variables were specific, either to a region or to a type of stakeholder. We determined that a variable was specific to a region when being represented in at least two of the three models in one region and in none of the models in the other region. In addition, we defined a variable specific to a type of stakeholder when it appeared in both models for this type of stakeholder and in none of the other models. The variables specific to the Brittany site were “certification,” “commercial fishing,” “recreational fishing,” “wild shellfish,” “solid waste,” “general demand,” “patrimonial value,” and “catchment runoff”; and the ones specific to the Normandy site were “site suitability” and “running costs” (Figure 2). While the variable “favorable weather regime” was specific to shellfish producers, “external production” and “market price” were specific to managers. No “other stakeholders” specificity was apparent. It is also important to note that B3 and N3 models did not have the same focus (human activities for B3, and ecological processes for N3). Three variables occurred only in the researchers’ model: “natural oysters,” “Sabellaria reefs” and habitat created by shellfish for fishes (see Supplementary Figure 7).
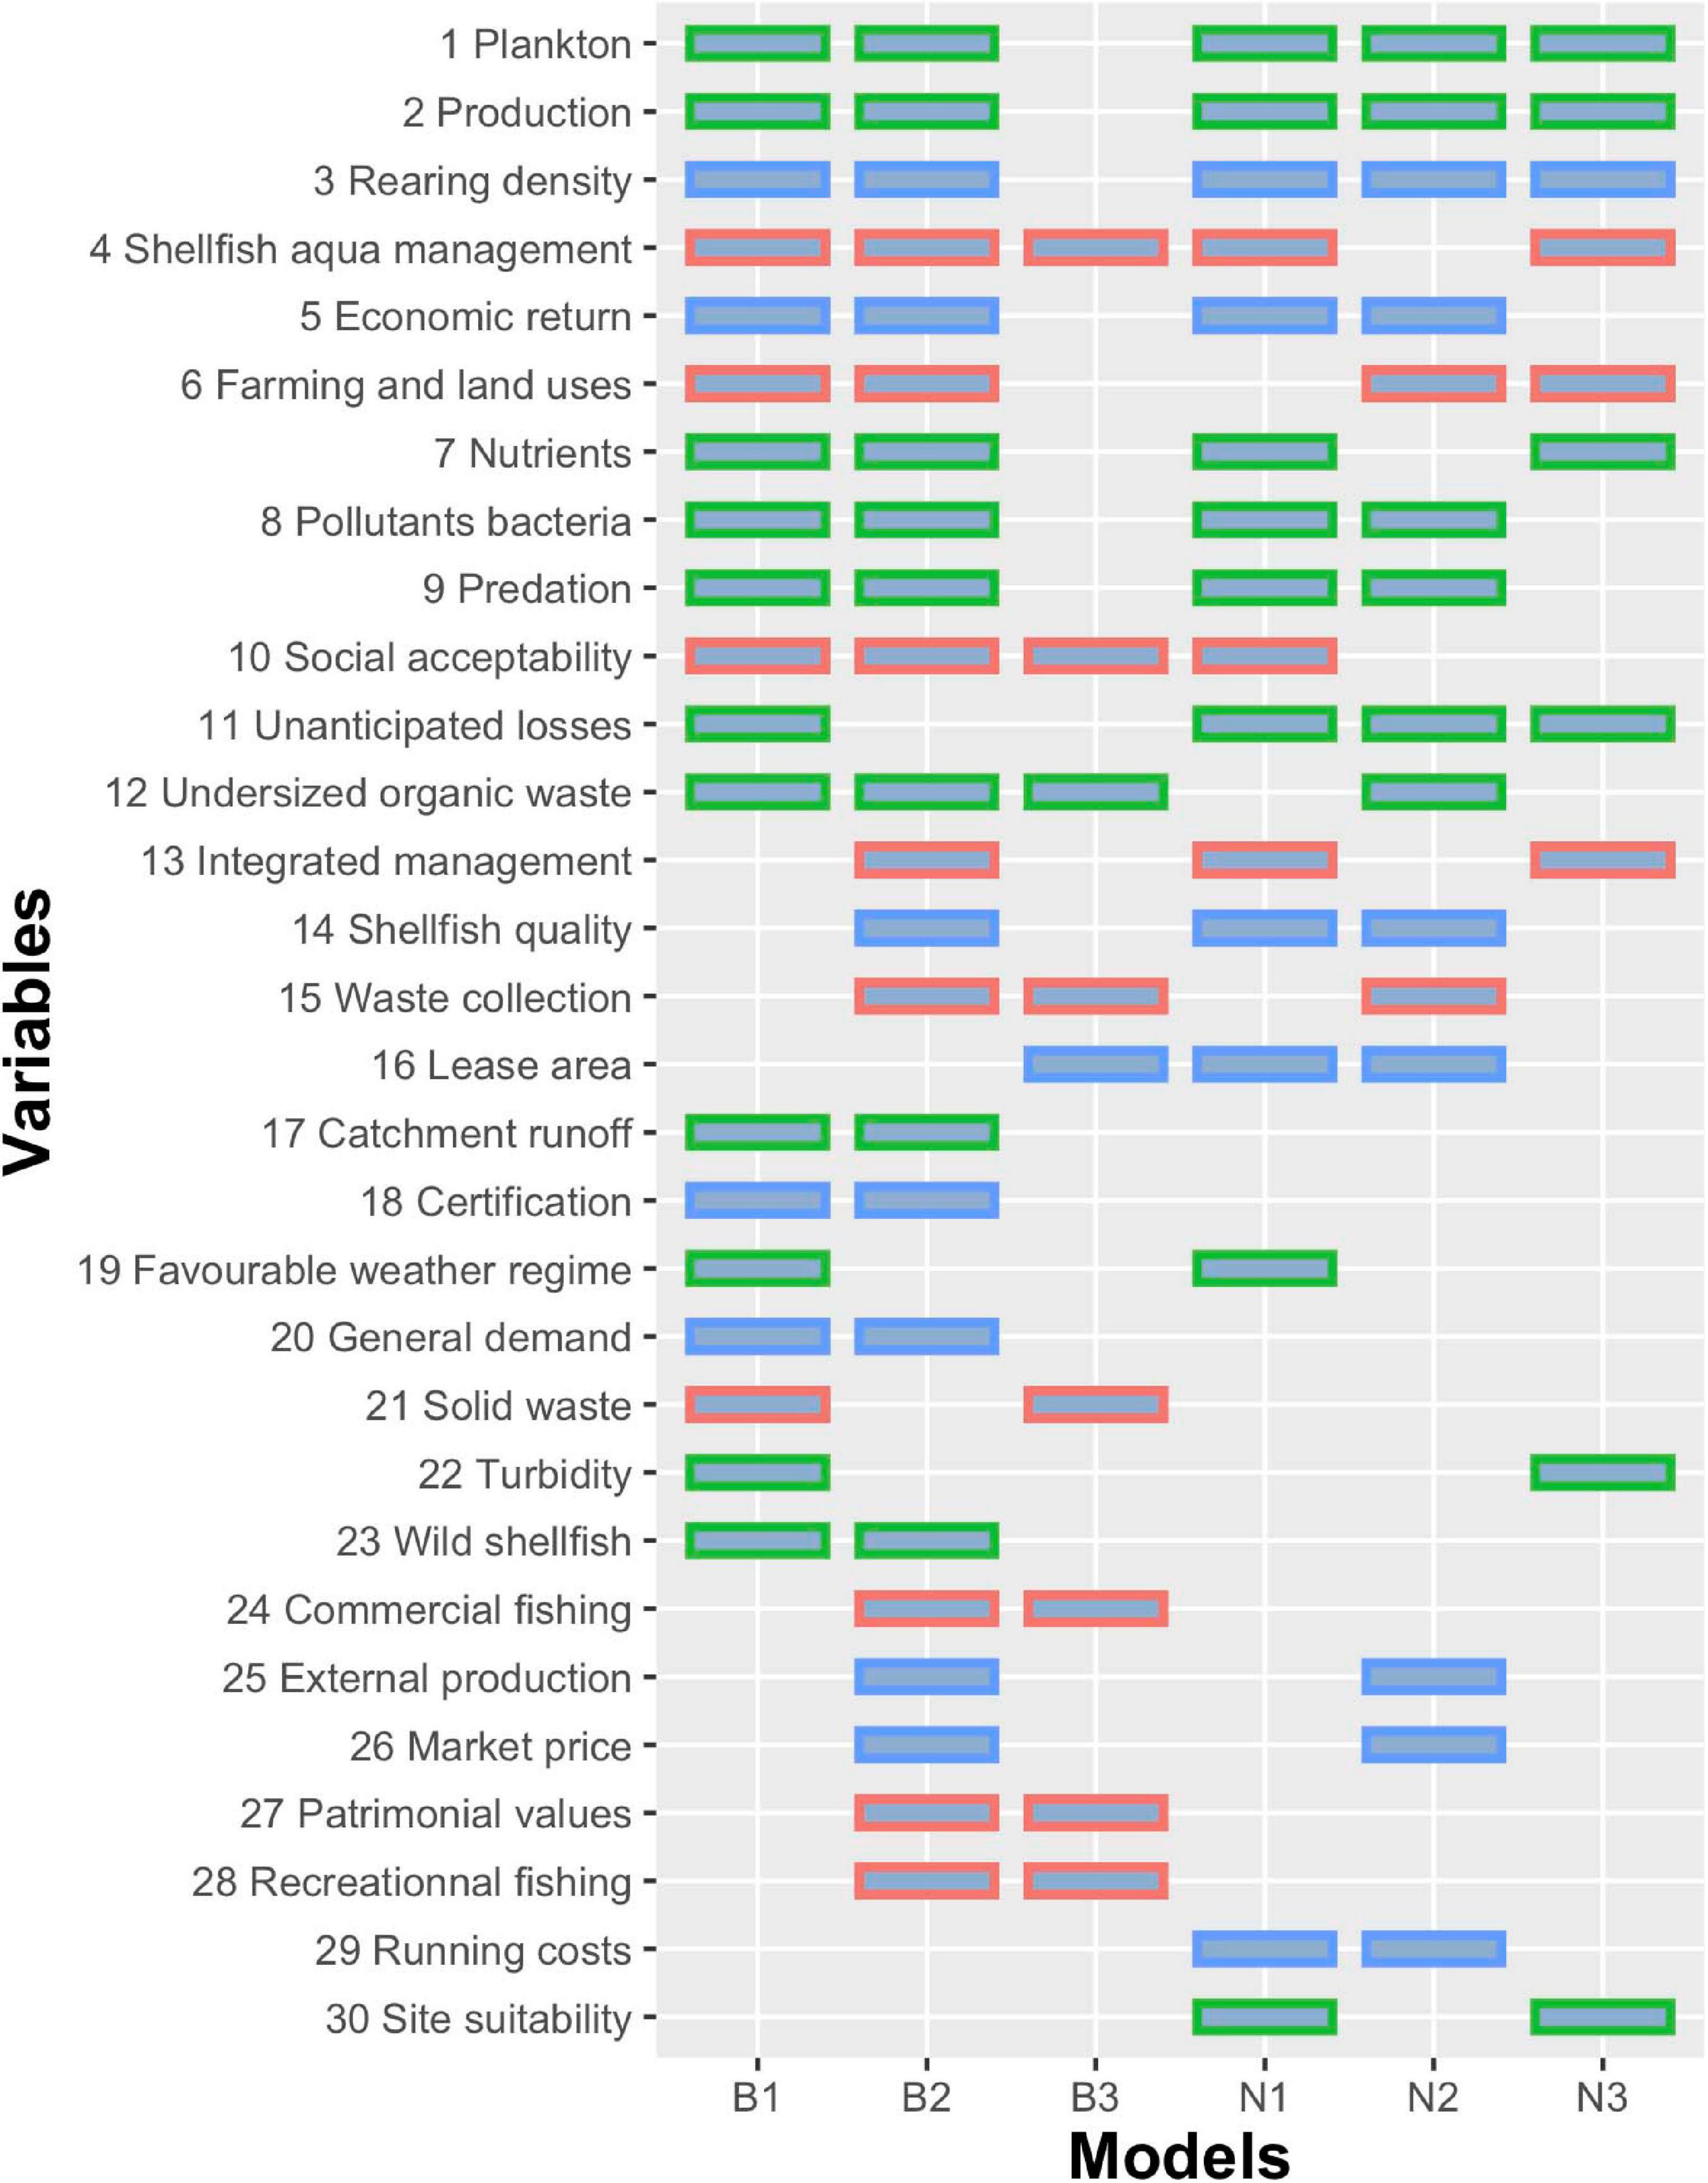
Figure 2. Variable inclusion across the six stakeholder models ranked from commonly- at the top (e.g., “plankton” included in five models) to rarely included at the bottom (e.g., “site suitability” included in only two models). Environmental variables are coded in green, economic variables in blue and social variables in red. This graph excludes variables that only appeared in one of the six stakeholder models.
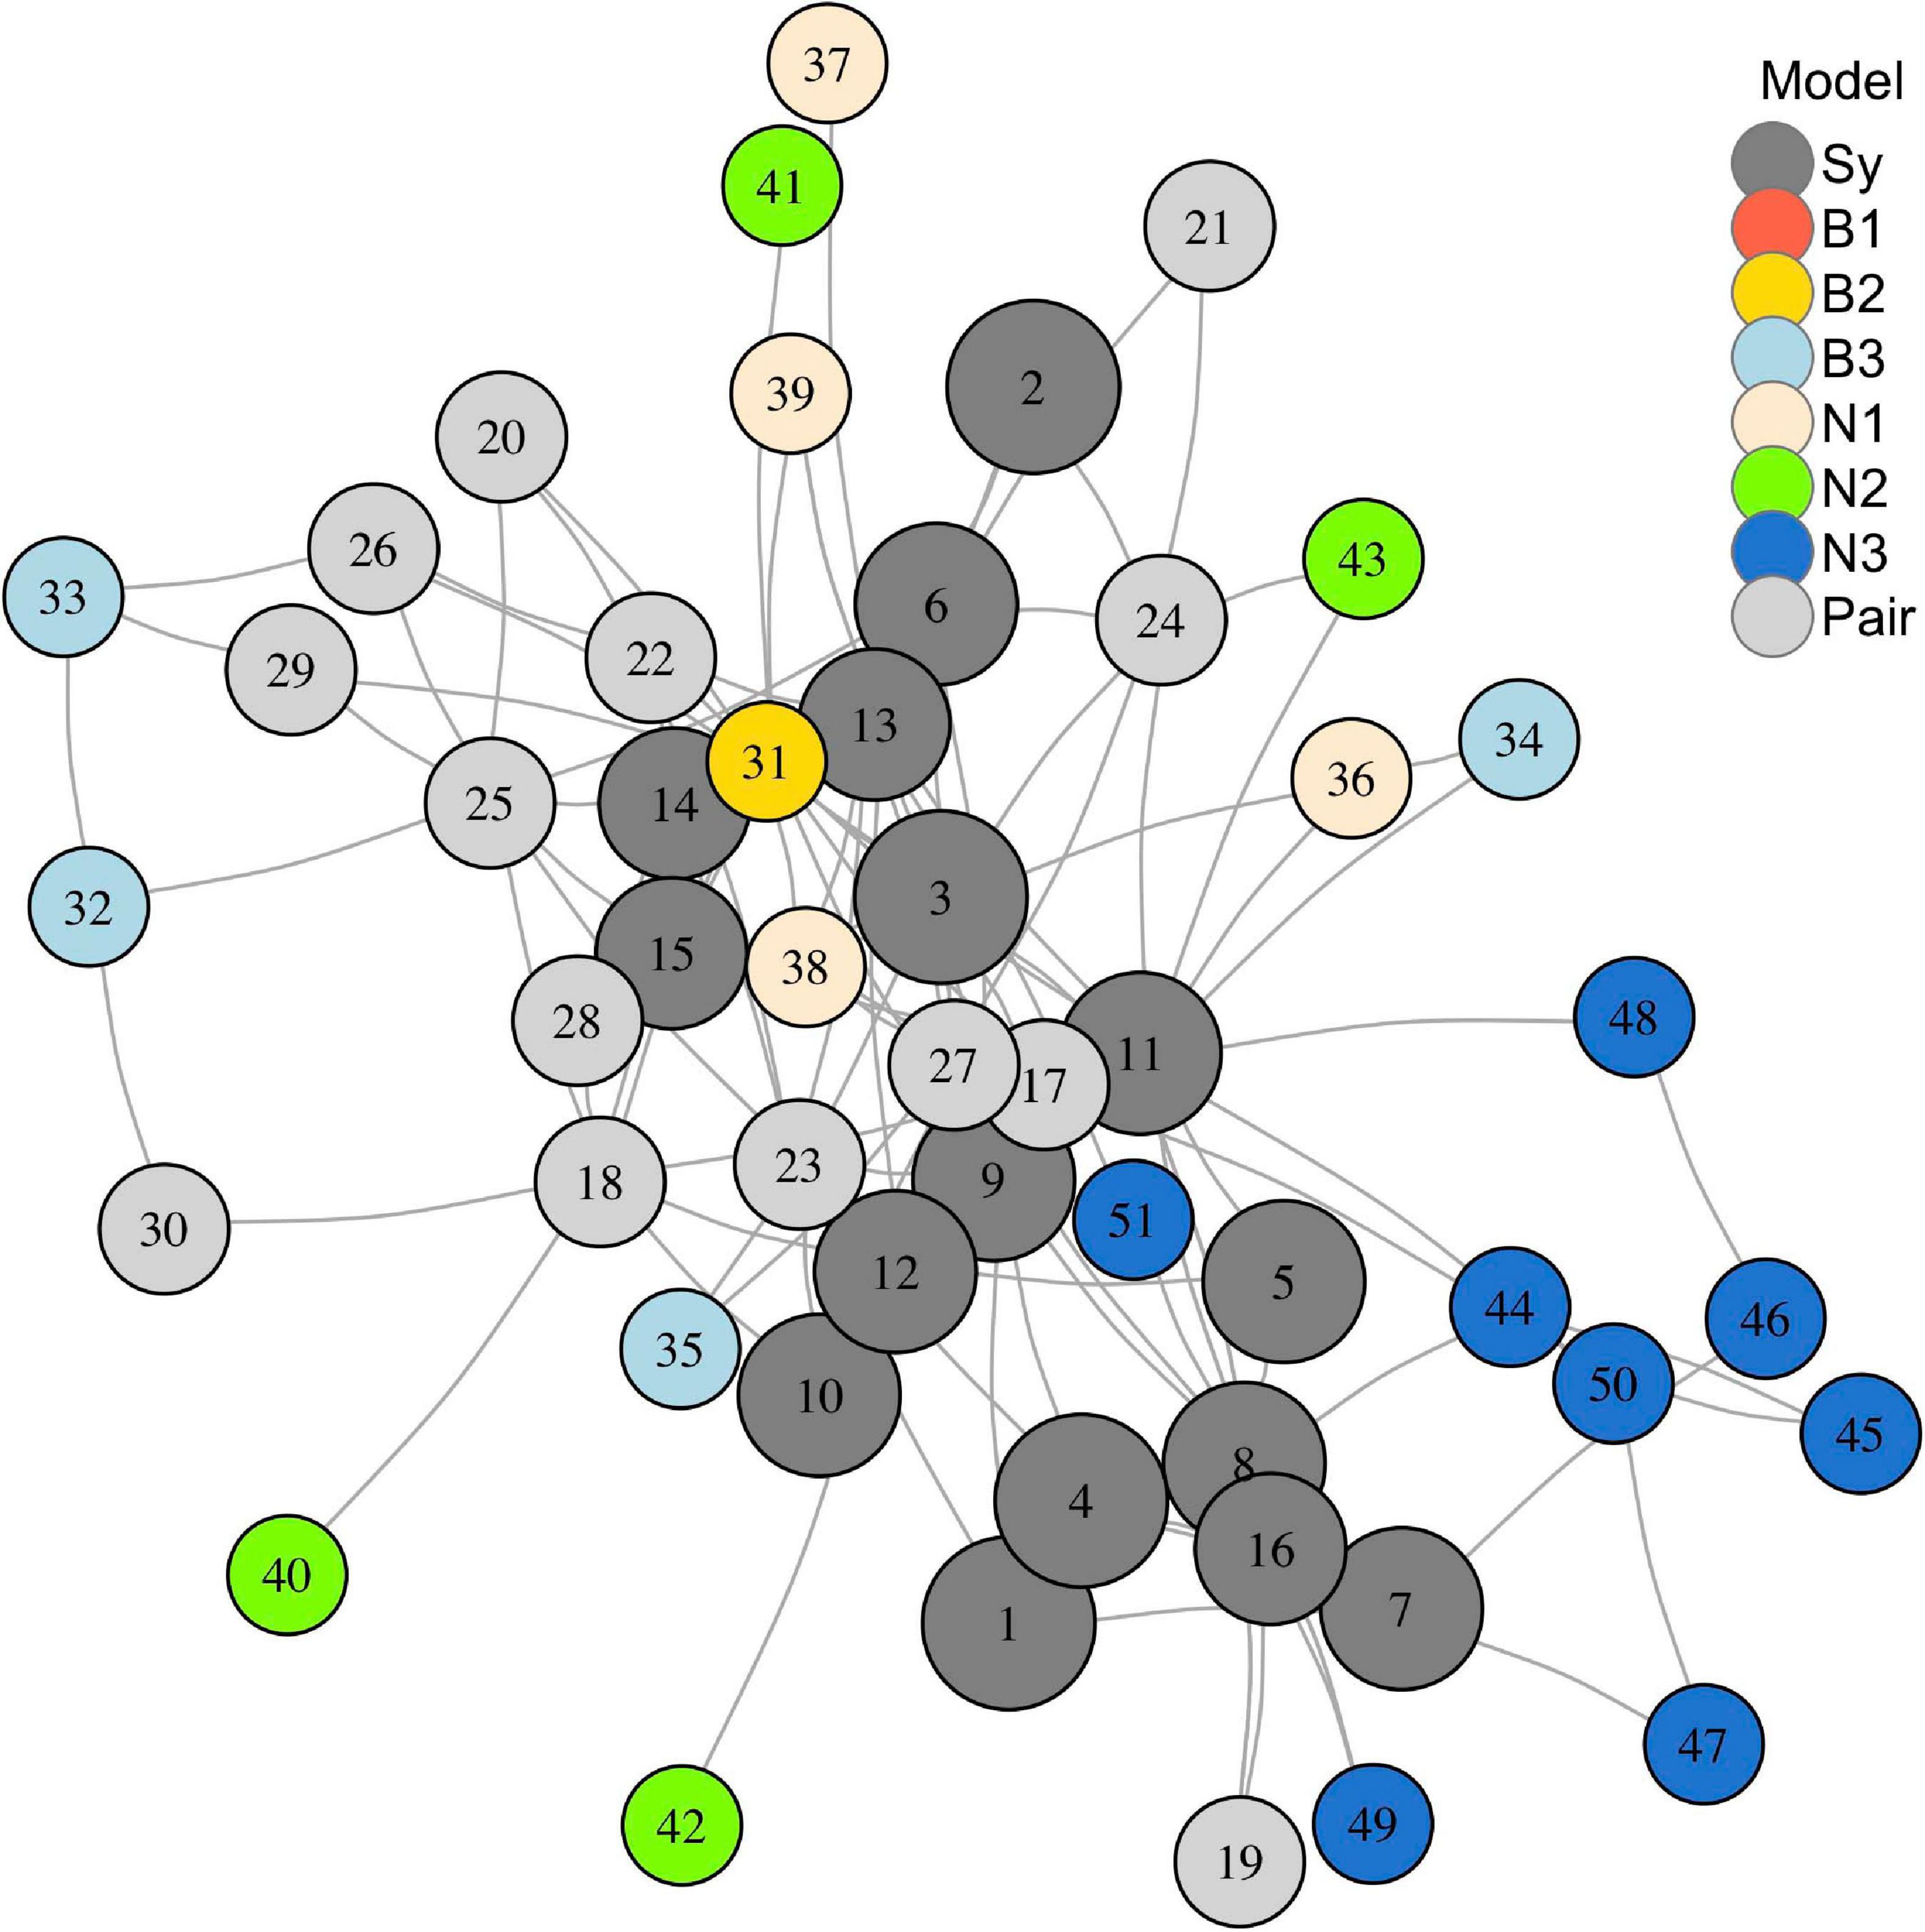
Figure 3. Graphical summary of the six alternative representations elicited during the six stakeholder-specific workshops (B for Brittany and N for Normandy). Node size reflects the frequency of variable inclusion across the six models. Variables in dark gray are common to at least three of the six models, which was the criterion for inclusion in the synthesis (Sy) model. Light gray variables are common to two models. Variables in orange, yellow, light blue, beige, green and dark blue correspond to unique variables occurring, respectively, in B1, B2, B3, N1, N2, and N3 models. The 51 variables are numbered as follows, 1: Plankton, 2: Production, 3: Rearing density, 4: Shellfish aquaculture management, 5: Economic return; 6: Farming and land uses, 7: Nutrients, 8: Pollutants and bacteria, 9: Predation, 10: Social acceptability, 11: Unanticipated losses, 12: Undersized organic waste, 13: Integrated management, 14: Shellfish quality, 15: Waste collection, 16: Lease area, 17: Catchment runoff, 18: Certification, 19: Favorable weather regime, 20: General demand, 21: Solid waste, 22: Turbidity, 23: Wild shellfish, 24: Commercial fishing, 25: External production, 26: Market price, 27: Patrimonial values, 28: Recreational fishing, 29: Running costs, 30: Site suitability, 31: Infrastructure processing, 32: Aquaculture heritage, 33: By-product, 34: Local economy, 35: Tourism, 36: Demand for low quality, 37: High quality price, 38: Low quality price, 39: Other uses, 40: Conflicts with beach users, 41: Boating, 42: Response to mortality, 43: Stealing, 44: Benthos, 45: BOD (i.e., Biochemical Oxygen Demand), 46: Dams, 47: DOM (i.e., Dissolved Organic Matter), 48: Floods, 49: Light, 50: POM (i.e., Particulate Organic Matter), 51: Primary production monitoring.
For the sake of simplicity we focused the following comparison analyses on three of the variables which were identified as being important, and that can be related to the three pillars of sustainable development as applied to the socio-ecological system under study: “undersized organic waste” (classified here in the environmental dimension), “economic return” (classified here in the economic dimension), and “social acceptability” (classified here in the social dimension). Table 3 gives information on the occurrence of those variables in the different models.
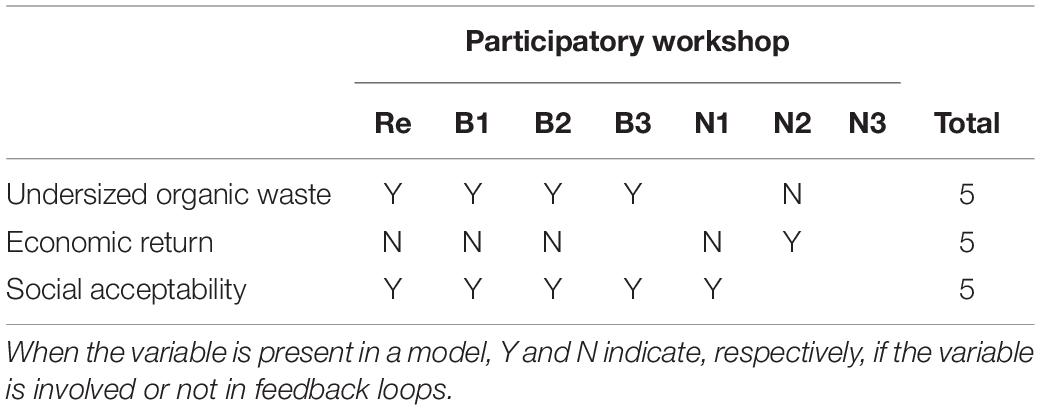
Table 3. Occurrence of the three variables “undersized organic waste,” “economic return,” and “social acceptability” in the workshop models.
The three variables “undersized organic waste,” “economic return” and “social acceptability” are present in five out of the seven models and are all absent from the N3 model (Table 3). While “economic return” is involved in feedback loops in only one model (N2 model), “social acceptability” participates in feedback loops in each of the five models where it is represented, and “undersized organic waste” in four models. According to these representations, “social acceptability” and “undersized organic waste” influence more variables in the socio-ecological system than the “economic return” variable that is mainly a “receiving node.” This indicates an emphasis on the former variables rather than the latter in relation to the sustainable development of shellfish aquaculture in the area, according to stakeholders and researchers.
Issues Identified During Workshops
We identified the key issues relating to the sustainable development of shellfish aquaculture during the workshops as detailed in Table 4 according to broad categories.
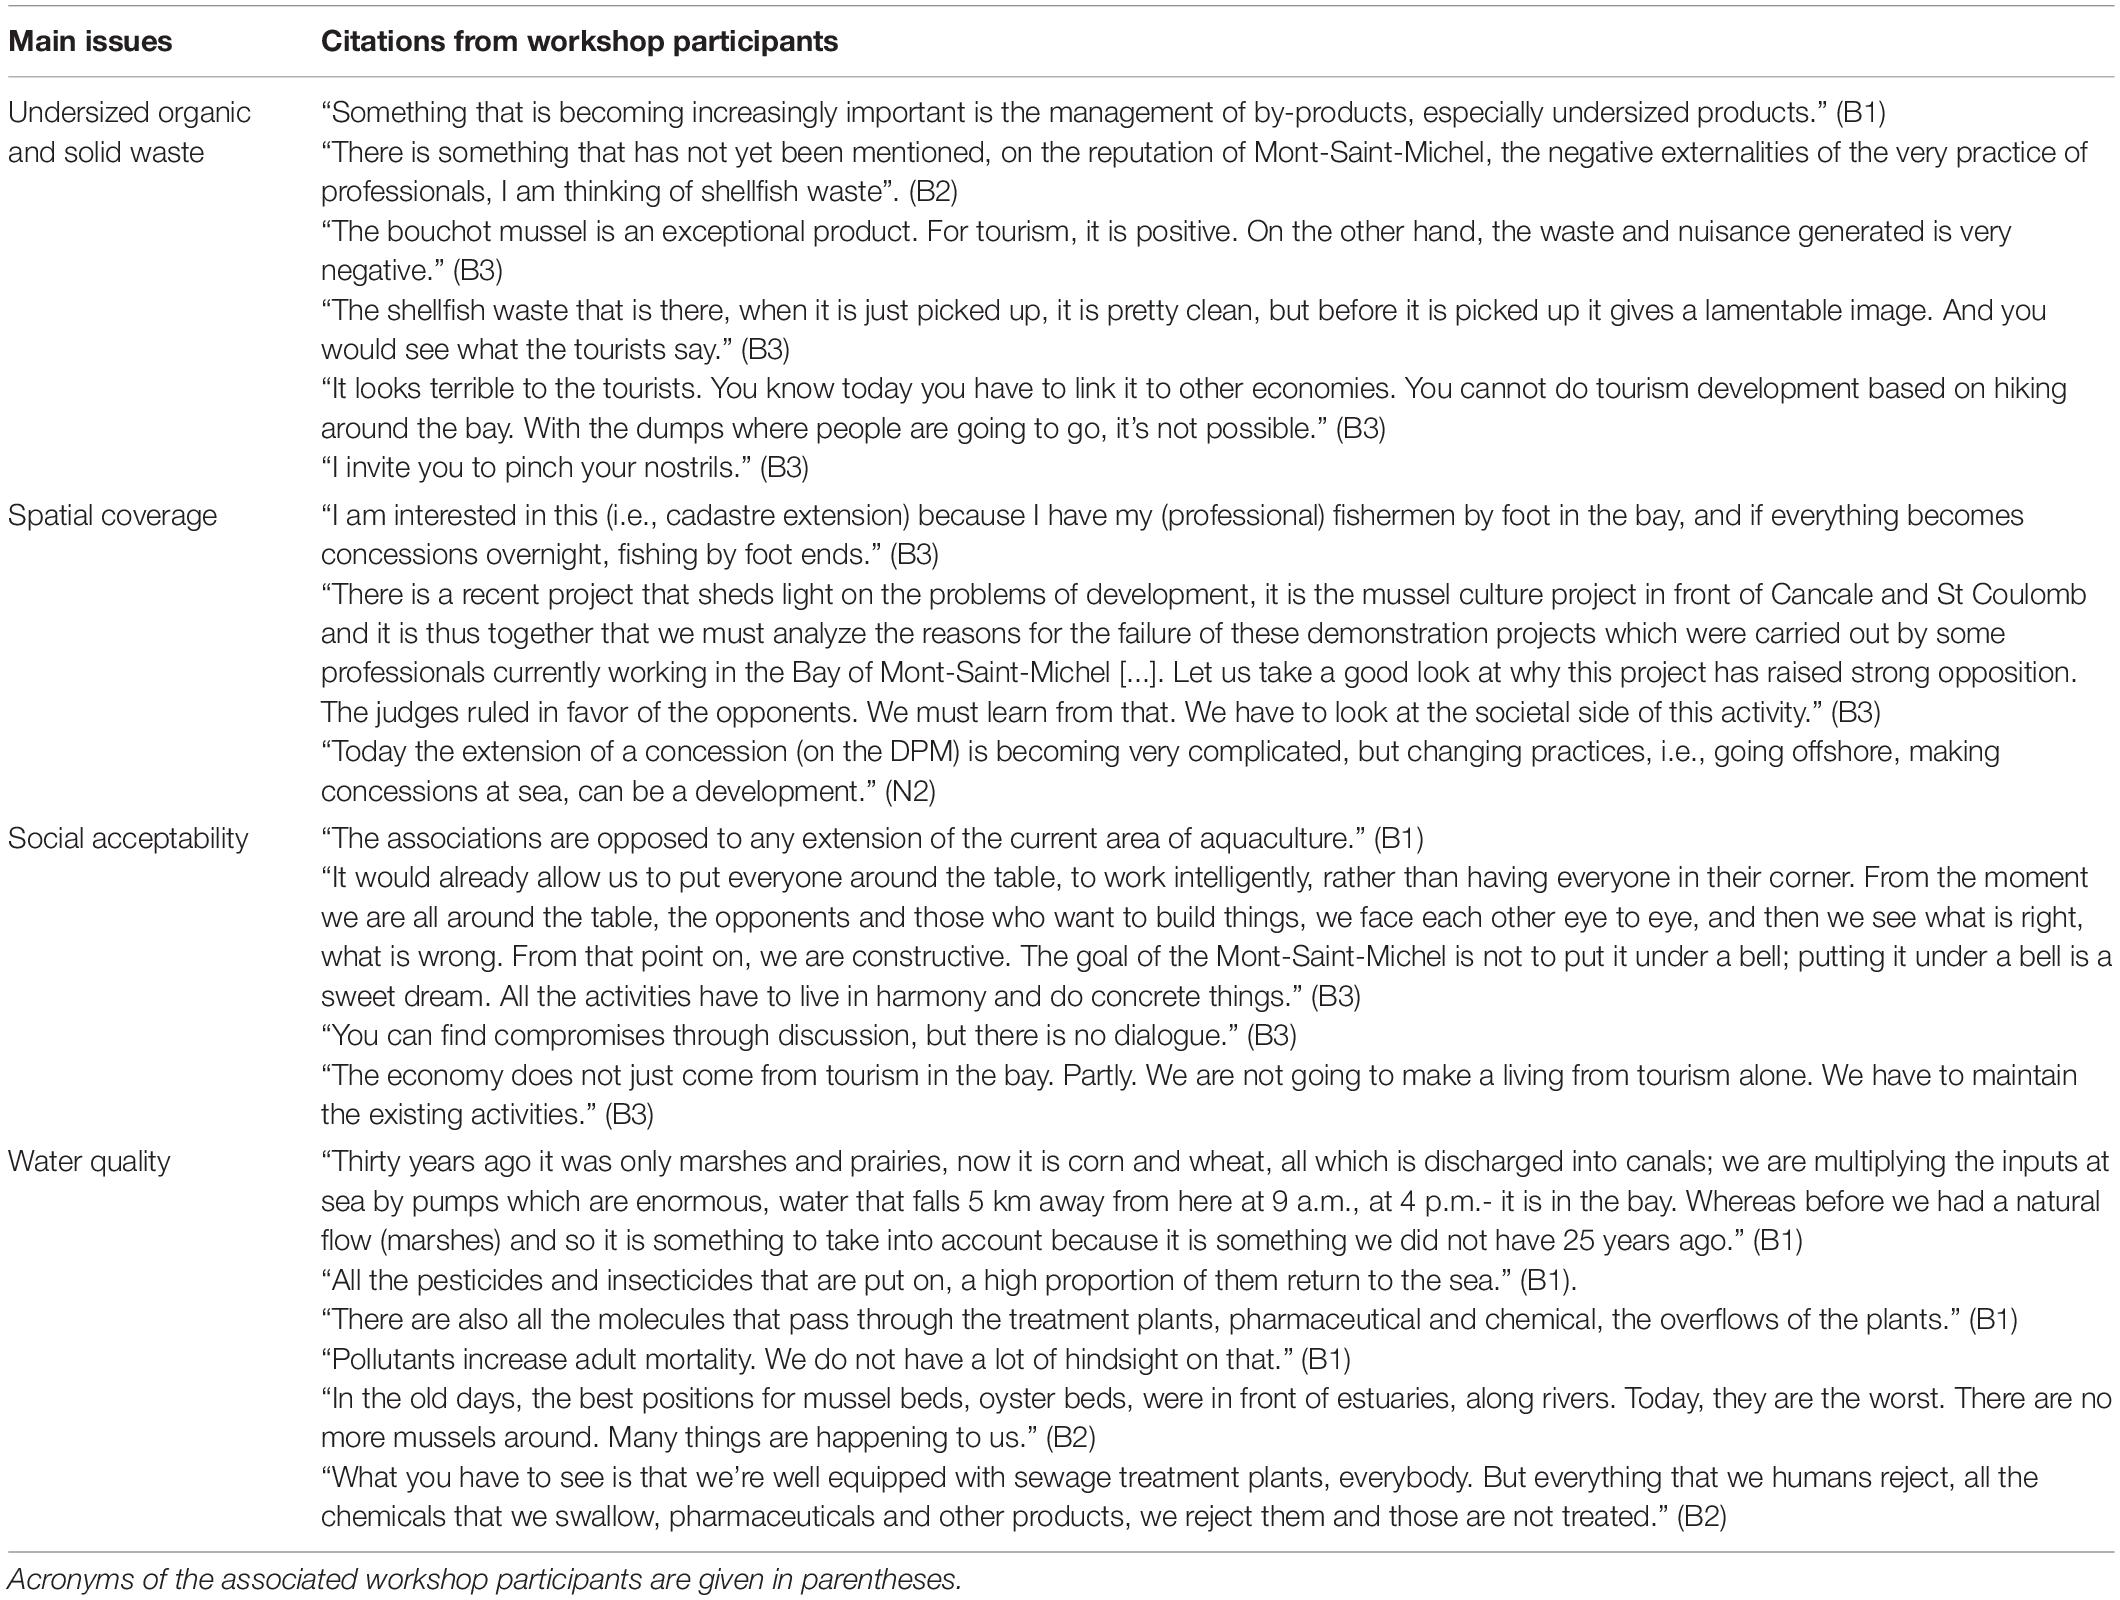
Table 4. Main issues identified during workshops, with some related citations.
Biological wastes produced by mussel farmers are at the root of conflicts between users. This waste is due to the mechanization of mussel harvesting and local production techniques using wooden poles. The growth of the mussels placed in the central part of the poles is lower because their access to food is physically more limited. As a result, the smaller mussels produced during the harvesting process are not marketable and are deposited on the shoreline along with broken mussels. This waste from undersized mussels and shellfish aquaculture material (i.e., bags, ropes, etc.) deposited on the foreshore appeared to be an important issue, particularly in the Bay of Mont-Saint-Michel. In Normandy, the problem is not as pronounced as the area is less touristy, spatial spread is greater and sand covers the waste at high tide (making it invisible when the sea retreats), which is not the case in Brittany. However, when this issue was raised in Normandy, managers pointed out that it would certainly be a problem in the future. While the variable “undersized organic waste” appearing in five workshops (Re, B1, B2, B3, N2) only concerned mussel farming, negative externalities can be applied to shellfish aquaculture in general.
Spatial coverage, i.e., the space occupied by shellfish aquaculture concessions (variable “lease area”), also appeared to be an important issue, whether on the foreshore or in the open sea for shellfish farming projects. Indeed, there is competition for space due to the different uses taking place in the coastal zone. Therefore, “other stakeholders” such as professional fishers by foot and local residents are very concerned by potential shellfish aquaculture spatial extensions.
Water quality, whether in relation to its nutrient richness or pollutant content, was discussed in many workshops and appeared in B1, B2, and N1 models with the “nutrients” and “pollutants and bacteria” variables. Coming from the land via watersheds that drain products from agriculture and human activities, nutrients, and pollutants are directly linked to plankton in the models, but also to the conditions under which shellfish are sold (increased operating costs due to the need for purification for instance).
Social acceptability and the need for consultation also seemed to be a key issue for the sustainability of shellfish aquaculture activity in the NBG, especially in the Bay of Mont-Saint-Michel. Social acceptability is linked to the other issues raised such as the problem of undersized organic waste and extension of the spatial coverage of shellfish aquaculture concessions.
Synthetic Representation
A synthetic model (or sign-directed graph) of the NBG socio-ecological system was built with variables that were present in at least half of the six stakeholder workshop models (see Figures 2, 3) and is displayed in Figure 4. All the direct links between the selected variables included in the stakeholder models were also included in the synthetic model (called hereafter Sy model), except for three links which were adjusted in the aggregation process. The adjusted links were: the direct positive link from “lease area” to “economic return” of the N1 model (this effect was taken into account in the synthetic model through the positive link from “lease area” to “production”), the direct negative link from “lease area” to “pollutants and bacteria” of the N2 model (which was not considered valid by the research team), and the direct negative link from “shellfish aquaculture management” to “social acceptability” of the B3 model (since the meaning of the variable “shellfish aquaculture management” in B3 was slightly different to the meaning of this variable in the synthetic model, thus changing the meaning of the link in the Sy model). Only one link was characterized by opposite signs across the group-specific models, namely the link from “shellfish aquaculture management” to “lease area.” This link was positive in the B3 model and negative in the N1 model. Given the meaning attributed to the “shellfish aquaculture management” variable in the Sy model, we decided that a negative link should be applied in the Sy model.
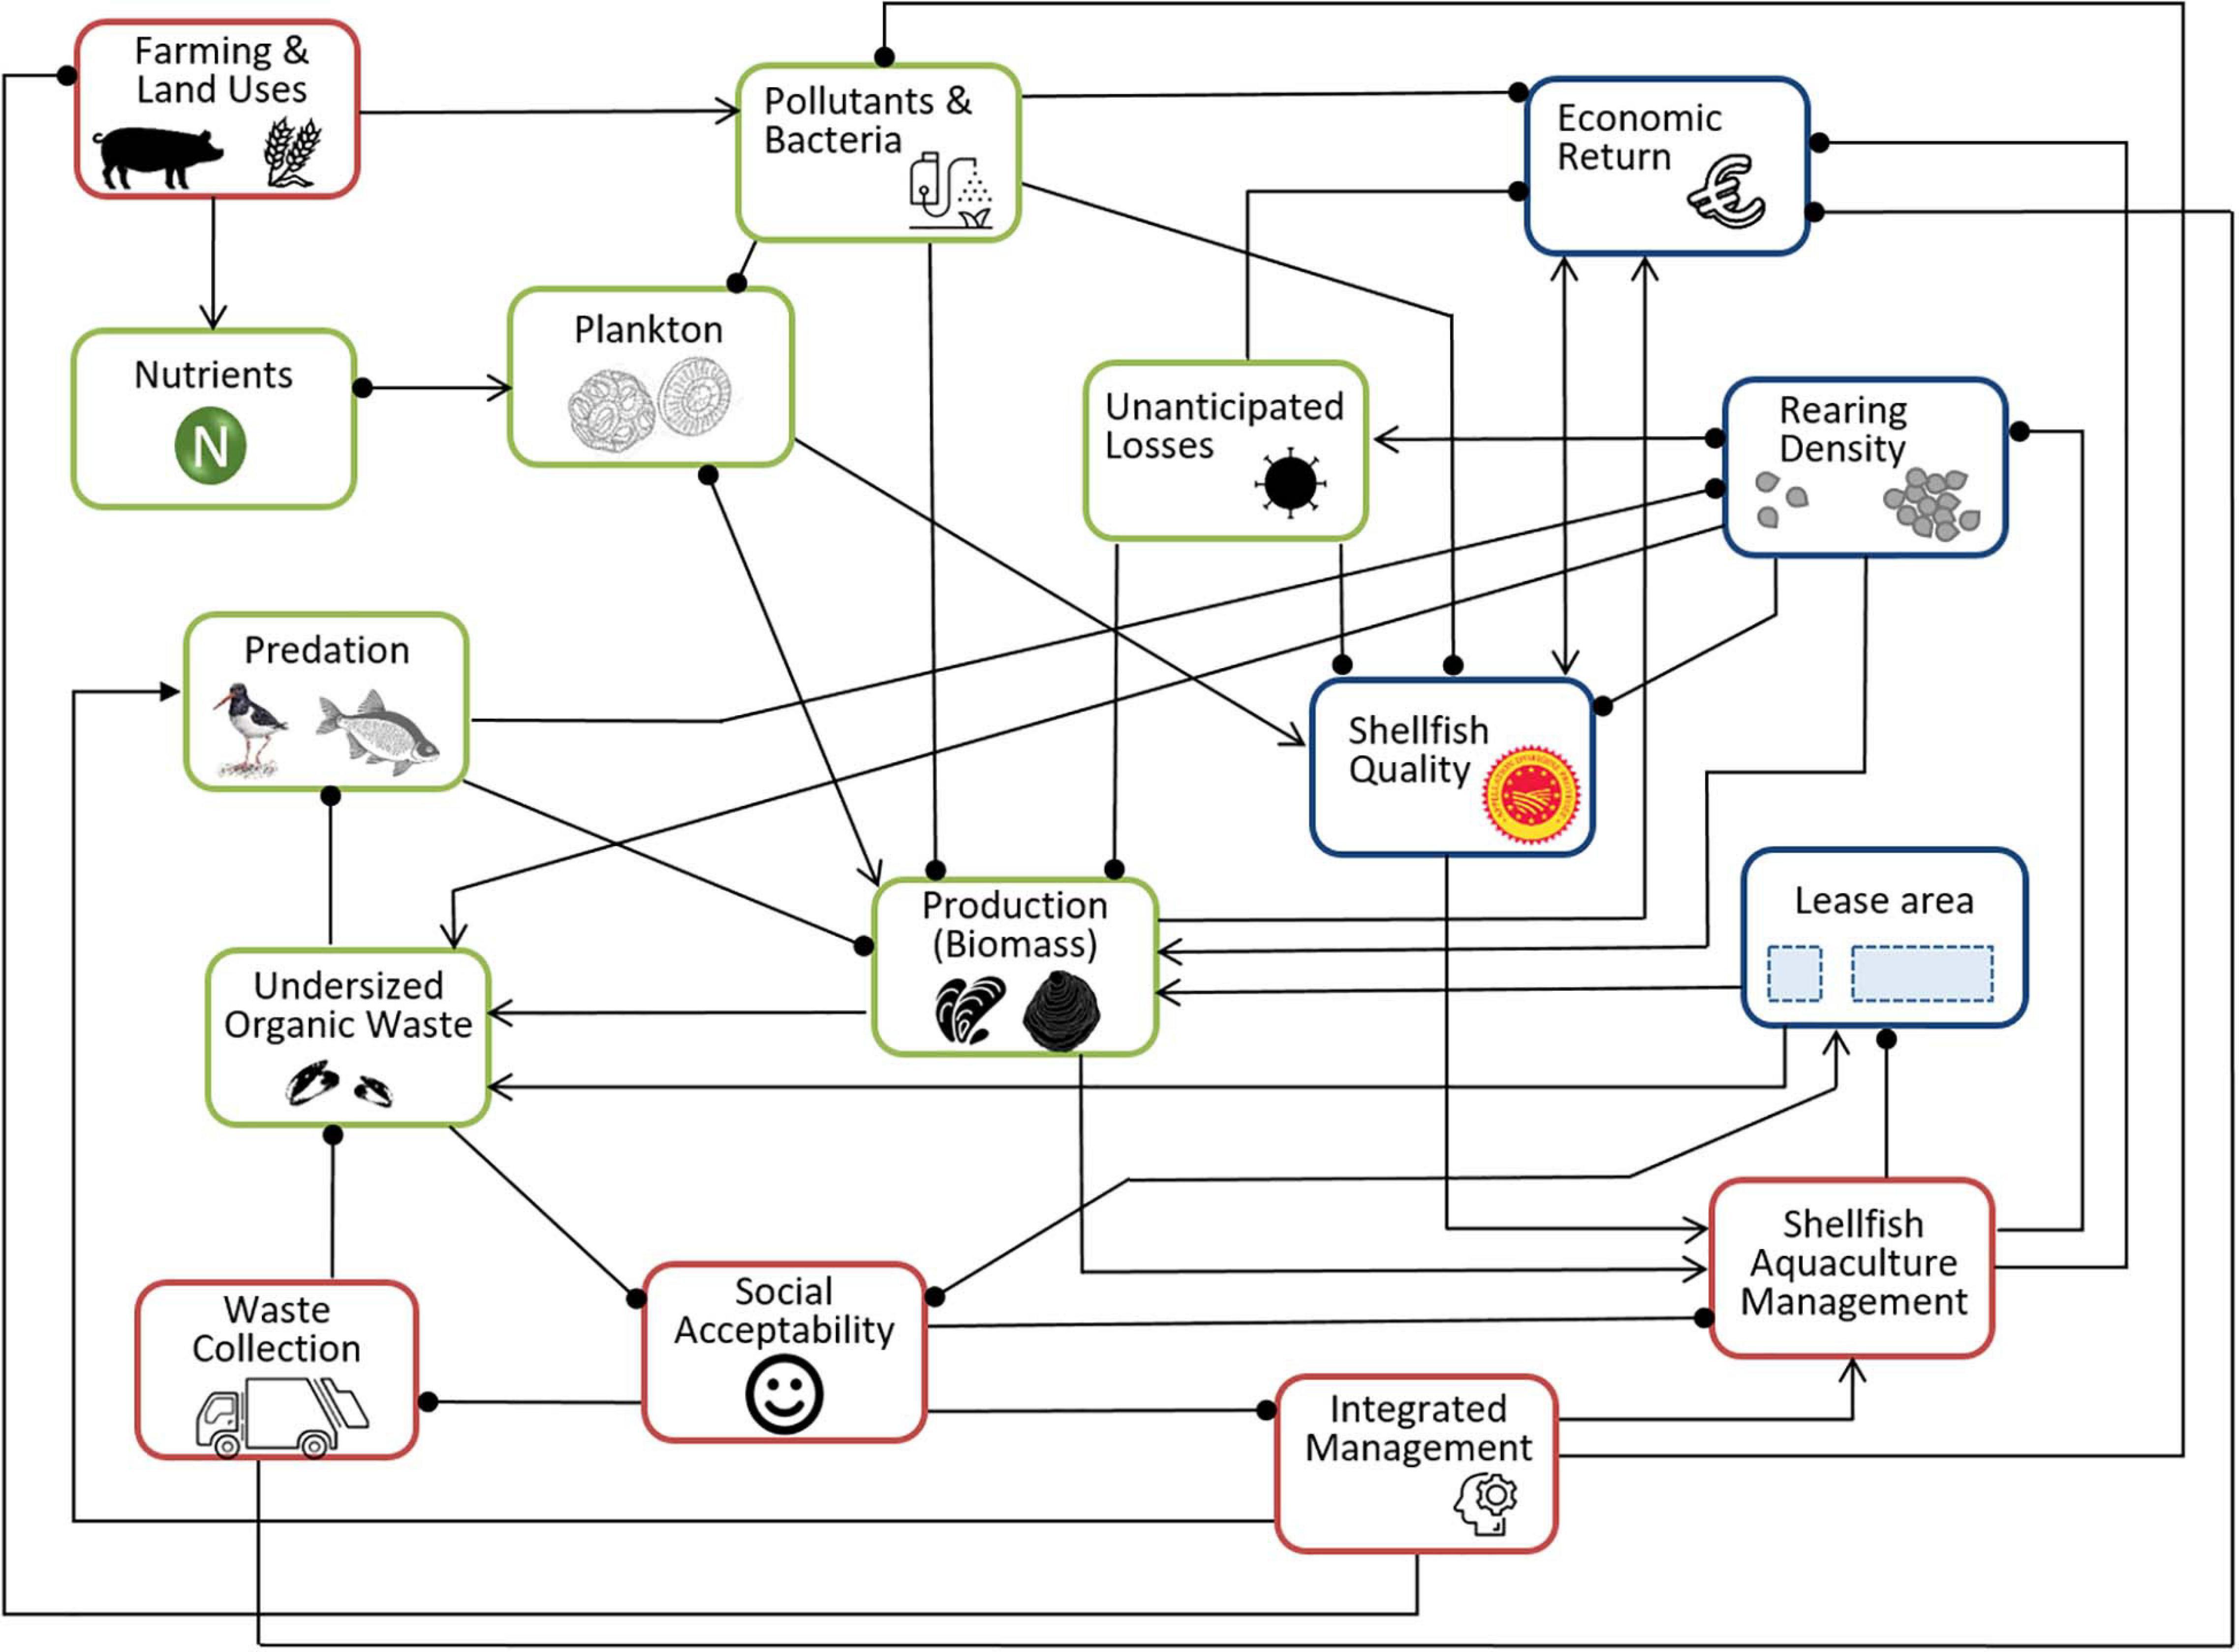
Figure 4. Synthetic sign-directed graph of the NBG socio-ecological system, with environmental variables in green; economic variables in blue and social variables in red.  indicates positive interaction,
  indicates negative interaction.
The synthetic model was presented to and validated by the stakeholders during the debriefing meeting that brought together the participants of the six participatory workshops. The validation was done by consensus and did not generate much debate between regions or stakeholder groups. Choices made by the scientists of removing the three links mentioned above and of having a negative link from “shellfish aquaculture management” to “lease area” were also discussed and validated. Furthermore, minority opinions were discussed at the meeting, especially regarding the specific variables. These discussions did not reveal the need to include any other variable in the Sy model. The description of all links in the synthetic model, as well as a table with the definitions of the variables are provided in Supplementary Material.
Note that interactions between variables occur within and between the three ecological, economic and social dimensions (Figure 4). This demonstrates the relevance of working at the scale of a socio-ecological system, in which ecological, economic, and social aspects can lead to complex dynamics. While environmental and social dimensions were the most represented, with, respectively, seven and five variables, the economic dimension was less detailed with only four variables. The economic variables related to shellfish quality, rearing density, lease area, and economic returns. As said previously, this last variable—in the vast majority of the models where it appears—had no impact on the socio-ecological system, but only received links. This means that, in the synthetic representation, it was not considered an element that directly influences shellfish aquaculture management or production (biomass). This may seem counterintuitive insofar as the economic results of the activity necessarily influence medium and long-term production strategies. However, within short-term production cycles, companies can only implement marginal changes after seeding. Hence, the economic dimensions of the models considered are only short-term in scope. In the synthetic model, production is influenced by several negative feedback loops of diverse nature. For instance, production is regulated by natural mechanisms (e.g., negative feedback loop “production—plankton—production”), administrative mechanisms (e.g., negative feedback loops “production—shellfish aquaculture management—rearing density—production” and “production—shellfish aquaculture management—lease area—production”) and social mechanisms (e.g., negative feedback loop “production—undersized organic waste—social acceptability—shellfish management—rearing density—production”). The feedback loop “production—shellfish aquaculture management—rearing density—production” relates to the existing management regime aimed at controlling rearing density, which affects the productivity and quality of shellfish. Undersized organic waste relates to undersized mussels that are deposited on the shoreline and become organic waste, thus affecting the social acceptability of the sector. Interestingly, social acceptability—in this model—directly negatively affects three components, but only the undersized organic wastes and lease areas are directly negatively affecting it. The representation of the socio-ecological system did not focus only on marine interactions but also included land/sea interactions. The link between land and sea was indeed highlighted by the variable “farming and land uses” which provides nutrients useful for the growth of plankton, but also pollutants that have a negative impact on production.
Qualitative Predictions of Responses to Sustained Perturbation
Using the synthetic model (Figure 4), we estimated the consequences of six selected perturbation scenarios, focusing on the key issues identified with stakeholders in the workshops (section “Issues Identified During Workshops”). These were related to (i) increase in lease area, (ii) decrease in farming and land uses, (iii) improvement in waste collection, (iv) better management of shellfish aquaculture practices and (v) better integrated management, as well as (vi) decrease in rearing density. Figure 5 presents the predicted responses of variables to the various scenarios using the red-gray-blue color scaling described in section “Qualitative Predictions of Responses to Sustained Perturbation.”
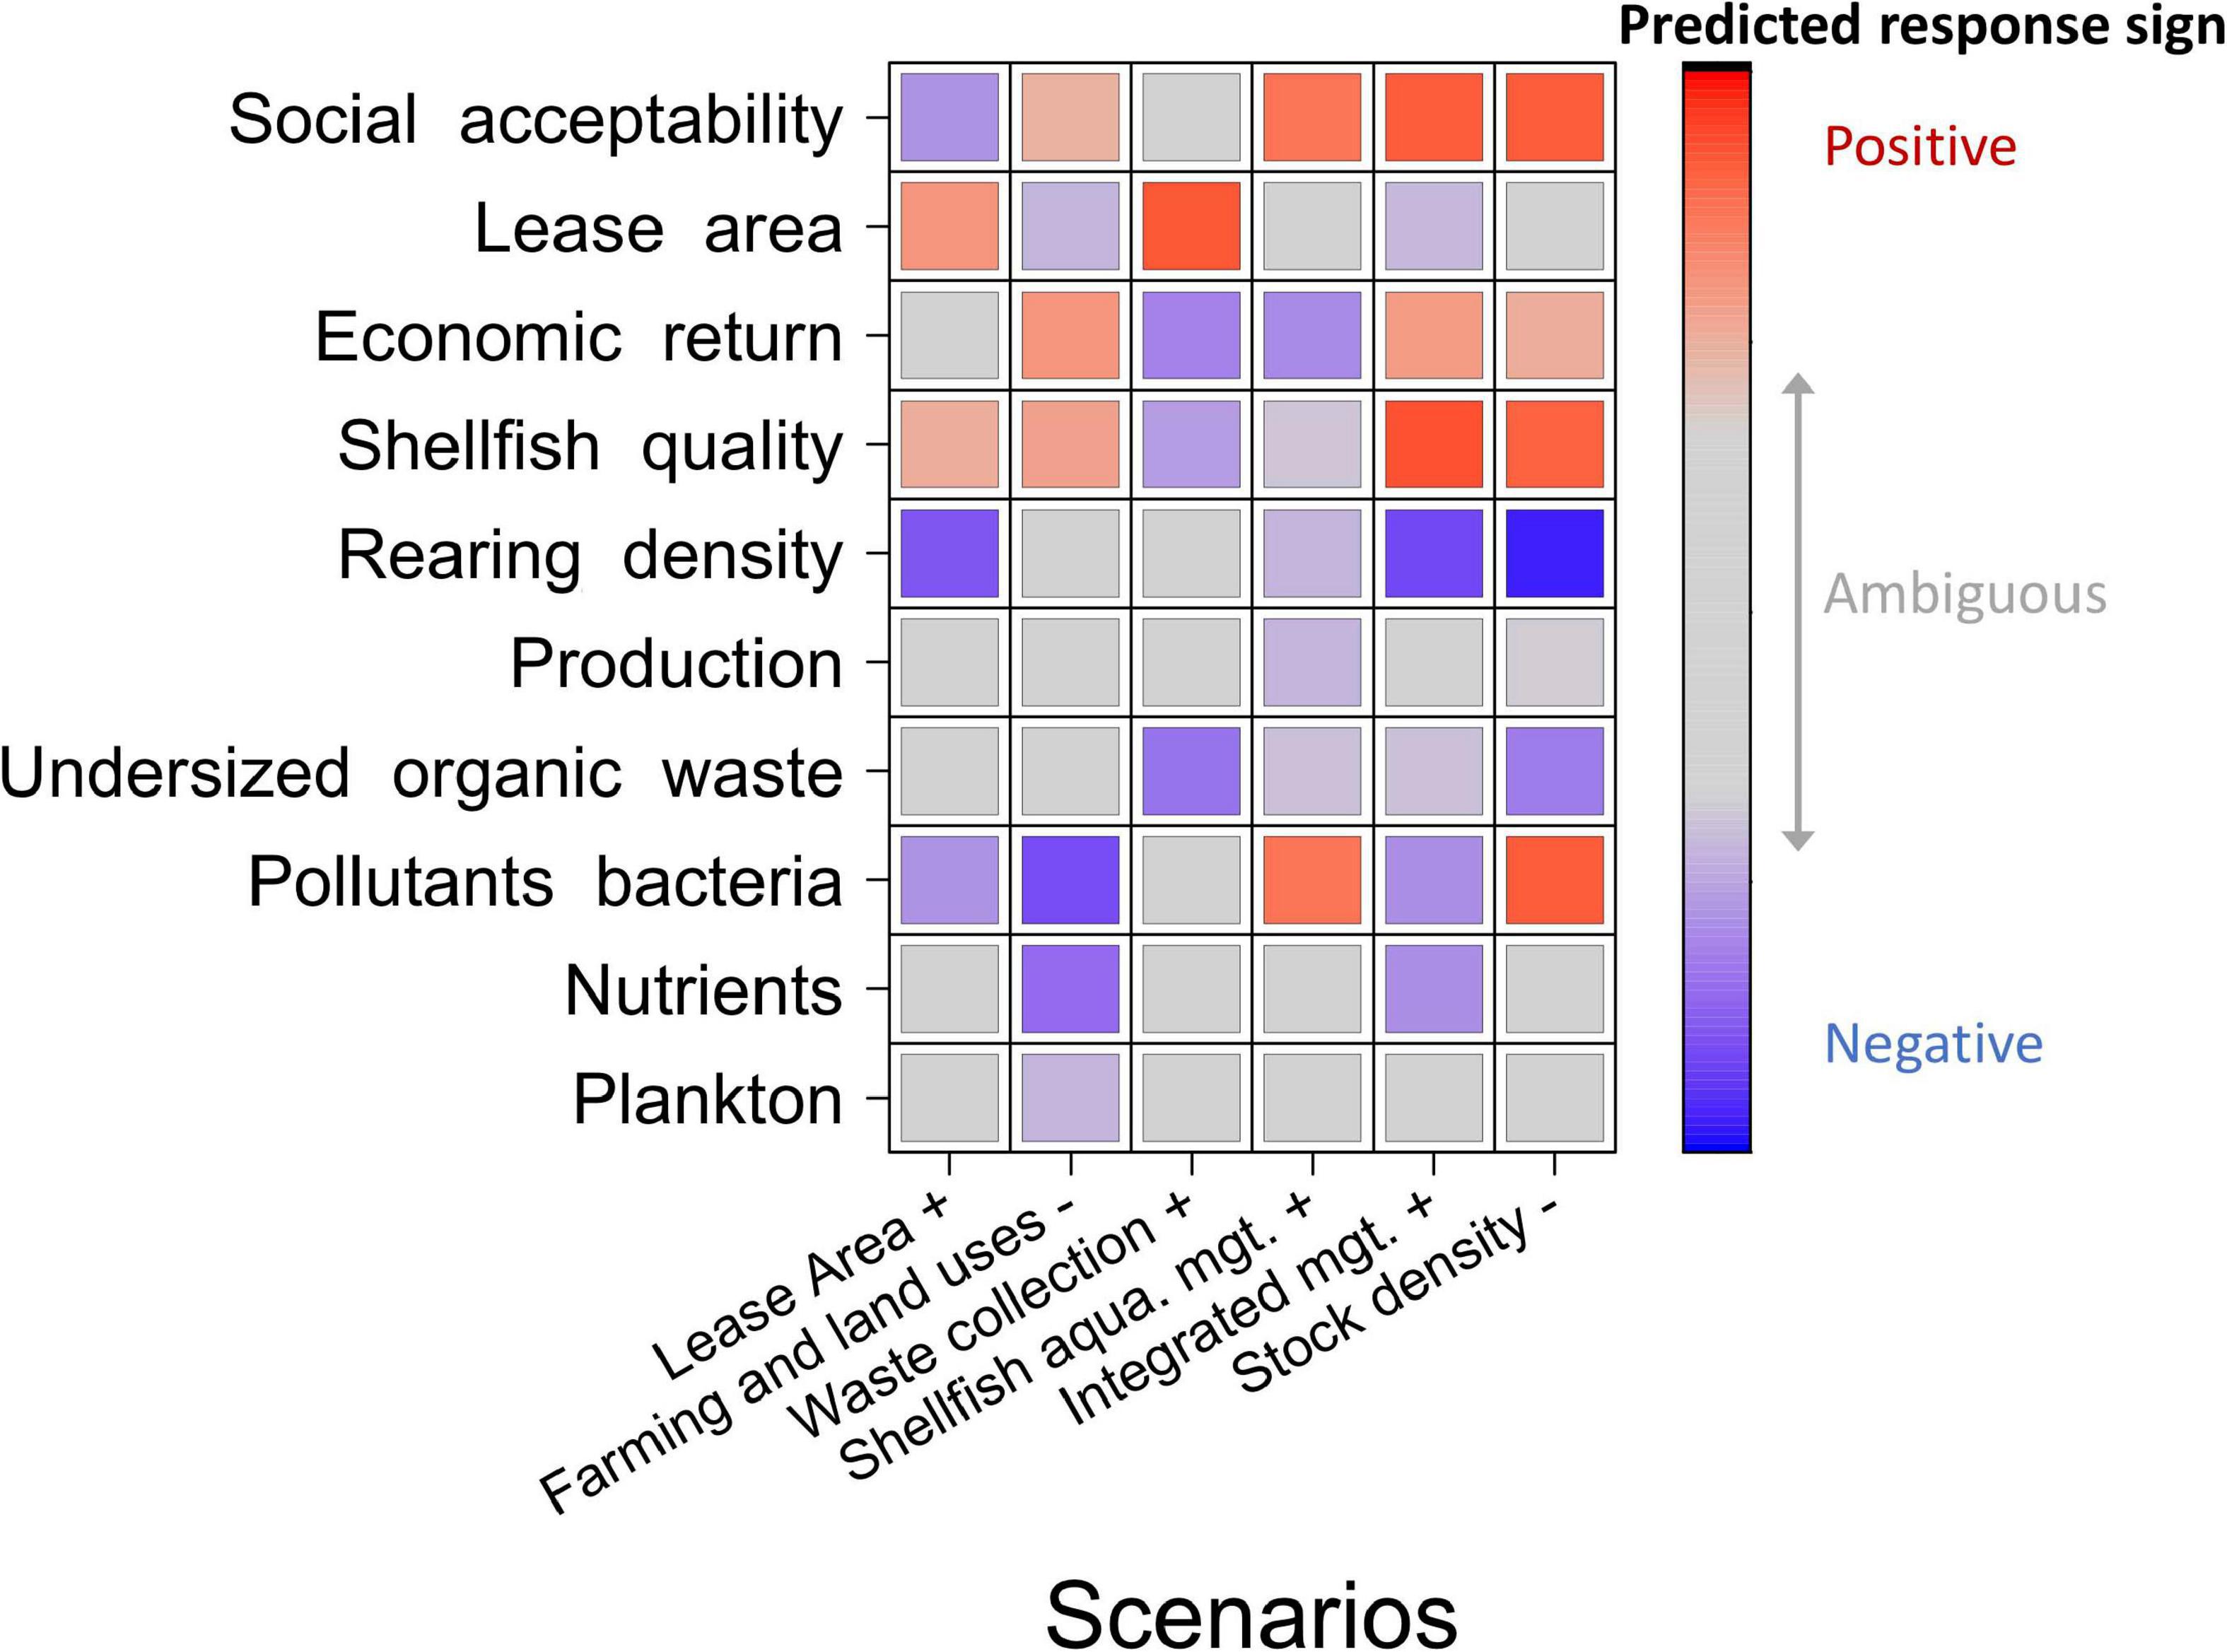
Figure 5. Predicted qualitative responses of variables to alternative perturbation scenarios (x-axis, from left to right: increase in lease area, decrease in farming and land uses, intensification of waste collection, improvement in shellfish aquaculture management, improvement in integrated management, and decrease in rearing density) according to the synthetic model (Figure 4). Legend: colored squares represent the sign of response of each variable (y-axis) to a given scenario (x-axis): white for neutral (no effect of the scenario on response variable); gray for ambiguous; red for positive; blue for negative. When responses are positive or negative, the degree of shading increases with prediction uncertainty.
The first column to the left of Figure 5 details qualitative predictions of variable responses to an increase in shellfish farming lease area. Under this scenario, model predictions estimate “production” to respond ambiguously (as shown in gray at row 6 from top), “rearing density” to decrease (as shown in deep blue) and expectedly “lease area” is most likely to increase (as shown in darkish red). This positive predicted response is not at its highest level, due to the existence of opposite feedback loops between the “lease area” variable and this same variable. A scenario of diminution in rearing density was predicted to improve the social acceptability of shellfish aquaculture (as shown in dark red at row 1, column 6 in Figure 5), which indirectly releases regulation via the integrated management/management of shellfish aquaculture practices feedback loop and counter-intuitively allows for pollution to develop (i.e., increase in “pollutants and bacteria” variable). Under this scenario, “economic return” and “shellfish quality” are also predicted to improve, while “undersized organic waste” is predicted to decrease. A reduction in farming and land uses were also likely to have an overall positive effect on “shellfish quality,” “economic return,” and “social acceptability,” with uncertain consequences on “undersized organic waste.” Enforcement of integrated management measures (i.e., “increase in integrated management” scenario) facilitates higher economic returns due to an increase in shellfish production quality (as a result of a combination of decreased pollution and lower rearing density) over quantity.
We also analyzed qualitative predictions across the eight different models produced; i.e., the six stakeholder-specific models (B1, B2, B3, N1, N2, and N3), the synthetic (Sy) model, and the researcher (Re) model. Figure 6 displays results for the scenarios related to a decrease in rearing density and an improvement in management of shellfish aquaculture practices on three impacted variables (“social acceptability,” “economic return,” and “undersized organic waste”). These three variables are all absent from the N3 model that hence cannot predict their responses. Results of perturbations on other variables and from the other four scenarios are available in the Supplementary Material.
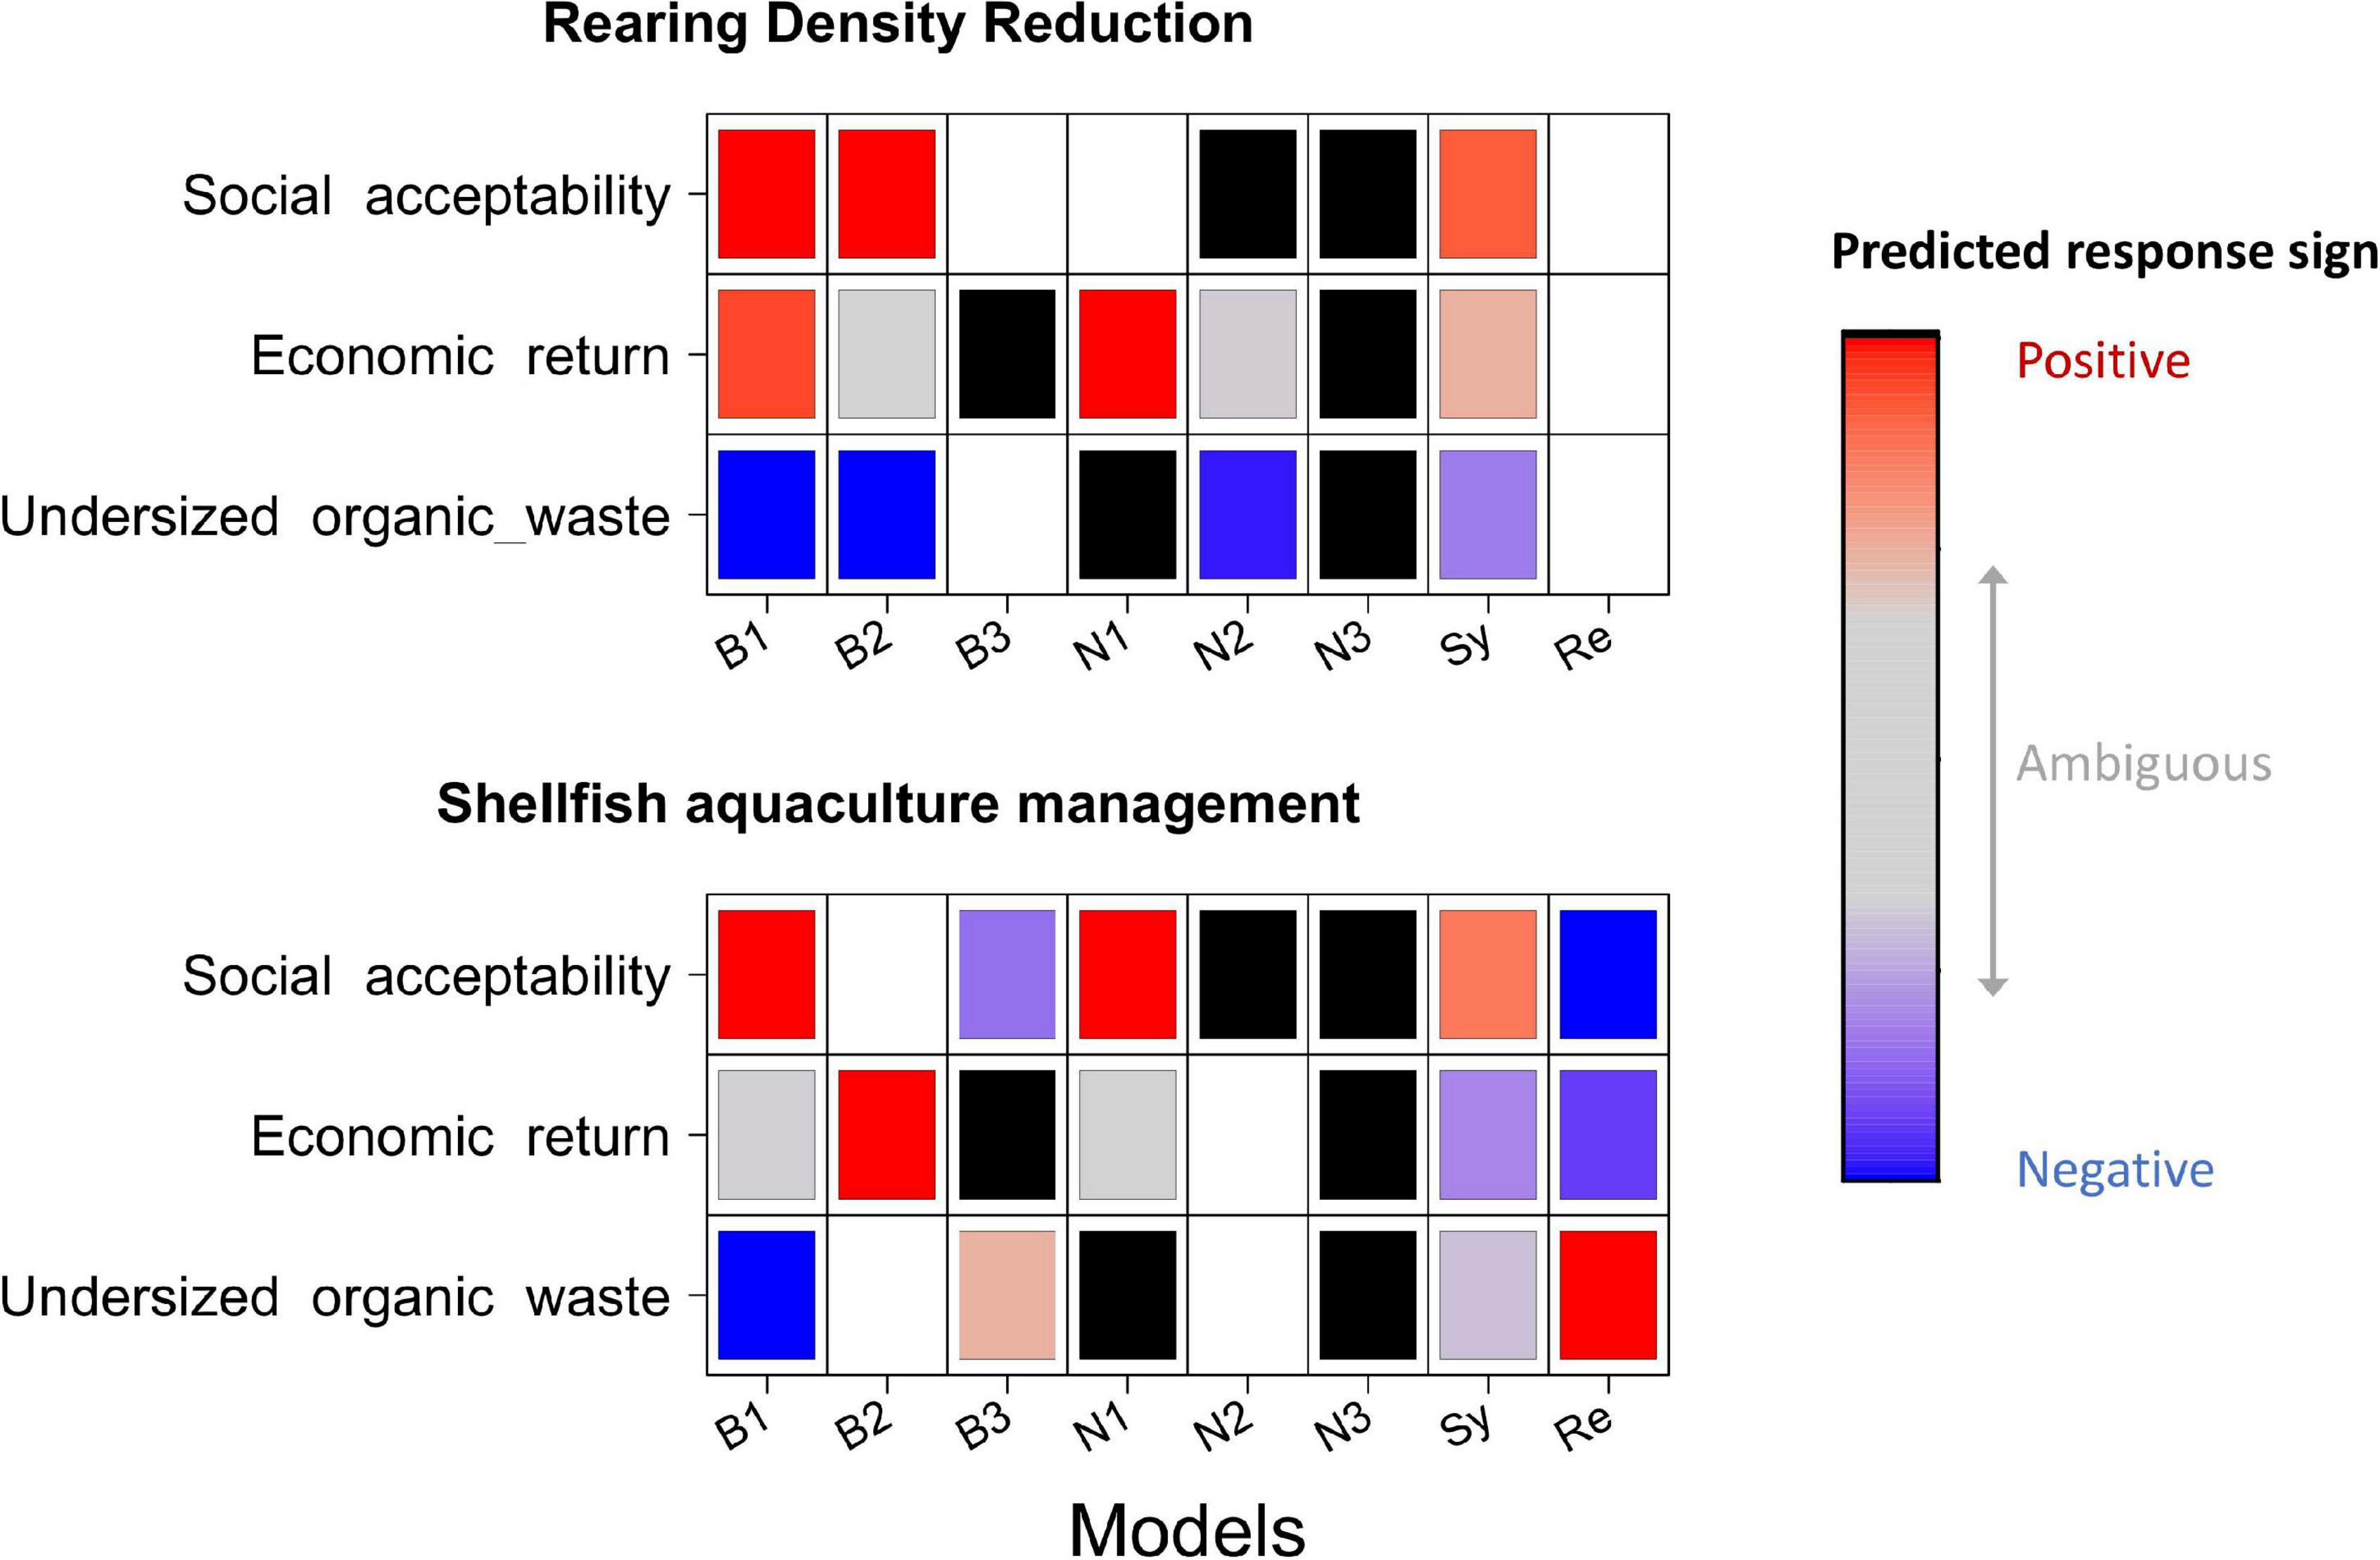
Figure 6. Predicted qualitative responses of variables (y-axis) to a decrease in rearing stock density (top) and to an improvement in management of shellfish aquaculture practices (bottom) according to the eight models (x-axis). “Sy” corresponds to the synthetic model, and “Re” to the researcher model. Legend: colored squares represent the sign of response of each variable (y-axis) to a given scenario (x-axis): white for neutral (no effect of the scenario on response variable); gray for ambiguous; red for positive; blue for negative. When responses are positive or negative, the degree of shading increases with prediction uncertainty. Black squares correspond to the absence of the scenario variable or/and of the response (i.e., impacted) variable in a given model.
Variable responses are quite similar across models with a scenario of reduction in rearing density (Figure 6 top panel). The responses of the social acceptability and undersized organic waste variables are qualitatively the same (respectively positive and negative) for all models having the variables, with more or less certainty depending on the model. Regarding economic return, while B1, N1, and Sy models predict a positive response, this response is ambiguous with B2 and N2 models; this means that with these two models, we cannot predict whether economic return will increase or decrease in such a scenario. In summary, the reduction in rearing density scenario offers a sustainable response from the system with an overall increase in social acceptability and economic return and a decrease in undersized organic waste.
While the responses were qualitatively similar between the models for the scenario of reduction in rearing density, the scenario of a more efficient management of shellfish aquaculture practices (Figure 6 bottom panel), led to very heterogeneous responses between models. For instance, the Re and B1 models produce opposite results with regard to social acceptability and undersized organic waste variables, whereas the results with the Re and B3 models are qualitatively more similar. This highlights the need to consider the full diversity of models reflecting multiple stakeholder perspectives, in examining system responses to a particular scenario. It is important to note that heterogeneity in responses between models increases with the number of impacted variables considered.
Uncertainty in Qualitative Predictions
Here, we analyzed how uncertainty in qualitative predictions arises both from (i) uncertainty in model structure (i.e., differences across alternative models; Figure 7), and (ii) ambiguity in model predictions due to counteracting feedback loops (i.e., due to structural complexity that make qualitative sign predictions inconclusive; Figure 8).
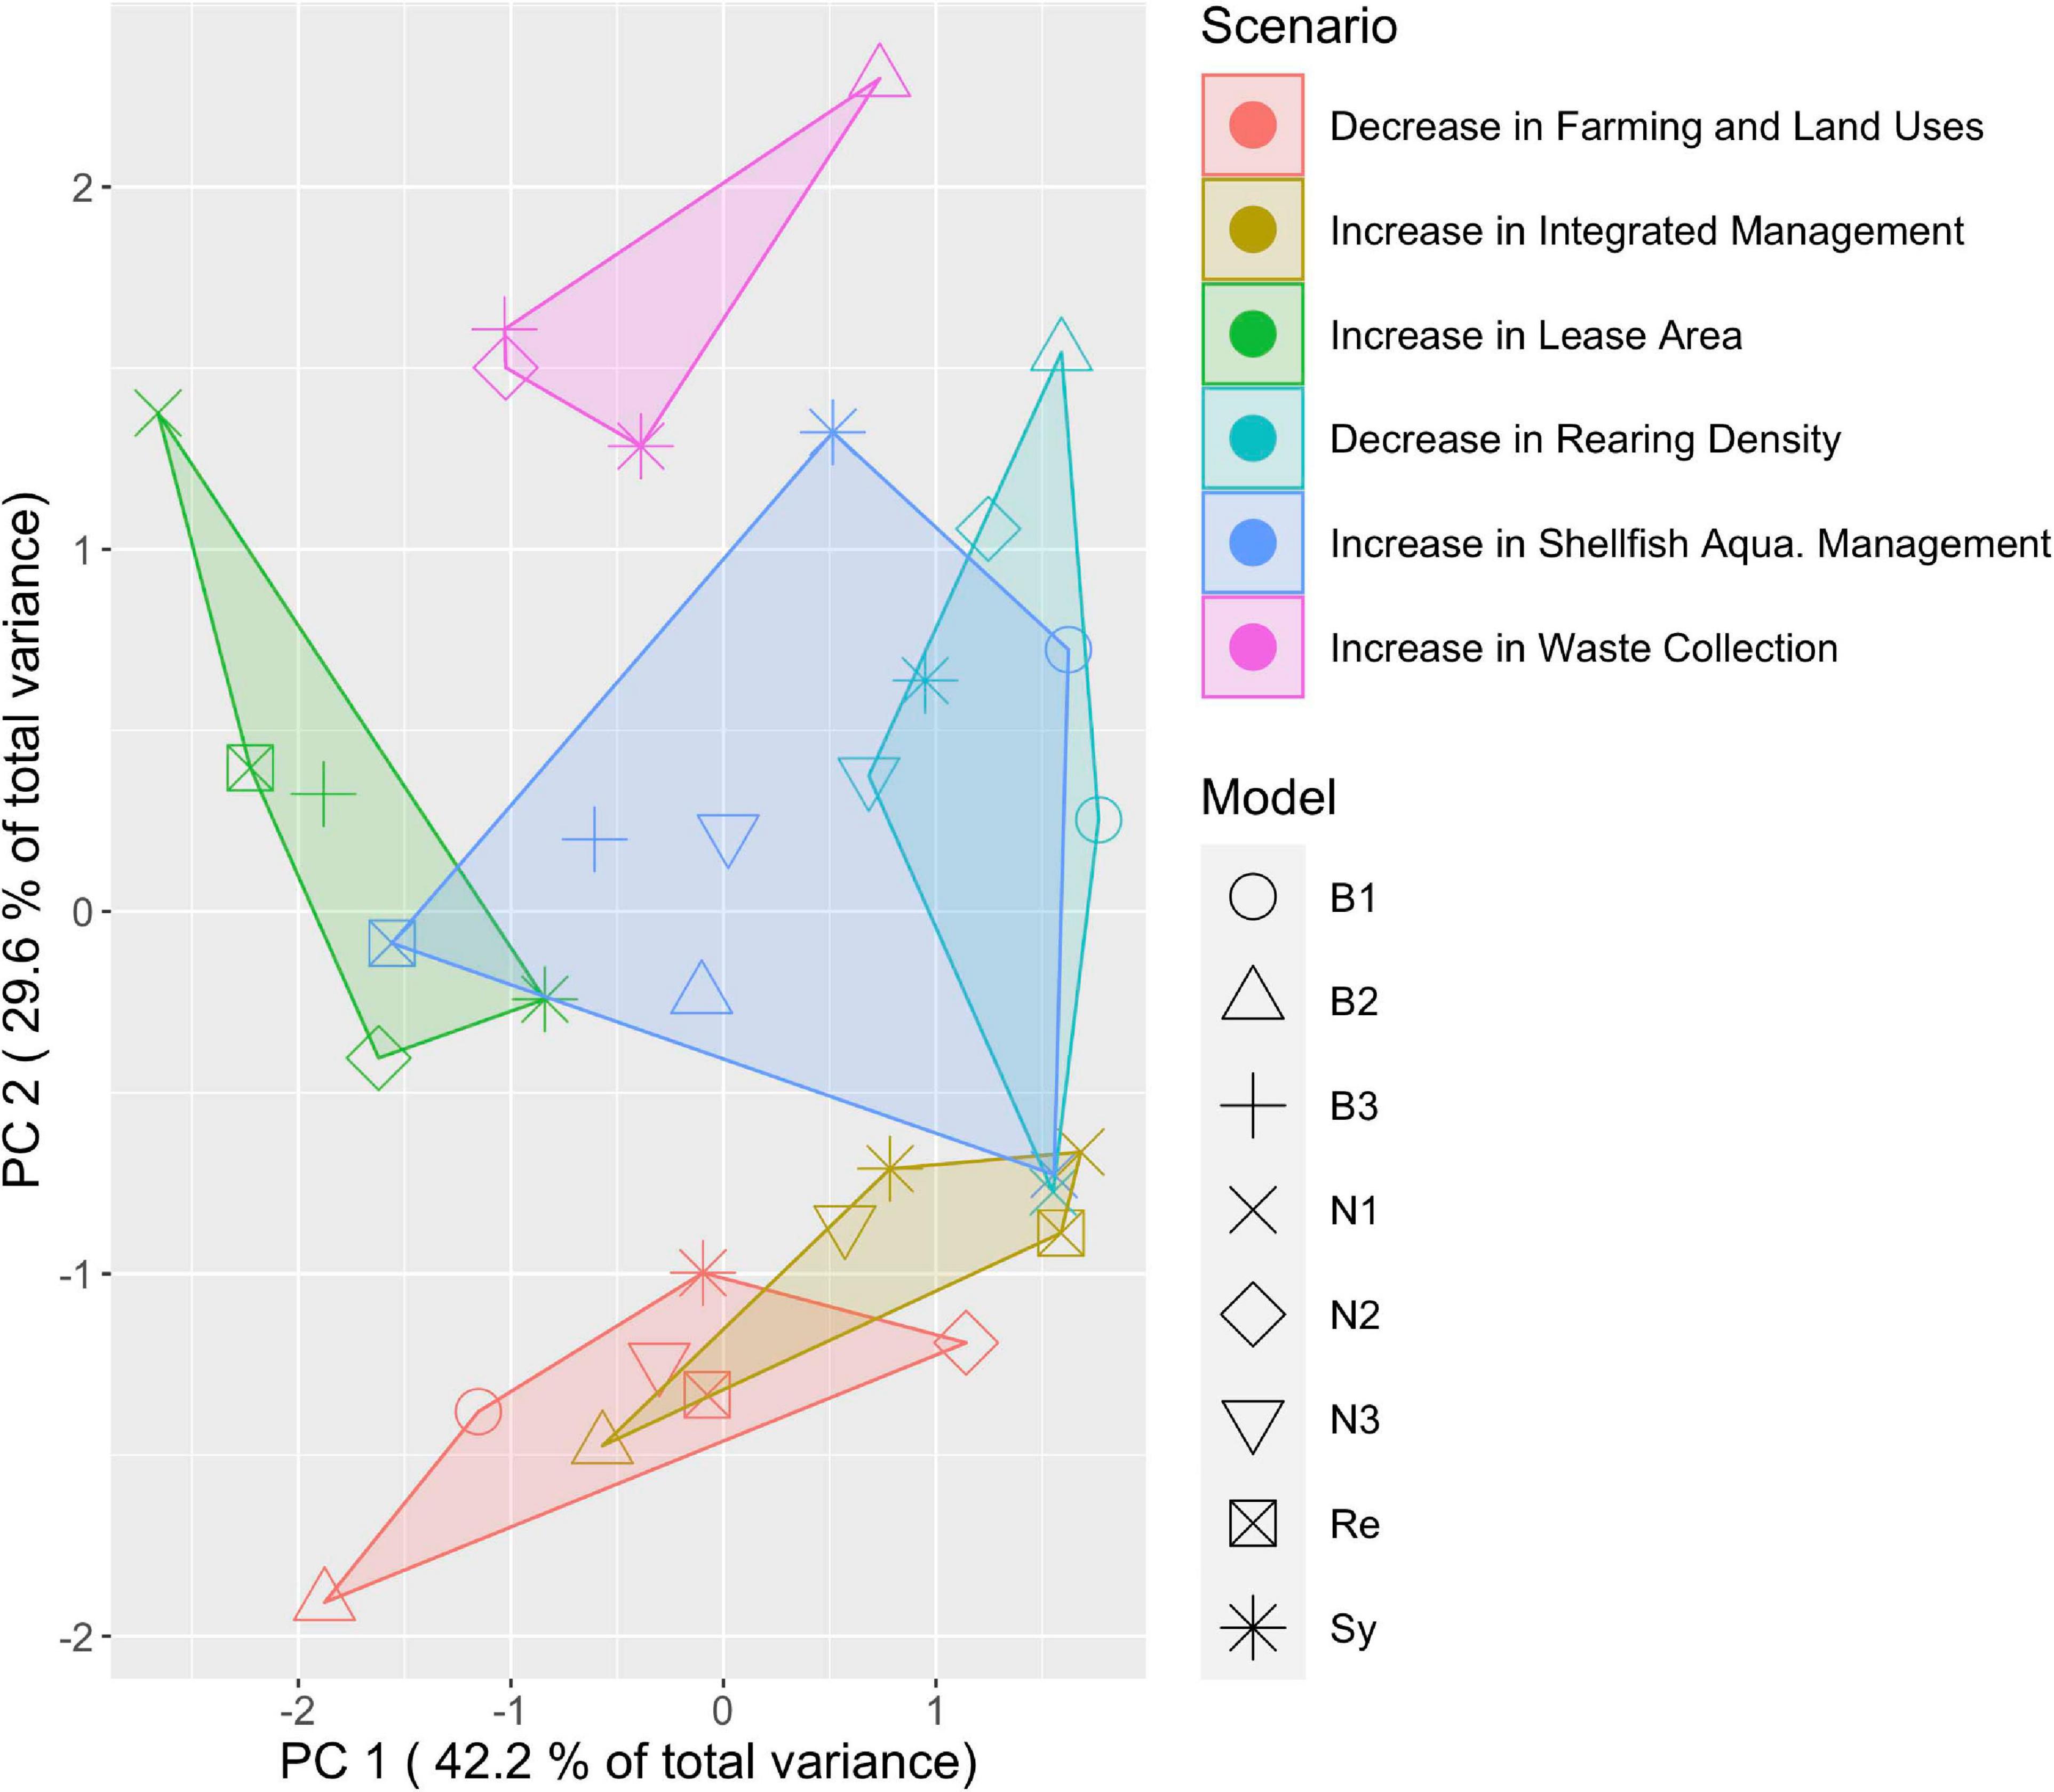
Figure 7. Summary of variability in predictions across alternative models and scenarios. Scores of model predictions across 10 response variables onto the first two PCA axes (that capture ∼72% of total variance) reflect consistencies and inconsistencies in predicted qualitative responses to scenarios across models.
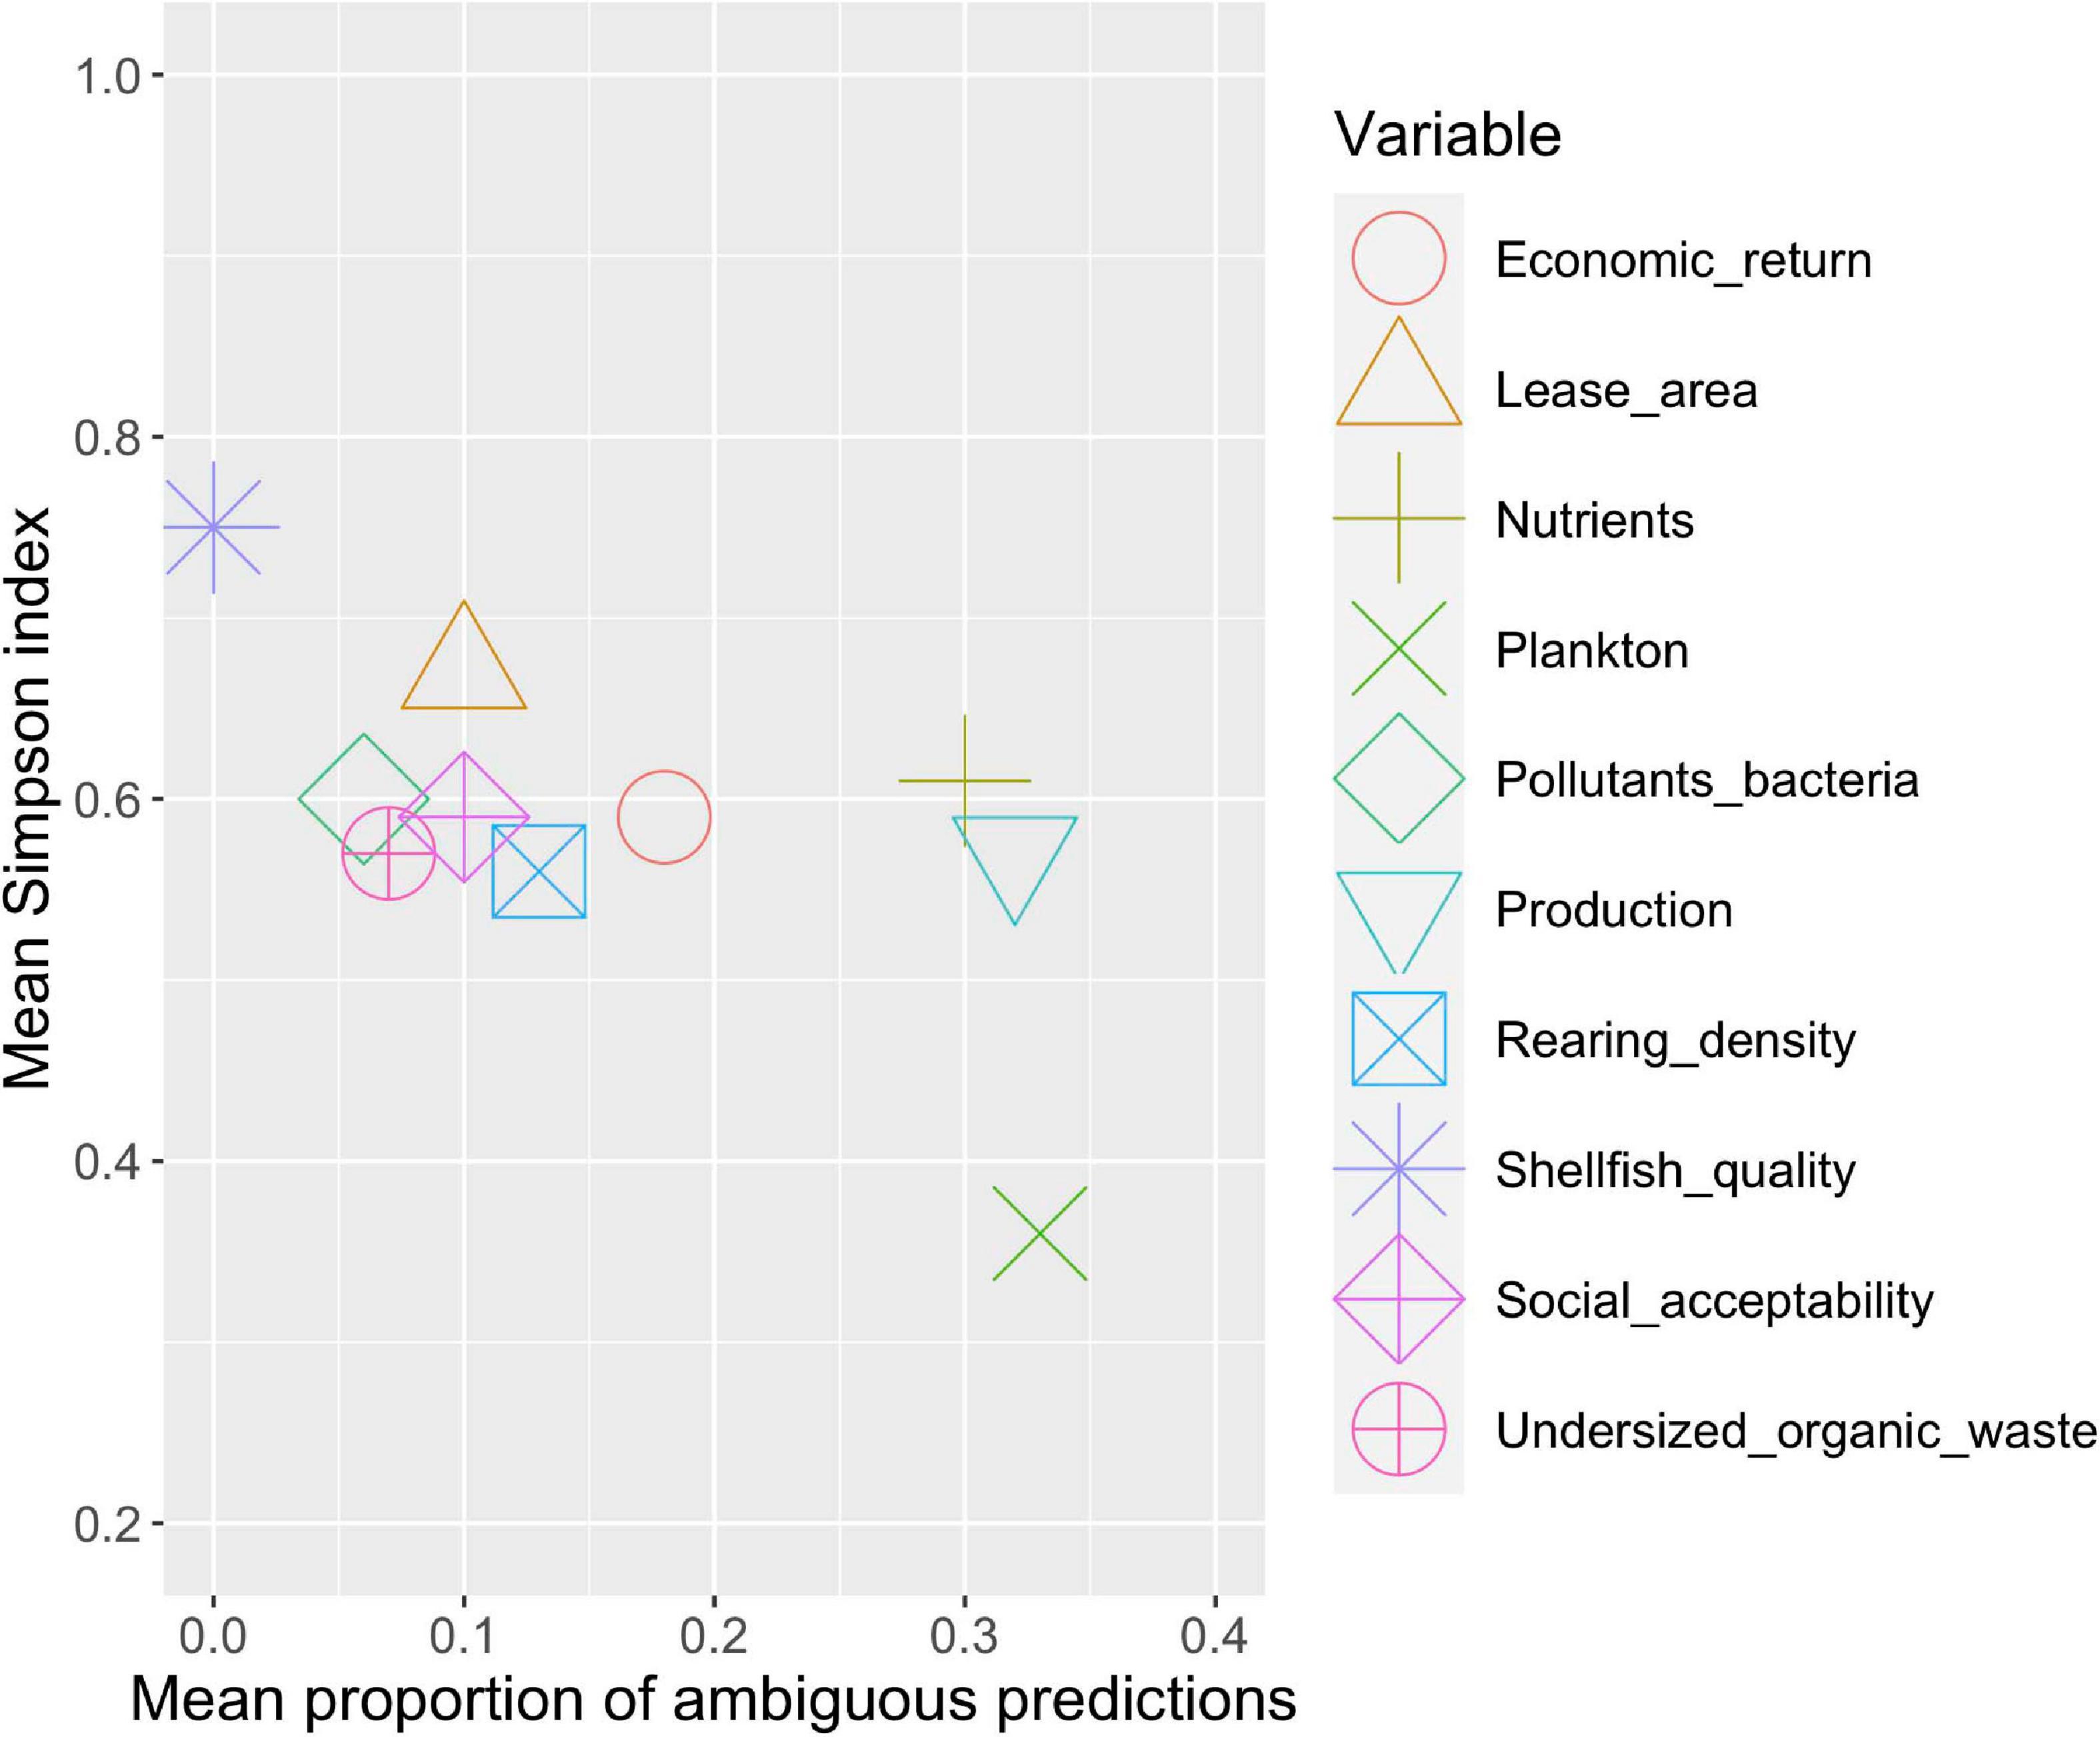
Figure 8. Summary of variable-specific uncertainty in model predictions: x-axis corresponds to the mean over all scenarios of the proportion of sign-uncertain (i.e., ambiguous) predictions across all models; y-axis provides an estimate of consistency in sign predictions across models for any scenarios. If all model predictions are sign-consistent, Simpson index will be equal to 1. Conversely, if model sign predictions are equally distributed between positive, negative, neutral or ambiguous then Simpson index will be 0.25.
The PCA in Figure 7 highlights consistencies and inconsistencies in model predictions across different scenarios. This analysis is based on predicted responses for 10 variables (as displayed in the y-axis in Figure 5) for each model and each scenario. Overall, variability in system-level responses relates to alternative scenarios (represented using different colors) rather than individual models (represented using different symbols). For instance, a scenario of improved integrated management practices is expected to induce similar system-level responses (represented in dark yellow on the PCA) across the five alternative models concerned. Across all five models, scores are in the bottom-right corner of the PCA, which reflects similar predictions of system-level effects that overall relate to decrease in “nutrients” and “production,” and increase in “economic return,” “shellfish quality,” and “social acceptability” (see Supplementary Material for variable response projections on the first two PCs). Note, however, that certain stakeholder-specific models (e.g., B2 shown as upward triangles) tend to produce inconsistent system-level predictions relative to other models. For instance, under the increase in waste collection (in pink) or decrease in farming and land uses scenarios (in red), B2 scores on the PCA tend to differ from these of other models (i.e., from Sy represented as stars, B3 as straight crosses or N2 as diamonds that are overall consistent in their predictions). Finally, note that system-level predictions with the Synthetic model are closer to the centre and overall well consistent with most of other models.
Figure 8 discriminates between variable-specific uncertainty in qualitative response to scenarios due either to inconsistencies across alternative models (as quantified with the Simpson index, y-axis. If all model predictions are sign-consistent, Simpson index will be equal to 1), or to sign indeterminacy in individual model predictions (as quantified by the mean proportion of ambiguous predictions, x-axis). Thus, variables in the bottom right-hand corner of Figure 8, such as “plankton,” have overall highly uncertain responses due to sign indeterminacy both in individual model predictions, and across models. Conversely, qualitative changes in “shellfish quality” appear well predictable under all scenarios (no ambiguous predictions) and overall well consistent across the different models (Simpson index ∼ 0.75). Overall, variables related to population abundances (e.g., “production,” “nutrients,” or “plankton”) are predicted with higher levels of uncertainty than those more directly related to aquaculture or regional management levers (e.g., “shellfish quality,” “lease area,” “rearing density,” or “social acceptability”).
Discussion
We used a participatory qualitative modeling approach to investigate the conditions for sustainability of the coastal socio-ecological system based on shellfish aquaculture in the NBG. The approach enabled us to identify a number of key issues that affect this system, and to specify sustainability conditions for this system.
Key Findings for the NBG Socio-Ecological System Sustainability
Qualitative predictions across the models developed during the seven participatory workshops, and in the follow-up synthesis provided some insights on system-level responses to sustained perturbation. Specifically, we inspected predicted responses to relevant scenarios with a focus on three variables (i.e., “undersized organic waste” as a proxy for the environmental dimension, “economic return” as a proxy for the economic dimension and “social acceptability” as a proxy for the social dimension).
Reduction in rearing density appears to be a key factor in the sustainability of the NBG shellfish aquaculture socio-ecological system. Indeed, according to qualitative predictions, a scenario of decrease in rearing density offers a sustainable response of the NBG socio-ecological system, regardless of the model structure. This scenario qualitatively entails increased economic return and social acceptability, and a decrease of the undersized organic waste. Even when considering a higher number of variables, predicted qualitative responses are consistent regardless of the structure of the model considered, with the exception of the response of the nutrient variable (see Supplementary Material).
In addition to identifying the reduction of rearing density as a key driver of system dynamics from qualitative analyses, a number of stakeholders’ concerns emerged from workshop discussions. Specifically, socio-ecological components related to social acceptability of shellfish farming are of primary concerns to most stakeholders. For instance, a major issue raised by local residents and NGOs in the bay of Mont-Saint-Michel relates to the undersized organic wastes that are produced by mussel farmers and can lead to visual and olfactory pollution. This concern indirectly addresses other social issues related to waste management, environmental impact of shellfish farming or the mitigation of conflicts between coastal users. All these factors appear important and condition the social acceptability of aquaculture by local communities. As a result, local residents and NGOs rejected recent plans for shellfish farming extension to new marine areas. This lack of social acceptability forces decision-makers to stop aquaculture expansion to avoid social conflicts. Not only in the workshop discussion but also in qualitative model analyses, social acceptability appears as a key driver and a condition to aquaculture sustainability. However, social acceptability is intangible and difficult to comprehend. Consequently, this component was represented into the models as a single variable that does not resolve the multiple and complex facets of social acceptability across different stakeholders’ perceptions. In order to better grasp the dynamics and sustainability of this socio-ecological system, one of the main challenges is therefore to delve deeper into the complex reality associated with social acceptability. While this challenge is often acknowledged, integrated modeling approaches rarely address it (Byron et al., 2011).
Added Value and Drawbacks of Stakeholder Integration
Our work illustrates the added value of involving stakeholders in model developments so as to match scientific projects and stakeholder concerns. This is verified by comparing the model previously constructed by the scientists participating in this experiment (Re model) with the models built during the stakeholder workshops. For instance, the issue of invasive species was of concern to scientists but was not a major issue raised by stakeholders, who were more concerned with waste management. In addition, the Re model did not mention “rearing density,” which was one of the most important variables for the stakeholder models (present in five of the six models). The approach thus illustrates the importance of including stakeholders, as we acquire the knowledge and information needed to address the issues that concern them.
Exploring the sustainability of socio-ecological systems therefore requires adapting scientific thinking by including stakeholder contributions to ensure the usefulness of the models. The co-construction of models with stakeholders makes it possible to correct the model structure at each stage of the thinking in order to better adapt them to the main current issues at stake. It is more complex to adapt ex-post expert models to societal issues and, consequently, the results provided may lead to inappropriate answers. This supports the statement of Röckmann et al. (2015) that stakeholder participation is a key element for successful Ecosystem-Based Management. However, participation does not fully guarantee successful implementation of co-construction of modeling. As all stakeholders have particular issues at stake, they can take advantage of this to influence the process through “actors driven approaches” (Lample et al., 2012).
The integration of stakeholder perceptions through several focus groups, as we did in this study, multiplied views and led to the construction of alternative models of the system, a way of working toward fair deliberation. Stakeholder knowledge of a system not only differs from that of researchers, but also tends to be different from that of other stakeholders (Villamor et al., 2020). This potentially increases uncertainty in qualitative model predictions due to: (i) ambiguous responses resulting from the structure of the model (i.e., opposite feedback loops) and (ii) heterogeneity in model structures (see section “Uncertainty in Qualitative Predictions”). The alternative models constructed during the six stakeholder workshops are proof of the heterogeneity of views among actors. These heterogeneities of representation sometimes lead to the prediction of different impacts of scenarios on system variables depending on the model considered. For example, more effective management to improve shellfish aquaculture practices would lead to a positive response of “social acceptability” according to B1, N1 and Sy models; but to a negative response of this variable, if considering B3 and Re models (see section “Qualitative Predictions of Responses to Sustained Perturbation”). The heterogeneity between models stems from various factors, such as (i) regional differences (i.e., Brittany vs. Normandy specificities), (ii) the different temporal and spatial scales between the models, (iii) the composition of the groups (i.e., the discussions are conditioned by the people participating in the workshops; for instance, the N3 model, which differs most from all other models, was developed by a group dominated by stakeholders with a biology background, while attendees had more diverse profiles at the other workshops), (iv) the facilitator of the workshops, and (v) the acquisition of experience (e.g., we may have a bias in the interpretation of certain terms from previous workshops, which leads to shortcuts).
Heterogeneity in system representations led us to build a synthetic model that is more complex than any one of the original models. Qualitative predictions associated with the synthetic (Sy) model are overall more ambiguous than with other models. This reflects that the synthetic model proposes a more nuanced representation of reality than stakeholder-specific models, which demonstrates the importance of including multiple perspectives across diverse stakeholders. Indeed, if we were to listen to only one group of stakeholders, we would then feel that the system responses are simple, whereas the reality is more complex. One of the challenges for effective management is, however, the need for a consensus on how important variables respond to interventions. Thus, it is essential to overcome the multiplicity of perspectives and reconcile alternative visions into a shared understanding of the system. Our work on the synthetic model, which was validated by the different stakeholder groups during the debriefing meeting, is a first step in addressing this issue. The difference with other approaches allowing the co-construction of models, such as the ARDI method (Etienne et al., 2011), lies in the choice of separating the stakeholder groups instead of bringing them together from the start, in order to build a consensual representation of the SES. Although our synthetic representation was constructed at a later stage by the research team, and therefore cannot be considered as a co-constructed model per se, it allows greater freedom of speech for stakeholders and a broader inclusion of the actual diversity of viewpoints.
However, even with a single model—as we said earlier—we may have uncertainty related to the structure of the model. Indeed, when we analyze only one model, we sometimes have ambiguous responses (i.e., uncertainty in predicted variable responses). These uncertainties are related to the structure of the model where the increase in ambiguity is due to an increase in the number of direct and indirect effects with opposite signs (Dambacher et al., 2003a). It is therefore important to examine the conditions to be fulfilled in order to remove these ambiguous responses. The identification of these conditions could then be combined with quantitative studies. The addition of semi-quantitative information on the relative strength of particular interactions can improve the accuracy and determination of the sign of the results (Forget et al., 2020). Another possibility to go beyond qualitative models is to ask experts about the relative strengths of some key interactions. The Delphi method (e.g., Lang, 1995; Glenn and Gordon, 2003), which consists of asking how much confidence people place in what they have just answered, could also interestingly complement our approach.
Moving Forward
Additional information is required to support collective action, beyond the qualitative analyses developed in this work. One way forward would be to remove ambiguity in model predictions by resorting to quantitative information about model processes. Another possible step, would involve working with stakeholders to develop one or more management strategies; and then implementing monitoring to assess the effects of the management measures, following a management strategy evaluation approach (Dutra et al., 2015). This would require being able to measure the consequences and effectiveness of the proposed actions. To do this, monitoring would link action, performance measures and models if any, so that the latter are fed by field observation. Modeling will then become more than only a tool for dialogue between stakeholders. Moreover, as social issues and ecosystems evolve, interactions with stakeholders are necessary in the long term. Next steps would therefore be to move toward closed-loop management strategy evaluations. A structure where discussions are held on a regular basis would allow scientists to go back to stakeholders and work in an adaptive manner. Iterative and adaptive management is increasingly advocated (Dutra et al., 2015; Fulton et al., 2015) in support of sustainable development. The tools proposed in this study are well suited to support the long-term monitoring of a socio-ecological system and can easily be modified iteratively during successive management cycles.
Data Availability Statement
The original contributions presented in the study are included in the article/Supplementary Material, further inquiries can be directed to the corresponding author/s.
Author Contributions
SG, CB, PB, PC, JP, and OT initiated the REMAIC project, and organized and helped run the workshops. JD facilitated the seven workshops. CB, PB, PC, ND, AG, SG, PL, and JP took part in the Re workshop. SG and LM did preliminary work on workshop outcomes. MM wrote the R code that generated the results. MM, SG, and CB analyzed qualitative modeling results. SG led the writing of the manuscript with inputs from co-authors. All authors were involved in the interpretation of the results and in drafting this article and approved the final version for publication.
Funding
The REMAIC project was supported by the “Laboratoire d’Excellence” LabexMER (ANR-10-LABX-19).
Conflict of Interest
The authors declare that the research was conducted in the absence of any commercial or financial relationships that could be construed as a potential conflict of interest.
Publisher’s Note
All claims expressed in this article are solely those of the authors and do not necessarily represent those of their affiliated organizations, or those of the publisher, the editors and the reviewers. Any product that may be evaluated in this article, or claim that may be made by its manufacturer, is not guaranteed or endorsed by the publisher.
Acknowledgments
We are grateful to the workshop participants for their time and their contributions to this research. Special thanks are due to Sophie Girard for her participation to the Re workshop and her precious insights on the system. We are also very grateful for the comments of the two reviewers that helped improve the manuscript.
Supplementary Material
The Supplementary Material for this article can be found online at: https://www.frontiersin.org/articles/10.3389/fevo.2021.635857/full#supplementary-material
References
AAMP (2009). Analyse Des Enjeux et Propositions Pour Une Stratégie D’aires Marines Protégées Bretagne Nord / Ouest Cotentin. Agence des Aires Marines Protégées.
Barreteau, O., Antona, M., D’Aquino, P., Aubert, S., Boissau, S., Bousquet, F., et al. (2003). Our companion modelling approach. J. Artif. Soc. Soc. Simul. 6:1.
Beder, S. (2011). Environmental economics and ecological economics: the contribution of interdisciplinarity to understanding, influence and effectiveness. Environ. Conserv. 38, 140–150.
Byron, C., Bengtson, D., Costa-Pierce, B., and Calanni, J. (2011). Integrating science into management: ecological carrying capacity of bivalve shellfish aquaculture. Mar. Policy 35, 363– 370.
Conseil Départemental de la Manche (2015). Profil de Vulnérabilité de la Zone de Production Conchylicole de Chausey. Normandy: Conseil Départemental de la Manche.
Cugier, P., Frangoudes, K., Blanchard, M., Mongruel, R., Perez, J., Le Mao, P., et al. (2010a). Impact des Facteurs Environnementaux et des Pratiques Conchylicoles sur la Baie du Mont Saint-Michel et la Production Conchylicole. Etude de Scenarii Par Modélisation. Programme Liteau 3. Rapport Final. Available online at: https://archimer.ifremer.fr/doc/00026/13707/ (accessed June 2020).
Cugier, P., Struski, C., Blanchard, M., Mazurié, J., Pouvreau, S., Olivier, F., et al. (2010b). Assessing the role of benthic filter feeders on phytoplankton production in a shellfish farming site: Mont Saint Michel Bay, France. J. Mar. Syst. 82, 21–34. doi: 10.1016/j.jmarsys.2010.02.013
Dambacher, J. M., and Ramos-Jiliberto, R. (2007). Understanding and predicting effects of modified interactions through a qualitative analysis of community structure. Q. Rev. Biol. 82, 227–250.
Dambacher, J. M., Brewer, D. T., Dennis, D. M., Macintyre, M., and Foale, S. (2007). Qualitative modelling of gold mine impacts on Lihir Island’s socioeconomic system and reef-edge fish community. Environ. Sci. Technol. 41, 555–562. doi: 10.1021/es0610333
Dambacher, J. M., Li, H. W., and Rossignol, P. A. (2002). Relevance of community structure in assessing indeterminacy of ecological predictions. Ecology 83, 1372–1385.
Dambacher, J. M., Li, H. W., and Rossignol, P. A. (2003a). Qualitative predictions in model ecosystems. Ecol. Modell. 161, 79–93. doi: 10.1016/S0304-3800(02)00295-8
Dambacher, J. M., Luh, H. K., Li, H. W., and Rossignol, P. A. (2003b). Qualitative stability and ambiguity in model ecosystems. Am. Nat. 161, 876–888.
DePiper, G. S., Gaichas, S. K., Lucey, S. M., Pinto da Silva, P., Anderson, M. R., Breeze, H., et al. (2017). Operationalizing integrated ecosystem assessments within a multidisciplinary team: lessons learned from a worked example. ICES J. Mar. Sci. 74, 2076–2086. doi: 10.1093/icesjms/fsx038
Dutra, L., Thébaud, O., Boschetti, F., Smith, A. D., and Dichmont, C. M. (2015). Key issues and drivers affecting coastal and marine resource decisions: participatory management strategy evaluation to support adaptive management. Ocean Coast. Manag. 116, 382–395. doi: 10.1016/j.ocecoaman.2015.08.011
Etienne, M. (2013). Companion Modelling: A Participatory Approach to Support Sustainable Development. Berlin: Springer Science & Business Media.
Etienne, M., Du Toit, D. R., and Pollard, S. (2011). ARDI: a co-construction method for participatory modeling in natural resources management. Ecol. Society 16:44.
Forget, N. L., Duplisea, D. E., Sardenne, F., and McKindsey, C. W. (2020). Using qualitative network models to assess the influence of mussel culture on ecosystem dynamics. Ecol. Modell. 430:109070. doi: 10.1016/j.ecolmodel.2020.109070
Fulton, E. A., Boschetti, F., Sporcic, M., Jones, T., Little, L. R., Dambacher, J. M., et al. (2015). A multi-model approach to engaging stakeholder and modellers in complex environmental problems. Environ. Sci. Policy 48, 44–56. doi: 10.1016/j.envsci.2014.12.006
Gangnery, A., Bacher, C., Boyd, A., Liu, H., You, J., and Strand, Ø (2020). Web-based public decision support tool for integrated planning and management in aquaculture. Ocean Coast. Manag. 203:105447. doi: 10.1016/j.ocecoaman.2020.105447
Gangnery, A., Cugier, P., Le Gendre, R., Legendre, A., Maheux, F., Mary, C., et al. (2015). Projet OGIVE. Outils d’aide à la Gestion et à la Valorisation des Ecosystèmes conchylicoles de Basse-Normandie. Rapport Final de Phase III (2011-2013). RST LERN 15-02. Available online at: https://archimer.ifremer.fr/doc/00253/36468/ (accessed June 2020).
Glenn, J., and Gordon, T. (2003). Futures Research Methodology: Version 2.0, The Millennium Project. Washington, DC: American Council for the United Nations.
Haraldsson, M., Raoux, A., Riera, F., Hay, J., Dambacher, J. M., and Niquil, N. (2020). How to model social-ecological systems?–A case study on the effects of a future offshore wind farm on the local society and ecosystem, and whether social compensation matters. Mar. Policy 119:104031. doi: 10.1016/j.marpol.2020.104031
Holling, C. S. (2001). Understanding the complexity of economic, ecological, and social systems. Ecosystems 4, 390–405. doi: 10.1007/s10021-001-0101-5
Hosack, G. R., Hayes, K. R., and Dambacher, J. M. (2008). Assessing model structure uncertainty through an analysis of system feedback and Bayesian networks. Ecol. Appl. 18, 1070–1082. doi: 10.1890/07-0482.1
Justus, J. (2006). Loop analysis and qualitative modelling: limitations and merits, 2006. Biol. Philos. 21, 647–666. doi: 10.1007/s10539-006-9050-x
Lample, M., Bailly, D., and Ballé-Béganton, J. (2012). “Coupling the ExtendSim platform with HEC-HMS for modelling irrigation strategies,” in Proceedings of the 2012 International Congress on Environmental Modelling and Software Society (Leipzig).
Lang, T. (1995). An overview of four futures methodologies. Manoa J. Fried Half Fried Ideas 7, 1–43.
Le Mao, P., Godet, L., Fournier, J., Desroy, N., Gentil, F., Thiébault, E., et al. (2019). Atlas de la Faune Marine Invertébrée du Golfe Normano-Breton. Volume 1. Présentation. Roscoff: Éditions de la Station biologique de Roscoff.
Marzloff, M. P., Dambacher, J. M., Johnson, C. R., Little, L. R., and Frusher, S. D. (2011). Exploring alternative states in ecological systems with a qualitative analysis of community feedback. Ecol. Modell. 222, 2651–2662. doi: 10.1016/j.ecolmodel.2011.03.040
Marzloff, M. P., Melbourne-Thomas, J., Hamon, K. G., Hoshino, E., Jennings, S., Van Putten, I. E., et al. (2016). Modelling marine community responses to climate-driven species redistribution to guide monitoring and adaptive ecosystem-based management. Glob. Chang. Biol. 22, 2462–2474. doi: 10.1111/gcb.13285
Melbourne-Thomas, J., Wotherspoon, S., Raymond, B., and Constable, A. (2012). Comprehensive evaluation of model uncertainty in qualitative network analyses. Ecol. Monogr. 82, 505–519. doi: 10.1890/12-0207.1
Puccia, C. J., and Levins, R. (1985). Qualitative Modeling of Complex Systems: An Introduction to Loop Analysis and Time Averaging. Cambridge, MA: Harvard University Press.
Reum, J. C., McDonald, P. S., Ferriss, B. E., Farrell, D. M., Harvey, C. J., and Levin, P. S. (2015). Qualitative network models in support of ecosystem approaches to bivalve aquaculture. ICES J. Mar. Sci. 72, 2278–2288. doi: 10.1093/icesjms/fsv119
Röckmann, C., van Leeuwen, J., Goldsborough, D., Kraan, M., and Piet, G. (2015). The interaction triangle as a tool for understanding stakeholder interactions in marine ecosystem based management. Mar. Policy 52, 155–162. doi: 10.1016/j.marpol.2014.10.019
Schlüter, M., Mcallister, R. R., Arlinghaus, R., Bunnefeld, N., Eisenack, K., Hoelker, F., et al. (2012). New horizons for managing the environment: a review of coupled social-ecological systems modeling. Nat. Resour. Model. 25, 219–272. doi: 10.1111/j.1939-7445.2011.00108.x
Tress, G., Tress, B., and Fry, G. (2005). Clarifying integrative research concepts in landscape ecology. Landsc. Ecol. 20, 479–493. doi: 10.1007/s10980-004-3290-4
Villamor, G. B., Griffith, D. L., Kliskey, A., and Alessa, L. (2020). Contrasting stakeholder and scientist conceptual models of food-energy-water systems: a case study in Magic Valley, Southern Idaho. Soc. Environ. Syst. Modell. 2:16312. doi: 10.18174/sesmo.2020a16312
Voinov, A., and Bousquet, F. (2010). Modelling with stakeholders. Environ. Model. Softw. 25, 1268–1281. doi: 10.1016/j.envsoft.2010.03.007
Voinov, A., Kolagani, N., McCall, M. K., Glynn, P. D., Kragt, M. E., Ostermann, F. O., et al. (2016). Modelling with stakeholders–next generation. Environ. Model. Softw. 77, 196–220. doi: 10.1016/j.envsoft.2015.11.016
Keywords: socio-ecological system (SES), participatory approach, sustainability, shellfish aquaculture, Normand-Breton Gulf, loop analysis
Citation: Gourguet S, Marzloff MP, Bacher C, Boudry P, Cugier P, Dambacher JM, Desroy N, Gangnery A, Le Mao P, Monnier L, Pérez Agúndez JA and Thébaud O (2021) Participatory Qualitative Modeling to Assess the Sustainability of a Coastal Socio-Ecological System. Front. Ecol. Evol. 9:635857. doi: 10.3389/fevo.2021.635857
Received: 30 November 2020; Accepted: 05 July 2021;
Published: 20 August 2021.
Edited by:
Cang Hui, Stellenbosch University, South AfricaReviewed by:
Christophe Le Page, UMR SENS - CIRAD, FranceChris Harvey, National Oceanic and Atmospheric Administration (NOAA), United States
Copyright © 2021 Gourguet, Marzloff, Bacher, Boudry, Cugier, Dambacher, Desroy, Gangnery, Le Mao, Monnier, Pérez Agúndez and Thébaud. This is an open-access article distributed under the terms of the Creative Commons Attribution License (CC BY). The use, distribution or reproduction in other forums is permitted, provided the original author(s) and the copyright owner(s) are credited and that the original publication in this journal is cited, in accordance with accepted academic practice. No use, distribution or reproduction is permitted which does not comply with these terms.
*Correspondence: Sophie Gourguet, sophie.gourguet@ifremer.fr