Light Intensity Influence on Growth and Photosynthetic Characteristics of Horsfieldia hainanensis
 Xin Wang
 Guode Chen1†
  Shangjia Du
 Haixia Wu
 Rong Fu
- 1Hainan Academy of Forestry, Haikou, China
- 2College of Tropical Crops Hainan University, Haikou, China
- 3College of Forestry, Hainan University, Haikou, China
Due to both anthropogenic and natural causes, the number of Horsfieldia hainanensis has been decreasing each year in the Tongza Branch nursery (109.534 525°E, 18.763 516°N) of the Hainan Academy of Forestry, China. Consequently, the protection of H. hainanensis is urgent, as is that of most rare tree species. To develop a more comprehensive understanding of the H. hainanensis growth environment, we took 3-year-old H. hainanensis saplings as the research object. We controlled the light intensity by setting different shade amounts to explore the growth and photosynthetic characteristics of H. hainanensis under different light intensities. We found that shade can promote growth and increase the contents of certain substances. Light transmittance of 44.41% can increase plant height (by 29.545%) and biomass (by 66.676%). Light transmittance of 16.19% can increase the pigment content; Chl increased by 40.864%, Chl a increased by 38.031%, and Chl b increased by 48.412%. Light transmittance of 7.30% can increase the soil plant analysis development (SPAD) value of each part of the leaf; the leaf base increased by 41.000%, the leaf margin increased by 32.574%, the blade tip increased by 49.003%, and the leaf average increased by 40.466%. The specific leaf area can reduce the specific leaf weight. We also found that compared to full light, reducing the light transmittance can increase the total chlorophyll (Chl), chlorophyll A (Chl a), and chlorophyll B (Chl b) contents, and the Chl-SPAD-leaf base, leaf edge, leaf tip, average content, and light-saturated net photosynthetic rate. This can in turn reduce the apparent quantum efficiency (AQY), light compensation point (LCP), and dark respiration rate (Rd). In addition, we found a strong correlation between seven of the photosynthetic pigment indicators (Chl, Chla, Chl b, Chl-SPAD-leaf base, leaf margin, leaf tip, and mean) and the three photosynthesis physiological parameters (AQY, LCP, and Rd). The light transmittance of 44.41% (one layer of shading net) treatment group was conducive to the growth of H. hainanensis and photosynthetic characteristic improvement. Therefore, our light transmittance selection of approximately 44.4% is significant for the natural return of H. hainanensis.
Introduction
Horsfieldia hainanensis belongs to the Myristicaceae family and Horsfieldia Willd genus. The species is commonly known as Hainan horsfieldia, false jade fruit, Hainan huoerfei, water loquat, and mieus. In China, they are primarily distributed in southern Yunnan, western Guangxi, and southwestern Hainan. Because they are one of the most iconic humid tropical rainforest plants, they exhibit high reference value for studying the flora, geographical distribution, and ecological characteristics of tropical rainforests (Editorial Committee of Chinese Flora of Chinese Academy of Sciences, 1977; Xu et al., 2012). Due to their small distribution area and number, the excessive destruction of rainforests, the anthropogenic destruction and hacking of the plant, and their extremely poor natural regeneration capacity, Horsfieldia hainanensis are on the verge of extinction of China. In 1999, they were listed as nationally second-level protected wild plants (Jiang et al., 2016, 2018) in China. In recent years, many research studies have focused on H. hainanensis breeding (Liu et al., 2019), fertilizer management (Wang, 2017), community composition (Zhong et al., 2018), chemical composition (Liu et al., 2010), stress response (Huang et al., 2019), and genes (Jiang, 2018; Yang et al., 2019). However, research is lacking on the effect of shading on the physiology and photosynthesis of H. hainanensis that provides a theoretical basis for the selection of an appropriate light intensity for seedling breeding and natural return planting of H. hainanensis.
Shading is a common approach for exploring how weak light stress influences seedling photosynthesis. Scientific research and plant production in recent years has illustrated that the chloroplast structure, enzymatic activity, osmotic adjustment, and endogenous hormones are key elements for adapting to low-light conditions. Many experiments have demonstrated that plant vegetative growth under low-light treatments varies according to the variety and can cause morphological reconstruction (El-Gizawy et al., 1993; Ayuko et al., 2008; Kruse et al., 2008). Bepetel and Lakso (1998) found that under less than 40% low-light conditions, the accumulation of assimilate decreases due to photosynthetic inhibition, and the products distributed to the leaves increase, causing the proportion of distribution to the fruit to decrease, which leads to a 25% drop in fruit growth. Ishida (1989) found that eggplants exhibited slow reproductive growth, insufficient dry matter accumulation, and delayed flower bud differentiation under low-light conditions. Therefore, weak light is a key factor in plant photochemical efficiency and exerts various influences on leaf chlorophyll contents. These significant differences in leaf characteristics and photochemical efficiency can be viewed as adaptations to weak light.
Photosynthesis is the basic plant physiological and biochemical process and one of the main chemical reactions that provide plants with energy. It also determines plant growth and dry matter accumulation. The plant net photosynthetic rate (Pn), transpiration rate (Tr), stomatal conductance (Gs), and intercellular CO2 concentration (Ci) change according to changes in environmental factors such as light, moisture, and temperature (Krause and Weis, 1991; Lore et al., 2020; Mansoure et al., 2020). The photosynthesis–light intensity response curve has long been used to evaluate the photosynthetic rates of plants and their related photosynthetic characteristics (Platt et al., 1980; Harrison and Platt, 1986), illustrating their potential photosynthetic capacity under a certain light intensity range (Falkowski and Raven, 1997) and growth and development status. It can be used as a critical indicator for breeding and identifying excellent varieties with high light efficiency and strong light resistance. However, studies on the response of plant photosynthesis to weak light conditions have predominately focused on crop plants (Li et al., 2020) and non-endangered species (Leite et al., 2019). Little is known about the responses of endangered species to weak light conditions, and the field should place greater emphasis on the scientific questions underlying the physiology of rare species such as H. hainanensis. Therefore, endangered plants should be studied under different light conditions, which can help us to protect natural resources.
In summary, to analyze the influence of different light intensities on H. hainanensis, this study controls the light intensity to compare the effects of various intensities on the growth indicators, photosynthesis, and photosynthetic pigments of its 3-year-old seedlings to reveal the response mechanism to different light intensities of H. hainanensis. The response mechanism to different light intensities can provide a theoretical basis for the selection of canopy closure in a nursery and for natural return planting of H. hainanensis.
Materials and Methods
Plant Materials and Experimental Location
Wind blew the 3-year-old H. hainanensis phoebe seedlings, and the seeds were collected from the same tree. The experiment was conducted in the Tongza Branch nursery (109.534 525°E, 18.763 516°N) of the Hainan Academy of Forestry, China. The average altitude of the area is 300 m, and the annual average temperature is 22.4°C. The average temperature in January is 17.0°C, the average temperature in July is 26.0°C, and the maximum temperature is 35.9°C. The annual average rainfall is 1,690 mm, the maximum annual rainfall is 2,810.4 mm, the minimum annual rainfall is 1,055.5 mm, and the annual average relative humidity is 84%. Potting was conducted in November 2019. All test seedlings grew vigorously and consistently and then were moved to the specified location. The average plant height of the seedlings was 47.6 cm. Only seedlings with no diseases or insect pests were selected. Loess soil was used for bagging. The dimensions of each soil bag were 30 cm (w) × 30 cm (d) × 25 cm (h). Each bag weighed 10 ± 0.5 kg per seedling. The soil contents were as follows: organic matter, 52.89 g/kg; alkali-hydrolyzable nitrogen, 237.01 mg/kg; available phosphorous, 40.41 mg/kg; available potassium, 84.29 mg/kg; total nitrogen, 1.02 g/kg; total phosphorus, 0.05 g/kg; and total potassium, 18.14 g/kg. The soil pH was 7.18.
Experimental Design
Random sample plots were used in the study. Each plot was 1.8 m × 3.0 m, row, and plant spacing were both 60 cm, and the plant density was 27,780 plants/ha. Three treatment groups were set up using 1, 2, or 3 layers of shading net to control the light intensity, with full illumination (no shading net) as the control treatment group (CK). Each treatment was repeated three times for 5 plants each, with 60 plants in total. A digital illuminance meter (VICTOR 1010D, Shenzhen Yisheng Shengli Technology Co., Ltd., China) was used to measure the light intensity at 10:00, 12:00, and 14:00 (east eight districts) in fine weather conditions for 3 consecutive days, and then the average was determined. The specific experimental design and the light intensity used in each treatment are illustrated in Table 1.
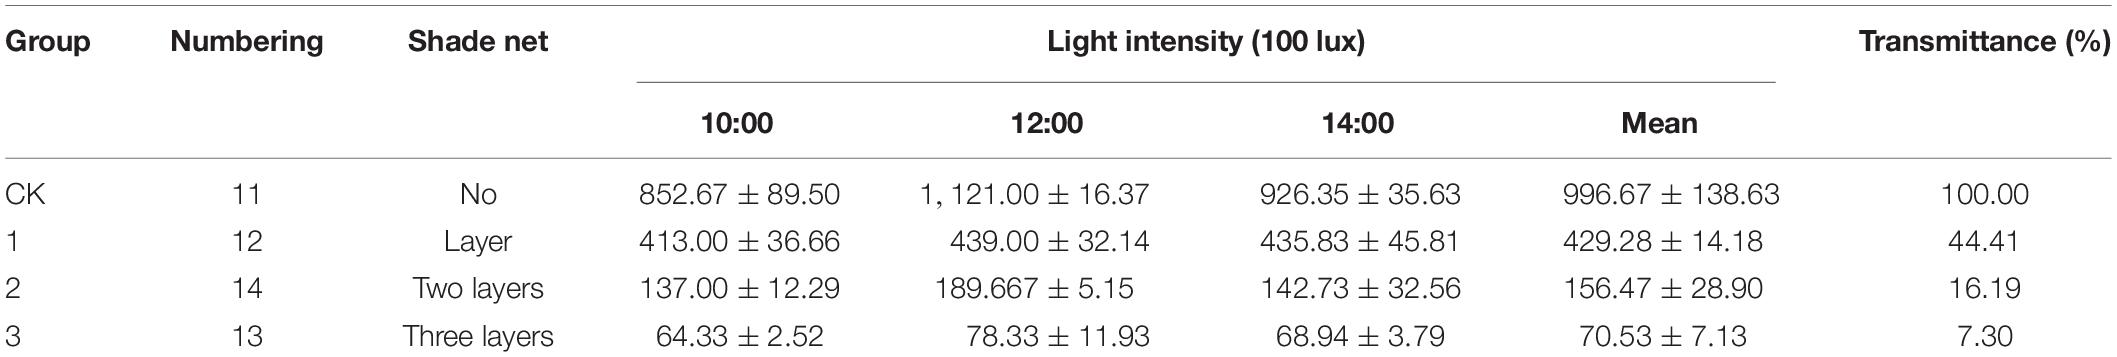
Table 1. Different light test treatment table.
Growth Index Determination
In July 2020, three plants were selected from each replicate for growth index determination. The plant height (H) and ground diameter (D) were measured using a tape measure and vernier caliper, respectively, and the H/D ratio was calculated. The biomass model D2H was used to compare the biomass differences of the seedlings under different treatments (Hanson, 1975; Hase et al., 1985).
Determination of Leaf Morphology and Traits
On July 24, 2020, a hand-held leaf area meter (YMJ-B, Zhejiang Top Yunnong Technology Service Co., Ltd., China) was used to determine the leaf length (L), leaf width (W), leaf area (A), and aspect ratio (B). The leaf water content (CLWC) was measured using the drying method (Cornelissen et al., 2003). One functional leaf was cut from each seedling, and three plants were used as replicates. First, we used an analytical balance to weigh the fresh weight (FW) of the leaf, to three decimal places, and then placed the leaf in an oven at 100°C for 1 h. Then, we adjusted the temperature to 85°C until a constant weight was obtained. Finally, the dry weight (DW) of the leaves was measured using an analytical balance, to four decimal places, and the following formulas were used to, respectively, calculate the water content (CLWC), specific leaf area (SLAM), and specific leaf weight (mLMA): CLWC = 1 - DW/FW × 100%, SLAM = A/DW, and mLMA = DW/A.
Photosynthetic Light Response Curve Determination
On a sunny day in September 2020, Photosynthetic light response curve determination was conducted from 8:30 to 11:30. Each selection of three functional leaves from the top of an H. hainanensis was fully tested, using the LI-6800 portable photosynthesis system (LI- COR, United States), using a light-emitting diode acted as the red and blue light source. We selected 90% red light and a 3 cm × 3 cm red and blue leaf chamber to measure the Pn, Tr, Gs, and Ci indicators and draw the corresponding light response curve. We set 12 intensity gradients of photosynthetic active radiation (PAR): 1,800, 1,500, 1,200, 1,000, 800, 600, 400, 200, 150, 100, 50, and 0 μmol⋅m–2⋅s–1. The CO2 concentration was set to 400 μmol⋅m–2⋅s–1 (provided by the CO2 cylinder), the temperature was set to 27°C, the relative humidity was set to 65%, the gas flow rate was set to 500 μmol⋅s–1, and before measurement 1,800 μmol⋅m–2⋅s–1 strong light was induced for at least 15 min until the data were stable. During measurement, the data were recorded after stabilizing for at least 2 min under each PAR. Then, using the leaf floating photosynthesis calculation method, the right-angle hyperbolic correction model (Ye and Zhao, 2010) was used to calculate the light-saturated net photosynthetic rate (Pnmax), AQY, LCP, light saturation point (LSP), Rd, and coefficient of determination (R2).
where α is the initial slope of the light response curve, β and γ are coefficients, I is PAR, and Rd is the dark respiration rate.
Determination of Photosynthetic Pigment Content
The photosynthetic pigment content and SPAD value were determined on July 22, 2020. The photosynthetic pigment content was determined using the 95% ethanol extraction method (Gu et al., 2017). Three plants were randomly selected from each treatment group, and one mature functional leaf was cut from each seedling. A total of 0.200 g of fresh leaves per sample were weighed using an analytical balance, cut, and immersed in 20.0 ml of 95% ethanol plastic tubes. The samples underwent dark treatment of 72 h until the leaves faded from their original green color, the absorbance (A) was measured at 470, 649, and 665 nm using an ultraviolet spectrophotometer (UV-2400, Shanghai Sunny Hengping Scientific Instruments Co., Ltd., China). The following formulas were used to calculate the Chl, Chl a, Chl b, Chl a/b, and carotenoid (Caro) content.
where V is the extract volume (ml), n is the dilution factor, and SW is the fresh weight of the leaf sample (g).
Three parts near the main leaf (leaf base), away from the petiole (leaf tip) and the middle part (leaf margin), were selected for analysis using the SPAD-502 chlorophyll content analyzer (SPAD-502 Plus, Konica Minoltia, Japan) to determine the Chl-SPAD value. Three plants were selected for each treatment group, and the measurement for each part was repeated times to calculate the average value of each part and then the average SPAD value of the entire leaf.
Data Analysis
The hyperbolic correction model of the Ye and Zhao (2010) software was first used to calculate the photosynthetic parameters (AQY, Pnmax, LSP, LCP, Rd, and R2), and then to target the growth indicators (H, D, H/D, and D2H), leaf morphology and traits (L, W, A, B, CLWC, SLAM, and mLMA), photosynthetic parameters (AQY, Pnmax, LSP, LCP, Rd and R2), and photosynthetic pigments (Chl, Chl A, Chl B, Chl A/B, Caro, and SPAD), We used IBM SPSS 26.0 for descriptive statistical analysis, followed by the Duncan test, with multiple comparisons at the 0.05 and 0.01 levels. IBM SPSS 26.0 was used to analyze the correlation between the photosynthetic physiological parameters and photosynthetic pigments. The results are expressed as mean ± SD. All statistical analysis and graphs were prepared using Excel 2016, IBM SPSS 26.0, and OriginPro 2021 software.
Results
The various shade intensity treatment groups exhibited significant differences (P < 0.05) in their growth indicators (Figure 1). Maximum values of 76.00 cm, 14.47 mm, 53.75, and D2H 154.37 kg were found in treatment group 1 for H, D, H/D, and D2H, respectively. There are significant differences (P < 0.01) in H and D2H between that of treatment group 1 and the CK group, while D and H/D are not significantly different between these two groups. The H in treatment group 2 is significantly lower (P < 0.05) than that in treatment group 1, while D2H is significantly smaller in treatment group 2 than in treatment group 1. For treatment group 1, the H is 1.90 times that of treatment group 3, D is 1.54 times that of treatment group 3, H/D is 1.27 times that of treatment group 3, and D2H is 4.06 times that of treatment group 3, with significance at the P < 0.01 level. This demonstrates that light shade is beneficial to the growth of the H, D, and H/D of H. hainanensis and in increasing its biomass.
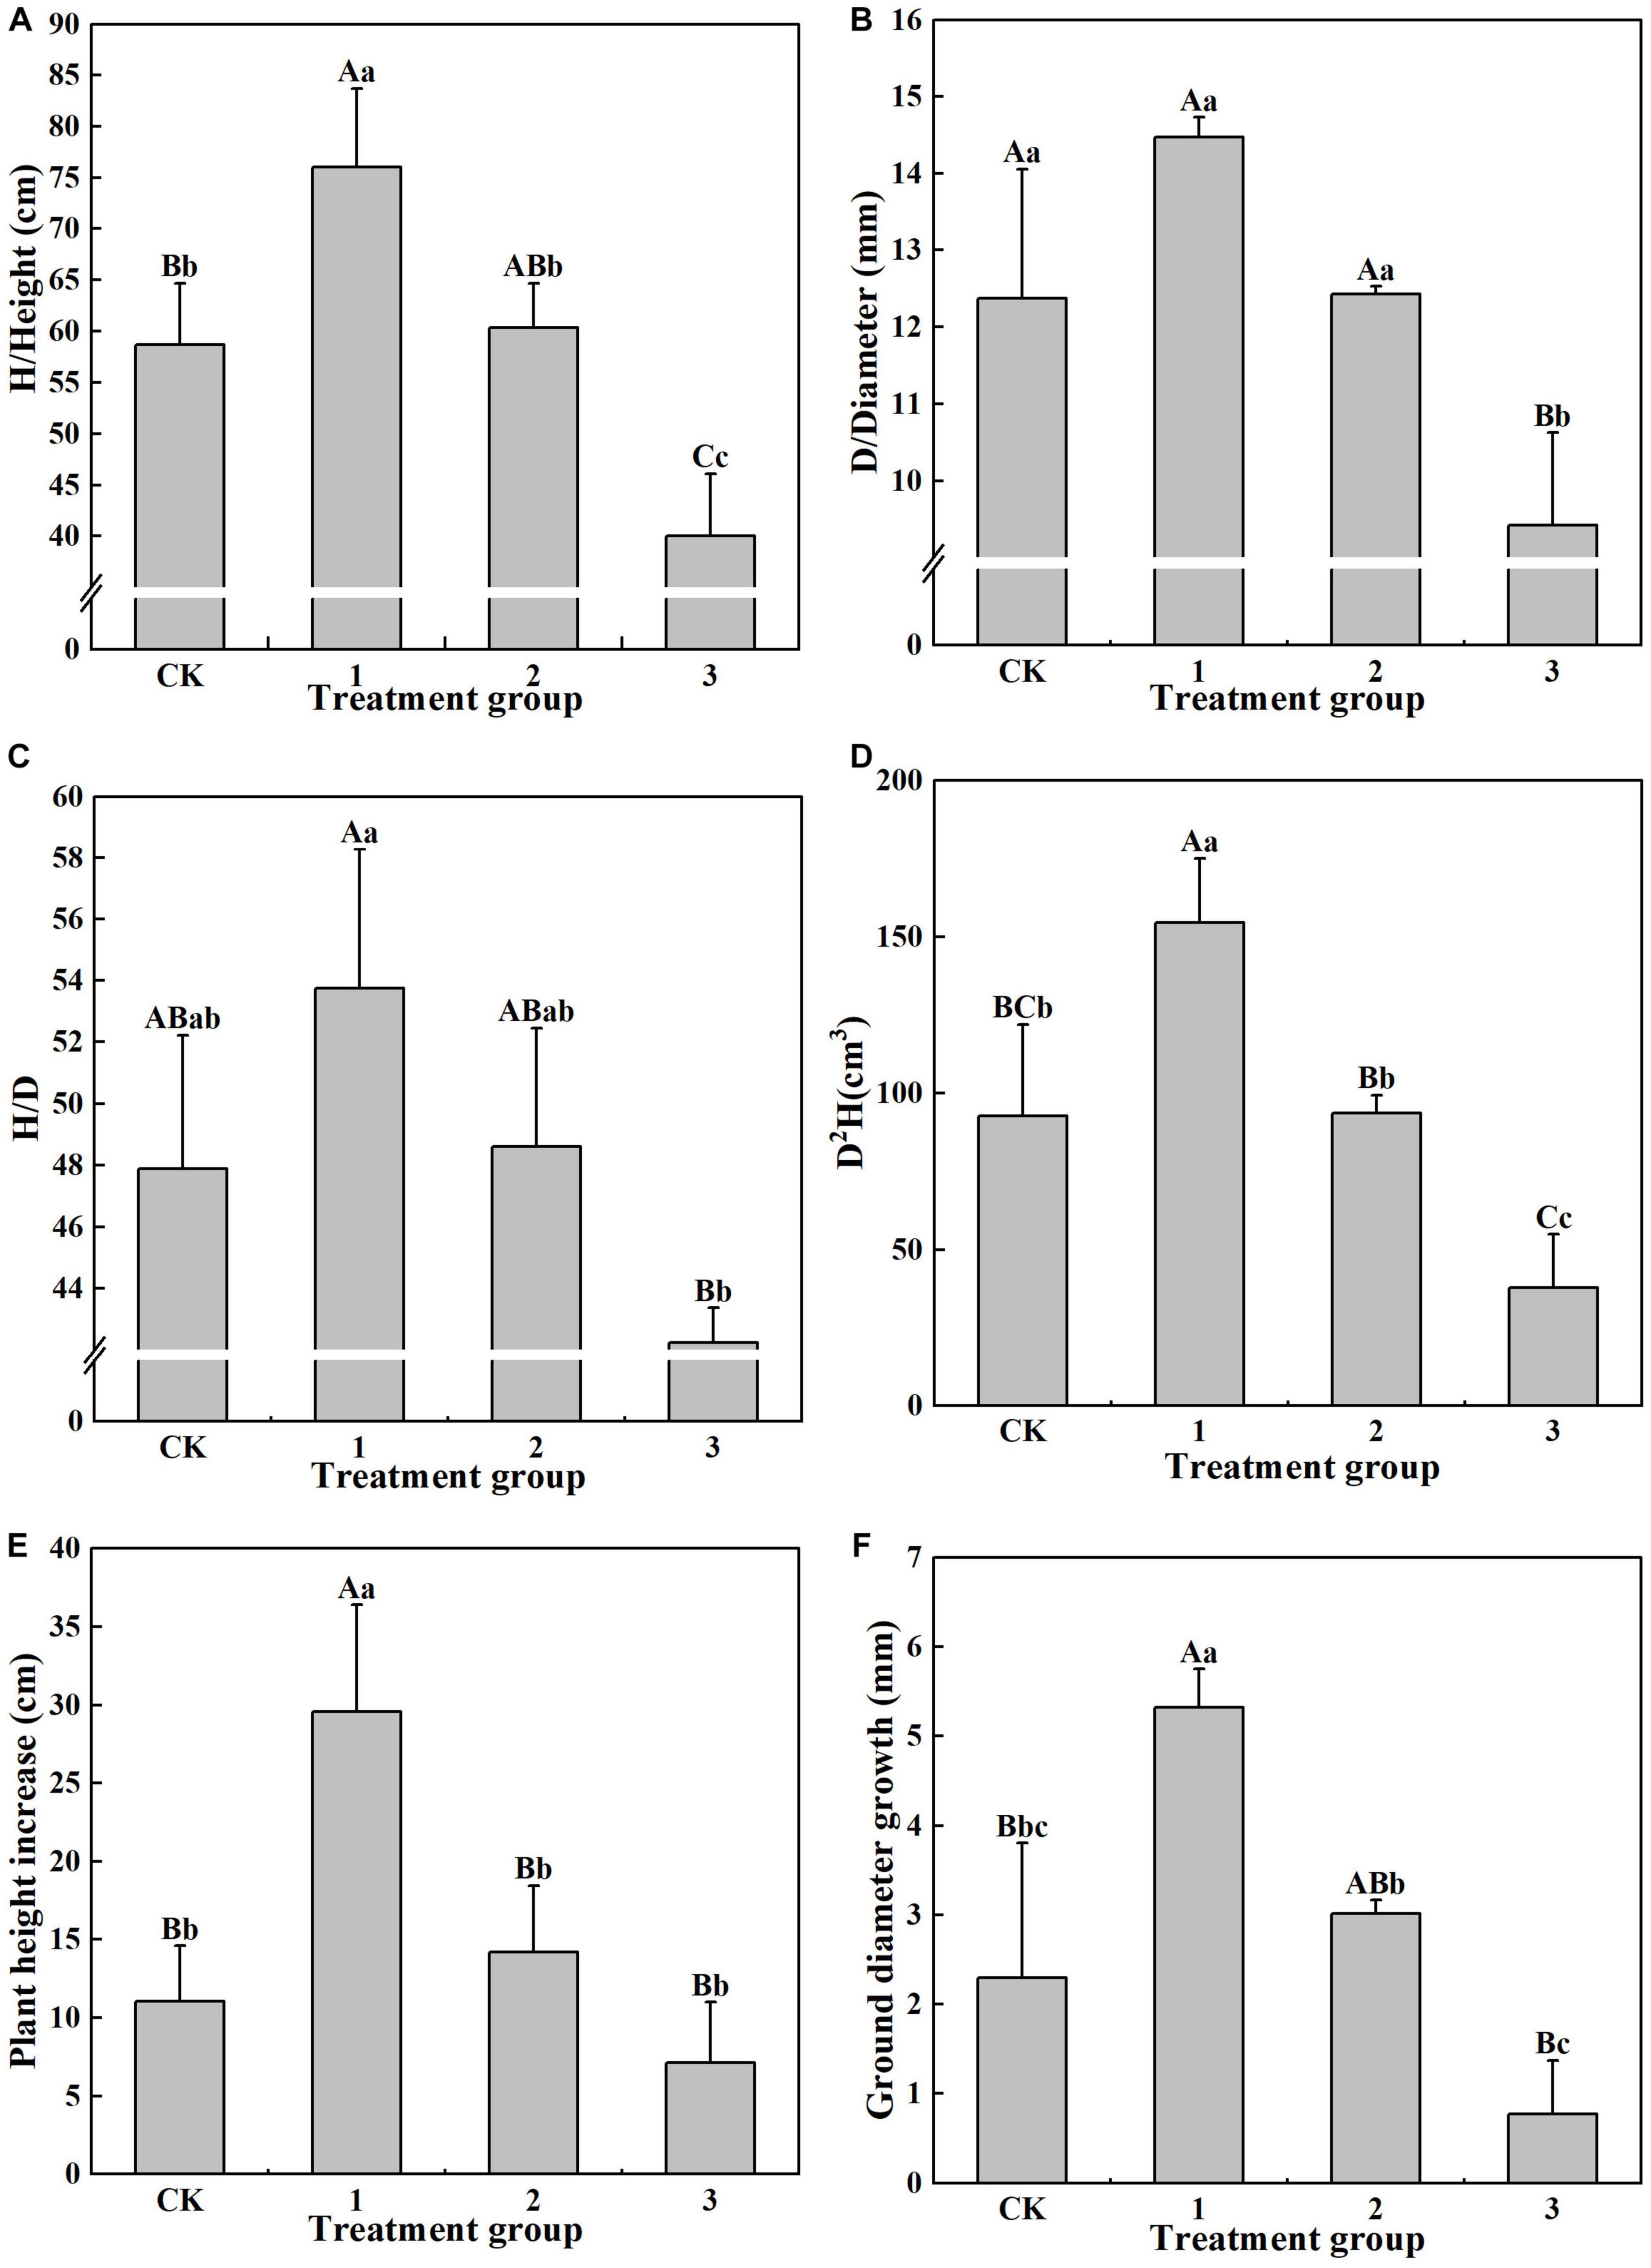
Figure 1. The effect of different treatments on the growth index of Horsfieldia hainanmensis The uppercase letters in the figure indicate P < 0.01, and the lowercase letters indicate P < 0.05, which respective indicate extremely significant and significant differences (A–D), respectively, represent the influence of different light transmittance on the plant height, ground diameter, height to diameter ratio, and biomass of Horsfieldia hainanmensis (E,F) represent the influence of different light transmittance on the growth of plant height and ground diameter of Horsfieldia hainanmensis.
It can be seen from Figure 1 that the increase in D and H (29.55 cm and 5.32 mm, respectively), in treatment group 1 was the largest of the treatment groups. The increase in D was significantly (P < 0.05) greater than that in the other treatment groups, and it reached a greater significance level (P < 0.01) l when compared to that of the CK group and treatment group 3. The increase in D in treatment groups 2 and 3 was also significant. The increase in H in treatment group 1 was significantly (P < 0.01) larger than that in the other treatment groups, while there was no significant difference in H among the other treatment groups. These results indicate that light shade promotes H and D growth in H. hainanensis (Figures 1E,F).
The effects of different light intensities on the leaf morphology and characteristics of H. hainanensis are displayed in Figure 2. The values of S (31,296.48 mm2), L (201.99 mm), W (100.62 mm), CLWC (79.01%), and SLAM (238.55 cm2/g) in the CK group are the smallest, and they are significantly smaller (P < 0.01) than those in treatment group 2. S and L are both significantly smaller in the CK group (P < 0.01) than in treatment groups 1, 2, and 3 (P < 0.05). W is significantly smaller (P < 0.05) in the CK group than in treatment groups 1 and 2 (Figure 2C). There are no significant differences in B among the treatment groups. CLWC displays significant differences among the treatment groups; only treatment groups 2 and 3 did not reach an extremely significant (P < 0.01) level (Figure 2D). The SLAM of treatment group 2 is 1.40 times that of the CK group, 1.18 times that of treatment group 1, and 1.28 times that of treatment group 3, all of which exhibit significant differences (P < 0.05), including a particularly significant difference level (P < 0.01) between the SLAM of the CK group and that of treatment group 3 (Figure 2E). mLMA (30.06 g/m2) in treatment group 2 is the smallest, and its difference with the CK group is extremely significant (P < 0.01) (Figure 2F). These results indicate that proper shading can increase the S, L, W, CLWC, and SLAM of H. hainanensis, but not those of mLMA.
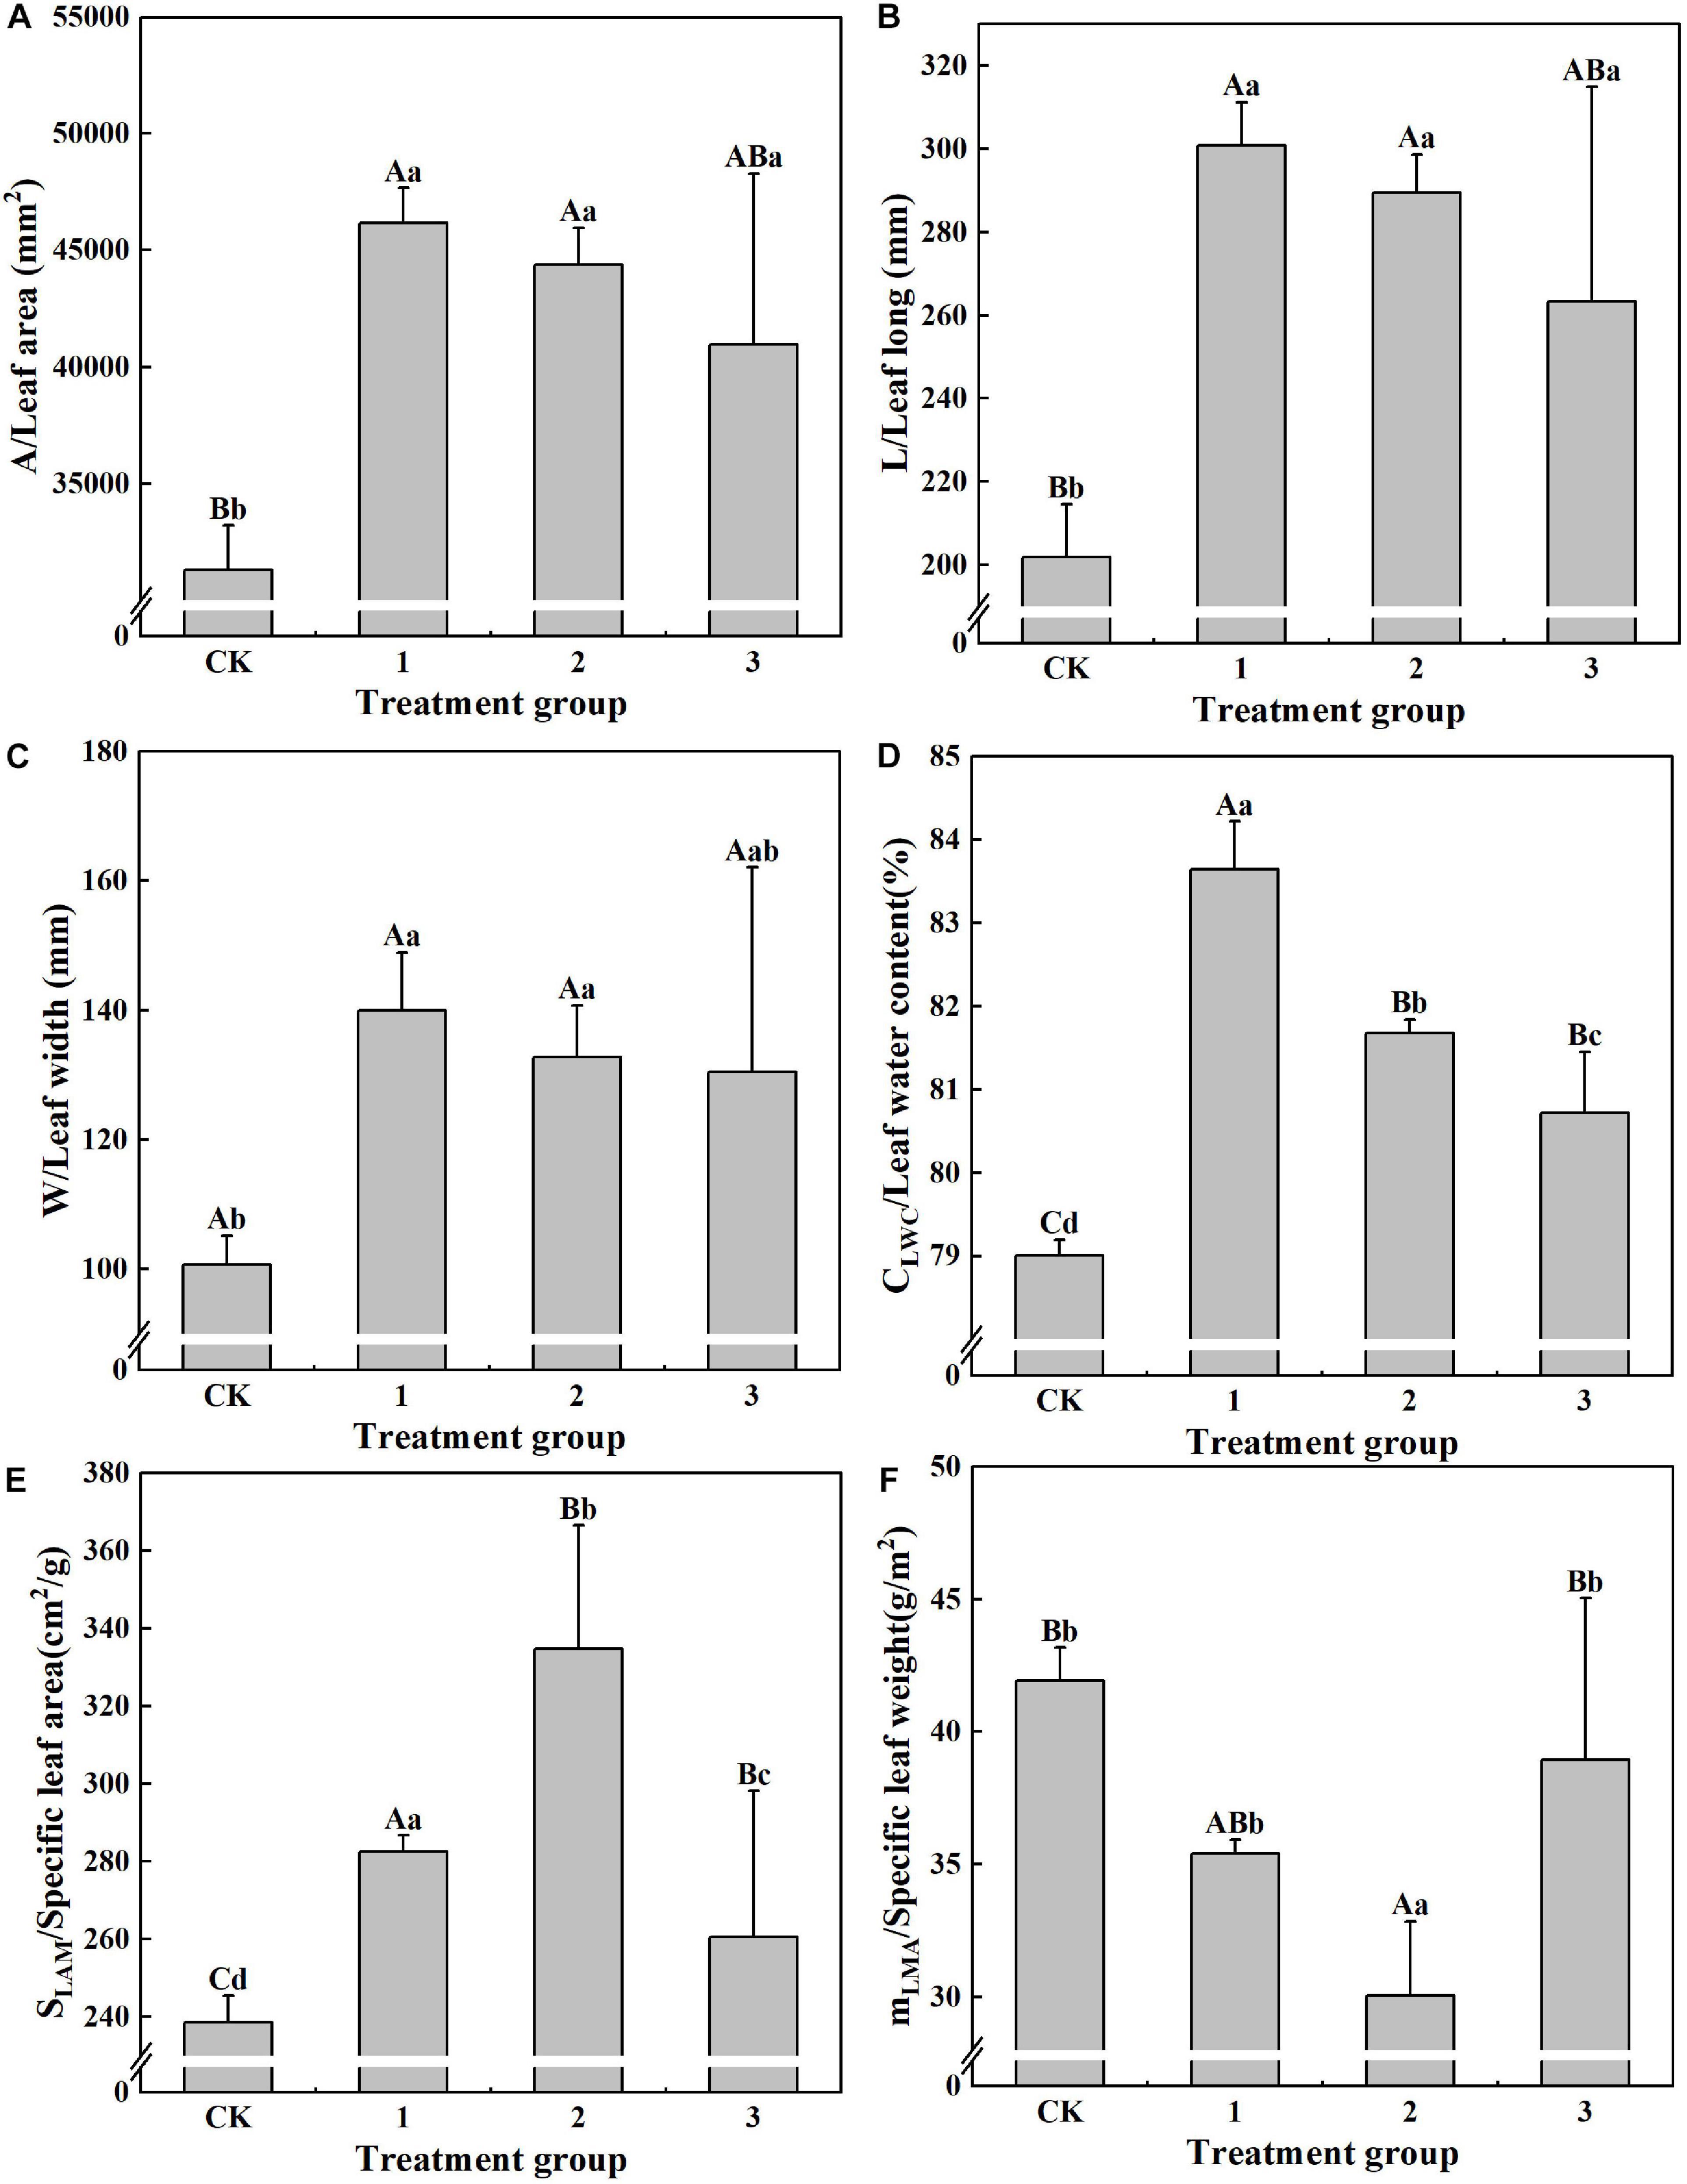
Figure 2. The effect of different treatments on the leaf properties of Horsfieldia hainanmensis The uppercase letters in the figure indicate P < 0.01, and the lowercase letters indicate P < 0.05, which, respectively, indicate extremely significant and significant differences (A–F), respectively, represent the different light transmittance to Horsfieldia hainanmensis the leaves A (Leaf area). L (Leaf long) W (Leaf width) CLWC (Leaf water content) SLAM (Specific leaf) and mLAM (Specific leaf height).
It can be seen from Figure 3 that under different treatments, Tr, Pn, and Gs gradually increase with increasing light intensity, while Pn light suppression is not apparent. Under the same light intensity, Tr, Pn, and Gs display a decreasing trend with increased shading. Pn under full light is the lowest, Tr and Gs under heavy shading are the lowest, and Ci increases with an increase in light intensity. A decrease in shading results in the opposite patterns for Tr, Pn, and Gs. Ci and intercellular CO2 concentration are greatest under heavy shade. These results suggest that light shading is beneficial to increasing the Tr, Pn, and Gs of H. hainanensis but not the Ci.
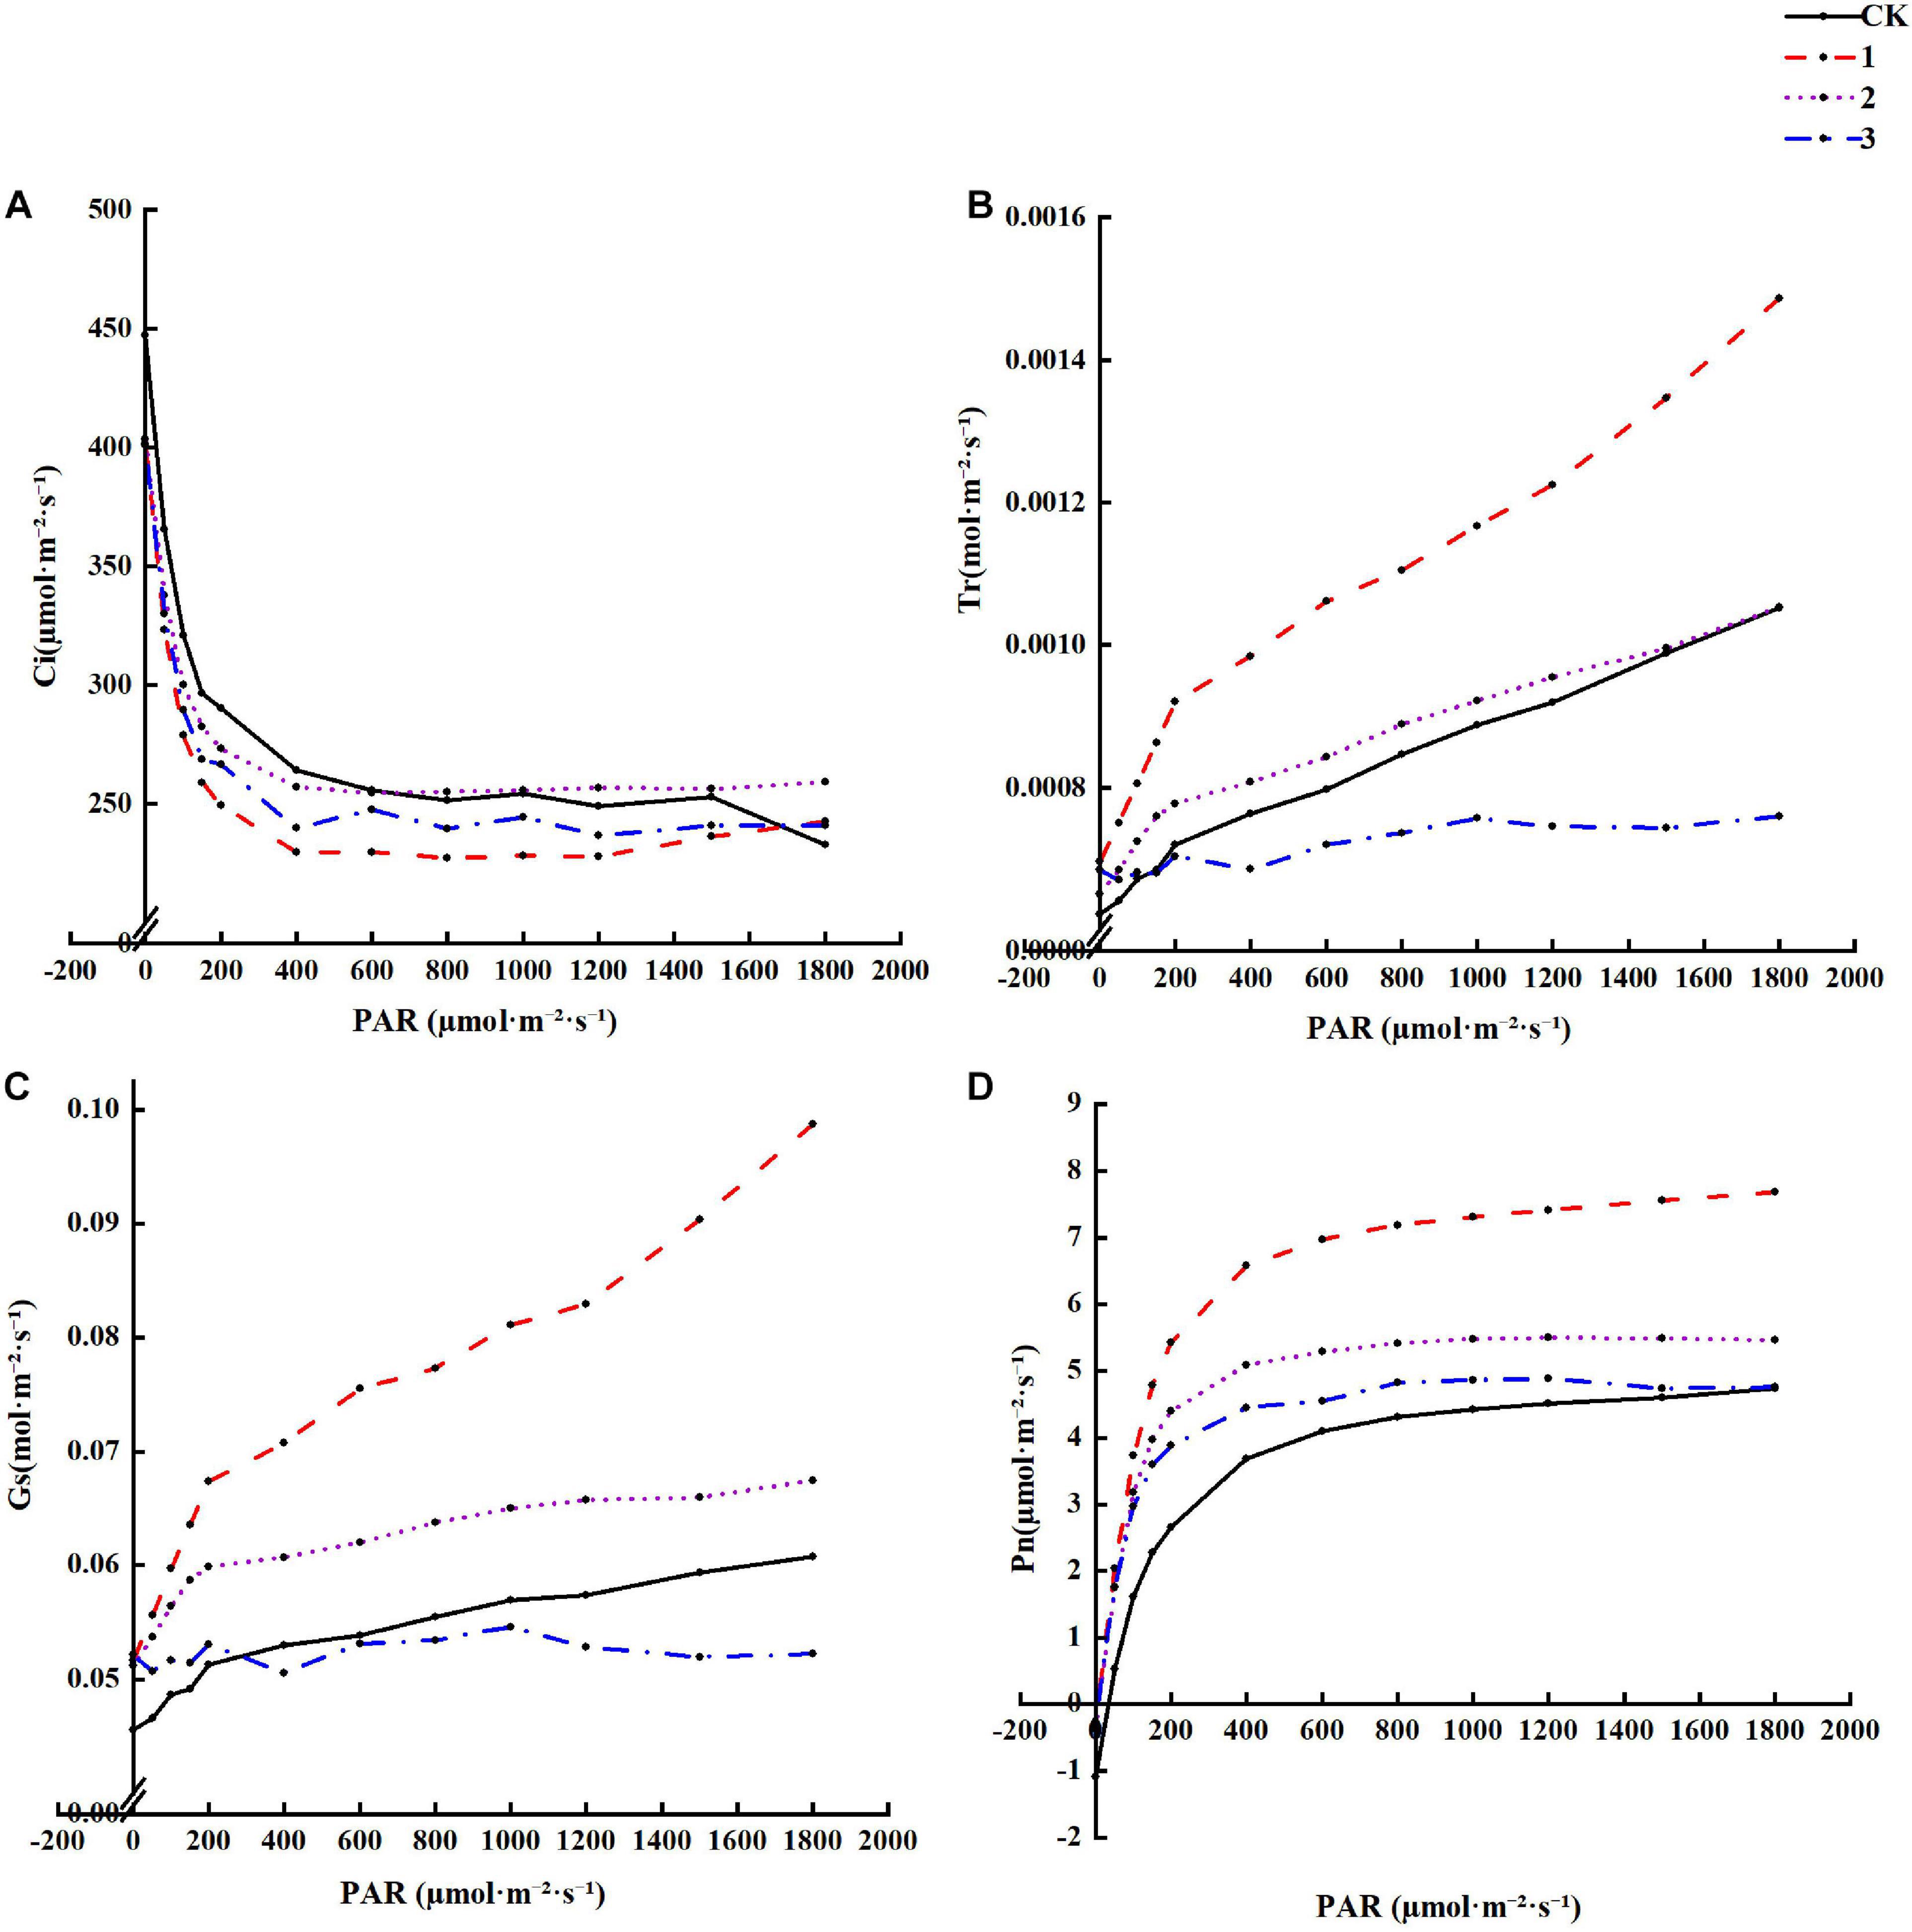
Figure 3. The effect of different treatments on the Photosynthetic characteristics Horsfieldia hainanmensis (A–D), respectively, represent the Ci (Intercellular CO2 concentration), Tr (Transpiration rate), Gs (Stomatal Conductance), and Pn (Net Photosynthetic rate) of the influence of different light transmittance to Horsfieldia hainanmensis the light response curve.
It can be seen from Figure 4 that different light intensities exhibit different effects on the photosynthetic parameter characteristics of H. hainanensis. No significant difference between treatments was found for the LSP and R2. For AQY, the CK group displays the smallest value (0.047), which is significantly smaller than that of the other treatment groups. The Pnmax of treatment group 1 was the largest (7.854 μmol⋅m–2⋅s–1) and is significantly larger than that of the CK group and treatment group 3 (1.64 times and 1.62 times greater, respectively; Figure 4B). The LCP and Rd in the CK group are 5.42, 4.65, and 6.75 times greater and 2.77, 2.51, and 3.73 times greater than treatment groups 1–3, respectively, and demonstrated extremely significant differences (P < 0.01). These results indicate that shading did not affect LSP and R2. Shading helps to increase AQY and Pnmax but is not conducive to increasing LCP or Rd.
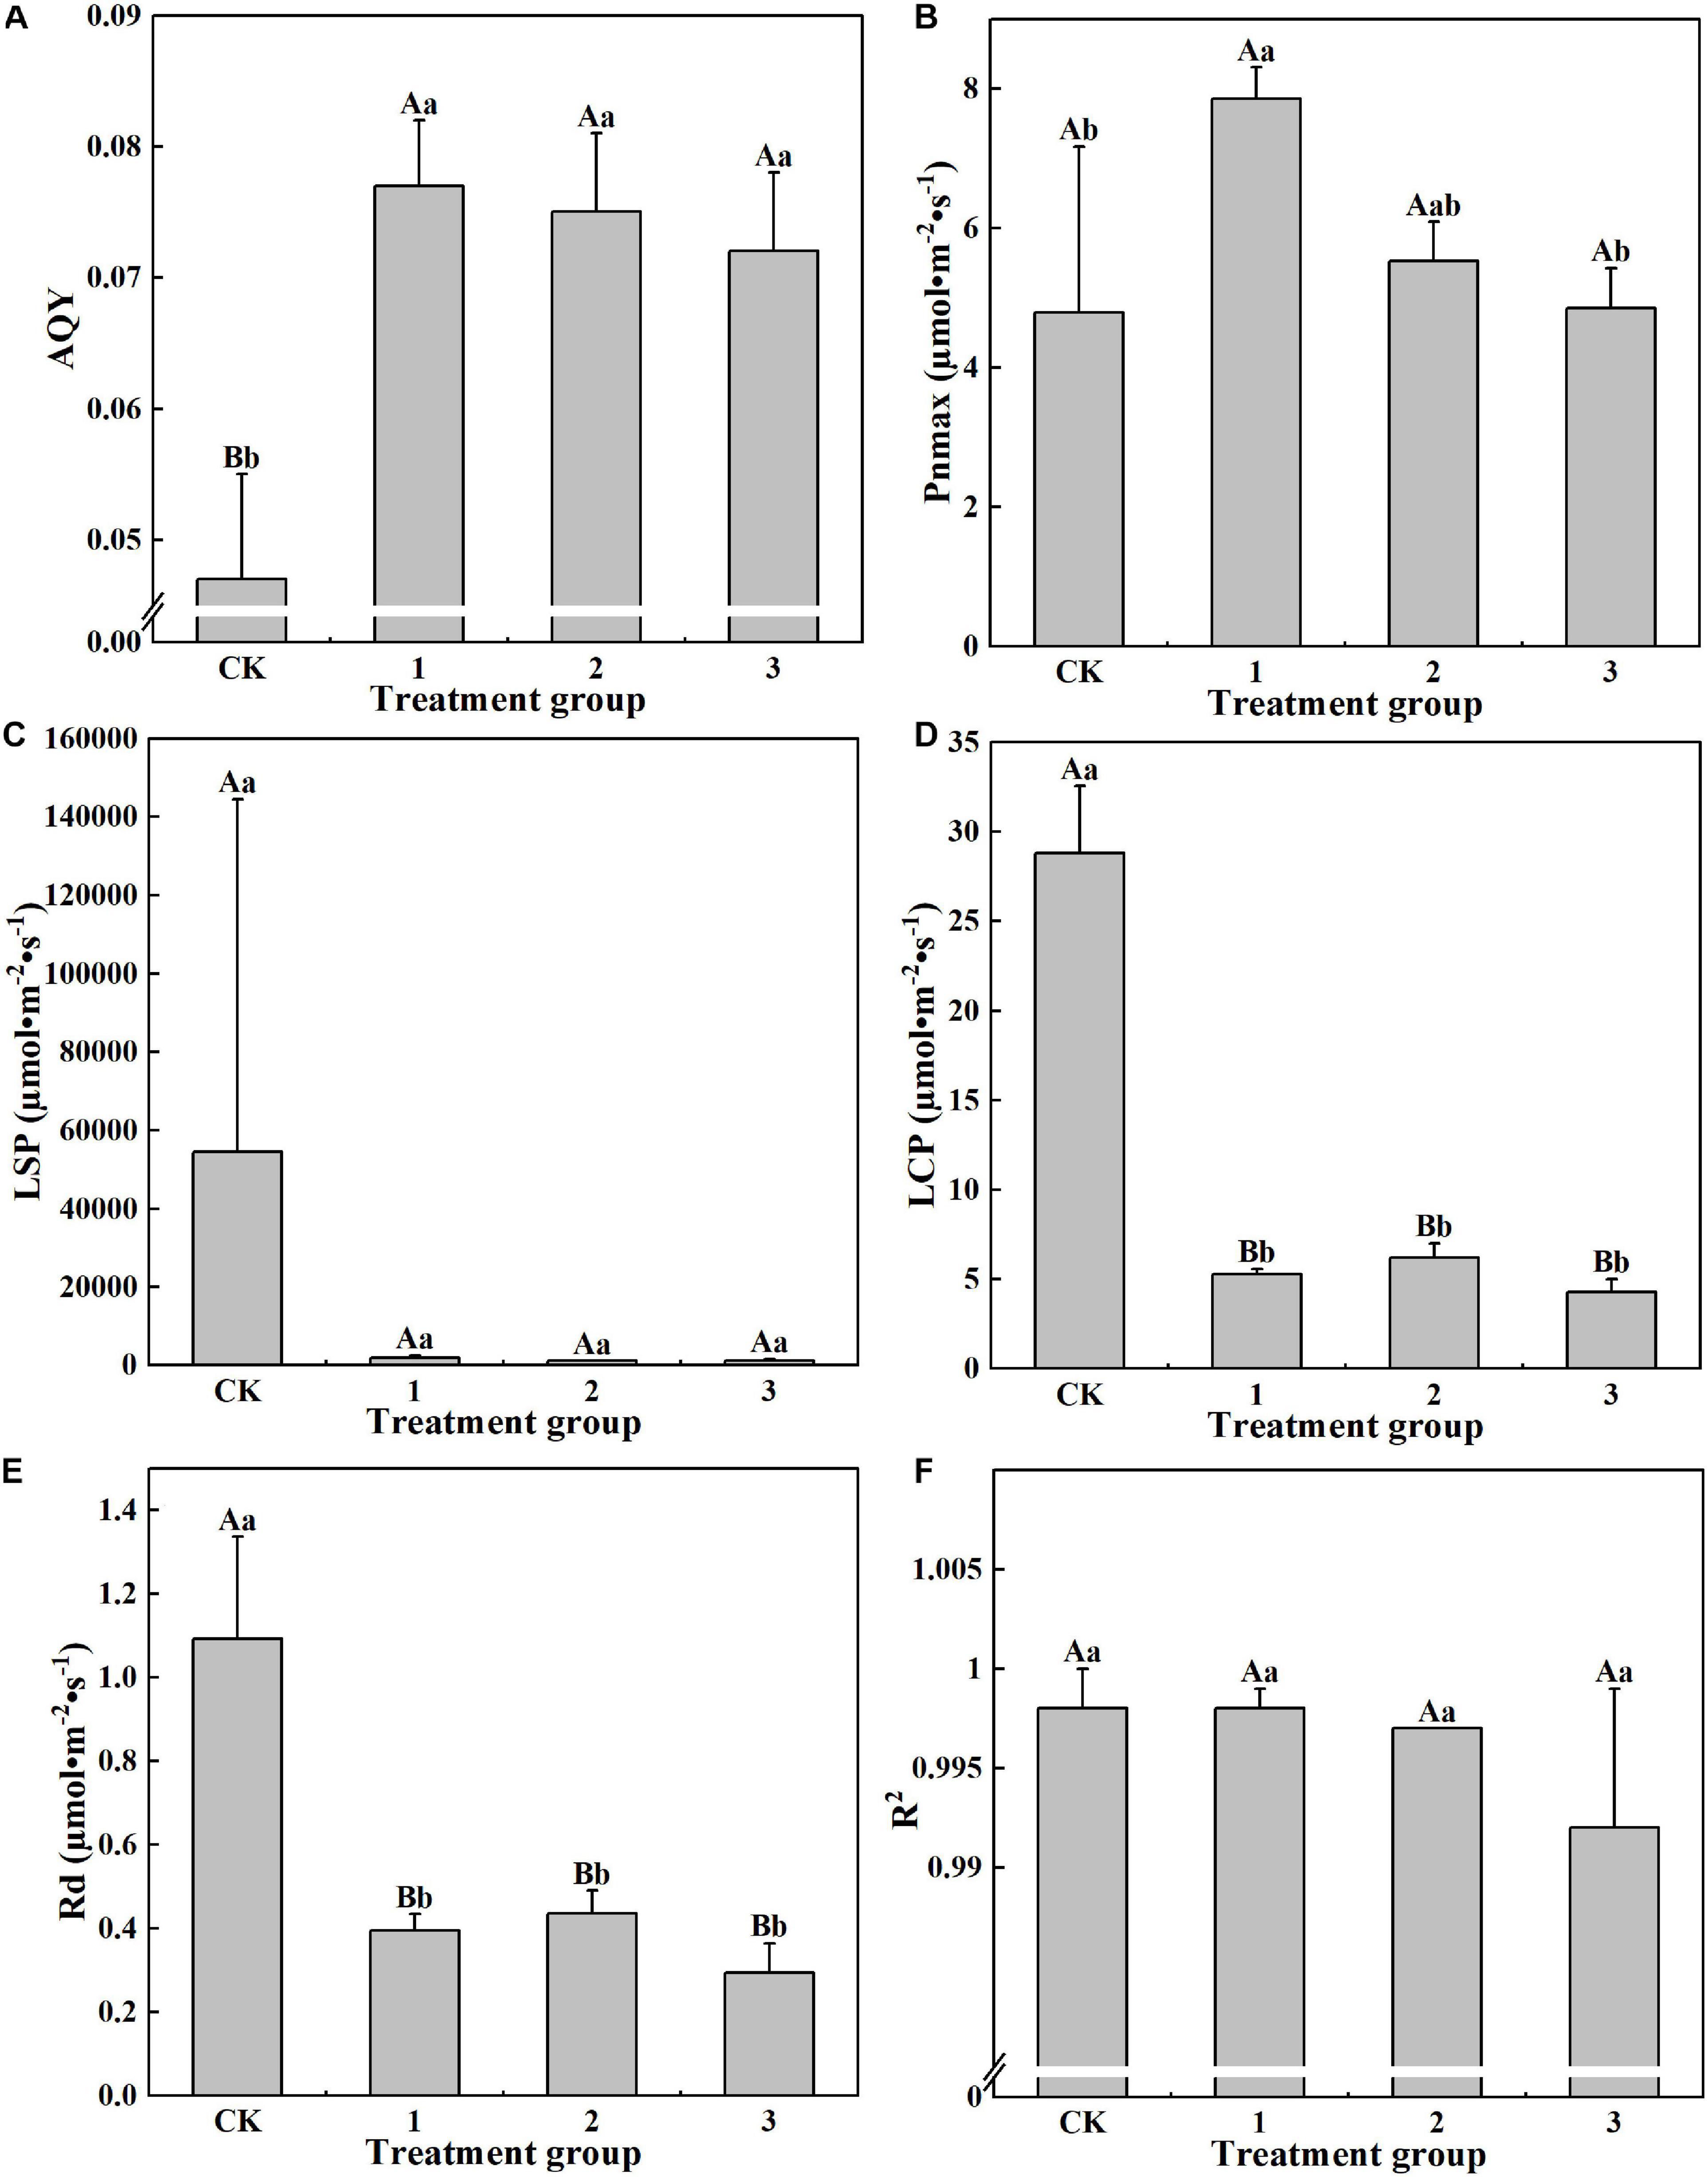
Figure 4. The effect of different treatments on the Photosynthetic parameters of Horsfieldia hainanmensis The uppercase letters in the figure indicate P < 0.01, and the lowercase letters indicate P < 0.05, which, respectively, indicate extremely significant and significant differences (A–F), respectively, represent. The apparent quantum efficiency (AQY) Light -saturated net Photosynthetic rate (Pnmax) light saturation point (LPS) compensation point (LCP), dark respiration rate (Rd) and coefficient of determination (R2) of the influence of different light transmittance on Horsfieldia hainanmensis.
Differing light intensities exhibited little effect on the photosynthetic pigments of H. hainanensis. From Figure 5A, we can see that there are no significant differences among the photosynthetic pigments of treatment groups 1, 2, and 3. The Chl, Chla, and Chl b contents of the CK group (0.810, 0.589, and 0.221 mg/g, respectively), are significantly smaller (P < 0.05) than those of treatment group 3. The Chl a/b value of treatment group 2 was significantly lower (p < 0.05) than that of treatment group 3. There was no significant difference in the Caro level among treatment groups. These results indicate that shading can increase the Chl, Chl a, and Chl b contents in H. hainanensis leaves.
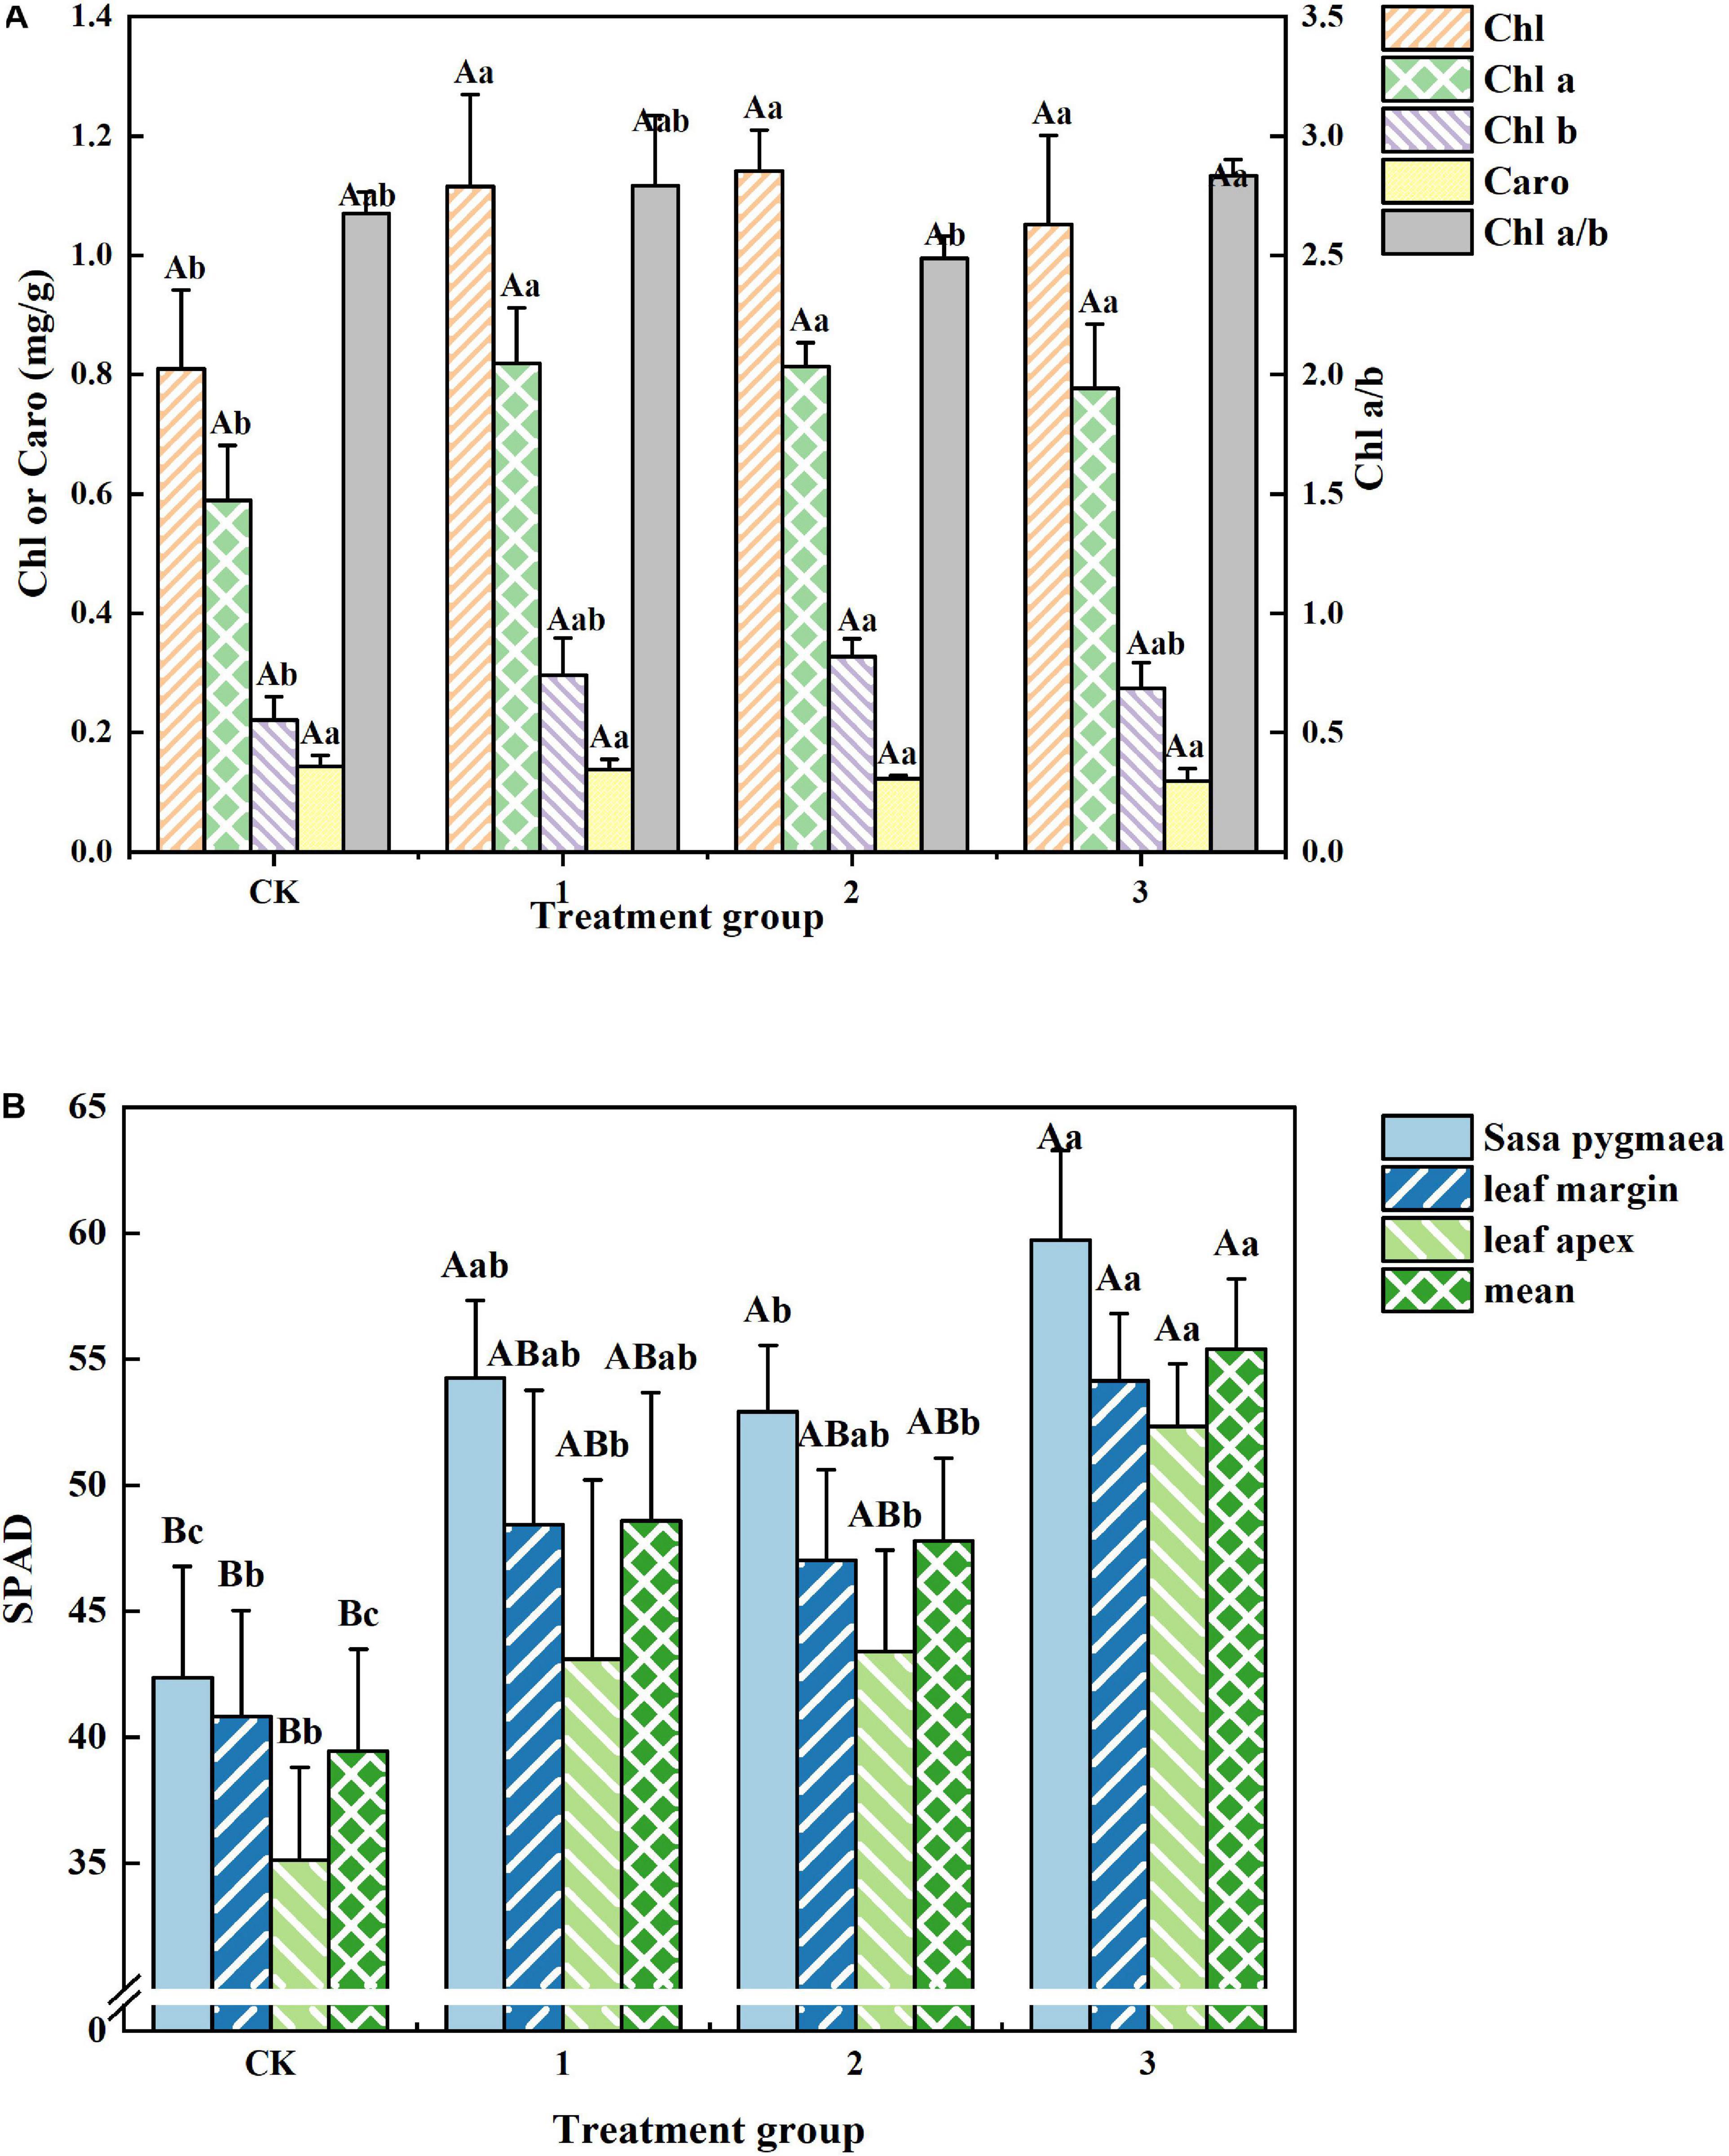
Figure 5. The effect of different treatments on the Photosynthetic pigment content of Horsfieldia hainanmensis. The uppercase letters in the figure indicate P < 0.01, and the lowercase letters indicate P < 0.05, which, respectively, indicate extremely significant and significant differences (A) shows the influence of different light transmittance on Horsfieldia hainanmensis ChlorphyII, Chol a (ChlorphyII A) Chol b (ChlorphyII B), Chol a/b (ChlorphyII A/B), and Caro (carotenoid). (B) Represents the influences of different transmittance on the SPAD value of different position of the blades of Horsfieldia hainanmensis.
It can be seen from Figure 5B that the Chl-SPAD value of each leaf part in treatment group 3 is significantly greater than that of the CK group. The Chl-SPAD of the leaf tip (Chl-SPAD-leaf tip) of treatment group 2 exhibits a significant difference compared with that of treatment group 3. The mean value of the Chl-SPAD of the leaf base (Chl-SPAD-leaf base) of treatment group 2 was significantly greater than that of the CK group and significantly smaller than that of treatment group 3. The Chl-SPAD-leaf tip of treatment group 1 was significantly different compared to that of treatment group 3. These results indicate that shading can increase the Chl-SPAD value of each leaf part.
Based on Table 2, the photosynthetic physiological parameters of H. hainanensis display a sufficient correlation. AQY has a particularly significant negative correlation with LCP and Rd (P < 0.01) and a significant negative correlation with LSP (P < 0.05), while LCP exhibits a very significant positive correlation with Rd.
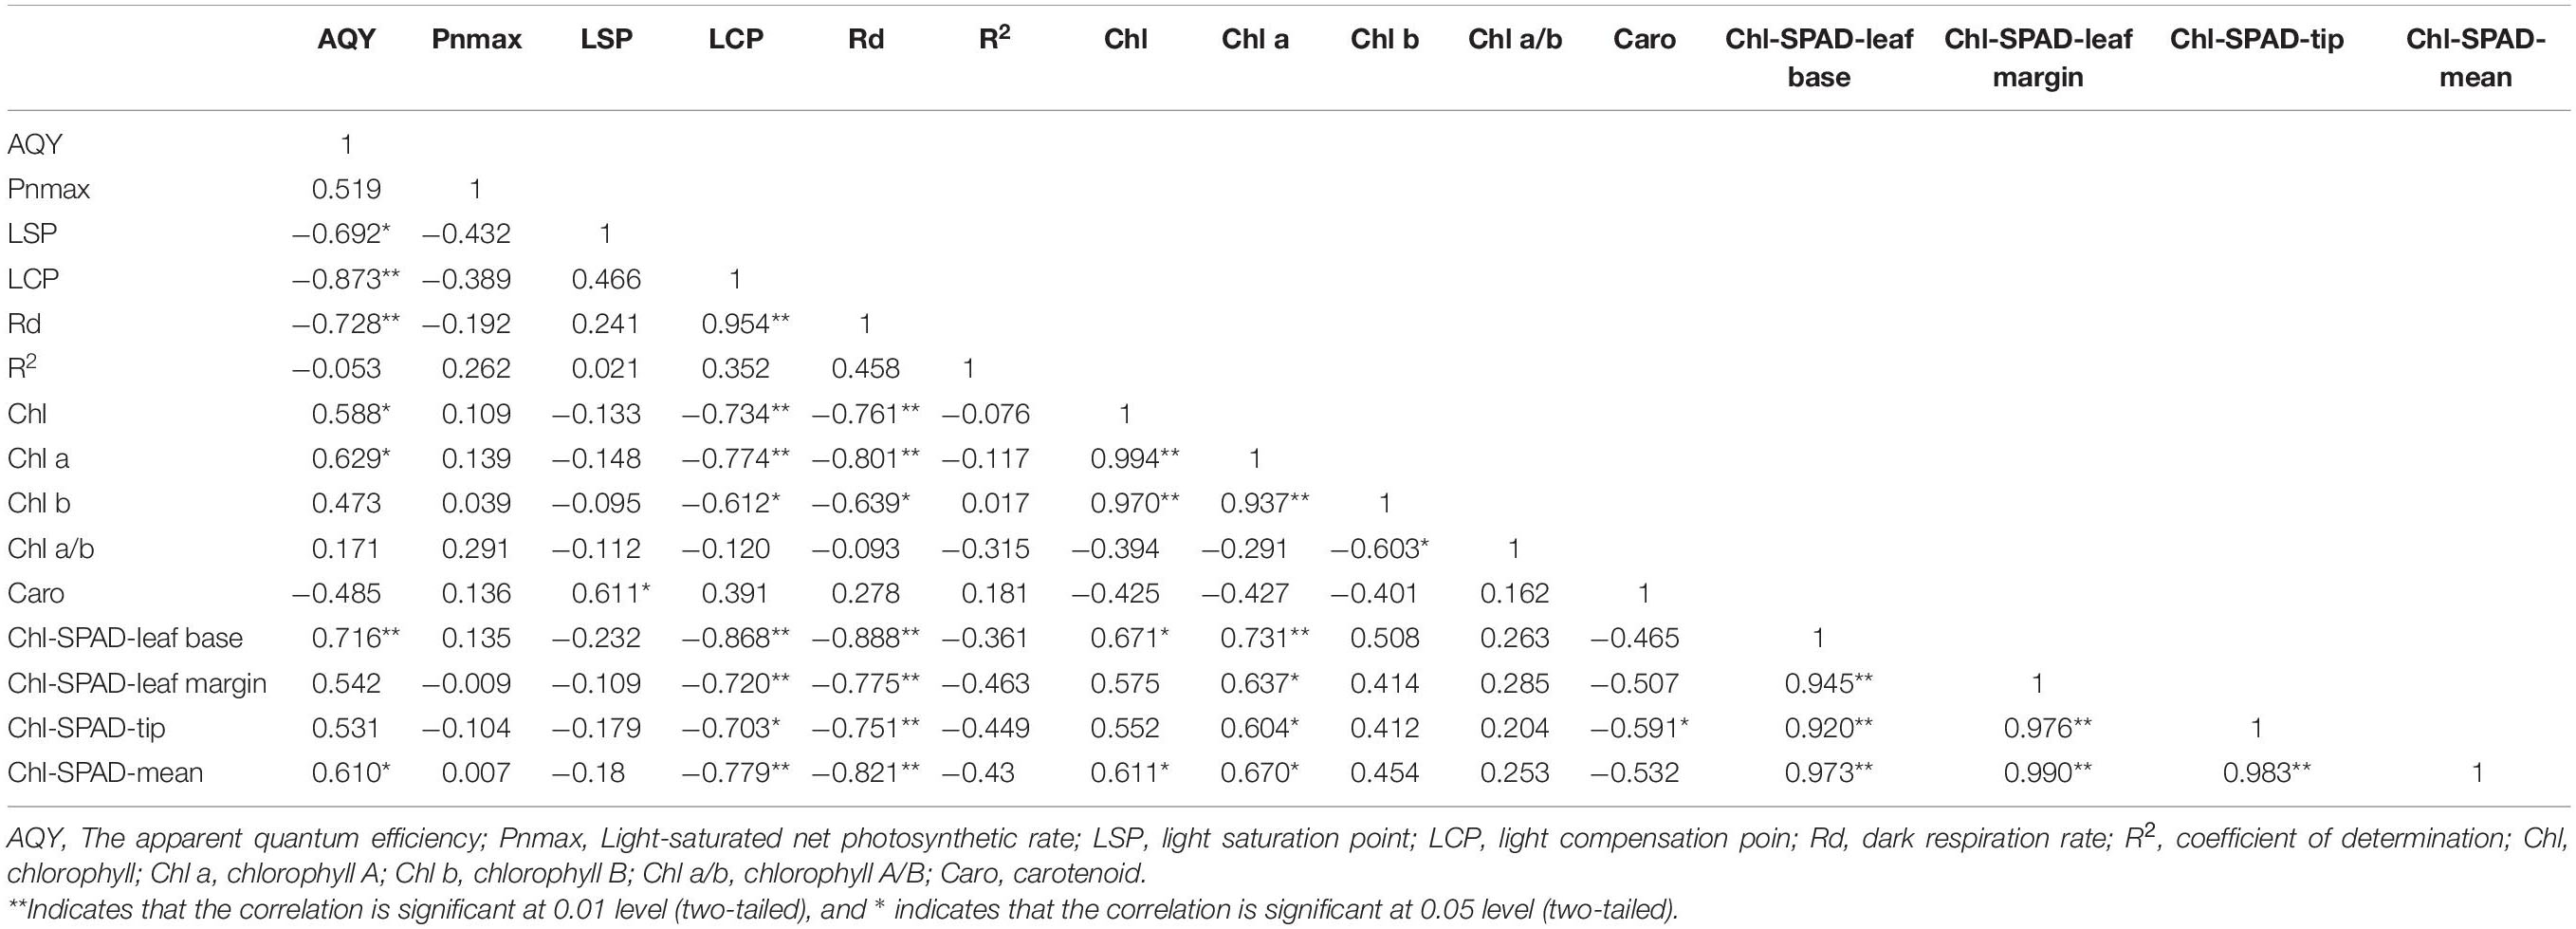
Table 2. Pearson correlation analysis of photosynthetic physiological and biochemical parameters and chlorophyll and other parameters.
The photosynthetic pigments of H. hainanensis display a strong correlation (Table 2). Chl demonstrates an extremely significant positive correlation with Chl a and Chl b (P < 0.01), and Chl-SPAD-leaf base and Chl-SPAD-mean exhibit a significant positive correlation (P < 0.05). Chl a has a particularly significant positive correlation with Chl b and Chl-SPAD-leaf base (P < 0.01) and a significant positive correlation with the Chl-SPAD-leaf margin, Chl-SPAD-leaf tip, and Chl-SPAD-mean (P < 0.05). Caro only exhibits a significant negative correlation with the Chl-SPAD-leaf tip (P < 0.05). The Chl-SPAD-leaf base, Chl-SPAD-leaf margin, Chl-SPAD-leaf tip, and Chl-SPAD-mean all demonstrate significant positive correlations (P < 0.01).
There is also a correlation between the photosynthetic physiological parameters of H. hainanensis and the photosynthetic pigments (Table 2). AQY is significantly positively correlated with Chl, Chl a, and Chl-SPAD-mean (P < 0.05); it is also extremely significantly positively correlated with the Chl-SPAD-leaf base (P < 0.01). LCP and Rd are highly negatively correlated with Chl, Chla, Chl-SPAD-leaf base, Chl-SPAD-leaf margin, Chl-SPAD-tip, and Chl-SPAD-mean (P < 0.01), and there is a significant negative correlation with Chlb (P < 0.05).
Discussion
Light is one of the necessary conditions for plant growth and development. Plants use photosynthetic pigments to capture light energy to conduct photosynthesis. PAR size affects the formation, content, and distribution of photosynthetic pigments, which in turn effect photosynthesis and plant growth (Austin et al., 1996; Blot et al., 2009; Han et al., 2020). The ability of plants to utilize light energy is a direct manifestation of the level and ratio of their chlorophyll content. Weak light transmittance (shading) typically results in a decrease in the proportion of red light absorbed by Chl a and an increase in the proportion of blue light absorbed by Chl b (De Jesus Raposo et al., 2013; Watanabe and Ikeuchi, 2013; Mulders et al., 2014). This study found that the SPAD value of H. hainanensis is significantly correlated with its chlorophyll content (Table 2). In addition, we found that the Chl, Chl a, and Chl b contents of the CK group were significantly smaller than those of the treatment groups (Figure 5A), which may be due to the inhibition of photosynthetic pigment formation under full light conditions. Furthermore, the Chl-SPAD value of each leaf part in the CK group was significantly lower than that of the other treatment groups, while the SPAD values of the leaf parts demonstrated the following order: leaf base > leaf edge > leaf tip (Figure 5B). From this, we can conclude that H. hainanensis is not conducive to the formation of photosynthetic pigments under full light, and proper shading should be implemented during nursery and return to planting.
Light is one of the most important environmental factors in photosynthesis, which in turn affects the survival and growth of plants (Nawaz et al., 2020). Studying the effects of different levels of shade on plant physiological characteristics is conducive to revealing plant growth patterns, while the light response curve of plant photosynthesis particularly crucial for studying the photochemical reaction process (Epila et al., 2018; Du et al., 2020). The role of light in photosynthesis is primarily to provide the energy required for the formation of the assimilation force, activate certain enzymes involved in photosynthesis, promote the opening of the stomata, and regulate the development of photosynthetic machinery (Puji and Doland, 2017; Dörken and Lepetit, 2018). Pn measures the photosynthetic physiological stress ability of plants under adversity conditions (Farquhar and Sharkey, 1982). We found that the Pn of each treatment group gradually increased with an increase in PAR. Additionally, the Pn of each treatment group was greater than that of the CK group, and it continued to decrease as the shading level increased (Figure 3D). The main influencing factors of Pn were Ci and Gs (Zhang et al., 2017). Ci is indispensable for determining the primary cause of the photosynthetic rate change and whether it is a stomatal factor (Shubhangi et al., 2018). This study found that Ci gradually decreased as the PAR increased, and the Ci value of each treatment group was smaller than that of the CK group (Figure 3A).
The Ci size depends on four factors: the CO2 concentration of the air around the leaves, Gs, mesophyll conductance (gm), and the photosynthetic activity of the mesophyll cells (Januskaitiene, 2011). Gs represents the degree of stomatal opening, which is the primary factor affecting plant photosynthesis and respiration, with a direct impact on transpiration (Kinose et al., 2020; Zhen and Bruce, 2020). This study found that the Gs of each treatment group gradually increased with an increase in PAR. When the PAR value was small, the Gs continued to decrease as the shading degree increased (Figure 3C). When the PAR value was greater than approximately 300 μmol⋅m–2⋅s–1, the Gs of treatment group 3 appeared to be smaller than that of the CK group. Tr was the main driving force behind the absorption and transportation of water. It can accelerate the rate of inorganic salt transport to the above-ground part of the plant, reduce the plant body temperature, and induce leaf photosynthesis under strong light conditions without harming the plant (Lapidot et al., 2019; Jafarikouhini et al., 2020). We found that Tr gradually increased as PAR increased, and the Tr value of each treatment group gradually decreased as the shading degree increased. The Tr value of the CK group was smaller than that of each treatment group and greater than the maximum shading treatment group (Figure 3B). This experiment demonstrates that under certain shade conditions, the Tr, Pn, and Gs of H. hainanensis can be increased and the Ci can be reduced.
This study found that, compared with full light conditions, light shading can increase the Pnmax of H. hainanensis. Excessive shading exhibits no effect on the Pnmax of H. hainanensis (Figure 4B). This may be due to increases in the chlorophyll content per unit area (Figure 5A) and the Tr, Pn, and Gs (Figure 3). The AQY measures the conversion efficiency of light energy in photosynthesis under low light conditions. The larger the AQY, the stronger the ability of plants to use light energy, and the more pigment-protein complexes can absorb and transform light energy (Liu et al., 2013). This study found that the AQY values of H. hainanensis under the shading treatments were significantly greater than that of the CK group (P < 0.01; Figure 4A), indicating that H. hainanensis light utilization is enhanced under shading conditions. The LCP, LSP, and Rd reflect the ability of plants to adapt to a light environment. Plants with lower LCP, LSP, and Rd values can grow more efficiently in an environment with lower light transmittance (Sobrado and Turner, 1983; Dias-Filho, 2002; Iryna et al., 2004). In this study, the LCP, LSP, and Rd of the CK group were significantly higher than those of the treatment groups (P < 0.01; Figures 4C–E). We also found that the AQY value significantly increased under shading conditions (P < 0.01; Figure 4A). We speculate that this occurred to allow H. hainanensis to enhance its light capture ability under low light conditions. The lower levels of LCP, LSP, and Rd ensure that H. hainanensis can more effectively adapt to the decrease in light quantum density, reduce its loss of photosynthetic products due to respiration, and maintain a carbon metabolism balance and higher photosynthesis rate. The environmental conditions of plant growth and the plant physiological characteristics greatly impact the light response characteristic parameters (Sun et al., 2009). The reason for this can be discovered by studying the physiological activity of the H. hainanensis leaves.
When the shading level was increased, the plants adjusted through a series of growth and physiological responses, such as increasing plant height, ground diameter, leaf area, leaf length, leaf width, and specific leaf area to adapt to the environment (Mirzaei et al., 2007; Cho et al., 2008). This study found that the growth rates of H, H/D, and D in the 44.41% light transmittance treatment groups were significantly higher than those in the CK group (Figure 1). The weak light transmittance inhibited the CK group (Figure 1). This may be because when the plants are shaded, the assimilated carbon acts more on the vertical plant growth to obtain the maximum amount of light for the seedlings, thus reducing the carbon that acts on the growth of the plant base diameter (Gao et al., 2019). Additionally, low light adversely affects plant growth (Perrin and Mitchell, 2013). Leaves are one of the most sensitive and plastic plant organs (Brown et al., 2014). We found that with a decrease in the light transmittance (below 44.41%), the morphology and traits of the leaves did not significantly decrease, but they were significantly greater than those in the CK treatment group, especially for A, L, W, CLWC, and SLAM (Figure 2). Thus, under the condition of low light transmittance, H. hainanensis can increase the leaf area and expand the light absorption area to increase its photosynthetic efficiency to handle the stress caused by low light transmittance (Song et al., 2015; Konôpka et al., 2016).
In summary, the growth and development of H. hainanensis under both full and low light are restricted. Thus, we can infer why H. hainanensis development is rare under natural conditions. First, it may be that the surrounding trees are typically tall and dense, and the light under the forest is weak. Therefore, the H. hainanensis seedlings cannot photosynthesize during the growth and development process, and the energy stored by the plant is lower, causing the plant to often fail to grow and die. Second, the mother tree has fewer accompanying species. If the light intensity is too high, the photosynthetic rate can reach the maximum value, and a vast amount of energy can be accumulated. However, during the research process, it was found that full light can easily cause leaf burns while the leaves are small, which greatly reduces the energy available for plant growth and development, causing the seedlings to die. Therefore, during the in situ protection and natural return planting of H. hainanensis, we must properly shade the seedlings under full light conditions, and we must effectively cut down surrounding trees when planting and protecting the tall and lush forests to increase light intensity.
Conclusion
The results of this study impact two aspects of the H. hainanensis and provide guidance for its local protection and return to planting. First, full care and weak light restrict the growth of H. hainanensis seedlings at different levels, which cause the seedlings of H. hainanensis to wither and die. Second, the physiological response of H. hainanensis to light intensity is interrelated with photosynthesis parameters and photosynthetic pigments, which exhibit a very significant correlation (P < 0.01). Therefore, we must control the light at approximately 44.4% during in situ conservation and return planting of H. hainanensis. However, due to the limited number of plant samples, there is little research in this area. It is necessary to further increase the number of plants through conservation and natural regression to provide additional samples for research to reduce errors. In this study, enzymes, minerals, and other related indicators were not measured, and further research on these factors is required.
Data Availability Statement
The datasets presented in this study can be found in online repositories. The names of the repository/repositories and accession number(s) can be found in the article/supplementary material.
Author Contributions
XW, GC, and XY designed the research, analyzed the data, and wrote the manuscript. XW, GC, SD, HW, RF, and XY performed the research. All authors contributed to the article and approved the submitted version.
Funding
This work was funded by the Provincial Scientific Research Institutes Technology Development Special Projects of Hainan (KYYS-2019-24).
Conflict of Interest
The authors declare that the research was conducted in the absence of any commercial or financial relationships that could be construed as a potential conflict of interest.
Acknowledgments
We would like to thank all the reviewers who participated in the review and MJEditor (mjeditor.com) for its linguistic assistance during the preparation of this manuscript.
References
Austin, P. A., Ross, I. S., and Mills, J. D. (1996). Regulation of pigment content and enzyme activity in the cyanobacterium Nostoc sp. Mac grown in continuous light, a light-dark photoperiod, or darkness. Biochim. Biophys. Acta Bioenerg. 1277, 141–149. doi: 10.1016/S0005-2728(96)00093-X
Ayuko, U., Tadahiko, M., and Amane, M. (2008). Effects of temperature on photosynthesis and plant growth in the assimilation shoots of a rose. Soil Sci. Plant Nutr. 54, 253–258. doi: 10.1111/j.1747-0765.2007.00234.x
Bepetel, M., and Lakso, A. N. (1998). Differential effects of shade on early-season fruit and shoot growth rates in empire apple. HortScience 33, 823–825. doi: 10.21273/HORTSCI.33.5.823
Blot, N., Wu, X. J., Thomas, J. C., Zhang, J., Garczarek, L., Bohm, S., et al. (2009). Phycourobilin in trichromatic phycocyanin from oceanic cyanobacteria is formed post-translationally by a phycoerythrobilin lyase-isomerase. J. Biol. Chem. 284, 9290–9298. doi: 10.1074/jbc.M809784200
Brown, C. E., Mickelbart, M. V., and Jacobs, D. F. (2014). Leaf physiology and biomass allocation of backcross hybrid American chestnut (Castanea dentata) seedlings in response to light and water availability. Tree Physiol. 34, 1362–1375. doi: 10.1093/treephys/tpu094
Cho, M. S., Kwon, K. W., Kim, G. N., and Woo, S. Y. (2008). Chlorophyll contents and growth performances of the five deciduous hardwood species growing under different shade treatments. Korean J. Agric. For. Meteorol. 10, 149–157. doi: 10.5532/KJAFM.2008.10.4.149
Cornelissen, J. H. C., Lavorel, S., Garnier, E., Díaz, S., Buchmann, N., Gurvich, D. E., et al. (2003). A handbook of protocols for standardised and easy measurement of plant functional traits worldwide. Aust. J. Bot. 51, 335–380. doi: 10.1071/BT02124
De Jesus Raposo, M. F., de Morais, R. M., and de Morais, A. M. (2013). Health applications of bioactive compounds from marine microalgae. Life Sci. 10, 479–486. doi: 10.1016/j.lfs.2013.08.002
Dias-Filho, M. B. (2002). Photosynthetic light response of the c4 grasses brachiaria brizantha and b. humidicola under shade. Sci. Agric. 59, 65–68. doi: 10.1590/S0103-90162002000100009
Dörken, V. M., and Lepetit, B. (2018). Morpho-anatomical and physiological differences between sun and shade leaves in Abies alba Mill. (Pinaceae, Coniferales): a combined approach. Plant Cell Environ. 41, 1683–1697. doi: 10.1111/pce.13213
Du, T. T., Meng, P., Huang, J. L., Peng, S. B., and Xiong, D. L. (2020). Fast photosynthesis measurements for phenotyping photosynthetic capacity of rice. Plant Methods 166:6. doi: 10.1186/s13007-020-0553-2
Editorial Committee of Chinese Flora of Chinese Academy of Sciences (1977). Flora of China. Beijing: Science Press.
El-Gizawy, A. M., Gomaa, H. M., El-Habbasha, K. M., and Mohamed, S. S. (1993). Effect of different shading levels on tomato plants 1. growth, flowering and chemical composition. Acta Hortic. 323, 341–348. doi: 10.17660/ActaHortic.1993.323.31
Epila, J., Hubeau, M., and Steppe, K. (2018). Drought effects on photosynthesis and implications of photoassimilate distribution in 11C-labeled leaves in the african tropical tree species maesopsis eminii engl. Forests 9:109. doi: 10.3390/f9030109
Farquhar, G. D., and Sharkey, T. D. (1982). Stomatal conductance and photosynthesis. Annu. Rev. Plant Physiol. 33, 317–345. doi: 10.1146/annurev.pp.33.060182.001533
Gao, Z., Khalid, M., Jan, F., Saeed -Ur-Rahman, and Yu, X. (2019). Effects of light-regulation and intensity on the growth, physiological and biochemical properties of aralia elata (miq.) seedlings. S. Afr. J. Bot. 121, 456–462. doi: 10.1016/j.sajb.2018.12.008
Gu, Q., Chen, Z. P., Yu, X. L., Cui, W. T., Pan, J. C., Zhao, G., et al. (2017). Melatonin confers plant tolerance against cadmium stress via the decrease of cadmium accumulation and reestablishment of microRNA-mediated redox homeostasis. Plant Sci. 261, 28–37. doi: 10.1016/j.plantsci.2017.05.001
Han, T. W., Tseng, C. C., Cai, M., Chen, K., Cheng, S. Y., and Wang, J. (2020). Effects of cadmium on bioaccumulation, bioabsorption, and photosynthesis in sarcodia suiae. Int. J. Environ. Res. Public Health 17:1294. doi: 10.3390/ijerph17041294
Hanson, T. L. (1975). Needle biomass of lodgepole pine from tree dimensions. Trans. Asae Gen. Ed. Am. Soc. Agric. Eng. 18, 0491–0492. doi: 10.13031/2013.36616
Harrison, W. G., and Platt, T. (1986). Photosynthesis-irradiance relationships in polar and temperature phytoplankton populations. Polar Biol. 5, 153–164. doi: 10.1007/BF00441695
Hase, H., Foelster, H., and Lindheim, F. M. (1985). On the accuracy of estimating aboveground tree biomass in an evergreen forest near manaus, brazil. a simulation study. Biotropica 17, 191–195. doi: 10.2307/2388216
Huang, J., Wang, H. Y., Zhong, Y. D., Huang, J. G., Fu, X. F., and Teng, W. C. (2019). Growth and physiological response of an endangered tree, Horsfieldia hainanensis Merr., to simulated sulfuric and nitric acid rain in southern China. Plant Physiol. Biochem. 144, 118–126. doi: 10.1016/j.plaphy.2019.09.029
Iryna, I., Tartachnyk., and Michael, M, B. (2004). Effect of delayed fruit harvest on photosynthesis, transpiration and nutrient remobilization of apple leaves. New Phytol. 164, 441–450. doi: 10.1111/j.1469-8137.2004.01197.x
Ishida, K. (1989). Influence of respiration rate and metabolic substances on nodal position of first flower bud of eggplant seedings. J. Japanese Soc. Hortic. Sci. 58, 657–660. doi: 10.2503/jjshs.58.657
Jafarikouhini, N., Pradhan, D., and Sinclair, T. R. (2020). Basis of limited-transpiration rate under elevated vapor pressure deficit and high temperature among sweet corn cultivars. Environ. Exp. Bot. 179:104205. doi: j.envexpbot.2020.104205
Januskaitiene, I. (2011). Effects of substrate acidity and UV-B radiation on photosynthesis of radishes. Open Life Sci. 6, 624–631. doi: 10.2478/s11535-011-0027-7
Jiang, Y. H. (2018). Ecological Characteristics and Endangered Reason Analysis of Horsfieldia Hainanensis Merr. as an Extremely Small Population, dissertation/master’s thesis, CSUFT, China.
Jiang, Y. H., Liu, X. S., Xiang, W. H., and He, Y. H. (2018). Genetic diversity and structure analysis of the endangered plant species Horsfieldia hainanensis Merr. Biotechnol. Biotechnol. Equ. 32, 95–101. doi: 10.1080/13102818.2017.1391122
Jiang, Y. H., Xiang, W. H., Jiang, Y., He, Y. H., and Lin, J. Y. (2016). Floristic composition, structure and phytogeographic characteristics of horsfieldia hainanensis community in guangxi. J. Beijing Forestry Univ. 38, 74–82.
Kinose, Y., Fukamachi, Y., Watanabe, M., and Izuta, T. (2020). Ozone-induced change in the relationship between stomatal conductance and net photosynthetic rate is a factor determining cumulative stomatal ozone uptake by Fagus crenata seedlings. Trees Struct. Funct. 34, 445–454. doi: 10.1007/s00468-019-01927-1
Konôpka, B., Pajtík, J., Marušák, R., Bošel’a, M., and Lukac, M. (2016). Specific leaf area and leaf area index in developing stands of Fagus sylvatica L. and Picea abies Karst. For. Ecol. Manag. 364, 52–59. doi: 10.1016/j.foreco.2015.12.005
Krause, G. H., and Weis, E. (1991). Chlorophyll fluorescence and photosynthesis: the basics. Annu. Rev. Plant Physiol. Plant Mol. Biol. 42, 313–349. doi: 10.1146/annurev.pp.42.060191.001525
Kruse, J., Hopmans, P., and Adams, M. A. (2008). Temperature responses are a window to the physiology of dark respiration: differrences between CO2 release and O2 reduction shed light on energy conservation. Plant Cell Environ. 31, 901–914. doi: 10.1111/j.1365-3040.2008.01808.x
Lapidot, O., Ignat, T., Rud, R., Rog, I., Alchanatis, V., and Klein, T. (2019). Use of thermal imaging to detect evaporative cooling in coniferous and broadleaved tree species of the Mediterranean maquis. Agric. For. Meteorol. 271, 285–294. doi: 10.1016/j.agrformet.2019.02.014
Leite, F. T., Cavatte, P. C., Garbin, M. L., Hollunder, R. K., Santos, K. F., Capetine, T. B., et al. (2019). Surviving in the shadows: light responses of co-occurring Rubiaceae species within a tropical forest understory. Flora 261:151487. doi: 10.1016/j.flora.2019.151487
Li, Y. T., Xu, W. W., Ren, B. Z., Zhao, B., Zhang, J. W., Liu, P., et al. (2020). High temperature reduces photosynthesis in maize leaves by damaging chloroplast ultrastructure and photosystem II. J. Agron. Crop Sci. 206, 548–564. doi: 10.1111/jac.12401
Liu, S. B., Mei, W. L., Zeng, Y. B., Wang, H., Li, X. N., and Dai, H. F. (2010). Study on the fat-soluble constituents of li yao Horsfieldia hainanensis Merr. Chin. J. Ethnomed. Ethnopharm. 19, 147–149.
Liu, X. S., He, Y. H., Xiao, Y. F., Wang, Y., Jiang, Y. H., and Jiang, Y. (2019). Soil seed burial and competition with surrounding plants determine the emergence and development of seedling of an endangered species Horsfieldia hainanensis Merr. in China. Sci. Rep. 9, 703–715. doi: 10.1038/s41598-019-54644-7
Liu, X., Fan, Y., Long, J., Wei, R., Kjelgren, R., Gong, C., et al. (2013). Effects of soil water and nitrogen availability on photosynthesis and water use efficiency of Robinia pseudoacacia seedlings. J. Environ. Sci. 25, 585–595. doi: 10.1016/S1001-0742(12)60081-3
Lore, T. V., Leandro, V. L., Philippe, C., Elodie, A. C., Sara, V., Josep, P., et al. (2020). Coping with branch excision when measuring leaf net photosynthetic rates in a lowland tropical forest. Biotropica 52, 608–615. doi: 10.1111/btp.12774
Mansoure, H., Rezaei, N. A., Mohsen, K., Kazem, S. M., and Karim, S. (2020). Nitrate improves hackberry seedling growth under cadmium application. Heliyon 6:e03247. doi: 10.1016/j.heliyon.2020.e03247
Mirzaei, J., Tabari, M., and Daroodi, H. (2007). Early growth of quercus castaneifolia (c.a. meyer) seedlings as affected by weeding, shading and irrigation. Pak. J. Biol. Sci. 10, 2430–2435. doi: 10.3923/pjbs.2007.2430.2435
Mulders, K. J. M., Lamers, P. P., Martens, D. E., Wijffels, R. H., and Bassi, R. (2014). Phototrophic pigment production with microalgae:biological constraints and opportunities. J. Phycol. 50, 229–242. doi: 10.1111/jpy.12173
Nawaz, R., Abbasi, N. A., Hafiz, I. A., and Khalid, A. (2020). Impact of climate variables on growth and development of Kinnow fruit (Citrus nobilis Lour x Citrus deliciosa Tenora) grown at different ecological zones under climate change scenario. Sci. Hortic. 260:108868. doi: 10.1016/j.scienta.2019.108868
Perrin, P. M., and Mitchell, F. J. G. (2013). Effects of shade on growth, biomass allocation and leaf morphology in European yew (Taxus baccata L.). Eur. J. For. Res. 132, 211–218. doi: 10.1007/s10342-012-0668-8
Platt, T., Gallegos, C. L., and Harrison, W. G. (1980). Photoinhibition of photosynthesis in natural assemblages of marine phytoplankton. J. Mar. Res. 38, 687–701.
Puji, L. D., and Doland, N. J. (2017). Seedlings of subtropical rainforest species from similar successional guild show different photosynthetic and morphological responses to varying light levels. Tree Physiol. 37, 186–198.
Shubhangi, L., Marianne, H., Mats, R., Nitin, C., Sune, L., Danielle, W., et al. (2018). Physiological acclimation dampens initial effects of elevated temperature and atmospheric CO2 concentration in mature boreal Norway spruce. Plant Cell Environ. 41, 300–313. doi: 10.1111/pce.13079
Sobrado, M. A., and Turner, N. C. (1983). A comparison of the water relations characteristics of helianthus annuus and helianthus petiolaris when subjected to water deficits. Oecologia 58, 309–313. doi: 10.1007/BF00385228
Song, K. S., Jeon, K. S., Choi, K. S., Kim, C. H., and Kim, J. J. (2015). Characteristics of photosynthesis and leaf growth of peucedanum japonicum by leaf mold and shading level in forest farming. Korean J. Med. Crop Ence 23, 43–48. doi: 10.7783/KJMCS.2015.23.1.43
Sun, C. X., Qi, H., Hao, J. J., Miao, L., Wang, J., Wang, Y., et al. (2009). Single leaves photosynthetic characteristics of two insect-resistant transgenic cotton (Gos-sypium hirsutum L.) varieties in response to light. Photosynthetica 47, 399–408. doi: 10.1007/s11099-009-0061-0
Wang, L. S. (2017). Effects of Different Fertilization Treatments on the Growth and Physiological Characteristics of Horsfieldia hainanensis Merr. Seedlings. dissertation/master’s thesis, Guangxi University, China.
Watanabe, M., and Ikeuchi, M. (2013). Phycobilisome: architecture of alight-harvesting supercomplex. Photosynth. Res. 116, 265–276. doi: 10.1007/s11120-013-9905-3
Xu, Y. L., Cai, N. H., Wu, Y., and Duan, A. A. (2012). Fatty acid composition of several plants of horsfieldia. China Oils Fats 37, 80–82.
Yang, Y., Liu, Q., Chen, Y. K., Wang, Y., and Chen, Q. (2019). The complete chloroplast genome of Horsfieldia hainanensis an endangered species with extremely small populations. Mitochondrial DNA B 4, 2654–2655. doi: 10.1080/23802359.2019.1644556
Ye, Z. P., and Zhao, Z. H. (2010). A modified rectangular hyperbola to describe the light-response curve of photosynthesis of Bidens pilosa L. grown under low and high light conditions. Front. Agric. China 4, 50–55. doi: 10.1007/s11703-009-0092-0
Zhang, X., Cao, Q., and Jia, G. (2017). A protocol for fertility restoration of F1 hybrid derived from Lilium ×formolongi ‘Raizan 3’ ×Oriental hybrid ‘Sorbonne’. Plant Cell Tissue Organ. Cult. 129, 375–386. doi: 10.1007/s11240-017-1184-9
Zhen, S. Y., and Bruce, B. (2020). Steady-state stomatal responses of C3 and C4 species to blue light fraction: interactions with CO2 concentration. Plant Cell Environ. 43, 3020–3032. doi: 10.1111/pce.13888
Keywords: Horsfieldia hainanensis, illumination intensity, growth, photosynthetic physiology, photosynthetic pigment
Citation: Wang X, Chen G, Du S, Wu H, Fu R and Yu X (2021) Light Intensity Influence on Growth and Photosynthetic Characteristics of Horsfieldia hainanensis. Front. Ecol. Evol. 9:636804. doi: 10.3389/fevo.2021.636804
Received: 02 December 2020; Accepted: 23 February 2021;
Published: 12 March 2021.
Edited by:
Guangyu Wang, University of British Columbia, CanadaReviewed by:
Runguo Zang, Chinese Academy of Forestry, ChinaHuai Yang, International Center for Bamboo and Rattan, China
Copyright © 2021 Wang, Chen, Du, Wu, Fu and Yu. This is an open-access article distributed under the terms of the Creative Commons Attribution License (CC BY). The use, distribution or reproduction in other forums is permitted, provided the original author(s) and the copyright owner(s) are credited and that the original publication in this journal is cited, in accordance with accepted academic practice. No use, distribution or reproduction is permitted which does not comply with these terms.
*Correspondence: Xuebiao Yu, yuxuebiao@163.com
†These authors have contributed equally to this work