Detection Rate of Bird Species and What It Depends on: Tips for Field Surveys
 Federico Morelli1,2*
  Vojtěch Brlík3
  Yanina Benedetti1
  Raphaël Bussière4 Lucie Moudrá1
  Jiri Reif5
  Marek Svitok6,7
- 1Faculty of Environmental Sciences, Czech University of Life Sciences Prague, Prague, Czechia
- 2Institute of Biological Sciences, University of Zielona Góra, Zielona Góra, Poland
- 3Department of Ecology, Faculty of Science, Charles University in Prague, Prague, Czechia
- 4Independent Researcher, Liniers, France
- 5Faculty of Science, Institute for Environmental Studies, Charles University in Prague, Prague, Czechia
- 6Department of Biology and General Ecology, Faculty of Ecology and Environmental Sciences, Technical University in Zvolen, Zvolen, Slovakia
- 7Department of Ecosystem Biology, Faculty of Science, University of South Bohemia, České Budějovice, Czechia
Bird counting inevitably suffers from imperfect detection, which varies across species, habitats, period of the day, and seasons. Although various modeling techniques have recently been developed to account for this phenomenon, the biological basis of natural variation in detection remains insufficiently known. This study examined the bird species’ detection rate throughout the day, considering their body mass and diet type, concerning the environment and weather characteristics. Species detection rates were significantly affected by the number of individuals of that species but were unrelated to body mass. Overall, species with the highest detection rate were Corn bunting, Blackbird, European robin, House sparrow and Common chiffchaff. Granivores-insectivores and insectivores showed significant differences in detection rates throughout the day among habitats, with higher detection rates in grasslands during the afternoon. Insectivores showed higher detection rates in farmland during midday (warmest time of the day). Granivores, omnivores and scavengers did not show changes in detection rates in different day periods. Such patterns in daily detection rates were significant even when considering abundance and total species richness in each community. Finally, cloudiness was unrelated to the overall detection rate of birds, while temperature and wind affected detection rates in some guilds. Our findings provide some advice for choosing a suitable ornithological sampling method by considering the avian communities composition in combination with the type of environment, the diet of bird species, and the period of the day.
Introduction
Birds are often used in ecological studies as potential bioindicators (Padoa-Schioppa et al., 2006; Drever et al., 2008; Morelli, 2015). Surrogates or bioindicators represent shortcuts in ecology: a cost-effective strategy to study highly complex systems (Rodrigues and Brooks, 2007; Lindenmayer et al., 2015). Some groups of bird species have also been proposed as “surrogates” or “proxy” for identifying hotspots of species richness or other measures of biodiversity during the last decades (Gregory et al., 2005; Padoa-Schioppa et al., 2006; Gregory and van Strien, 2010; Morelli et al., 2014). Also, a single species (e.g., eagle owl, Bubo bubo) was proposed as an indicator of mortality of bird communities concerning human structures such as power pylons (Pérez-Garcia et al., 2016) or overall avian diversity (e.g., common cuckoo) (Morelli et al., 2015).
Information on species occurrences and/or densities is essential to assess wildlife population status and evaluate management decisions in conservation planning (Noon et al., 2012). In particular, point-count surveying is a popular method for collecting data on species distribution and estimation of indices of bird abundance (Bibby et al., 2000; Farnsworth et al., 2002). This method is commonly used for studies at several spatial scales—from local to regional studies and even nationwide monitoring programs (Fuller and Langslow, 1984; Surmacki and Tryjanowski, 2000; Budka and Kokociński, 2015; Kwieciński et al., 2017; Morelli et al., 2017). Points are visited one or more times, mainly in the early morning during the breeding season (Bibby et al., 2000; Gregory et al., 2004; Budka and Kokociński, 2015). Data are typically collected when weather conditions are suitable (e.g., without strong wind or rain), and each visit usually lasts 5–10 min. All visual and aural detections are recorded within either a fixed (often 100 m) or unlimited radius (Bibby et al., 2000). Similar survey strategies are used during the non-breeding seasons. However, several methodological shortcomings are associated with the avian detections when collecting data, which could compromise the integrity of the data. Among these shortcomings, we can briefly mention the bias related to observers’ skills recognizing different bird species, especially when compounded over large spatial scales (Celis-Murillo et al., 2009).
Most importantly, variation in the detectability of each species could strongly affect the correct identification of the number of species in a given assemblage (Bochio and Anjos, 2012). Bird detection probabilities are typically used to assess abundances (Buckland et al., 1993) instead of raw counts of individuals or species occupancy (Norvell et al., 2003). Bias in estimated detection probabilities can lead to bias in abundance estimates, thus affecting the reliability of statistical analyses used to assess habitat selection or within occupancy models (Welsh et al., 2013). The primary bias introduced by detection error is an inability to identify the ecological mechanisms and detection processes in the modeling approach (Welsh et al., 2013). In total, all these elements increase the uncertainties associated with the data collected during avian surveys. Neglecting the importance of variation in species’ detectability can lead to unreliable datasets and thus misleading results that ignore this potential source of variation (Burnham, 1981). Therefore, monitoring programs should correct for species detectability and eventually changes in species detectability (Kéry and Schmid, 2004).
There are several statistical tools for dealing with the fact that detectability is not constant over space and time. For example, occupancy models have been used when evaluating habitat selection or occurrence of bird species at a large spatial scale or to develop predictive models of overall species richness (MacKenzie et al., 2006; De Wan et al., 2009). In such models, it is necessary to perform multiple surveys at each sample unit within a specified period to account for elusive or undetected individuals (MacKenzie et al., 2006). But at the root of the problem, there is the level of detectability of targeted species that could change depending on the habitat characteristics, individual’s activity and period of the day. Bird detectability depends on (i) species biology and behavior (abundance, activity, species body size, and conspicuousness, ecological traits), (ii) individual characteristics within the species (sex, age) (iii) environmental factors (habitat, weather, the phase of the season, time of day) and (iv) methodology of counts and skills of observers (recognition ability, assumptions associated with a given census technique) (Sólymos et al., 2018; Zamora-Marín et al., 2021). There is significant evidence that some traits of birds play an important role in the variability of species detectability (Sólymos et al., 2018). Large bodied birds are expected to have lower singing rates, due to their relatively lower resting metabolic rate (Michael and Brenowitz, 1985; Bennett and Harvey, 1987), but characterized by louder and lower-frequency songs, potentially increasing the overall detectability of singing individuals (Cardoso, 2010; Sólymos et al., 2018). Louder and lower frequency sounds could be detected from more considerable distances, while the higher intensity of singing can be associated with a higher probability of detection or detection rate (Sólymos et al., 2018). The type of diet is another factor that can contribute to detectability. For example, insectivorous species are more likely to forage diurnally depending upon the activity of their prey (Kronfeld-Schor and Dayan, 2003; Silva et al., 2015). On the other hand, scavenger-omnivorous species may be more detectable because of their generally larger body size (Sólymos et al., 2018).
Environmental factors or habitat type also affect bird detection (Wiley, 1991; Mockford and Marshall, 2009), and a change of detection rate within a day may bias assessments depending upon what time of day assessments were made (Brown and Handford, 2002). The effectiveness of morning vs. afternoon surveys can change depending on the species. Only a few studies have tried to explore this potential cause of uncertainty (Bas et al., 2008; Santos et al., 2009), even if the change in detectability through the day is essential to set a cost-effective bird monitoring program (Palmeirim and Rabaça, 1981; Conway and Gibbs, 2011). Furthermore, during the breeding season, the frequency and loudness of the song are likely the main factors affecting the detection rate of territorial birds using point counts (Farnsworth et al., 2002; McCallum, 2005). Some avian taxa can even change the intensity of singing at different stages of the breeding season (Johnson and Dinsmore, 1986; Blumenrath and Dabelsteen, 2004), likely affecting detectability. Adding even more complexity is observing that some taxa change vocalizations depending upon habitat type, making comparisons among studies complex (Schieck, 1997; Mockford and Marshall, 2009). The effects of the habitat type (open, close forests, dense vegetation, etc.) on the sound propagation and transmission were studied in bird songs (Brumm and Naguib, 2009). The relative importance of environmental vs. weather factors is difficult to quantify because it is time-consuming. Methods used to analyze data from community-level surveys (e.g., targeting multiple species) could present several limitations (Dorazio and Connor, 2014).
The goals of this study were to assess the detection rate of bird species (a) within different periods of the day (approximately from sunrise to sunset) and (b) in association to the trophic guild and habitat type (i.e., farmland, forest, natural grassland, or urban). We also examined how weather variables influence detection rates by trophic guilds within each habitat type.
Materials and Methods
Study Areas and Bird Data Collection
Data were collected in the Czech Republic (Moravia and Central Bohemia region, centroid area: latitude 49.87°, longitude 14.93°) and France (department of Vienne, centroid area: latitude 46.67°, longitude 0.48°). Four expert ornithologists with a comparable skill level participated in the data collection. Each observer surveyed four types of habitat based on the dominant landscape: farmland (arable land), forest, natural grassland and urban habitat (Figure 1). To select the sampling sites in each type of habitat, we choose only areas where the specific land-use categories above mentioned were dominant, e.g., covering more than 95% of the area of the sampling site. We avoided sampling sites with mixed composition, where none of the land-use types occupied at least 50% of the area. We used a similar approach to classify dominant land-uses of the spatial units in previous studies (Morelli et al., 2013; Benedetti and Morelli, 2017).
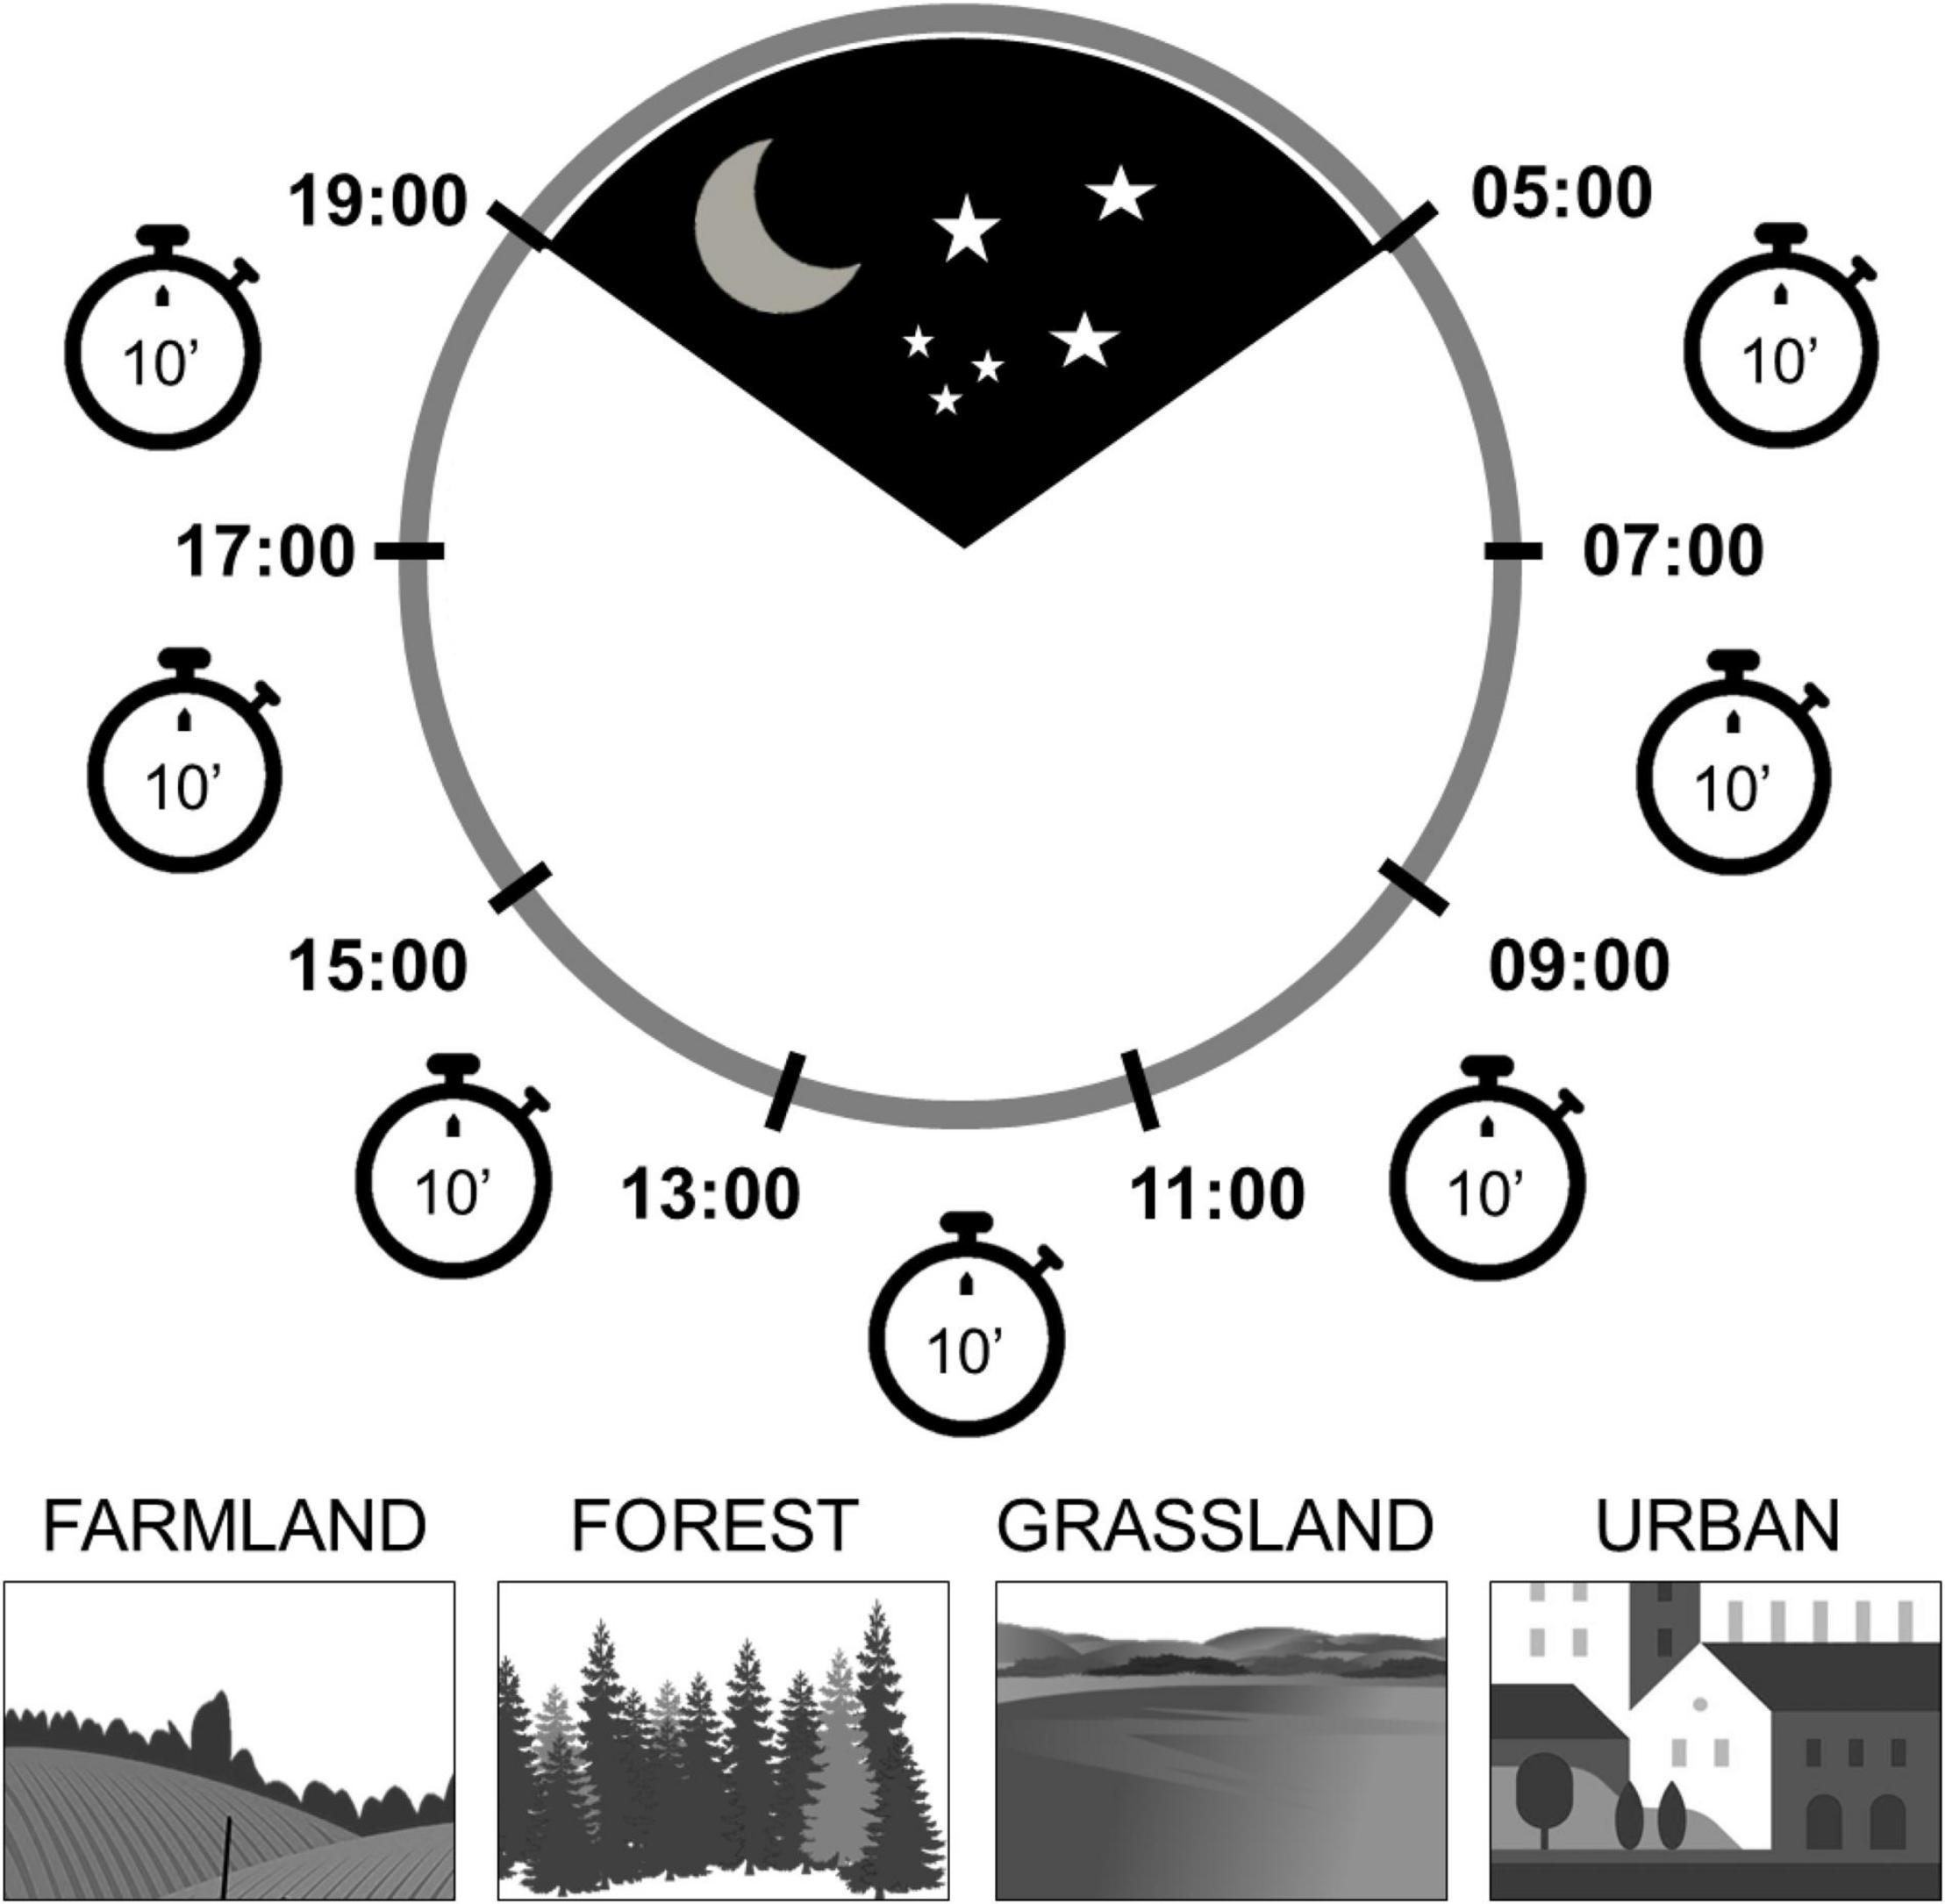
Figure 1. The scheme of the survey program illustrates the coverage of the whole day using 10 min observations (point counts) distributed in each of the seven 2-h periods dividing the day, approximately from sunrise to sunset. The surveys were performed in four types of habitats: farmland, forest, grassland and urban areas.
Twenty three areas were visited (11 in the Czech Republic and 12 in France, country-specific areas included the four habitats above described). A point count was selected within each habitat type (sampling sites) (Bibby et al., 2000) at least 200 m from the habitat edge. Point counts were also separated by at least 300 m to avoid double counts of the same individuals. Bird surveys were performed during the breeding season of 2017, from late April to late May (which correspond roughly to the phase of maximum activity of focused species) using a standardized protocol (Bibby et al., 2000) (description provided in the next paragraph). Since the detection rate could be inconstant across the season, 70% of the observations were collected during the first 2 weeks of the study (last week of April and the first week of May), trying to reduce the potential effects of seasonal changes in species detectability.
The standard protocol followed in the field was: At each sampling point, we performed an exhaustive survey and counted breeding birds over seven visits of 10 min on consecutive 2-h periods from sunrise to sunset (hereafter called “periods of the day”). The first period was between 05:00 and 07:00, and the last period was between 17:00 and 19:00 (Figure 1). Thus, each sampling site was surveyed for a total of 70 min on the same day (seven visits). The total effort was 23 point-counts × 7 visits = 161. All bird individuals detected visually or aurally within a 100 m radius around the point were counted during a 10 min period.
We used the 100 m cut-off distance often used for point counts (Bibby et al., 2000; Mattsson et al., 2013; Morelli et al., 2013) as it allows a more significant number of birds to be included in the counts compared to 50 or 75 m (Thompson and Schwalbach, 1995). All birds seen outside the 100-m radius were excluded. Also, waterfowl, nocturnal and raptor species were excluded because these species are not accurately sampled using point counts (Bibby et al., 2000). Additionally, weather variables were recorded at each sampling site during each one of the seven observation periods. Weather variables included intuitive and straightforward measures of cloud cover [as a proportion of the sky covered by clouds: 0/4 (no clouds), 1/4 (few clouds), 2/4 (half covered), 3/4 (almost wholly covered), or 4/4 (wholly covered)], temperature (measured in°C) and finally wind intensity (“null” = 0, comparable to 0 in the Beaufort wind scale; “weak” = 1, comparable to 1–2 in the Beaufort wind scale; or “moderate” = 2, comparable to 3–4 in the Beaufort wind scale).
All bird species recorded were classified into four trophic guilds (based on the dominant diet of species): granivores (species with a diet that consists primarily of seeds and grain), insectivores-granivores (species with a diet that consists of seeds, grain and insects), insectivores (species with a diet that consists primarily of insects) and omnivorous-scavengers. We determined the diet and body mass of each species using Cramp and Perrins (1994); Pearman et al. (2014), and Storchová and Hořák (2018) (Supplementary Table 1).
Detection Rates
We calculated detection rates at the level of species and trophic guilds, respectively, in all 23 sampling sites. After the complete survey on a given sampling site (seven visits = 70 min of observation), the presence of a species was only attributed when the species was observed at least once. Thus, for a species classified as “present,” the site-specific detection rate is computed as the number of times that species was detected during the seven visits. For example, if a species is observed five times during seven visits, its detection rate is = 5/7 = 0.714. When a species is detected, the minimum site-specific detection rate is 1/7 = 0.143, while the maximum is 7/7 = 1 for the species seen during all visits. Finally, if no individuals of a given species were detected during the complete survey, such species are unaccounted (are considered absent) at the site. In that case, as in the case of occupancy models, we assume that a species is not falsely detected when absent (MacKenzie et al., 2006). The mean detection rate for a species was estimated as the mean value of the site-specific detection rates across all sites. The mean species detection rates were used as a response variable in species-level regression analysis (see below).
We also quantified trophic guild-level detection rates in each visit. First, we calculated the total number of species observed in each sampling site and used this total species richness as an estimate of true species diversity at a given site. The trophic guild-level detection rate was calculated as the proportion of species belonging to a given trophic guild observed during a visit divided by the total number of species of such trophic guild recorded after all visits at the given site. The guild-level rates varied from 0 (if none of the present species is detected) to 1 (if all present species are detected) during a given visit. This approach implicitly assumes a perfect detection of the total species richness. To verify this assumption, we constructed analytical rarefaction curves with unconditional 95% confidence intervals (Colwell et al., 2004) and assessed species inventory completeness. Moreover, the non-parametric richness estimator Chao2 (Chao, 1987) was used to estimate the total number of species, including those unobserved. Since detection rates of the species were relatively homogeneous (mean CV = 0.57), we used the bias-corrected form of the estimator (Chao, 2005).
Statistical Analysis
The dataset consisted of 161 observations (23 sites by seven visits) with a relatively balanced number of sites per habitat type (farmland—6, forest—5, grassland—5, urban—7). We ran two different models:
First, we used regression analysis to assess the effects of species relative abundance (sum of individuals counted per species) and body mass on detection rates of species (response variable) (n = 79)—species-level model. Since the species detection rates are restricted to the interval (1/7–7/7), we used a beta regression approach (Ferrari and Cribari-Neto, 2004). The beta regression model assumes that the response follows a beta probability distribution defined by mean and precision (inverse dispersion) parameters (Cribari-Neto and Zeileis, 2010). The beta distribution is commonly used to model variables that assume values in the standard unit interval, such as proportions. Considering that the detectability of species may be the result of two processes: (1) abundance of individuals and (2) probability that an individual is detected, we modeled the response variable (species detection rate) as a function of covariates via a logit link function. The covariates themselves, abundance and body mass, were log-transformed, to improve the symmetry of their distribution. The precision parameter was assumed a constant, corresponding to the basic beta regression model introduced in Ferrari and Cribari-Neto (2004). The model parameters were estimated by maximum likelihood, and goodness-of-fit was assessed using several diagnostic plots. Since Corn bunting Emberiza calandra emerged as an outlier (large Cook’s distance and large residual), we excluded the species and refitted the model leading to considerably better performance (Supplementary Figures 1, 2). The significance of model coefficients was evaluated using partial Wald tests (Cribari-Neto and Zeileis, 2010). Estimated detection rates were plotted along with their 95% confidence intervals that were calculated using 1,000 standard bootstrap replicates and the non-parametric percentile method (Efron and Tibshirani, 1993).
Second, we used beta distribution models with logit-link function to explore changes in trophic guild detection rates regarding different habitat types, weather variables and period of the day—guild-level models. Since the activity and singing of birds show non-linear circadian patterns (Robbins, 1981b; McNamara et al., 1987), we expected detectability to vary in a non-linear way during a day. Therefore, we employed generalized additive mixed models (GAMMs), a flexible modeling framework capable of fitting both linear and non-linear responses (Wood, 2017). Individual GAMMs were fitted to each of the four trophic guilds. The trophic guild detection rates (see above) were used as response variables. The fixed part of the models contained the main term of habitat type and interaction of habitat type with thin plate regression spline smoother for the period of the day to allow for different temporal trends among the habitats. Observer identity was included in the models to account for a potential observer-related bias (e.g., observer differences in hearing or observational skills). Although we consider this observer-related influence a random effect, the observer effect was treated as a fixed term in the models due to a low number of the factor levels (n = 4) which may lead to imprecise among-population variance estimates (Harrison et al., 2018). Considering the response of bird activity to weather conditions (O’Connor and Hicks, 1980; Robbins, 1981a; Bonter et al., 2013), we also included linear parameters of wind and clouds and a smoother for the temperature to account for variation in detectability related to these effects. The random effect structure of the models involved varying intercepts among sites to control for repeated sampling. To avoid overfitting, GAMM parameters were estimated by penalized likelihood maximization, in which wiggly models are penalized more heavily than smooth models (Wood, 2017). We also set the upper limit on the degrees of freedom associated with the smooth terms and restricted the basis dimension used for smoothing to k = 5 to prevent non-realistically complex response patterns. The performance of the GAMMs was assessed using diagnostic plots; no severe violation of the assumptions was recorded. The significance of model terms was assessed using Wald tests, conditional on the smoothing parameter estimates (Wood, 2013). To evaluate the significance of habitat by the period of the day interaction, we fitted simpler GAMMs without habitat-specific temporal trends and compared them with the GAMMs involving habitat-specific smoothers using a χ2-test on the differences in maximum-likelihood scores, taking into account the difference in degrees of freedom (van Rij et al., 2017).
The analyses were performed in Spade (Chao and Shen, 2010) and R (R Development Core Team, 2019) using the libraries “betareg” (Cribari-Neto and Zeileis, 2010), “ggplot2” (Wickham, 2016), “itsadug” (van Rij et al., 2017), and “mgcv” (Wood, 2017).
Results
Overall, we detected 79 species belonging to four trophic guilds: 8 granivorous, 29 granivorous-insectivorous, 37 insectivorous and 5 omnivorous/scavengers (Supplementary Table 1).
The species inventory appeared nearly complete as the rarefaction curves reached asymptotes, and their confidence intervals covered or closely approximated the expected total richness calculated by the Chao2 estimator at most of the sites (Supplementary Figure 3). It should be noted, however, that our survey scheme had weaker species coverage in few forest and grassland sites.
The species-level detection rates (Supplementary Table 1) were significantly affected by the number of individuals (abundance: p < 0.001), and this effect was independent of the bird’s body mass as indicated by the insignificant interaction term (abundance × body mass: p = 0.386). There was no evidence that detection rates were related to body mass (p = 0.133). Detection rates increased with the number of individuals (Figure 2). When considering all habitat types combined, the species with the highest detection rates were Corn bunting Emberiza calandra, Blackbird Turdus merula, European robin Erithacus rubecula, House sparrow Passer domesticus and Common chiffchaff Phylloscopus collybita (Supplementary Table 1).
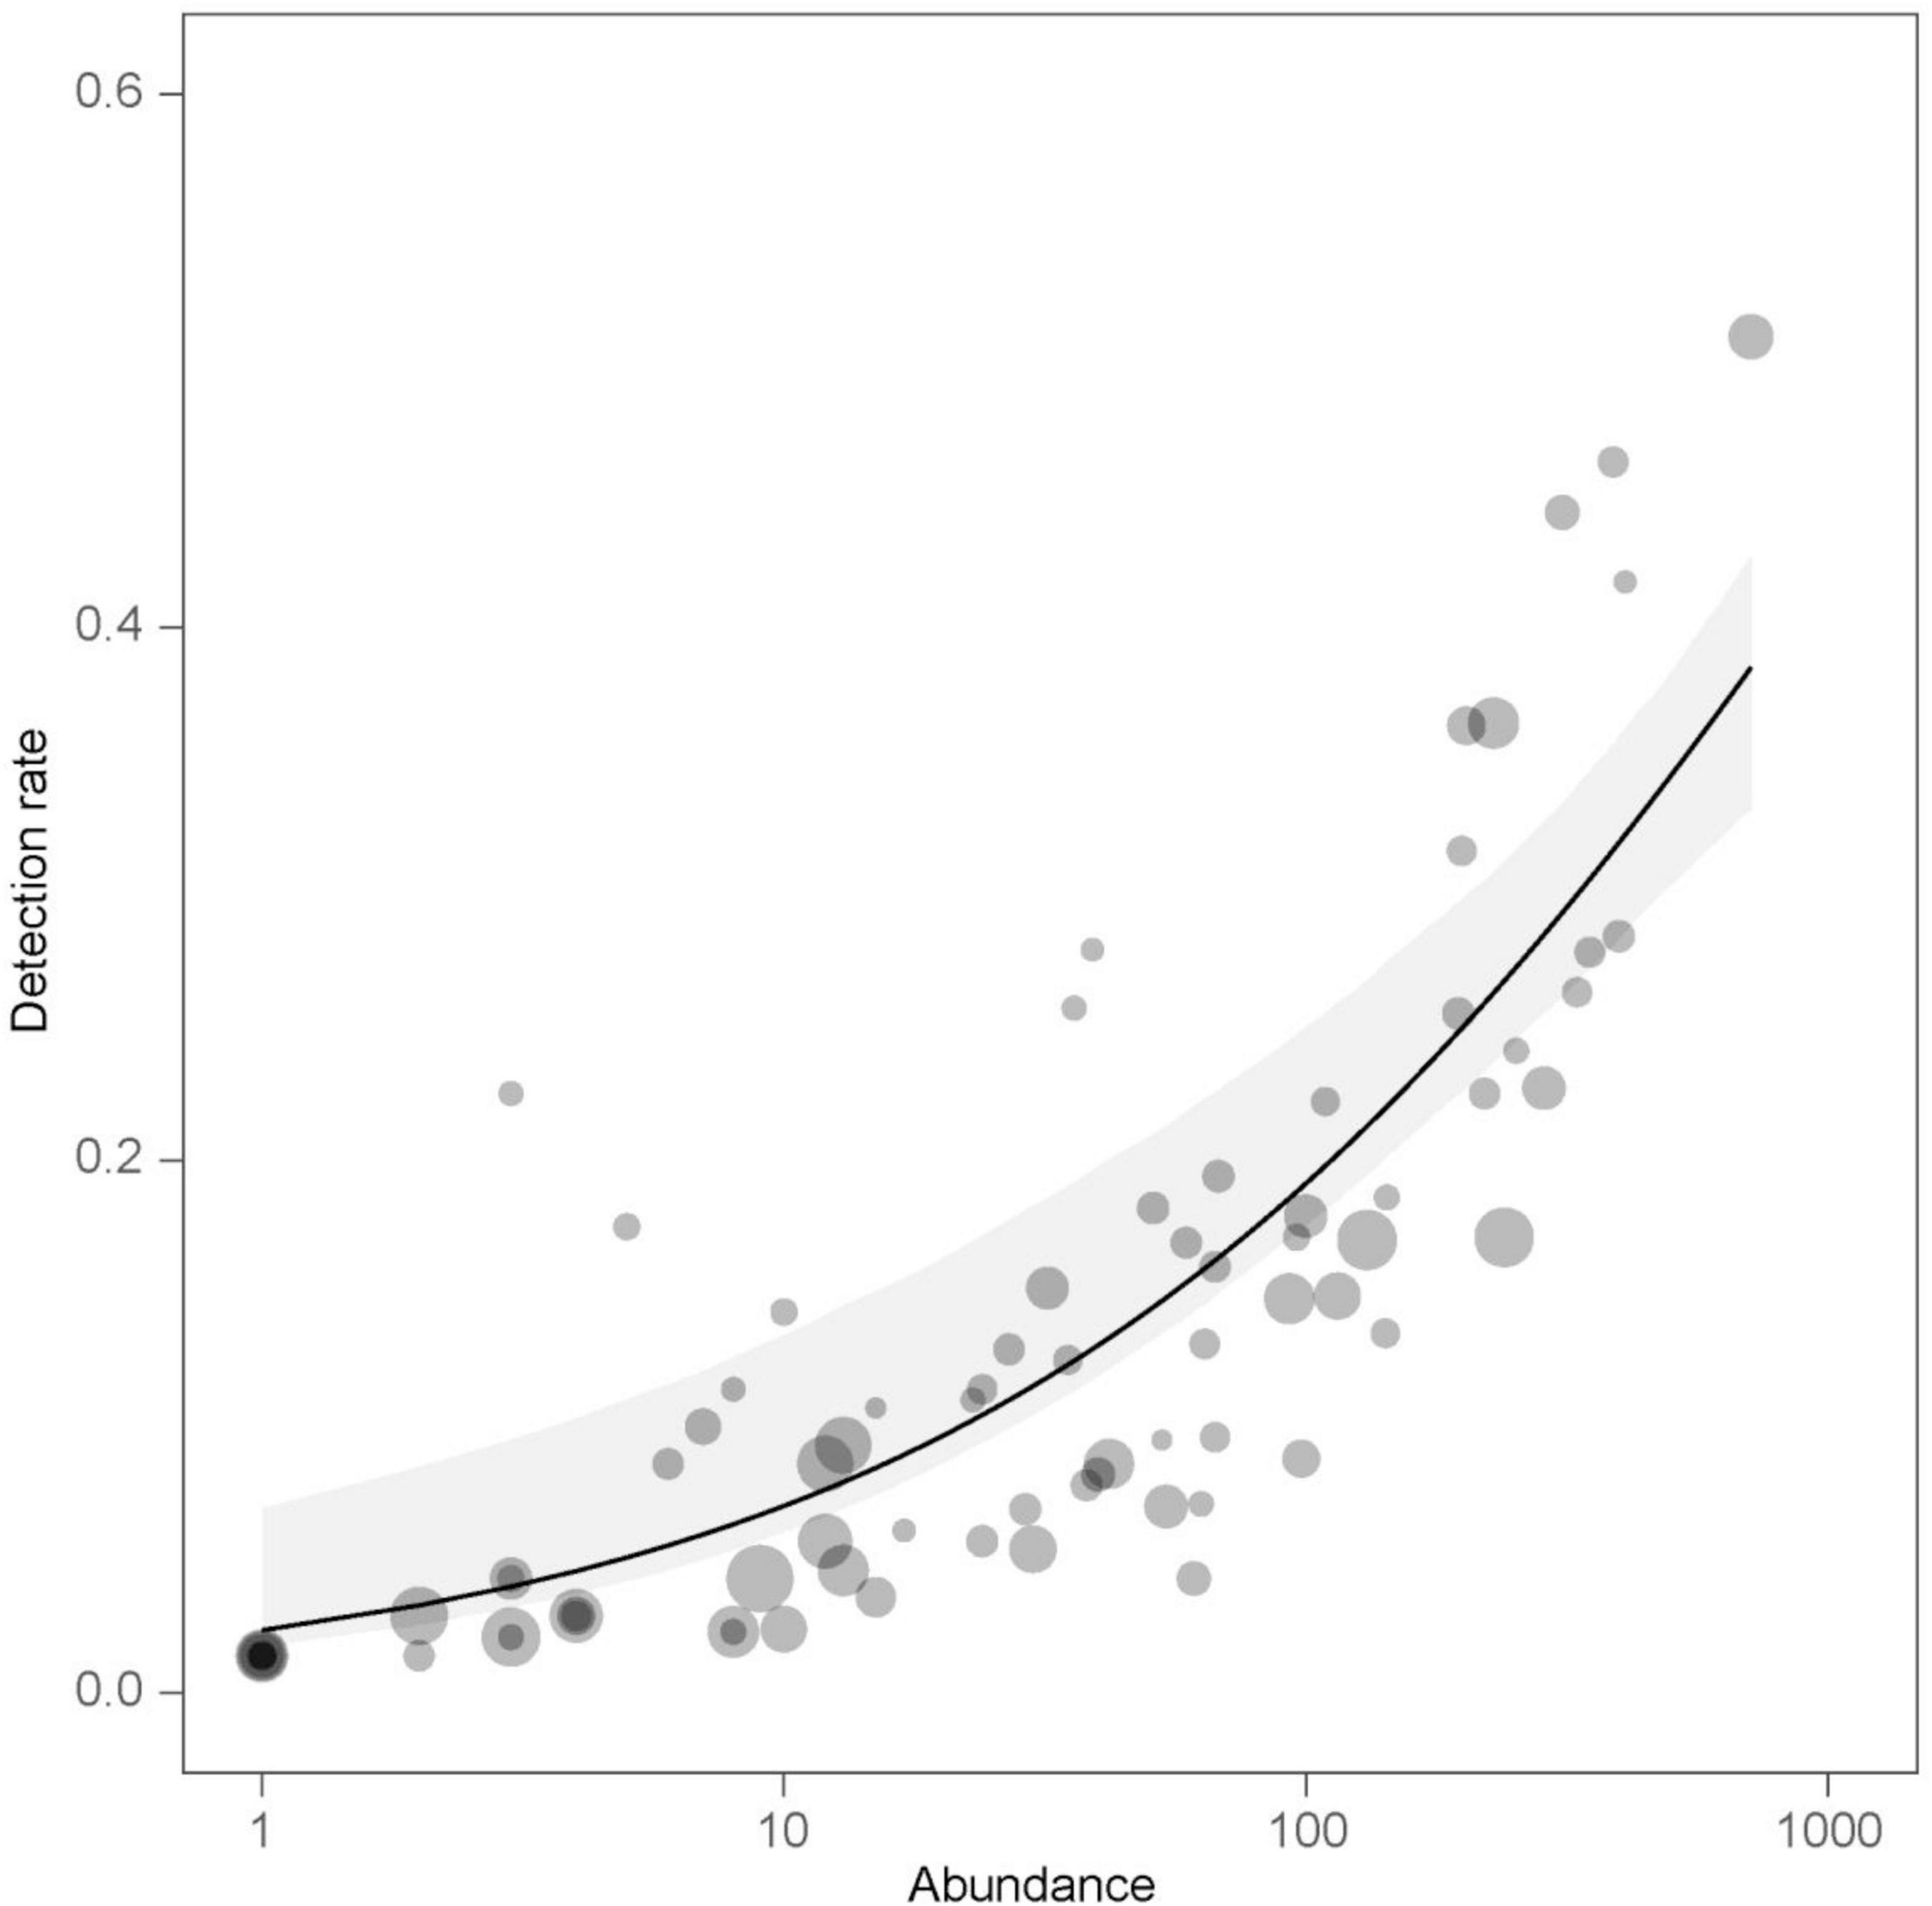
Figure 2. The effect of species abundance on detection rates of bird species as predicted by the beta regression model. Observed values (dots) are displayed along with estimated detection rates (line) and 95% percentile bootstrap confidence interval of the estimate (gray band). Dot size is proportional to the body mass of a given species.
Considering the detection rate of different trophic levels, granivores-insectivores and insectivores showed significant differences in temporal trends (periods of the day) among habitats (Tables 1, 2). Both groups had a constant detection rate in forests throughout the day, while they had a higher probability of observation during afternoon hours (3 p.m. and later) in grasslands (Figure 3). Insectivores also showed higher detection rates in the afternoon in farmland (with a peak during the midday). In contrast, granivorous-insectivorous birds had opposite detection patterns in farmlands (the highest detection rate in the morning) and always had high detectability in the urban landscape. We did not find any temporal trend in detection rates of granivores and omnivores/scavengers. This result was also confirmed when modeling species with the same abundance.
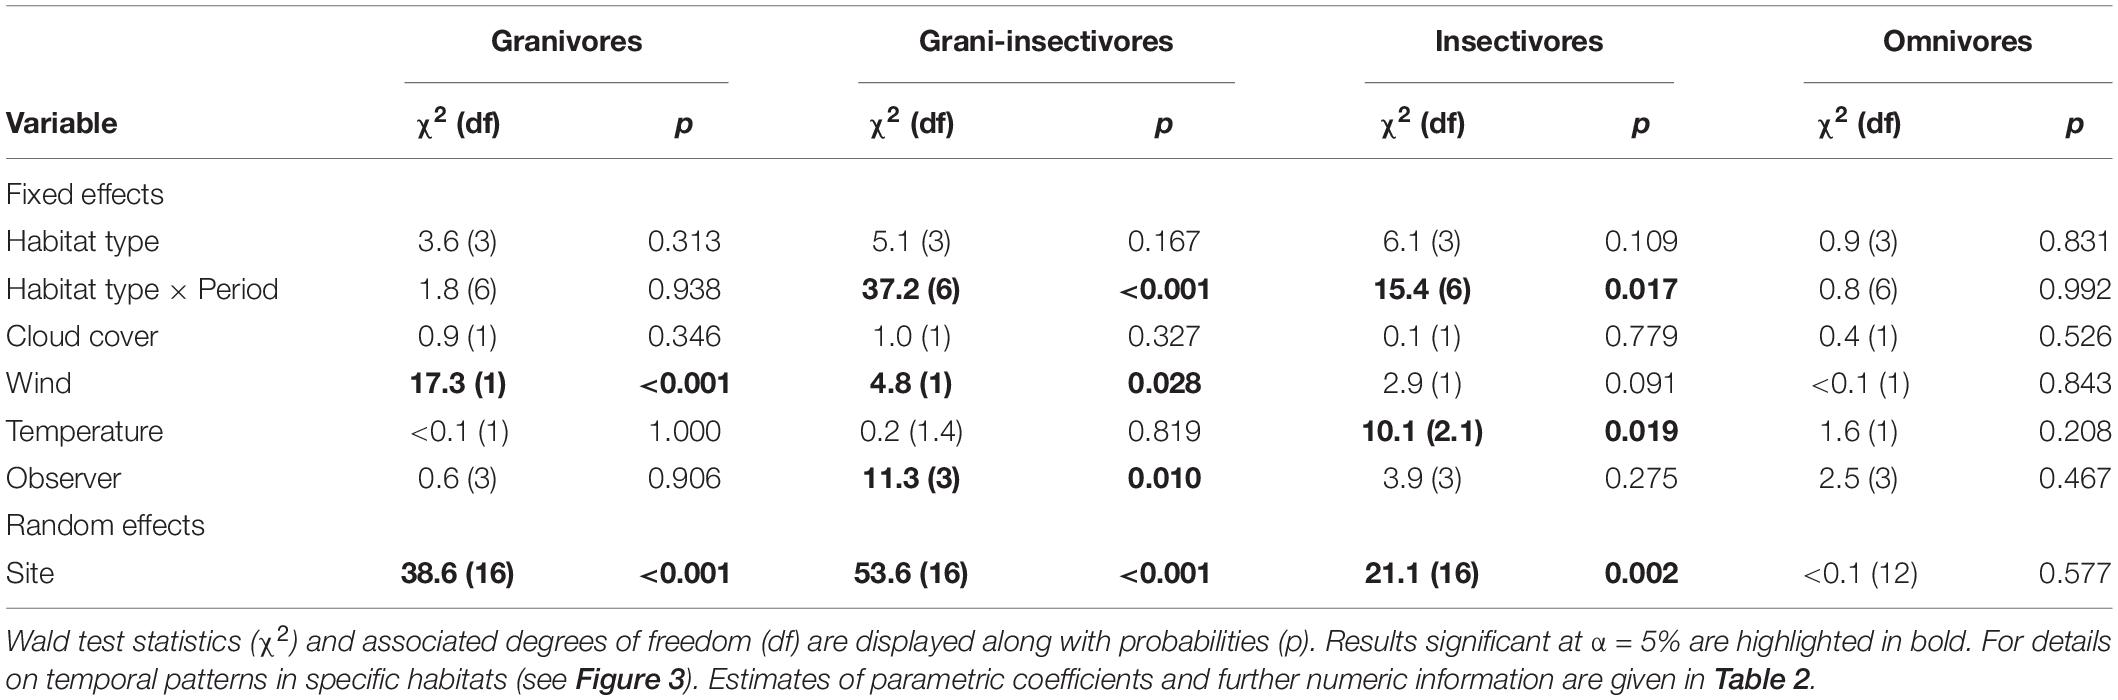
Table 1. Summary characteristics of the GAMMs testing for the interacting effects of habitat type and period of the day on detection rates in four bird trophic guilds while accounting for weather conditions, repeated sampling of the same sites and observer-related bias.
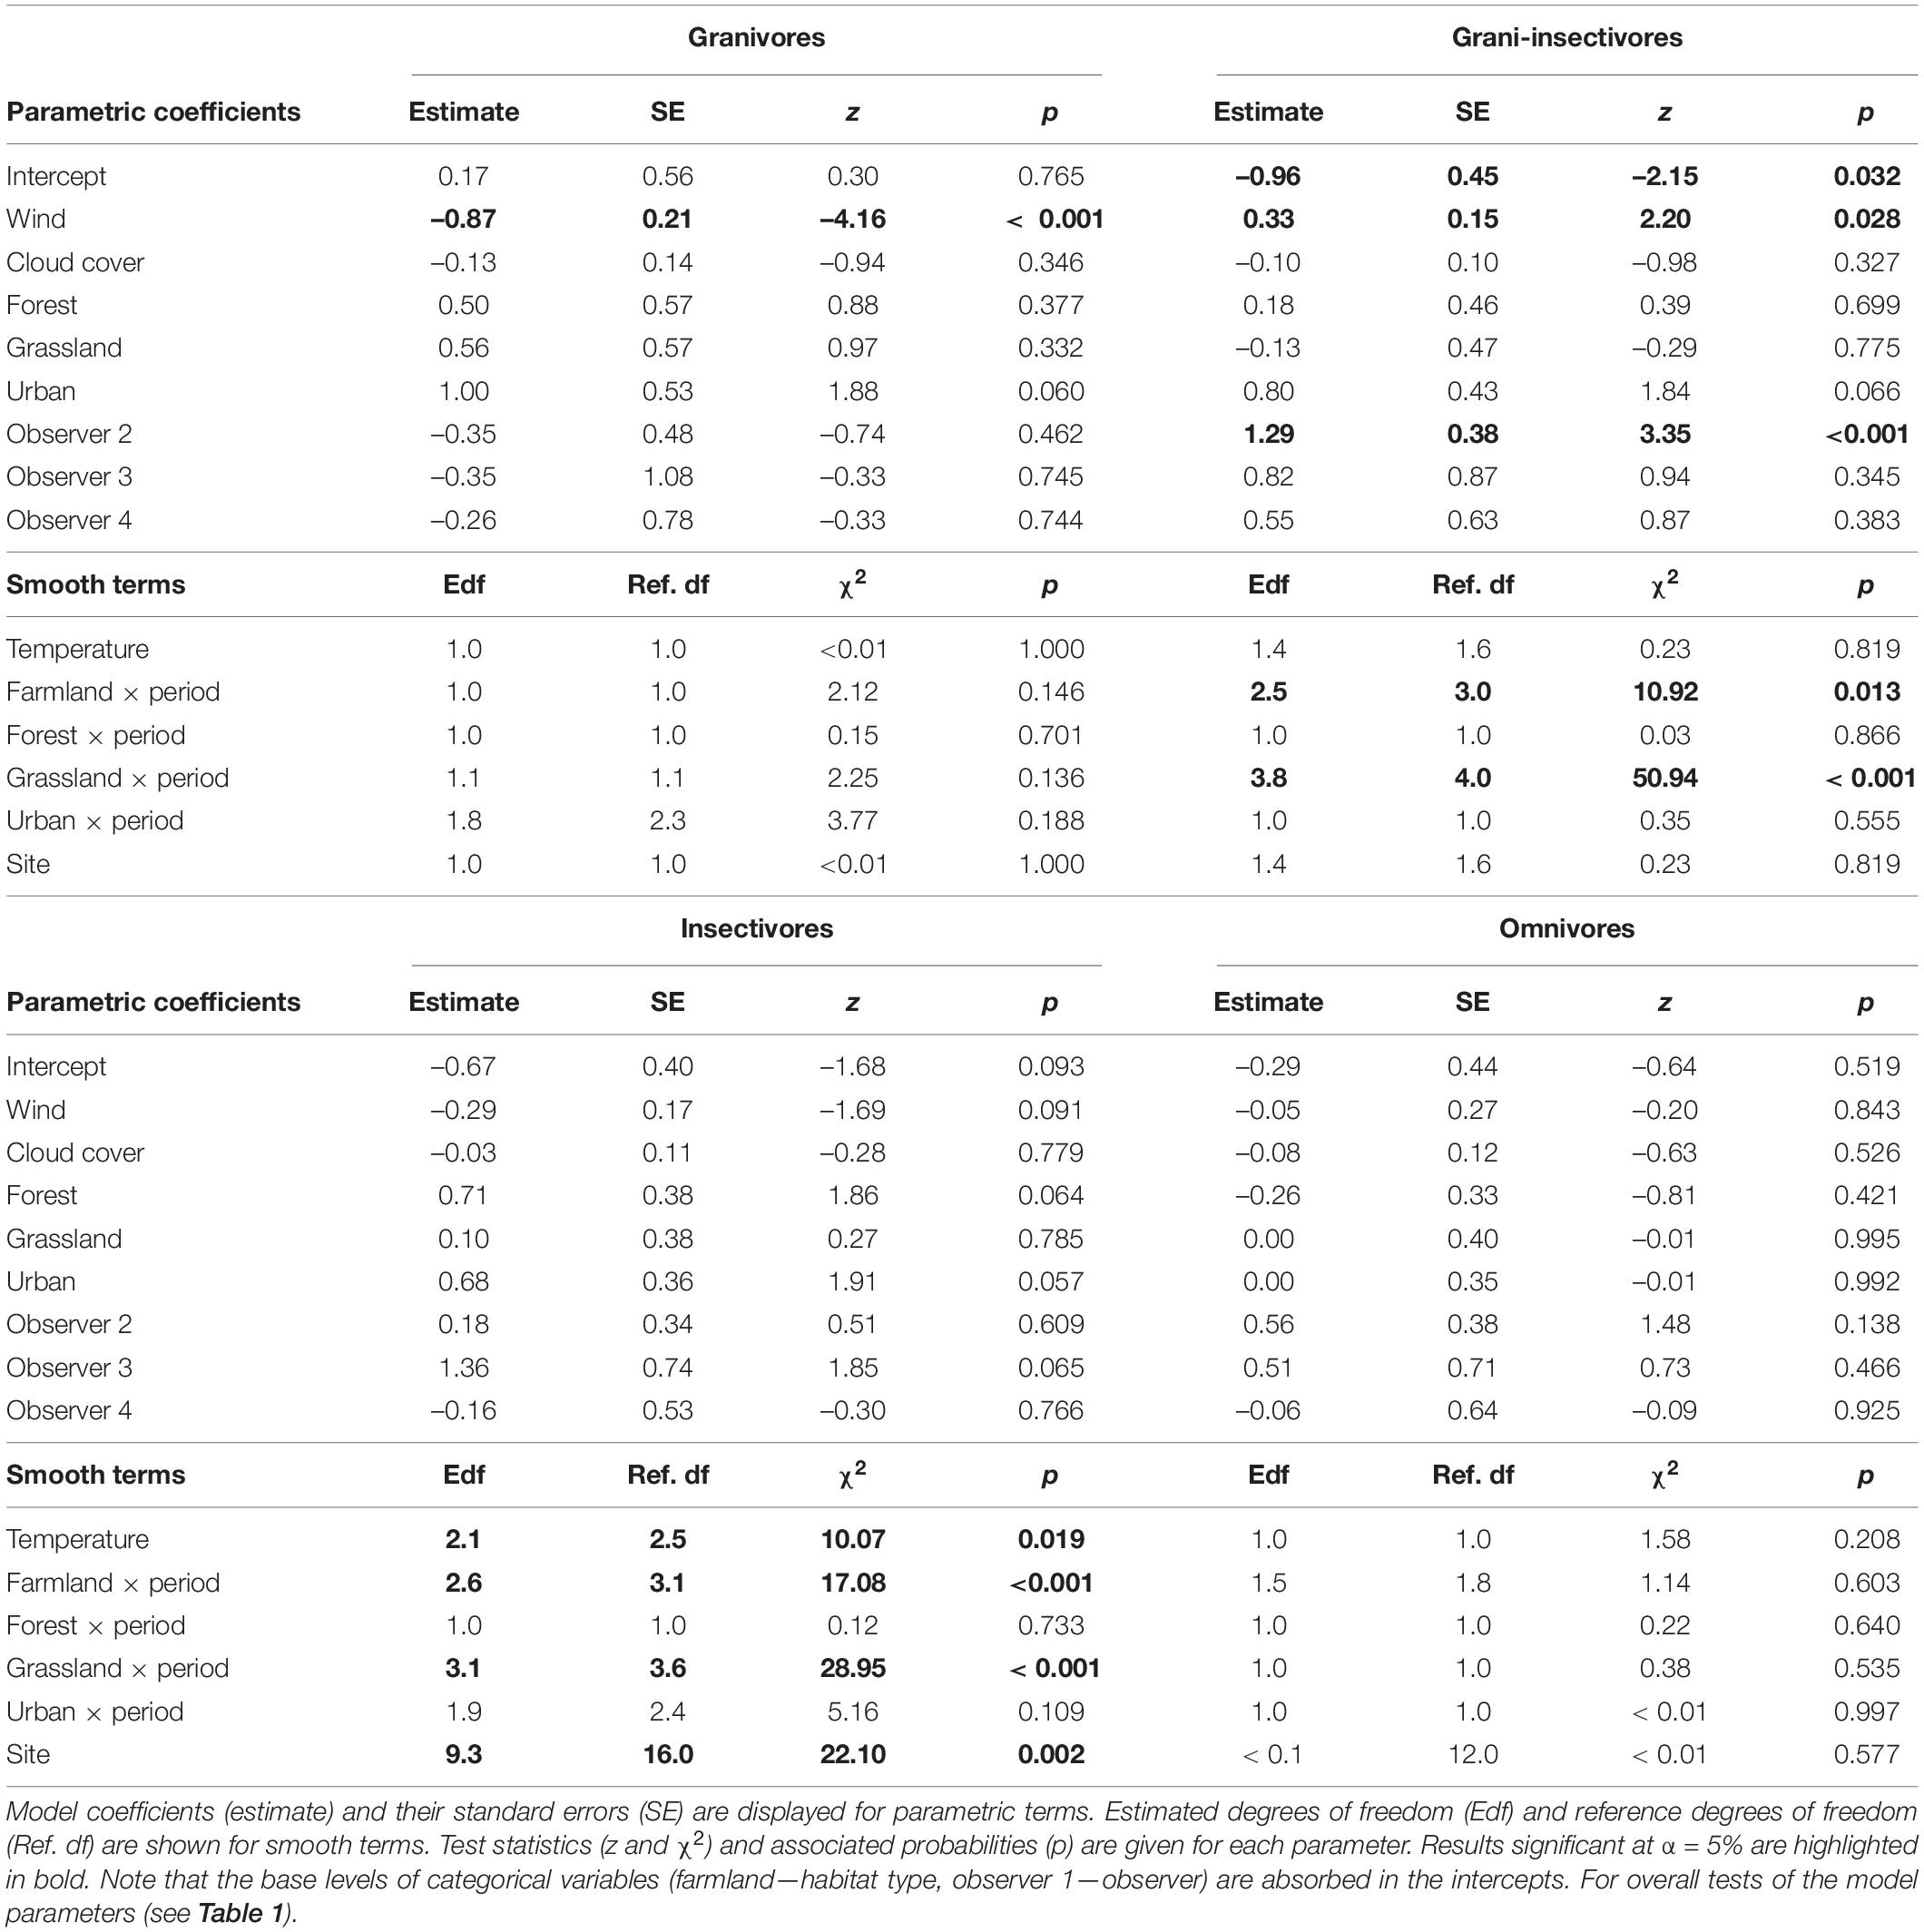
Table 2. Coefficients and associated characteristics of GAMMs fitting detection rates of four bird trophic guilds (granivores, grani-insectivores, insectivores, and omnivores).
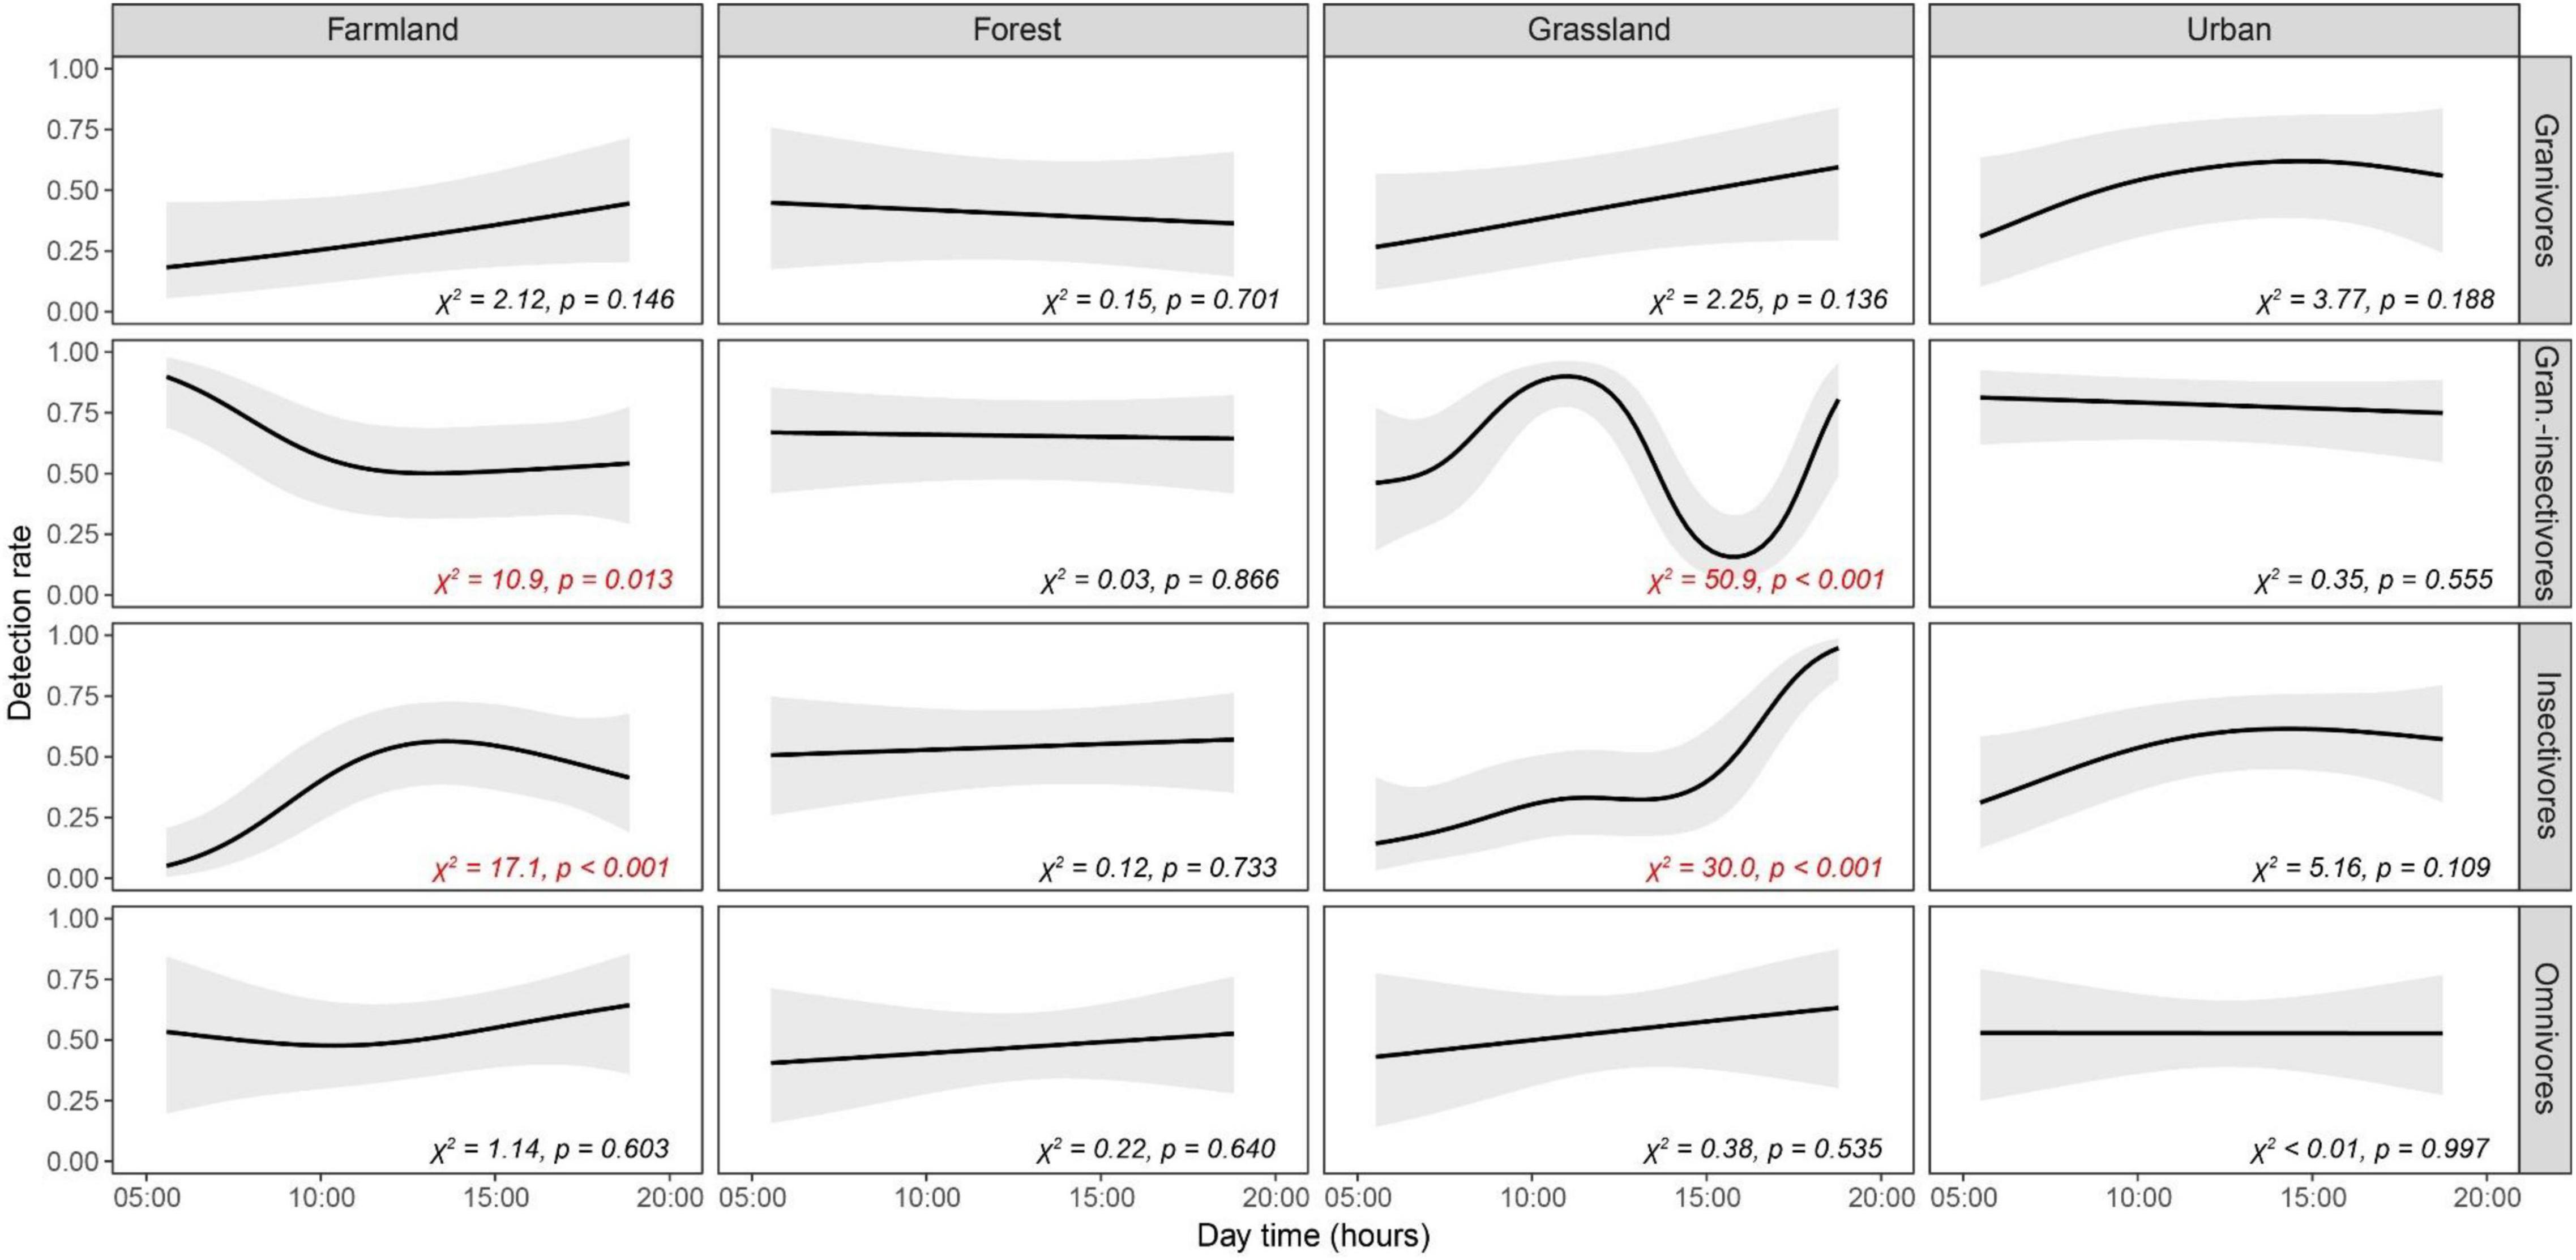
Figure 3. Temporal patterns of detection rates of birds of four trophic guilds (granivores, granivores-insectivores, insectivores and omnivores) in four habitats (farmlands, forests, grasslands and urban areas) as modeled by GAMMs. Predicted detection rates (lines) are displayed along with 95% confidence bands (gray envelopes), keeping other variables constant at their mean values. Wald tests statistics (χ2) and associated probabilities (p) are given for each relationship. Results significant at α = 5% are highlighted in red.
Among the weather characteristics, wind and temperature significantly affected the detection rates of some studied guilds, while cloud cover seemed unimportant (Tables 1, 2). Wind negatively affected the detection rates of granivores and insectivores (marginally non-significant); omnivores were unaffected and granivores-insectivores showed a positive response. Interestingly, higher temperatures were associated with lower detectability of insectivorous species (Supplementary Figure 4).
Finally, there was a good deal of variation among sites, while the observer-related effect was negligible for all but granivorous-insectivorous species (Tables 1, 2).
Discussion
The accuracy of the information about species distribution is essential to establish correct biodiversity programs and conservation planning (Zamora-Marín et al., 2021). The detection rate of species could be ignored when detection is consistent across time or space (Buckland et al., 2010). However, our findings suggest that the detection rates of species differ among trophic guilds (when controlling for abundances), habitat type, and time of day. Overall, we found that the bird detection rate correlated positively with species abundance when considering trophic guilds or analyzing species separately. This finding was expected since it is a general pattern already demonstrated (Welsh et al., 2013). We also estimated the overall detection rate for every 79 species (see Supplementary Table 1). However, we prefer to be cautious about the individual detection rate interpretation because the number of detections for each species collected in this study varied hugely, precluding a reliable comparison. Additionally, a phylogenetic approach would likely be more appropriate to compare bird detection rates (Rubolini et al., 2015).
Effects of Habitat Type, Weather, Diet and Period of the Day on the Bird Detection Rate
Our results suggest that habitat types present different challenges for observers. The detection accumulation curves showed that some habitats exhibit high inter-site differences (e.g., farmlands) compared with other types (e.g., forests or urban) (see Figure 3). Assuming that all observers involved in the fieldwork have relatively comparable abilities, we can hypothesize that these differences could be associated with more significant ecological variation among farmlands surveyed in terms of habitat heterogeneity. On the other hand, forest and urban areas did not exhibit much variation among landscapes, suggesting minor ecological variation among sites. One implication for survey strategies is that one might need to have a broader survey scheme in farmland than in forest areas, considering potential differences in bird detection related to the local farmland characteristics.
We found that wind was related to the detection rate of granivorous and granivorous-insectivorous species. On the other hand, the temperature affected the detection rate of insectivorous species in all habitat types, while the cloudiness was unrelated to the bird detection rate in our study. The positive association between the detection rate of insectivorous birds and temperature could be correlated to a greater activity of insects during the warm part of the day (Silva et al., 2015), followed by higher activity of insectivorous birds involved in feeding activities.
We examined the detection rate of birds grouped by the trophic guild in different types of environments. Interestingly, our study only partially supports the common assumption that birds are much easier to detect in the morning. We found that the morning is the best time for observers to detect granivorous-insectivorous species in farmlands and grasslands. At the same time, morning is less critical for birds from other types of habitats. Granivorous-insectivorous and insectivorous birds were the only groups showing a substantial and statistically significant temporal pattern during the day in different kinds of environments (see Figure 3). These changes in detectability could be associated with the fact that such species are following the temporal dynamics of their prey, probably corresponding to the increased activity of insects during warmer periods of the day (Williams, 1961; Silva et al., 2015). Notably, the comparison of detection rates through the day periods for each trophic guild is independent of the number of species belonging to each guild (no abundance-dependant) since we are comparing rates ranging from 0 to 1 for each group.
Finally, when combining the effects of habitat type, trophic guild and period of the day emerged some considerations useful for field working planning (see Figure 3 and Tables 1, 2). For farmlands, the most appropriate period of the day for surveys seems to be the morning, between 05:00 and 11:00, to collect data on granivorous-insectivorous species, which tend to be more active early in the morning (between sunrise and 06:00). For insectivorous birds, on the contrary, the detection rate increases during the late morning and early afternoon, with a peak at noon. In forests, the bird detection rate was relatively homogeneous across the day, without significant differences among trophic guilds. This homogeneity suggests that monitoring strategies don’t necessarily need to pay special attention to the time of the day for field data collection in forests. In this regard, our results provide evidence that the detection rate of species in the forests, being a rather closed environment compared to farmlands or grasslands, are less affected by weather variables (e.g., sun, temperature, etc.) In natural grasslands, the best time for monitoring granivorous-insectivorous bird species in our study was in the late morning, while the detection rate of insectivorous species increases during the day, being higher in the afternoon. In urban areas, the detection rate was not significantly associated with the period of the day. This information is essential in more dense settlements, where surveys could be adapted to different day hours to avoid noise pollution peaks. Some studies have demonstrated that moderated anthropogenic noise has a negligible effect on species detection (Koper et al., 2016).
Potential Methodological Drawbacks of This Study and Expected Implications on Survey Strategies
A limitation of this study could be related to the quality of the data describing the trophic guilds of species, in some cases derived from heterogeneous sources. Additionally, some concern could be associated with the fact that the species belonging to each trophic guilds are different in terms of ecological characteristics (e.g., “omnivores” are composed by single groups as corvids, that might partially share several behavioral characteristics, while other groups are composed of more heterogeneous species). However, we tried to reduce this potential bias by introducing the relative effects of species’ characteristics as body mass on the detection rate in the modeling procedures.
During the modeling procedure, we excluded the Corn bunting Emberiza calandra because identified as an outlier. The Corn bunting is known as an easy-detectable farmland bird because of the loud song and the typical singing at the top of the shrubs along the roads. In our dataset, however, the Corn bunting was recorded only in two sampling sites. The removal of the species does not alter the results of the models but improves a little bit overall performance.
In this study, we tried to alleviate also the potential problem of observer bias by using a double strategy: (a) to use only highly skilled ornithologists on the data collection and (b) to introduce the identity of observers as a fixed factor in the modeling procedure. In conclusion, our study aimed not to deliver a correction tool for modeling species’ occurrence data but primarily to provide valuable guidelines for sampling methods, depending on the type of habitat and ecological characteristics of the targeted communities. Our findings represent a piece of information that could be useful for designing more flexible monitoring schemes for bird species, interpretation of existing data, and better understanding when assessing the community composition in different types of landscapes. Of course, all this information needs to be correctly tested before being transferred to other case studies in another country or habitat, where the trophic guilds could be composed of different species. In this sense, because the season also plays an essential role in the detection rate of species (Harms and Dinsmore, 2014), we believe that our results must be complemented by further studies considering the source of variation of detection rate concerning different phases of the breeding season.
Our results provide some inputs which can be valuable when using different survey strategies, for example, the distance sampling methods, frequently used to estimate the abundance of birds (Buckland et al., 1993; Koper et al., 2016). Distance sampling was mainly developed to deal with variability in detection probabilities of species based on the effect of distance or visibility and is based on a fall-off in detections with distance (Buckland et al., 1993). However, an essential assumption of distance sampling methods is that distances to individuals are accurately estimated, a task not easy to accomplish under normal field conditions (Norvell et al., 2003). Furthermore, a correct assessment about the heterogeneity of the detection rate of species could enhance studies dealing with estimations of the size of a given population or studies applying distance sampling methods (Richardson, 2007) to evaluate survey completeness (Welsh, 2002). From our results, we can make some recommendations about when and how to conduct the surveys in order to get the best chances of detecting all the species. Such suggestions, however, are not a suitable method for estimating bird abundances.
In summary, implementing methods that incorporate or at least consider differences in species’ detection rates would enhance the reliability of such surveys. We expect that our findings could provide valuable information for choosing a suitable ornithological sampling method regarding the avian communities, different types of environment, and an adequate day period.
Data Availability Statement
The original contributions presented in the study are included in the article/Supplementary Material, further inquiries can be directed to the corresponding author/s.
Author Contributions
FM and YB conceived the idea and designed the methodology. FM, VB, YB, RB, and LM collected the data in the field and prepared the dataset. FM and MS prepared the data and performed data analyses. All authors contributed critically to the drafts and gave final approval for publication.
Funding
FM, YB, and JR were financially supported by the Czech Science Foundation GAČR (project no. 18-16738S) during the data analyses and writing of this manuscript. MS was supported by the Operational Programme Integrated Infrastructure (OPII) funded by the ERDF (ITMS project no.313011T721).
Conflict of Interest
The authors declare that the research was conducted in the absence of any commercial or financial relationships that could be construed as a potential conflict of interest.
Publisher’s Note
All claims expressed in this article are solely those of the authors and do not necessarily represent those of their affiliated organizations, or those of the publisher, the editors and the reviewers. Any product that may be evaluated in this article, or claim that may be made by its manufacturer, is not guaranteed or endorsed by the publisher.
Acknowledgments
We thank Fabio Pruscini for his help during preliminary tests of the survey method and fruitful discussions about the topic. We are also very grateful to the editor and reviewers for the very constructive suggestions for improving the overall quality of the manuscript text.
Supplementary Material
The Supplementary Material for this article can be found online at: https://www.frontiersin.org/articles/10.3389/fevo.2021.671492/full#supplementary-material
References
Bas, Y., Devictor, V., Moussus, J.-P., and Jiguet, F. (2008). Accounting for weather and time-of-day parameters when analysing count data from monitoring programs. Biodivers. Conserv. 17, 3403–3416. doi: 10.1007/s10531-008-9420-6
Benedetti, Y., and Morelli, F. (2017). Spatial mismatch analysis among hotspots of alien plant species, road and railway networks in Germany and Austria. PLoS One 12:e0183691. doi: 10.1371/journal.pone.0183691
Bennett, P. M., and Harvey, P. H. (1987). Active and resting metabolism in birds: allometry, phylogeny and ecology. J. Zool. 213, 327–344. doi: 10.1111/j.1469-7998.1987.tb03708.x
Bibby, C. J., Hill, D. A., Burgess, N. D., and Mustoe, S. (2000). Bird Census Techniques, 2nd Edn. London: Academic Press.
Blumenrath, S. H., and Dabelsteen, T. (2004). Degradation of great tit (Parus major) song before and after foliation: implications for vocal communication in a deciduous forest. Behaviour 141, 935–958. doi: 10.1163/1568539042360152
Bochio, G. M., and Anjos, L. (2012). The importance of considering bird detectability for assessing biological integrity. Nat. Conserv. 10, 72–76. doi: 10.4322/natcon.2012.012
Bonter, D. N., Zuckerberg, B., Sedgwick, C. W., and Hochachka, W. M. (2013). Daily foraging patterns in free-living birds: exploring the predation-starvation trade-off. Proc. R. Soc. B Biol. Sci. 280:20123087. doi: 10.1098/rspb.2012.3087
Brown, T. J., and Handford, P. (2002). Why birds sing at dawn: the role of consistent song transmission. Ibis (Lond. 1859) 145, 120–129. doi: 10.1046/j.1474-919X.2003.00130.x
Brumm, H., and Naguib, M. (2009). “Environmental acoustics and the evolution of bird song,” in Advances in the Study of Behavior, eds M. Naguib, K. Zuberbuumlhler, N. Clayton, and V. Janik (Cambridge, MA: Academic Press), 1–33.
Buckland, S. T., Anderson, D. R., Burnham, K. P., and Laake, J. L. (1993). Distance Sampling: Estimating Abundance of Biological Populations. London: Chapman & Hall. doi: 10.2307/3802478
Buckland, S. T., Studeny, A., Magurran, A. E., and Newson, S. E. (2010). “Biodiversity monitoring: the relevance of detectability,” in Biological Diversity: Frontiers in Measurement and Assessment, eds A. Magurran and B. McGill (Oxford: Oxford University Press), 25–36.
Budka, M., and Kokociński, P. (2015). The efficiency of territory mapping, point-based censusing, and point-counting methods in censusing and monitoring a bird species with long-range acoustic communication – the Corncrake Crex crex. Bird Study 62, 153–160. doi: 10.1080/00063657.2015.1011078
Cardoso, G. C. (2010). Loudness of birdsong is related to the body size, syntax and phonology of passerine species. J. Evol. Biol. 23, 212–219. doi: 10.1111/j.1420-9101.2009.01883.x
Celis-Murillo, A., Deppe, J. L., and Allen, M. F. (2009). Using soundscape recordings to estimate bird species abundance, richness, and composition. J. Field Ornithol. 80, 64–78. doi: 10.1111/j.1557-9263.2009.00206.x
Chao, A. (1987). Estimating the population size for capture-recapture data with unequal catchability. Biometrics 43, 783–791. doi: 10.2307/2531532
Chao, A. (2005). “Species estimation and applications,” in Encyclopedia of Statistical Sciences, Vol. 12, eds S. Kotz, N. Balakrishnan, C. B. Read, and B. Vidakovic (New York, NY: Wiley), 7907–7916.
Chao, A., and Shen, T.-J. (2010). Program SPADE (Species Prediction And Diversity Estimation) - Program and User’s Guide. Available online at: http://chao.stat.nthu.edu.tw (accessed March 19, 2011).
Colwell, R. K., Mao, C. X., and Chang, J. (2004). Interpolating, extrapolating, and comparing incidence-based species accumulation curves. Ecology 85, 2717–2727. doi: 10.1890/03-0557
Conway, C. J., and Gibbs, J. P. (2011). Summary of intrinsic and extrinsic factors affecting detection probability of marsh birds. Wetlands 31, 403–411. doi: 10.1007/s13157-011-0155-x
Cramp, S., and Perrins, C. (1994). The Birds of the Western Palearctic. Oxford: Oxford University Press.
De Wan, A. A., Sullivan, P. J., Lembo, A. J., Smith, C. R., Maerz, J. C., Lassoie, J. P., et al. (2009). Using occupancy models of forest breeding birds to prioritize conservation planning. Biol. Conserv. 142, 982–991. doi: 10.1016/j.biocon.2008.12.032
Dorazio, R. M., and Connor, E. F. (2014). Estimating abundances of interacting species using morphological traits, foraging guilds, and habitat. PLoS One 9:e94323. doi: 10.1371/journal.pone.0094323
Drever, M. C., Aitken, K. E. H., Norris, A. R., and Martin, K. (2008). Woodpeckers as reliable indicators of bird richness, forest health and harvest. Biol. Conserv. 141, 624–634. doi: 10.1016/j.biocon.2007.12.004
Efron, B., and Tibshirani, R. J. (1993). An Introduction to the Bootstrap. London: Chapman and Hall.
Farnsworth, G. L., Pollock, K. H., Nichols, J. D., Simons, T. R., Hines, J. E., and Sauer, J. R. (2002). A removal model for estimating detection probabilities from point-count surveys. Auk 119, 414–425.
Ferrari, S., and Cribari-Neto, F. (2004). Beta regression for modelling rates and proportions. J. Appl. Stat. 31, 799–815.
Fuller, R. J., and Langslow, D. R. (1984). Estimating numbers of birds by point counts: how long should counts last? Bird Study 31, 195–202. doi: 10.1080/00063658409476841
Gregory, R. D., and van Strien, A. (2010). Wild bird indicators: using composite population trends of birds as measures of environmental health. Ornithol. Sci. 22, 3–22. doi: 10.2326/osj.9.3
Gregory, R. D., Gibbons, D. W., and Donald, P. F. (2004). “Bird census and survey techniques,” in Bird Ecology and Conservation: A Handbook of Techniques, eds W. J. Sutherland, I. Newton, and R. E. et Green (Oxford: Oxford University Press), 17–56. doi: 10.1093/acprof:oso/9780198520863.003.0002
Gregory, R. D., van Strien, A., Voříšek, P., Gmelig Meyling, A. W., Noble, D. G., Foppen, R. P. B., et al. (2005). Developing indicators for European birds. Philos. Trans. R. Soc. Lond. B Biol. Sci. 360, 269–288. doi: 10.1098/rstb.2004.1602
Harms, T. M., and Dinsmore, S. J. (2014). Influence of season and time of day on marsh bird detections. Wilson J. Ornithol. 126, 30–38. doi: 10.1676/13-150.1
Harrison, X. A., Donaldson, L., Correa-Cano, M. E., Evans, J., Fisher, D. N., Goodwin, C. E., et al. (2018). A brief introduction to mixed effects modelling and multi-model inference in ecology. PeerJ 6:e4794. doi: 10.7717/peerj.4794
Johnson, R. R., and Dinsmore, J. J. (1986). The use of tape-recorded calls to count Virginia Rails and Soras. Wilson Bull. 98, 303–306.
Kéry, M., and Schmid, H. (2004). Monitoring programs need to take into account imperfect species detectability. Basic Appl. Ecol. 5, 65–73. doi: 10.1078/1439-1791-00194
Koper, N., Leston, L., Baker, T. M., Curry, C., and Rosa, P. (2016). Effects of ambient noise on detectability and localization of avian songs and tones by observers in grasslands. Ecol. Evol. 6, 245–255. doi: 10.1002/ece3.1847
Kronfeld-Schor, N., and Dayan, T. (2003). Partitioning of Time as an Ecological Resource. Annu. Rev. Ecol. Evol. Syst. 34, 153–181. doi: 10.1146/annurev.ecolsys.34.011802.132435
Kwieciński, Z., Morelli, F., Antczak, M., Hromada, M., Szymański, P., Tobolka, M., et al. (2017). Seasonal changes in avian communities living in an extensively used farmland of Western Poland. Eur. J. Ecol. 2, 9–18. doi: 10.1515/eje-2016-0012
Lindenmayer, D. B., Pierson, J., Barton, P. S., Beger, M., Branquinho, C., Calhoun, A., et al. (2015). A new framework for selecting environmental surrogates. Sci. Total Environ. 538, 1029–1038. doi: 10.1016/j.scitotenv.2015.08.056
MacKenzie, D. I, Nichols, J. D., Royle, J. A., Pollock, K. H., Bailey, L. L., and Hines, J. E. (2006). Occupancy Estimation and Modeling: Inferring Patterns and Dynamics of Species Occurrence. San Diego, CA: Academic Press.
Mattsson, B. J., Zipkin, E. F., Gardner, B., Blank, P. J., Sauer, J. R., and Royle, J. A. (2013). Explaining local-scale species distributions: relative contributions of spatial autocorrelation and landscape heterogeneity for an avian assemblage. PLoS One 8:e55097. doi: 10.1371/journal.pone.0055097
McCallum, A. (2005). A Conceptual Guide to Detection Probability for Point Counts and Other Count-Based Survey Methods. Available online at: http://www.fs.fed.us/psw/publications/documents/psw_gtr191/psw_gtr191_0754-0761_mccallum.pdf (accessed March 19, 2011).
McNamara, J. M., Mace, R. H., and Houston, A. I. (1987). Optimal daily routines of singing and foraging in a bird singing to attract a mate. Behav. Ecol. Sociobiol. 20, 399–405. doi: 10.1007/BF00302982
Michael, J. R., and Brenowitz, E. A. (1985). The role of body size, phylogeny, and ambient noise in the evolution of bird song. Am. Nat. 126, 87–100. doi: 10.1086/284398
Mockford, E. J., and Marshall, R. C. (2009). Effects of urban noise on song and response behaviour in great tits. Proc. Biol. Sci. 276, 2979–2985. doi: 10.1098/rspb.2009.0586
Morelli, F. (2015). Indicator species for avian biodiversity hotspots: combination of specialists and generalists is necessary in less natural environments. J. Nat. Conserv. 27, 54–62.
Morelli, F., Jerzak, L., and Tryjanowski, P. (2014). Birds as useful indicators of high nature value (HNV) farmland in Central Italy. Ecol. Indic. 38, 236–242. doi: 10.1016/j.ecolind.2013.11.016
Morelli, F., Jiguet, F., Reif, J., Plexida, S., Valli, A. S., Indykiewicz, P., et al. (2015). Cuckoo and biodiversity: testing the correlation between species occurrence and bird species richness in Europe. Biol. Conserv. 190, 123–132. doi: 10.1016/j.biocon.2015.06.003
Morelli, F., Jiguet, F., Sabatier, R., Dross, C., Princé, K., Tryjanowski, P., et al. (2017). Spatial covariance between ecosystem services and biodiversity pattern at a national scale (France). Ecol. Indic. 82, 574–586. doi: 10.1016/j.ecolind.2017.04.036
Morelli, F., Pruscini, F., Santolini, R., Perna, P., Benedetti, Y., and Sisti, D. (2013). Landscape heterogeneity metrics as indicators of bird diversity: determining the optimal spatial scales in different landscapes. Ecol. Indic. 34, 372–379. doi: 10.1016/j.ecolind.2013.05.021
Noon, B. R., Bailey, L. L., Sisk, T. D., and Mckelvey, K. S. (2012). Efficient species-level monitoring at the landscape scale. Conserv. Biol. 26, 432–441. doi: 10.1111/j.1523-1739.2012.01855.x
Norvell, R. E., Howe, F. P., and Parrish, J. R. (2003). A seven-year comparison of relative-abundance and distance-sampling methods. Auk 120, 1013–1028. doi: 10.1093/auk/120.4.1013
O’Connor, R. J., and Hicks, R. K. (1980). The influence of weather conditions on the detection of birds during common birds census fieldwork. Bird Study 27, 137–151. doi: 10.1080/00063658009476672
Padoa-Schioppa, E., Baietto, M., Massa, R., and Bottoni, L. (2006). Bird communities as bioindicators: the focal species concept in agricultural landscapes. Ecol. Indic. 6, 83–93. doi: 10.1016/j.ecolind.2005.08.006
Palmeirim, J. M., and Rabaça, J. E. (1981). A method to analyse and compensate for time-of-day effects on bird counts. J. Field Ornithol. 65, 17–26.
Pearman, P. B., Lavergne, S., Roquet, C., Wüest, R., Zimmermann, N. E., and Thuiller, W. (2014). Phylogenetic patterns of climatic, habitat and trophic niches in a European avian assemblage. Glob. Ecol. Biogeogr. 23, 414–424. doi: 10.1111/geb.12127
Pérez-Garcia, J. M., Sebastian-Gonzalez, E., Botella, F., and Sanchéz-Zapata, J. A. (2016). Selecting indicator species of infrastructure impacts using network analysis and biological traits: bird electrocution and power lines. Ecol. Indic. 60, 428–433. doi: 10.1016/j.ecolind.2015.07.020
R Development Core Team (2019). R: A Language and Environment for Statistical Computing. Vienna: R Foundation for Statistical Computing.
Richardson, A. (2007). An active tutorial on distance sampling. J. Stat. Educ. 15:1. doi: 10.1080/10691898.2007.11889456
Rodrigues, A. S. L., and Brooks, T. M. (2007). Shortcuts for biodiversity conservation planning: the effectiveness of surrogates. Annu. Rev. Ecol. Evol. Syst. 38, 713–737. doi: 10.1146/annurev.ecolsys.38.091206.095737
Rubolini, D., Liker, A., Garamszegi, L. Z., Møller, A. P., and Saino, N. (2015). Using the BirdTree.org website to obtain robust phylogenies for avian comparative studies: a primer. Curr. Zool. 61, 959–965. doi: 10.1093/czoolo/61.6.959
Santos, M., Travassos, P., Repas, M., and Cabral, J. A. (2009). Modelling the performance of bird surveys in non-standard weather conditions: general applications with special reference to mountain ecosystems. Ecol. Indic. 9, 41–51. doi: 10.1016/j.ecolind.2008.01.008
Schieck, J. (1997). Biased detection of bird vocalizations affects comparisons of bird abundance among forested habitats. Condor 99, 179–190. doi: 10.2307/1370236
Silva, J. P., Catry, I., Palmeirim, J. M., and Moreira, F. (2015). Freezing heat: thermally imposed constraints on the daily activity patterns of a free-ranging grassland bird. Ecosphere 6, 1–13. doi: 10.1890/ES14-00454.1
Sólymos, P., Matsuoka, S. M., Stralberg, D., Barker, N. K. S., and Bayne, E. M. (2018). Phylogeny and species traits predict bird detectability. Ecography 41, 1595–1603. doi: 10.1111/ecog.03415
Storchová, L., and Hořák, D. (2018). Life-history characteristics of European birds. Glob. Ecol. Biogeogr. 27, 400–406. doi: 10.1111/geb.12709
Surmacki, A., and Tryjanowski, P. (2000). Efficiency of line transect and the point count methods in agricultural landscape of western Poland. Vogelwelt 120, 201–204.
Thompson, F. R., and Schwalbach, M. J. (1995). “Analysis of sample size, counting time, and plot size from an avian point count survey on Hoosier national Forest, Indiana,” in Monitoring Bird Populations by Point Counts. Gen. Tech. Rep. PSW-GTR-149, eds R. C. John, S. R. John, and D. Sam (Albany, CA: U.S. Department of Agriculture, Forest Service, Pacific Southwest Research Station), 45–48.
van Rij, J., Wieling, M., Baayen, R., and van Rijn, H. (2017). itsadug: Interpreting Time Series and Autocorrelated Data Using GAMMs. R package version 2.3.
Welsh, A. H. (2002). Incomplete detection in enumeration surveys: whither distance sampling? Aust. N. Z. J. Stat. 44, 13–22.
Welsh, A. H., Lindenmayer, D. B., and Donnelly, C. F. (2013). Fitting and interpreting occupancy models. PLoS One 8:e52015. doi: 10.1371/journal.pone.0052015
Wiley, R. H. (1991). Associations of song properties with habitats for territorial Oscine birds of Eastern North America. Am. Nat. 138, 973–993. doi: 10.1086/285263
Williams, C. B. (1961). Studies on the effect of weather conditions on the activity and abundance of insect populations. Philos. Trans. R. Soc. Lond. B Biol. Sci. 244, 331–378. doi: 10.1098/rstb.1961.0011
Wood, S. N. (2013). On p-values for smooth components of an extended generalized additive model. Biometrika 100, 221–228. doi: 10.1093/biomet/ass048
Wood, S. N. (2017). Generalized Additive Models: An Introduction with R, 2nd Edn. London: Chapman and Hall.
Keywords: bird survey, census, conspicuousness, cues, daytime, detectability, monitoring programs, trophic guild
Citation: Morelli F, Brlík V, Benedetti Y, Bussière R, Moudrá L, Reif J and Svitok M (2022) Detection Rate of Bird Species and What It Depends on: Tips for Field Surveys. Front. Ecol. Evol. 9:671492. doi: 10.3389/fevo.2021.671492
Received: 05 March 2021; Accepted: 02 December 2021;
Published: 11 January 2022.
Edited by:
Cornelia Oedekoven, University of St Andrews, United KingdomReviewed by:
Aurelio F. Malo, University of Alcalá, SpainJoão E. Rabaça, University of Evora, Portugal
Copyright © 2022 Morelli, Brlík, Benedetti, Bussière, Moudrá, Reif and Svitok. This is an open-access article distributed under the terms of the Creative Commons Attribution License (CC BY). The use, distribution or reproduction in other forums is permitted, provided the original author(s) and the copyright owner(s) are credited and that the original publication in this journal is cited, in accordance with accepted academic practice. No use, distribution or reproduction is permitted which does not comply with these terms.
*Correspondence: Federico Morelli, fmorellius@gmail.com