Epibionts Reflect Spatial and Foraging Ecology of Gulf of Mexico Loggerhead Turtles (Caretta caretta)
 Ian Silver-Gorges1*
  Jeroen Ingels2
  Giovanni A. P. dos Santos3
  Yirina Valdes4 Leticia P. Pontes3 Alexsandra C. Silva3 Patricia F. Neres3
  Arvind Shantharam1 Destin Perry2 Andrew Richterkessing2 Sofia Sanchez-Zarate5 Laura Acevedo6 Anthony J. Gillis1
  Simona A. Ceriani7
  Mariana M. P. B. Fuentes1
- 1Department of Earth, Ocean, and Atmospheric Science, Florida State University, Tallahassee, FL, United States
- 2Coastal and Marine Laboratory, Florida State University, St. Teresa, FL, United States
- 3Zoology Department, Federal University of Pernambuco, Recife, Brazil
- 4Department of Biosciences, Federal University of Paraiba, Areia, Brazil
- 5Department of Computer Science and Engineering, Columbia University, New York, NY, United States
- 6Department of Geosciences and Natural Resource Management, University of Copenhagen, Copenhagen, Denmark
- 7Fish and Wildlife Research Institute, Florida Fish and Wildlife Conservation Commission, Saint Petersburg, FL, United States
Sea turtles are exposed to numerous threats during migrations to their foraging grounds and at those locations. Therefore, information on sea turtle foraging and spatial ecology can guide conservation initiatives, yet it is difficult to directly observe migrating or foraging turtles. To gain insights into the foraging and spatial ecology of turtles, studies have increasingly analyzed epibionts of nesting turtles, as epibionts must overlap spatially and ecologically with their hosts to colonize successfully. Epibiont analysis may be integrated with stable isotope information to identify taxa that can serve as indicators of sea turtle foraging and spatial ecology, but few studies have pursued this. To determine if epibionts can serve as indicators of foraging and spatial ecology of loggerhead turtles nesting in the northern Gulf of Mexico we combined turtle stable isotope and taxonomic epibiont analysis. We sampled 22 individual turtles and identified over 120,000 epibiont individuals, belonging to 34 macrofauna taxa (>1 mm) and 22 meiofauna taxa (63 μm–1 mm), including 111 nematode genera. We quantified epidermis δ13C and δ15N, and used these to assign loggerhead turtles to broad foraging regions. The abundance and presence of macrofauna and nematodes did not differ between inferred foraging regions, but the presence of select meiofauna taxa differentiated between three inferred foraging regions. Further, dissimilarities in macrofauna, meiofauna, and nematode assemblages corresponded to dissimilarities in individual stable isotope values within inferred foraging regions. This suggests that certain epibiont taxa may be indicative of foraging regions used by loggerhead turtles in the Gulf of Mexico, and of individual turtle foraging and habitat use specialization within foraging regions. Continued sampling of epibionts at nesting beaches and foraging grounds in the Gulf of Mexico and globally, coupled with satellite telemetry and/or dietary studies, can expand upon our findings to develop epibionts as efficient indicators of sea turtle foraging and spatial ecology.
Introduction
Sea turtles are highly migratory animals: hatchling turtles may circumnavigate entire ocean basins before maturation (Carr, 1987; Mansfield et al., 2014), and individual mature turtles migrate thousands of kilometers between specific foraging and breeding grounds each year (Plotkin et al., 2002; Broderick et al., 2007; Shillinger et al., 2008). Sea turtles spend much of their lives at foraging grounds (Bolten, 2003; Hawkes et al., 2006), and may be exposed to various threats at these locations (Hart et al., 2018; Fuentes et al., 2020) or while migrating between foraging and breeding regions (Hart et al., 2014).
Knowledge of sea turtle foraging and spatial ecology is critical to identify areas of high/potential use, assess their exposure to threats, and inform management and conservation of sea turtles (Hawkes et al., 2006; Gredzens et al., 2014; Mazor et al., 2016; Rees et al., 2016; Fuentes et al., 2019). However, sea turtle research overwhelmingly relies upon data collected from nesting sea turtles, as they are easier to encounter and sample than foraging, in-water turtles (Hamann et al., 2010; Rees et al., 2016). Satellite telemetry and stable isotope analysis (SIA) are two techniques commonly employed at nesting beaches that provide insight into sea turtle behavior away from nesting beaches (Ceriani et al., 2012; Jeffers and Godley, 2016). Satellite telemetry can be used to track turtles between nesting beaches and foraging grounds and to understand the spatial ecology of sea turtles at foraging grounds (Jeffers and Godley, 2016; Hays and Hawkes, 2018). However, the cost of satellite transmitters is often prohibitive to their use, and many studies only track a small percentage of any nesting assemblage (Rees et al., 2016). Analysis of carbon and nitrogen stable isotopes is less expensive than satellite telemetry and can be used to approximate where sea turtles forage and at what trophic level (DeNiro and Epstein, 1978; Rubenstein and Hobson, 2004; Reich et al., 2007; Vander Zanden et al., 2010). Such inferences depend upon the available baseline stable isotope data in a region, and on isotopic differences between turtles from different foraging grounds, however, baseline data is not always available for a region nor do turtles from different foraging grounds always have different isotopic signatures (Vander Zanden et al., 2015; Ceriani et al., 2017). Therefore, novel, cost-effective and informative tools to explore turtle foraging and spatial ecology would prove useful additions to satellite telemetry and SIA (Rees et al., 2016; Hays and Hawkes, 2018).
Recent attention has turned to sea turtle epibionts as potential natural data loggers of sea turtle migratory and foraging behaviors (Frick and Pfaller, 2013; Pearson et al., 2019; Ten et al., 2019). Epibionts are organisms that colonize other organisms, and are commonly found on the carapaces of all seven sea turtle species (Frick and Pfaller, 2013; Robinson et al., 2016). Epibiotic colonization typically begins after chemical alteration of submerged substrates, followed by the establishment of (1) unicellular bacteria; (2) diatoms and protozoans, and (3) meiofauna and macrofauna (Wahl, 2009; dos Santos et al., 2018). Colonization requires ecological and spatial overlap of epibionts and living substrate (such as sea turtle carapaces), and it is thought that colonization of sea turtle carapaces occurs primarily at foraging grounds, with some colonization occurring at breeding areas (see Figure 15.1 in Frick and Pfaller, 2013; Reeves et al., 2018; Hart et al., 2021).
Few studies have sought to characterize the relationships between epibiont colonization and turtle foraging ecology (Reich et al., 2010; Ten et al., 2019). This is a difficult endeavor, as most epibiont studies report on assemblages sampled from nesting sea turtles, which may share epibiont taxa from recent colonization (Reeves et al., 2018; Hart et al., 2021), and do not pair epibiont sampling with satellite telemetry or stable isotope analysis of turtle tissues to relate epibiosis to foraging or spatial ecology (Frick and Pfaller, 2013; except see Reich et al., 2010; Nolte et al., 2020). Additionally, most studies of sea turtle epibionts focus on large, easily observable species and do not characterize microscopic organisms such as meiofauna that may colonize sea turtle carapaces in large numbers, establishing diverse epibiotic communities (Frick and Pfaller, 2013; notable exceptions include Corrêa et al., 2014; Robinson et al., 2016; dos Santos et al., 2018; Ingels et al., 2020).
Diverse epibiont assemblages, cumulating in over 200 taxa, have been documented on loggerhead sea turtles (Caretta caretta; Frick and Pfaller, 2013). A recent study of loggerheads nesting at St. George Island (SGI), Florida, characterized the abundance of 20 meiofauna taxa including 111 nematode genera, and reported discrete groups of epibiont assemblages (Ingels et al., 2020). This implies that some sampled loggerheads underwent similar colonization processes and as such may display similar foraging and spatial ecology. We investigated if and how epibiont assemblages can be informative toward understanding sea turtle foraging and spatial ecology, both alone and when integrated with SIA data. To do so, we analyzed the meiofauna epibiont data from Ingels et al. (2020), along with new data from macrofauna epibiont and stable isotope analyses from the same turtles. We tested to see if and how epibiont assemblages differed between turtles from different inferred foraging regions, and if stable isotope data predicted variation in epibiont assemblages. Our work tests fundamental theories on epibiont colonization and explores the extent to which epibionts can provide information on sea turtle foraging and spatial ecology.
Materials and Methods
We encountered nesting loggerhead sea turtles during nightly surveys at SGI (Figure 1). St. George Island hosts the largest loggerhead assemblage in the Northern Gulf of Mexico Recovery Unit (NGMRU) for loggerhead sea turtles (FFWCC, 2020). The NGMRU spans beaches from the United States-Mexico border in Texas to Franklin Co., FL, and is a small (Ceriani et al., 2019), genetically discrete subpopulation (Shamblin et al., 2012) of the Northwest Atlantic Ocean Regional Management Unit (RMU) of loggerhead turtles (Wallace et al., 2010), the largest loggerhead RMU globally (Casale and Tucker, 2017; Ceriani et al., 2019). Surveys took place over 2 weeks during the peak of the 2018 nesting season at St. George Island, from June 16th to July 1st (Ingels et al., 2020). We sampled encountered turtles after they had begun covering their egg chambers. We checked all turtles for pre-existing Inconel flipper or PIT tags, and applied these whenever necessary following protocols in the Florida Fish and Wildlife Conservation Commission Marine Turtle Conservation Handbook (FFWCC, 2016). We sampled the entire carapace of each turtle for epibionts following Ingels et al. (2020). Briefly, we scraped off large fauna such as barnacles with a putty knife, and collected small fauna such as nematodes with a sponge by wiping down the entire surface until visibly clean. We stored all epibionts in DESS or a formalin solution until they could be sorted and identified (see below). We collected epidermal tissue samples for SIA from the shoulder of each turtle using 5 mm biopsy punches and stored samples in salt.
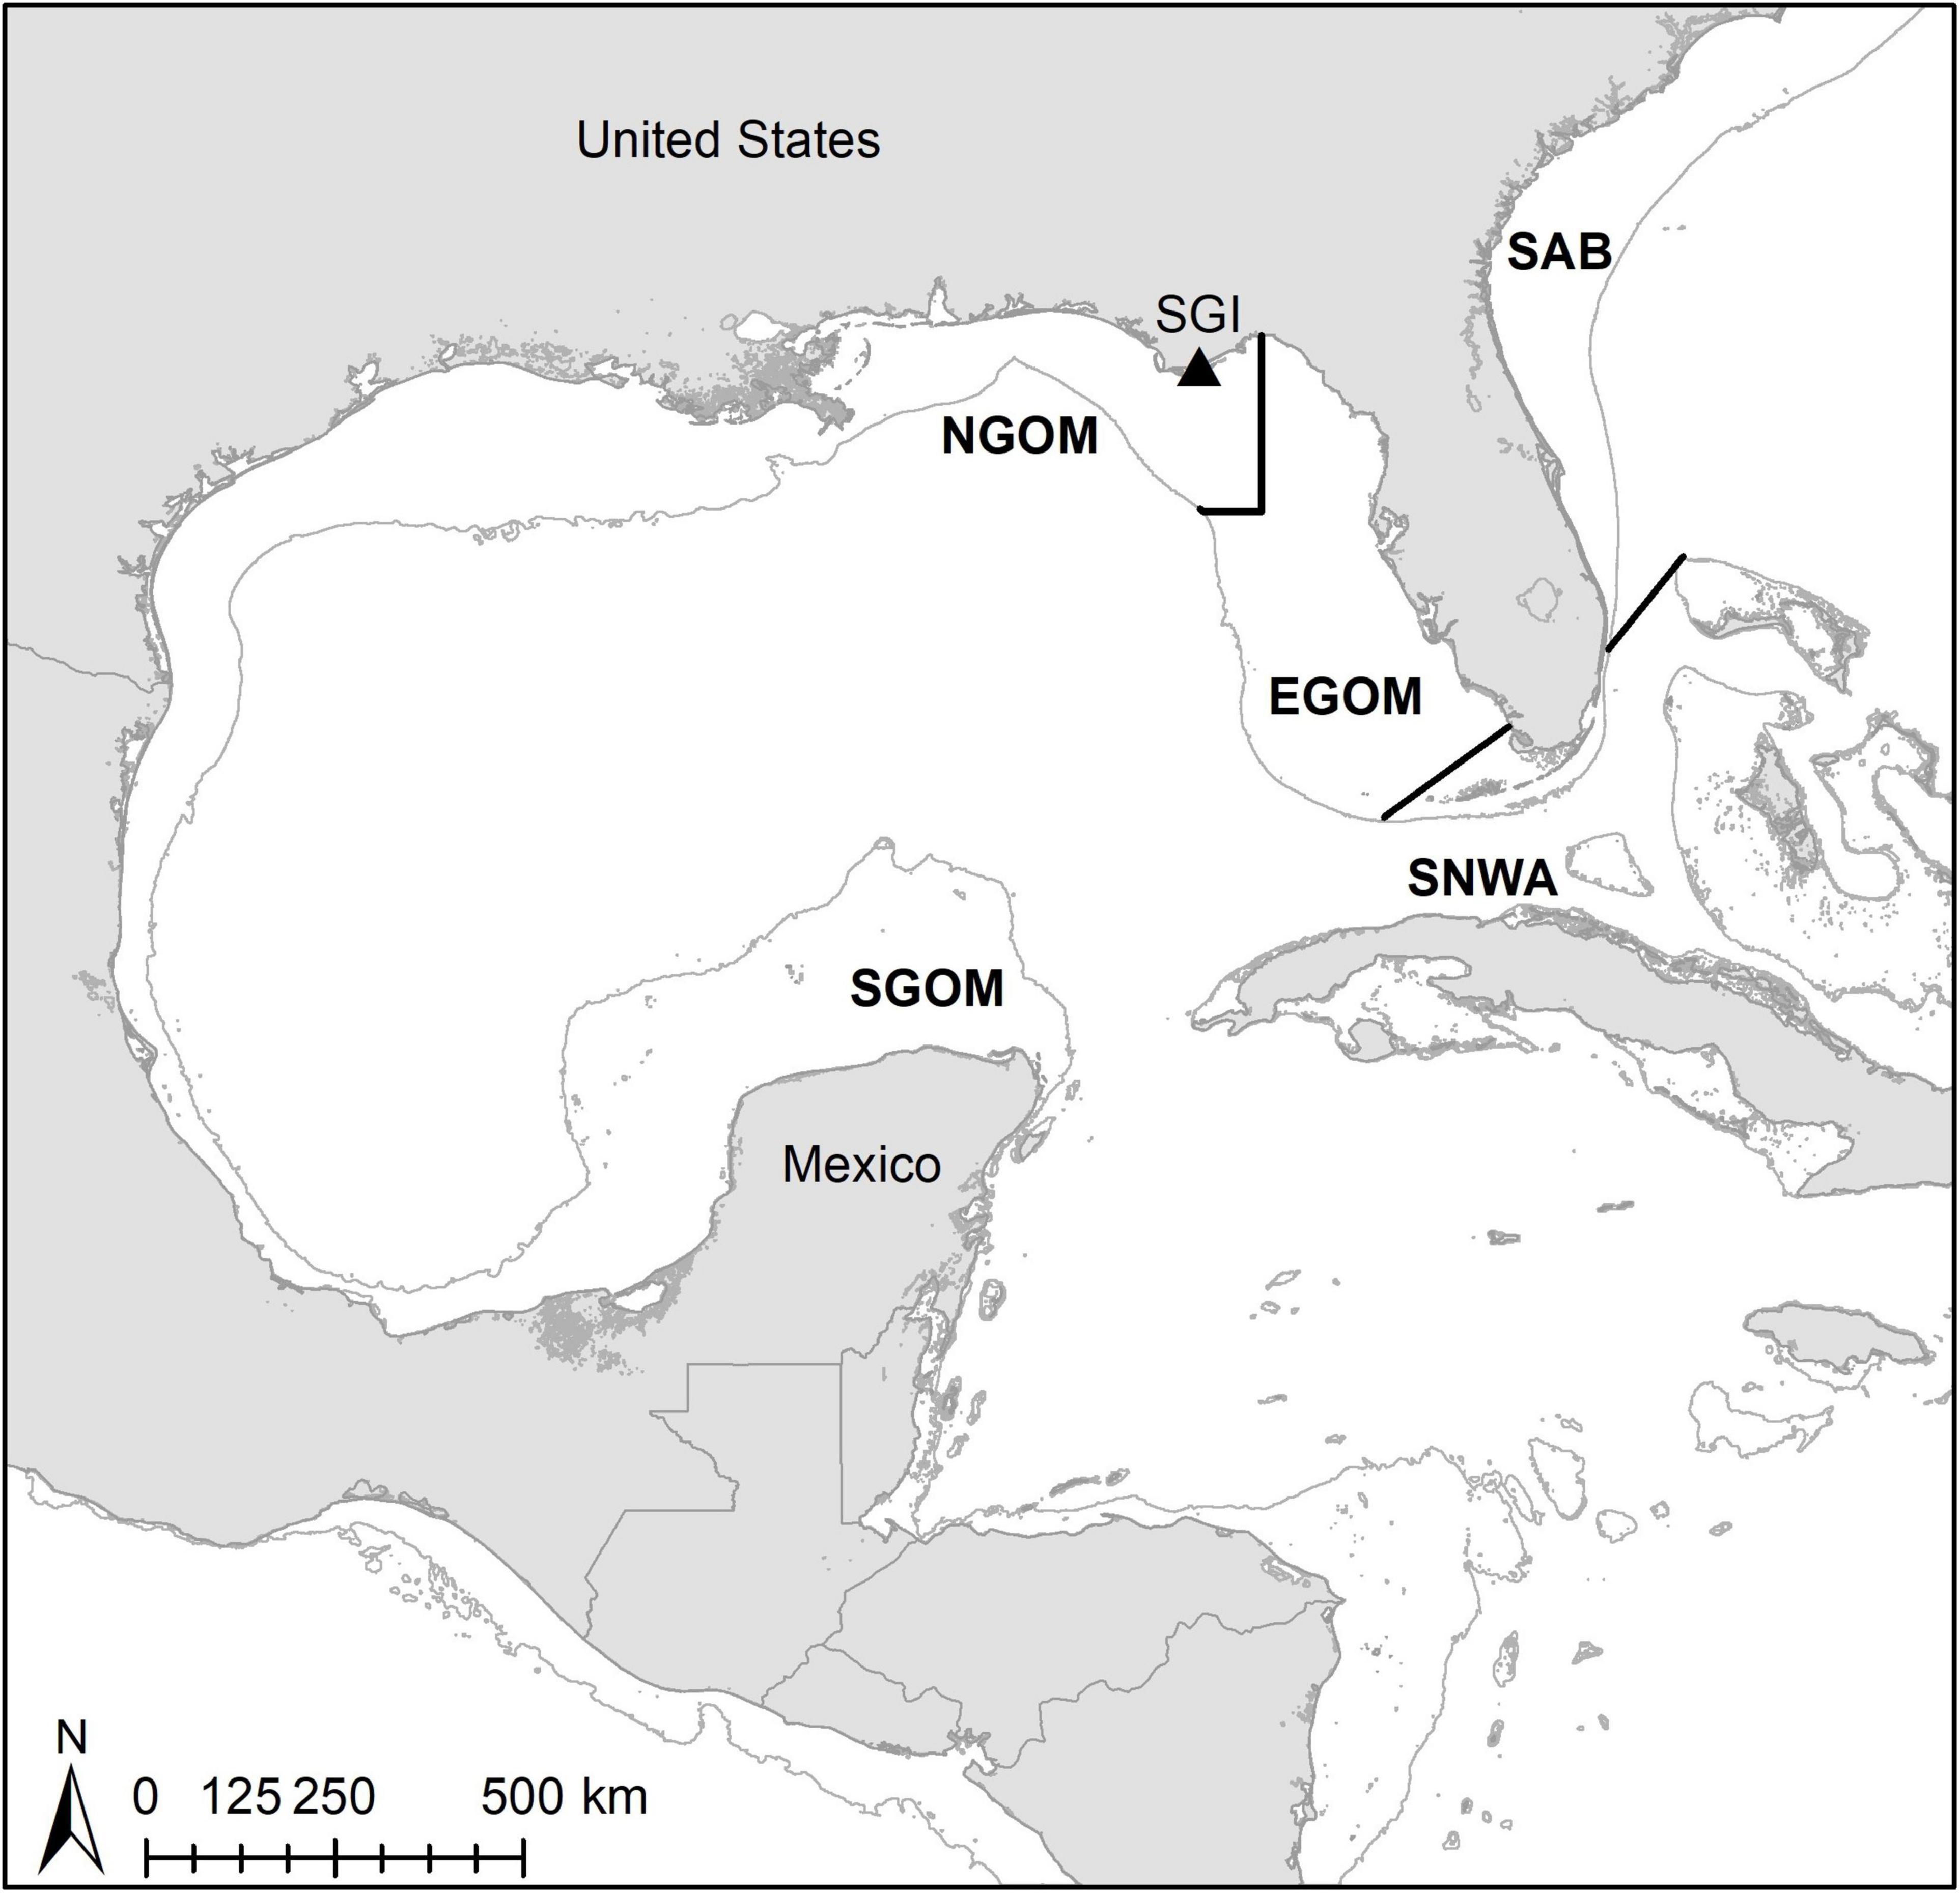
Figure 1. Map of study site (St. George Island; SGI) and broad foraging regions for assignments. NGOM, Northern Gulf of Mexico; EGOM, Eastern Gulf of Mexico; SGOM, Southern Gulf of Mexico; SNWA, Subtropical Northwest Atlantic; SAB, South Atlantic Bight. Thin gray lines indicate 200-m depth contours.
We washed and sorted epibiont samples into macrofauna (>1 mm) and meiofauna (63 μm–1 mm) at the Florida State University Coastal and Marine Laboratory. We stored macrofauna and meiofauna separately in a solution of dimethyl sulfoxide, ethylenediaminetetraacetic acid, and saturated sodium chloride (DESS). We identified meiofauna to higher taxa (Higgins and Thiel, 1988; Giere, 2009, following quantitative subsampling procedures from Ingels et al., 2020), and macrofauna to the lowest taxonomic level possible, usually family or a lower level using stereoscopic microscopes and taxa-specific keys to Gulf of Mexico invertebrates (Fauchald, 1977; Culter, 1986). We picked out nematodes ad hoc from meiofauna samples (120 individuals per sample), which we then desiccated, and mounted on slides for identification to genera using available nematode keys (Platt and Warwick, 1983; Bezerra et al., 2019).
We prepared turtle tissue samples for SIA at Florida State University Department of Earth, Ocean, and Atmospheric Science. Samples were brushed and then rinsed with deionized water to remove particulate matter and salt, dried in an oven for 2 h at 60°C to remove all moisture, and homogenized using a sterile scalpel (following Lemons et al., 2011; Levin and Currin, 2012; Gillis et al., 2018). We sent homogenized samples to the Paleoclimatology, Paleoceanography, and Biogeochemistry Laboratory at the University of South Florida College of Marine Science for lipid extraction and SIA. Lipids were extracted from samples using an accelerated solvent extractor (Model 200, Dionex) with petroleum ether (3 cycles of 5 min heating followed by 5 min static purging). Samples were then weighed to 0.5–0.7 mg using a Mettler Toledo micro balance, placed into Costech tin cups, and converted to N2 and CO2 using a Carlo-Erba NA2500 Series 2 Elemental Analyzer (Thermoquest Italia). Isotope ratios were measured in a continuous flow mass spectrometer (Delta Plus XP, Thermofinnigan). Sample ratios are expressed as parts per mille (‰) and calculated using the equation:
where X is 15N or 13C, and R is the ratio of 15N:14N or 13C:12C. Standards for 15N and 13C were atmospheric nitrogen and Pee Dee Belemnite, respectively.
SIA values were incorporated into continuous probability surfaces (CPSs) and discriminant functions (DFs) to assign turtles to broad foraging regions within the Gulf of Mexico [as designated by Vander Zanden et al., 2015: Northern Gulf of Mexico (NGOM), Eastern Gulf of Mexico (EGOM), Southern Gulf of Mexico (SGOM), Subtropical Northwest Atlantic (SNWA) and South Atlantic Bight (SAB); Figure 1]. We retrieved previously published scute SIA values, foraging locations, and isoscapes from tracked Gulf of Mexico loggerheads from Vander Zanden et al. (2015). We converted SIA values for sampled turtles from epidermis to scute using equations in Vander Zanden et al. (2014), and generated continuous probability rasters for each individual turtle following Ceriani et al. (2017). Individuals were assigned to the foraging region containing the highest probability raster cell. We constructed DFs to assign individuals to foraging regions with the same published SIA data from turtles with known foraging locations in SPSS 27 (IBM; i.e., Ceriani et al., 2014). The first two DFs were constructed based on 39 training individuals and tested with 19 individuals, both groups with known foraging locations. Assignments were made using unequal priors and a leave-one-out cross-validation method (Ceriani et al., 2014; Vander Zanden et al., 2014). Wilks’ Lambda was used to assess if the first two DFs adequately explained group membership. Assignment probabilities and odds ratios (Wunder, 2012) were used to assess foraging region assignments for turtles sampled at SGI.
We imported epibiont abundance, SIA, and foraging data into Primer-e V7 (Clarke and Gorley, 2015) with the PERMANOVA+ add on (Anderson et al., 2008) to characterize epibiont assemblages (i.e., diversity indices) and explore relationships between epibiont assemblages, foraging regions, and SIA data. We analyzed macrofauna, meiofauna, and nematodes independently to determine whether and which taxa might relate to the foraging ecology of individual turtles. We square root (sqrt) transformed abundance data to reduce the influence of particularly abundant taxa on multivariate statistics, and presence-absence (p-a) transformed abundance data to determine if the presence or absence of certain taxa related to turtle foraging ecology (Clarke and Gorley, 2015). Square-root transformed data were duplicated and standardized (sqrt-stan) to minimize the influence of variable abundances between samples. Bray-Curtis and Euclidean distance were used as the resemblance measures for epibiont and SIA data, respectively. We used non-metric Multi-Dimensional Scaling (nMDS) plots to visualize data and qualitatively assay for dissimilarities in epibiont assemblages between turtles assigned to different foraging grounds. CLUSTER and SIMPROF (with 5% significance tests) were used to identify similar groups of epibiont assemblages and determine if these groups corresponded to turtles assigned to the same foraging grounds. ANOSIM and PERMANOVA were used to determine if epibiont assemblages differed between turtles assigned to different foraging regions, and SIMPER was used to identify taxa contributing to these differences. RELATE and BEST were used to determine if individual foraging ecology related to epibiont assemblages, and which sample epibiont assemblage dissimilarities correlated significantly (significance level = 5%) to SIA sample dissimilarities. We ran all tests over 10,000 iterations (Clarke and Gorley, 2015).
Results
We sampled 23 individuals for epibionts and 22 individuals for stable isotopes (summary statistics are presented in Table 1). The first two foraging region assignment DFs constructed using the training data were significant (p > Wilks’ Lambda < 0.000). The first two DFs had a combined χ2(6) = 98.954, (p < 0.000). Alone, the second DF had a χ2(2) = 9.74, (p = 0.008). The first DF explained 97.4% of the between-group variability, and the second DF explained 2.6% of the between-group variability. 30/39 (76.9%) loggerheads in the training data and 14/19 (73.7%) loggerheads in the testing data were assigned correctly to their known foraging regions. Assignment probabilities ranged from 0.41 to 1 (mean = 0.66 ± 0.18 SD). Odds ratios that described how much more informative the DFs were for assigning individual turtles to foraging regions than a random assignment procedure ranged from 2.04:1 to 6,040,365:1 (mean = 13.6:1 ± 27.4 SD). We have chosen to retain all DF assignments in subsequent analyses (following Kelly et al., 2005; Szymanski et al., 2007; López-Castro et al., 2014). The DF assignments made here had higher probability than if turtles were assigned at random (all turtles had >0.25 probability of being assigned to their most likely foraging region), and we acknowledge the potential for erroneous assignments when not using a probability threshold (i.e., >0.6; see discussion). The CPS and DF foraging ground assignments produced similar results: most turtles were assigned to SGOM (CPS, n = 10; DF, n = 8), followed by EGOM (CPS, n = 8; DF, n = 7), NGOM (CPS, n = 3; DF, n = 6), and finally SNWA (CPS, n = 1; DF, n = 1; Table 1). No turtles were assigned to SAB. Fewer turtles were assigned to NGOM using CPS (n = 3) than DF (n = 6), and more turtles were assigned to EGOM and SGOM using CPS (n = 8 and 10, respectively) than using DF (n = 7 and 8, respectively, Table 1).
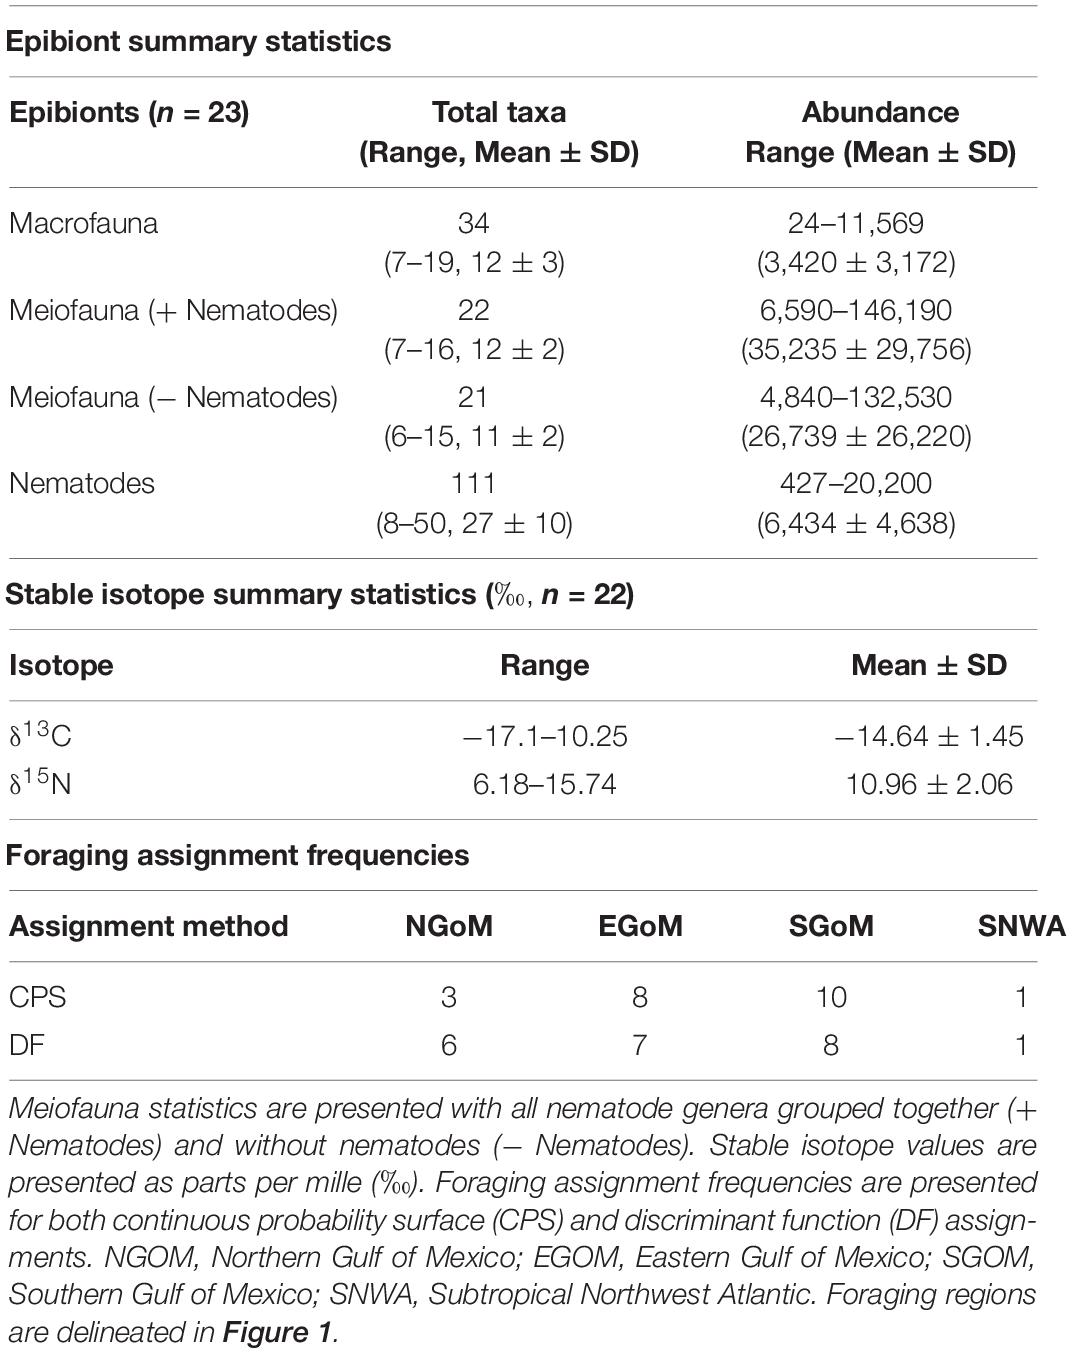
Table 1. Epibiont and stable isotope summary statistics and foraging assignment frequencies.
CLUSTER and SIMPROF identified distinct, significant (p < 0.05) groups (k) of similar epibiont assemblages within the meiofauna (ksqrt–stan, kp–a = 2; Supplementary Figure 1) and nematodes (ksqrt–stan = 3, kp–a = 2, ksqrt = 4; Supplementary Figure 2), but not within macrofauna. SIMPROF groups did not appear to correspond to CPS or DF foraging ground assignments in visual examinations of two dimensional nMDS plots (Supplementary Figures 1, 2), but presence-absence transformed meiofauna and square-root transformed nematode assemblages did group visibly according to foraging assignment categories (Figure 2). The presence and absence of certain meiofauna contributed to assemblage differences below or near statistical significance (ANOSIM: Rho = 0.158, p = 0.032) between turtles assigned to the NGOM and SGOM by DF (ANOSIM: Rho = 0.278, p = 0.015; PERMANOVA: pseudo-F = 78.005, t13 = 1.75, p = 0.019), and EGOM and SGOM (ANOSIM: Rho = 0.156, p = 0.052%). SIMPER identified Sarcomastigophorans, Bivalves, Polychaetes, Turbellarians, Limulids, Tanaidaceans, Nauplii, and Acari as contributing to a cumulative 77.18% of the differences between NGOM and SGOM assemblages (Figure 3A and Supplementary Table 1). Many of the same taxa contributed to differences between EGOM and SGOM assemblages (72.16%) with a few modifications: Nauplii and Tanaidaceans did not contribute to differences, while Hydroids did (Figure 3A and Supplementary Table 2). The abundance of nematode genera also contributed significantly to differences (ANOSIM: Rho = 0.183, p = 0.034%) between turtles assigned to the EGOM and SGOM by CPS (ANOSIM: Rho = 0.2, p = 0.013%; PERMANOVA: pseudo-F = 37.374, t16 = 1.38, p = 0.022). SIMPER identified 27 nematode genera that contributed to 70.96% dissimilarity between EGOM and SGOM assemblages (Figure 3B and Supplementary Table 3). Nematode abundance in SGOM assemblages was higher than in EGOM assemblages for nearly all genera that contributed most to dissimilarities between assemblages from these foraging regions (Figure 3B and Supplementary Table 3).
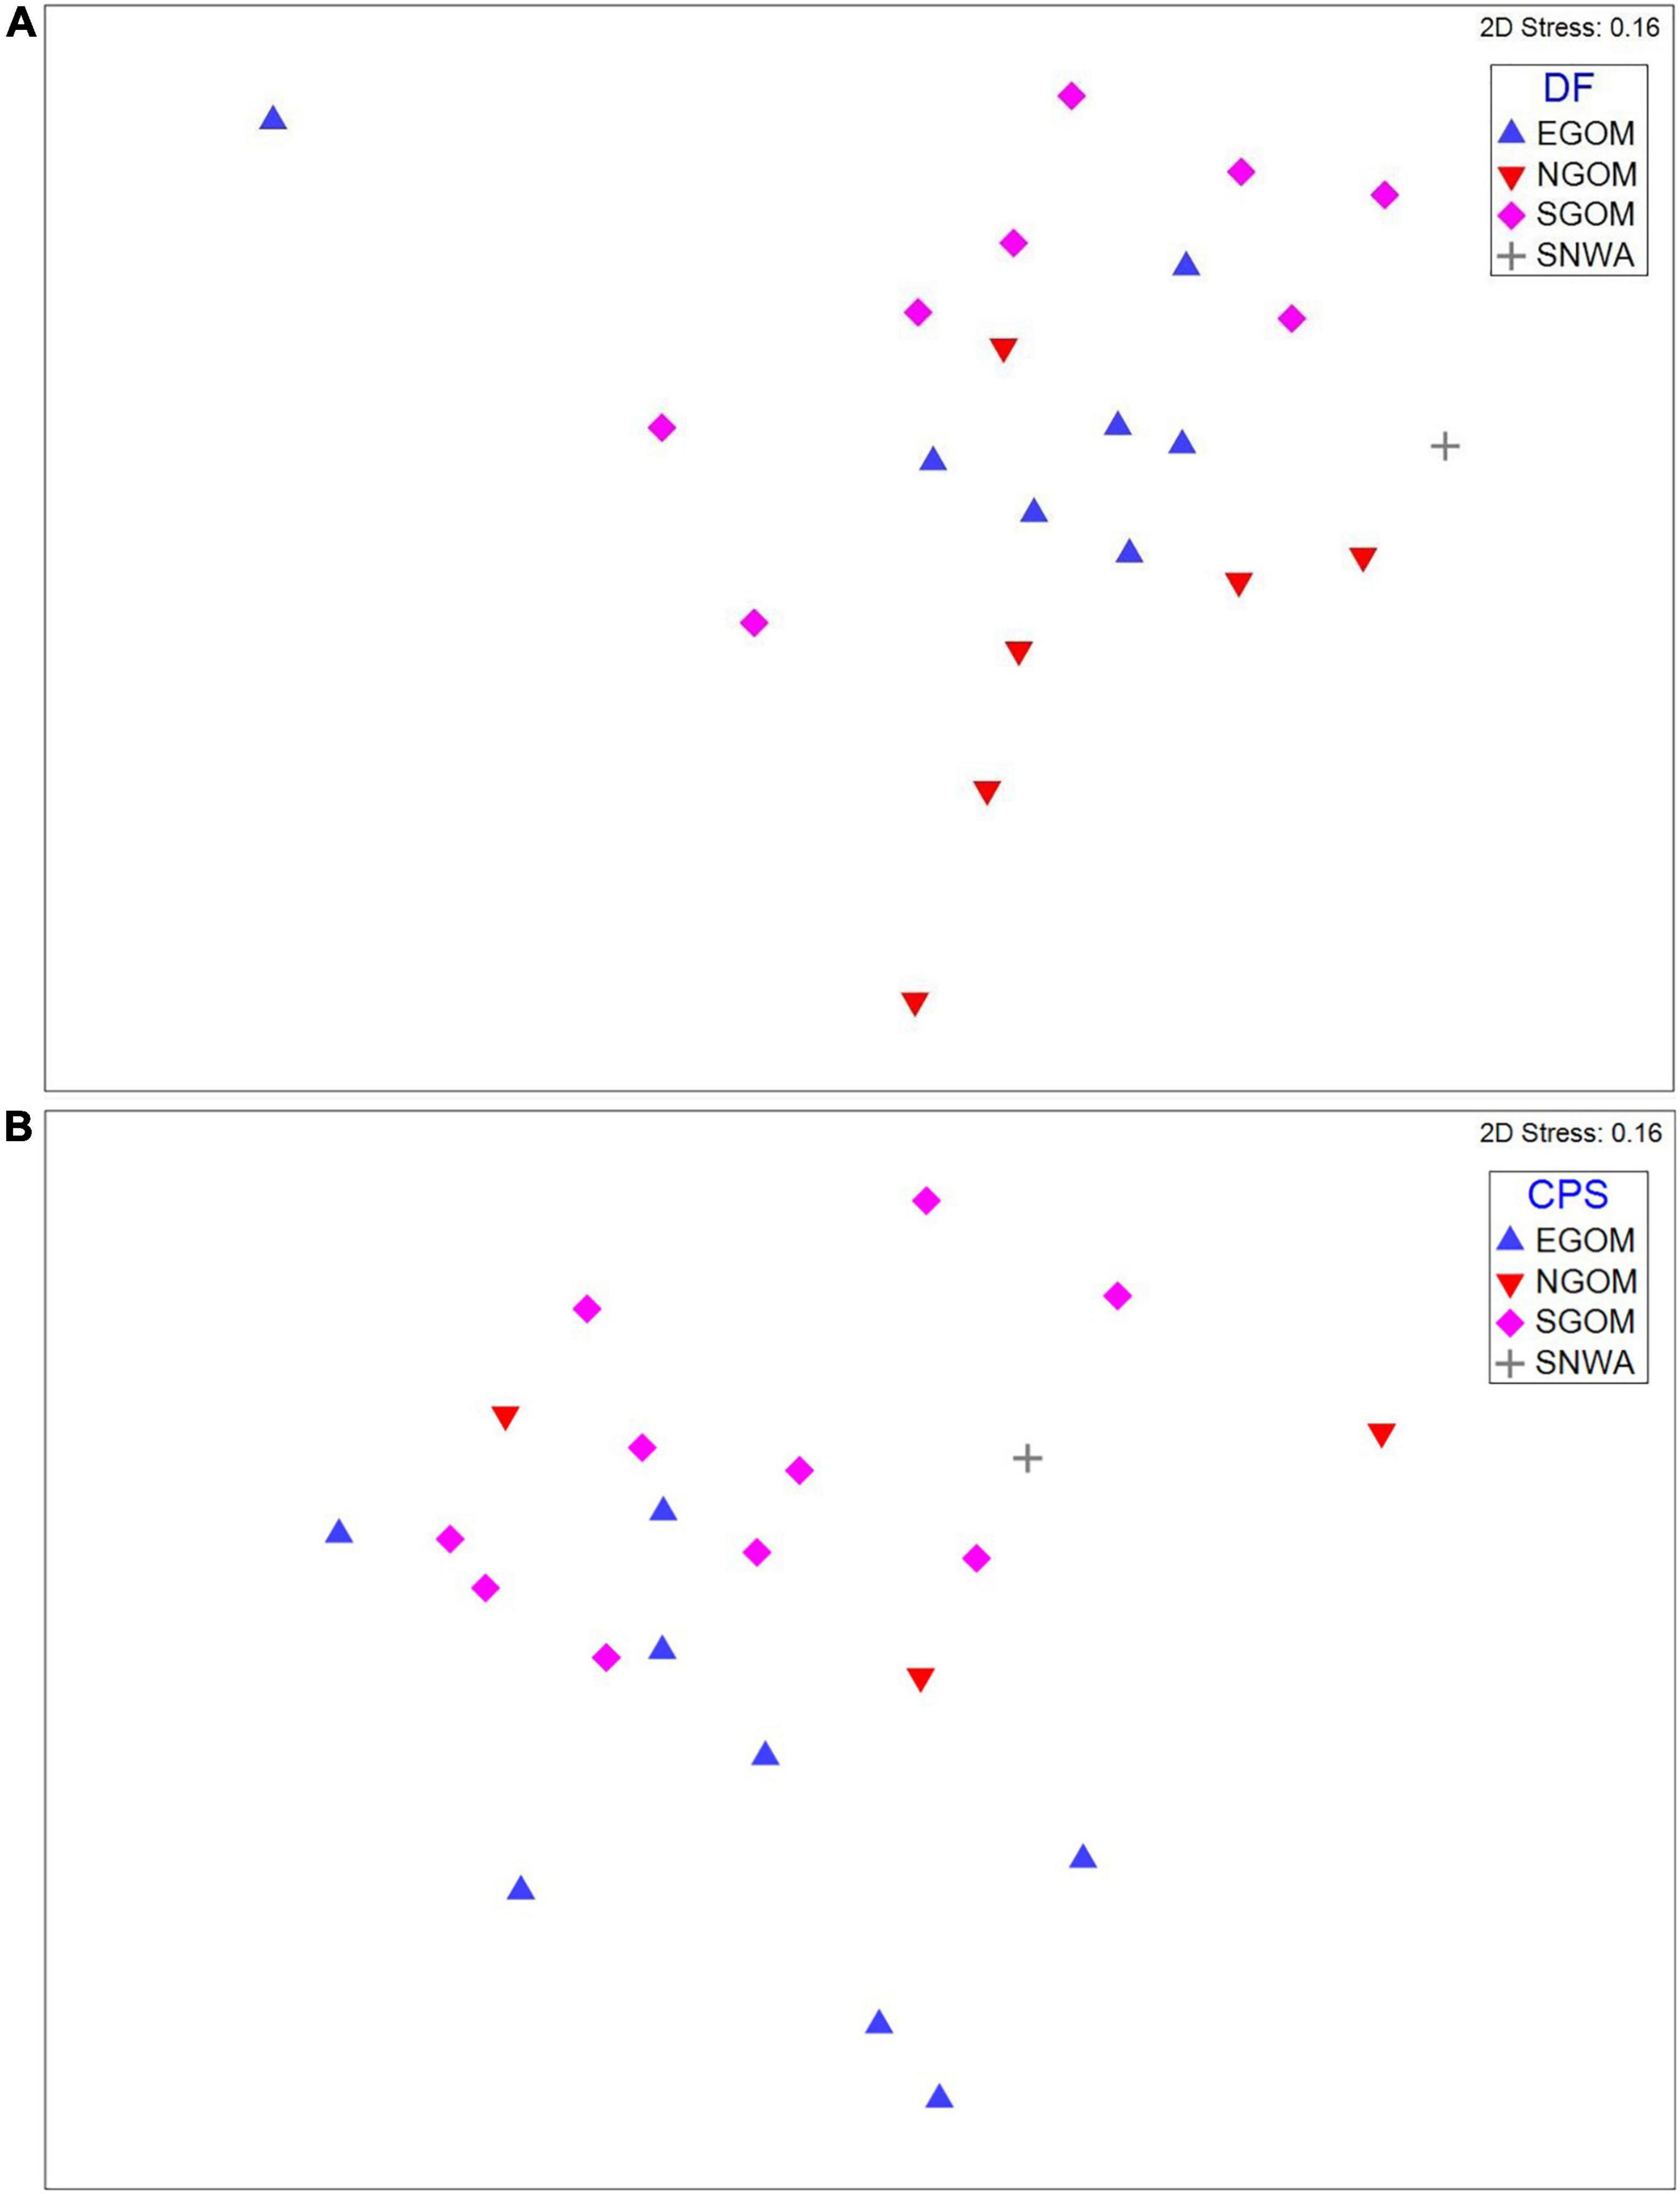
Figure 2. nMDS plots for (A) meiofauna presence-absence assemblages and (B) nematode square-root abundance assemblages showing evidence for moderate clustering (indicated by points occupying similar space in nMDS plots) by foraging region assignments (symbols). DF, Discriminant Function assignments; CPS, Continuous Probability Surface assignments; EGOM, Eastern Gulf of Mexico; NGOM, Northern Gulf of Mexico; SGOM, Southern Gulf of Mexico; SNWA, Subtropical Northwest Atlantic.
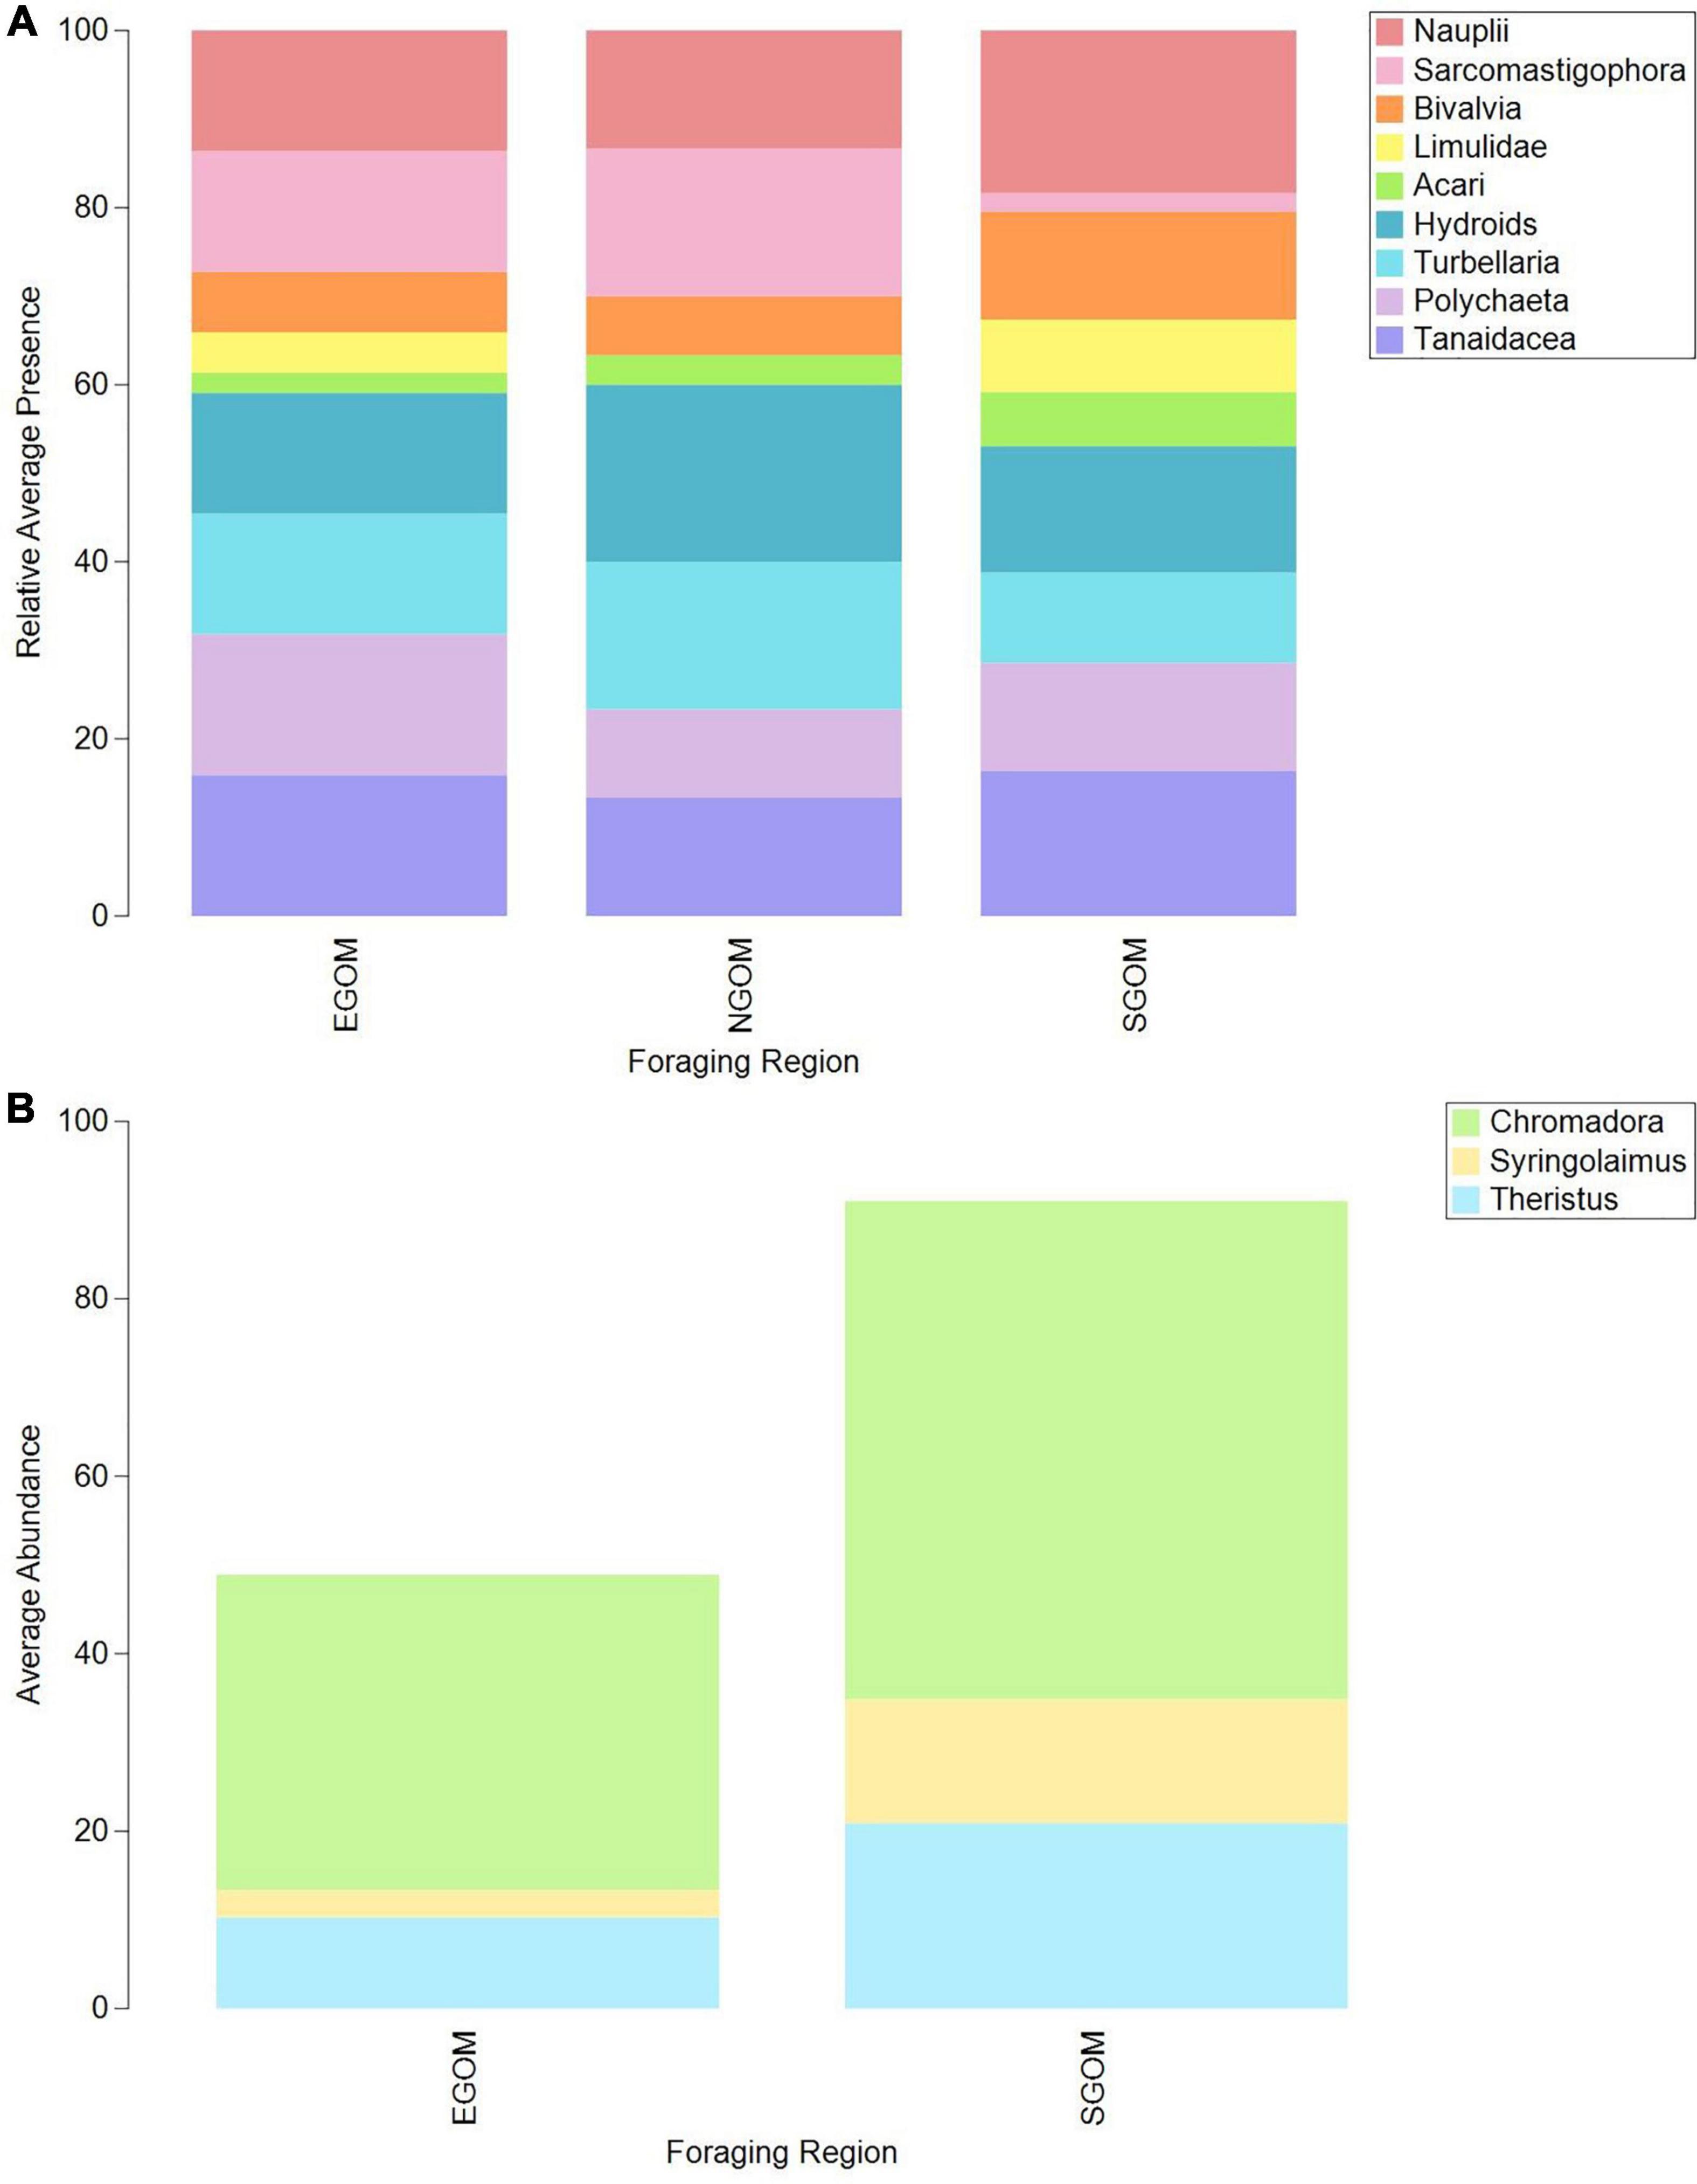
Figure 3. Bar plots of average relative presence of (A) meiofauna and (B) nematode taxa contributing to dissimilarities between Eastern Gulf of Mexico (EGOM), Southern Gulf of Mexico (SGOM), and Northern Gulf of Mexico (NGOM) DF-assigned turtles, identified via SIMPER. See Supplementary Tables 1, 2 for specific taxa contributions to dissimilarities between groups (full SIMPER results).
Dissimilarities in SIA data related to dissimilarities in epibiont assemblages consistently within DF-assigned foraging regions. Dissimilarities in δ15N correlated moderately with dissimilarities in macrofauna abundances within DF-assigned foraging regions (BEST: Rho = 0.49, p = 0.01). Dissimilarities in SIA data between individual turtles correlated significantly with dissimilarities between individual assemblage meiofauna abundance (RELATE: Rho = 0.22, p = 0.05) and presence or absence of certain taxa (RELATE: Rho = 0.246, p = 0.046) within DF-assigned foraging regions. Dissimilarities in δ13C and δ15N correlated also significantly with dissimilarities in nematode genera abundances (BEST: Rho = 0.409, p = 0.045) between samples within DF-assigned foraging groups.
Discussion
Epibionts may serve as useful indicators of sea turtle spatial and foraging ecology between and within broad foraging regions. In our study, meiofauna higher taxa and nematode genera proved more discriminative and informative toward broad foraging locations and foraging ecology than macrofauna higher taxa. Previous studies of loggerhead turtle epibiont assemblages elsewhere have suggested that differences in assemblages correspond to a foraging dichotomy between pelagic and neritic habitats (Reich et al., 2010; Nolte et al., 2020). Mature loggerhead turtles in the Atlantic Ocean, particularly in the Gulf of Mexico, restrict foraging to the shallow (<200 m), continental shelf (Hart et al., 2012, 2020; Hardy et al., 2014). Further, individuals exhibit specialized foraging behaviors across their entire foraging range (Vander Zanden et al., 2010, 2016). Variation in epibiont assemblages from adult loggerheads in the Gulf of Mexico therefore likely corresponds to habitat and habitat-use variation between and within foraging regions, rather than pelagic-neritic foraging dichotomies (Reich et al., 2010). Our findings lend support to these paradigms, as we found that some epibiont taxa differed between turtles from different foraging regions, and that epibiont assemblages differed between turtles from within the same foraging region. As colonization depends upon spatial and ecological overlap of epibionts and hosts (Frick and Pfaller, 2013), our analysis of epibionts is informative to the distribution of epibionts among turtle foraging regions and to the behaviors of turtles within those foraging regions.
Many taxa were commonly found on turtle carapaces, regardless of foraging region or SIA data. This may be due to recent colonization, epibiont taxa life-histories, and/or baseline abundance across foraging regions. Turtles that breed and nest in the same region are likely to be colonized in the short-term by the same taxa in similar abundances, particularly if individual turtles are behaving similarly (i.e., reserving resources for generating multiple clutches of eggs; Houghton et al., 2002). Organisms such as barnacles settle quite quickly, especially in the northern Gulf of Mexico (Reeves et al., 2018; Hart et al., 2021). It is possible that some ubiquitous epibionts such as turtle barnacles (Chelonibia testudinaria) and skeleton shrimp (Caprella andreae) settled on sampled turtles as they rested in-between nesting events. Organisms that colonize from a planktonic larval stage may disperse relatively far distances from their original substrate (Thiel, 2003), and therefore be found more commonly on turtles regardless of foraging region, prey-item preferences, or habitat use. This may be one reason why the macrofauna identified here did not differ between turtles from different foraging regions. Twenty-one of the 34 macrofauna taxa identified here have a largely pelagic larval stage before settling, including the highly abundant turtle barnacle and juvenile Cirripedia sp. Some taxa without larval dispersal (i.e., skeleton shrimp) were still the most abundant macrofaunal taxa on all turtles. These are abundant benthic species globally (Cabezas et al., 2013), and as such may be abundant turtle epibionts.
The presence and absence of select meiofauna taxa and the differential abundance of nematode genera drove differences between epibiont assemblages of turtles that forage in the NGOM, EGOM, and SGOM. This may have been driven by three factors.
First, colonization frequency may correspond to baseline abundances of these taxa within foraging regions. The presence or absence, or abundance, of taxa in epibiont assemblages can depend upon whether or not those taxa are found commonly within broad foraging regions. If turtles do not frequently encounter certain epibiont species within a foraging region, it is likely that those species will not be present (or will be present in reduced numbers) as epibionts of turtles from that foraging region (Frick and Pfaller, 2013).
Second, the life-histories of specific taxa may vary between foraging regions. For example, larval horseshoe crabs (family Limulidae) were not found on turtles that forage in the NGOM, but were present on SGOM and EGOM foragers. In the northwest Atlantic Ocean, horseshoe crabs begin breeding with the onset of warm temperatures (Rudloe, 1980; Cohen and Brockmann, 1983). It is possible that breeding had not begun in the NGOM by the time females migrated to SGI to breed. While it is also possible that turtles and horseshoe crabs do not interact in the NGOM, loggerheads are known to prey on horseshoe crabs (Seney and Musick, 2007; Botton, 2009) and would provide substrate for planktonic larvae in their vicinity (as evidenced here). If potential epibionts are not ready to settle on substrate when they encounter a turtle, they will not colonize.
Third, individual turtle habitat use within foraging regions may influence colonization (Reich et al., 2010; Vander Zanden et al., 2010; Frick and Pfaller, 2013). Turtles forage on specific prey items (or a specific set of prey items) at foraging grounds (Vander Zanden et al., 2010; Nolte et al., 2020). Epibiosis likely occurs in part as a byproduct of foraging; epibionts may colonize from the water column or benthos as turtles search and maneuver for prey items (Frick and Pfaller, 2013). Both potential epibionts and prey items may be found in association with certain habitat types (i.e., mangroves, sea grass beds) in some regions, but not in others. This could be due to interspecific variation or habitat degradation (and associated declines in diversity; Reed and Hovel, 2006), among other reasons. Colonization cannot occur in certain foraging regions if potential epibionts and prey items are not sympatric where turtles seek out prey items. We cannot determine which of the above factors contributed to differences in meiofauna colonization between NGOM, EGOM, and SGOM foraging turtles with our available data. Nevertheless, our results indicate that epibionts can be informative to turtle spatial ecology, and vice-a-versa.
Differences between epibiont assemblages from turtles assigned to the same foraging region corresponded to differences in SIA values from those turtles (as per RELATE and BEST results). SIA values vary with location and foraging item preference (DeNiro and Epstein, 1978; Rubenstein and Hobson, 2004). Thus, differences in epibiont assemblages within foraging regions may reflect individual specialization in specific prey items or a specific combination of prey items (Vander Zanden et al., 2010; Nolte et al., 2020). Specializing in certain prey may require that turtles utilize specific foraging mechanisms, or frequent certain habitats, that then allow for differential colonization of epibionts. For example, loggerhead turtles that feed on benthic mollusks may dig for their prey, which can suspend benthic organisms that may colonize carapaces (Lazar et al., 2011). Loggerheads that graze on suspended fauna such as gastropods and chondrophores (Hatase et al., 2007) do not perturb sediment, and are colonized by a different suite of organisms. These turtles could exhibit different SIA values and epibiont assemblages, yet be present at the same foraging region. Further, turtles with preferences for specific prey items may have to frequent different habitat types to consume those items (Cardona et al., 2009; Williams et al., 2017). These habitats have their own invertebrate communities, which could contribute to unique colonization of loggerhead carapaces. Epibionts may provide insight into loggerhead turtle foraging preferences and habitat use within foraging regions, and future studies that explicitly relate foraging preferences and habitat use to epibiosis (as discussed below) will allow researchers to garner more information from the epibionts of nesting sea turtles.
Studies such as ours can be most informative by sampling a high proportion of nesting turtles from nesting assemblages, integrating epibiont analysis and SIA with satellite telemetry, and using molecular techniques to identify taxa. Our turtle sample size was representative for the 2018 nesting season at SGI (∼35–40% of nesting turtles; S.C. personal communication, Ceriani et al., 2019), but low relative to the average annual number of nesting turtles at SGI (I.S. unpublished data, Ceriani et al., 2019). Further, this low sample size mitigates the power of inferences that can be made using foraging region assignments. CPS and DF performed slightly differently, and subsequent analyses identified different relationships between epibionts and turtles assigned to foraging regions using the two techniques. It would be unreasonable to expect these methods to perform identically, but increasing sample size could mitigate the bias that slight differences in assignments between CPS and DF have on downstream analyses. Increasing sample size might also allow us to implement assignment probability thresholds for DF assignments (as per Wunder, 2012; Ceriani et al., 2014; Vander Zanden et al., 2014) if future samples have higher probabilities, which would increase certainty in assignments and in the relationships identified here between epibionts, inferred foraging regions, and SIA. Sampling additional turtles for epibionts and SIA would therefore allow us to be more confident in differences between and within inferred foraging regions, and integrating satellite telemetry with our epibiont analysis and SIA would reduce error in foraging ground assignments. However, these efforts would be costly and labor intensive and were beyond the scope of this study.
Molecular techniques such as sequencing of COI barcodes (Hebert et al., 2003) or 16s rRNA (Goetze, 2010) could help further identify epibiont taxa to species, populations, or operational taxonomic units. This could improve taxonomic resolution to demonstrate differences in the presence or abundance of certain common taxa between turtles between and within different foraging regions. This is particularly true for higher taxa identified to phyla or classes and for abundant taxa identified to species (i.e., skeleton shrimp). Certain families, genera, or species within the higher taxa identified here could differ between or within foraging regions, and skeleton shrimp and other common species may exhibit genetic population differences between foraging regions that are not apparent from morphological identification alone. Further, taxa such as diatoms are found ubiquitously on sea turtle carapaces (Robinson et al., 2016), and differ between loggerhead turtles sampled across broad geographic scales (van de Vijver et al., 2020). Diatoms might therefore discriminate between sea turtles at smaller scales, such as in this study. Improving taxonomic resolution and breadth in similar, future studies could render common epibiont taxa more informative toward sea turtle spatial and foraging ecology.
Sampling and identifying epibionts, especially small meiofauna, from nesting turtles provides promising insights into sea turtle foraging and spatial ecology, but our understanding of carapace colonization should be refined to develop and streamline these techniques. Sampling epibionts from mature turtles in-water at foraging grounds, although difficult, is necessary to establish baseline data for epibionts of turtles within foraging regions (Nolte et al., 2020). Observations of turtle foraging ecology, spatial ecology, and habitat use at foraging grounds (via isotopic mixing models, satellite transmitters and/or animal borne cameras, e.g., Thomson and Heithaus, 2014; Gillis et al., 2018; Hays and Hawkes, 2018) can be paired with epibiont identification to relate epibiosis to specific prey item selection, foraging mechanisms, and habitat use within foraging regions. This would allow studies of epibionts from nesting turtles to draw more specific inferences on the spatial and foraging ecology of individual turtles. Finally, sampling the benthos and water column for invertebrates at known turtle foraging locations at different times throughout the year can establish a baseline for potential colonizers and provide insight into the phenology of potential colonizers within foraging regions. These baseline data may be crucial to identifying epibiont species for future studies of nesting turtles that focus on determining the spatial and foraging ecology of individuals, without necessarily having to rely upon expensive techniques such as satellite telemetry. Nevertheless, our study has provided new foundations for studies to further explore the relationships between epibionts and sea turtle spatial and foraging ecology in the Gulf of Mexico and elsewhere.
Data Availability Statement
The raw data supporting the conclusions of this article will be made available by the authors as Supplementary Material, without undue reservation.
Ethics Statement
The animal study was reviewed and approved by the Florida State University Animal Care and Use Committee.
Author Contributions
IS-G, JI, MF, GS, YV, and SC conceived the project and designed methodology. IS-G, JI, GS, YV, LP, ACS, PFN, AS, DP, AR, SS-Z, LA, and AG contributed to epibiont collection, sorting, and identification. IS-G and JI analyzed epibiont data and led the writing of the manuscript. SC and AG generated stable isotope data. IS-G, SC, and MF analyzed stable isotope data. All authors contributed critically to the drafts and gave final approval for publication.
Funding
We thank the Florida Sea Turtle Specialty License Plate Grants Program (Grant # 18-021R) and the PADI Foundation (Grant # 33006) for funding this work.
Conflict of Interest
The authors declare that the research was conducted in the absence of any commercial or financial relationships that could be construed as a potential conflict of interest.
Acknowledgments
We thank Eric Laso-Wasem for assistance with epibiont identification. We thank all volunteers who conducted nesting surveys on St. George Island and/or assisted with epibiont sorting and identification: Matthew Aguiar, Hector Barrios-Garrido, Janice Becker, Quintin Bergman, Julia Danyuk, Emily Drobes, Andres de la Fe, Katherine Glibowski, Lindsay Hooper, Andrew Ibarra, Tayla Lovemore, Natalie Montero, Breanna Muszynski, Dylan Nusche, Carrie O’Reilly, Tara Wah, Matthew Ware, and Natalie Wildermann.
Supplementary Material
The Supplementary Material for this article can be found online at: https://www.frontiersin.org/articles/10.3389/fevo.2021.696412/full#supplementary-material
References
Anderson, M., Gorley, R., and Clarke, K. (2008). PERMANOVA+ for PRIMER: Guide to Software and Statistical Methods. Plymouth: PRIMER-E Ltd, 214.
Bezerra, T. N., Decraemer, W., Eisendle-Flockner, U., Hodda, M., Holovachov, O., Leduc, D., et al. (2019). Nemys: World Database of Nematodes. doi: 10.14284/366 Available online at: http://nemys.ugent.be (accessed May 26, 2021).
Bolten, A. (2003). “Variation in sea turtle life history patterns,” in The Biology of Sea Turtles, 243–257. doi: 10.1201/9781420040807.ch9
Botton, M. L. (2009). “The ecological importance of horseshoe crabs in estuarine and coastal communities: a review and speculative summary,” in Biology and Conservation of Horseshoe Crabs, eds J. Tanacredi, M. Botton, and D. Smith (Boston, MA: Springer), 45–63. doi: 10.1007/978-0-387-89959-6_3
Broderick, A. C., Coyne, M. S., Fuller, W. J., Glen, F., and Godley, B. J. (2007). Fidelity and over-wintering of sea turtles. Proc. R. Soc. B Biol. Sci. 274, 1533–1538. doi: 10.1098/rspb.2007.0211
Cabezas, M. P., Navarro-Barranco, C., Ros, M., and Guerra-García, J. M. (2013). Long-distance dispersal, low connectivity and molecular evidence of a new cryptic species in the obligate rafter Caprella andreae Mayer, 1890 (Crustacea: amphipoda: caprellidae). Helgol. Mar. Res. 67, 483–497. doi: 10.1007/s10152-012-0337-9
Cardona, L., Revelles, M., Parga, M. L., Tomás, J., Aguilar, A., Alegre, F., et al. (2009). Habitat use by loggerhead sea turtles Caretta caretta off the coast of eastern Spain results in a high vulnerability to neritic fishing gear. Mar. Biol. 156, 2621–2630. doi: 10.1007/s00227-009-1288-9
Carr, A. (1987). New perspectives on the pelagic stage of sea turtle development. Conserv. Biol. 1, 103–121. doi: 10.1111/j.1523-1739.1987.tb00020.x
Casale, P., and Tucker, A. D. (2017). Caretta caretta (amended version of 2015 assessment). IUCN Red List Threat. Species 2017:e.T3897A119333622. doi: 10.2305/IUCN.UK.2017-2.RLTS.T3897A119333622.en
Ceriani, S. A., Casale, P., Brost, M., Leone, E. H., and Witherington, B. E. (2019). Conservation implications of sea turtle nesting trends: elusive recovery of a globally important loggerhead population. Ecosphere 10:e02936. doi: 10.1002/ecs2.2936
Ceriani, S. A., Roth, J. D., Evans, D. R., Weishampel, J. F., and Ehrhart, L. M. (2012). Inferring foraging areas of nesting loggerhead turtles using satellite telemetry and stable isotopes. PLoS One 7:e45335. doi: 10.1371/journal.pone.0045335
Ceriani, S. A., Roth, J. D., Sasso, C. R., McClellan, C. M., James, M. C., Haas, H. L., et al. (2014). Modeling and mapping isotopic patterns in the Northwest Atlantic derived from loggerhead sea turtles. Ecosphere 5:art122. doi: 10.1890/ES14-00230.1
Ceriani, S. A., Weishampel, J. F., Ehrhart, L. M., Mansfield, K. L., and Wunder, M. B. (2017). Foraging and recruitment hotspot dynamics for the largest Atlantic loggerhead turtle rookery. Sci. Rep. 7:16894. doi: 10.1038/s41598-017-17206-3
Clarke, K. R., and Gorley, R. N. (2015). Getting Started with PRIMER v7: Plymouth Routines In Multivariate Ecological Research. Plymouth: PRIMER-E Ltd. Available online at: www.primer-e.com (accessed September 29, 2020).
Cohen, J. A., and Brockmann, H. J. (1983). Breeding activity and mate selection in the horseshoe crab, Limulus polyphemus (Seahorse Key, Florida). Bull. Mar. Sci. 33, 274–281.
Corrêa, G. V. V., Ingels, J., Valdes, Y. V., Fonsêca-Genevois, V. G., Farrapeira, C. M. R., and Santos, G. A. P. (2014). Diversity and composition of macro- and meiofaunal carapace epibionts of the hawksbill sea turtle (Eretmochelys imbricata Linnaeus, 1822) in Atlantic waters. Mar. Biodivers. 44, 391–401. doi: 10.1007/s12526-013-0189-9
Culter, J. K. (1986). Manual for Idententification of Marine Invertebrates. A Guide to Some Common Estuarine Macroinvertebrates of Big Bend, Tampa Bay, Florida. Washington, D.C: U.S. Environmental Protection Agency, 1–196.
DeNiro, M. J., and Epstein, S. (1978). Influence of diet on the distribution of carbon isotopes in animals. Geochim. Cosmochim. Acta 42, 495–506. doi: 10.1016/0016-7037(78)90199-0
dos Santos, G. A. P., Corrêa, G. V. V., Valdes, Y., Apolônio Silva de Oliveira, D., Fonsêca-Genevois, V. G., Silva, A. C., et al. (2018). Eretmochelys imbricata shells present a dynamic substrate for a facilitative epibiont relationship between macrofauna richness and nematode diversity, structure and function. J. Exp. Mar. Bio. Ecol. 502, 153–163. doi: 10.1016/j.jembe.2017.08.009
Fauchald, K. (1977). The polychaete worms. definitions and keys to the orders, families and genera. Sci. Ser. 28:188.
FFWCC (2016). Marine Turtle Conservation Handbook. Tallahassee, FL: Florida Fish and Wildlife Conservation Commission.
FFWCC (2020). State Nesting Beach Survey. Tallahassee, FL: Florida Fish and Wildlife Conservation Commission.
Frick, M. G., and Pfaller, J. B. (2013). “Sea turtle epibiosis,” in The Biology of Sea Turtles, eds J. Wyneken, K. J. Lohmann, and J. A. Musick (Boca Raton, FL: CRC Press), 399–426. doi: 10.1201/b13895
Fuentes, M. M. P. B., Gillis, A. J., Ceriani, S. A., Guttridge, T. L., Van, M. P. M., Bergmann, Z., et al. (2019). Informing marine protected areas in Bimini, Bahamas by considering hotspots for green turtles (Chelonia mydas). Biodivers. Conserv. 28, 197–211. doi: 10.1007/s10531-018-1647-2
Fuentes, M. M. P. B., Wildermann, N., Gandra, T. B. R., and Domit, C. (2020). Cumulative threats to juvenile green turtles in the coastal waters of southern and southeastern Brazil. Biodivers. Conserv. 29, 1783–1803. doi: 10.1007/s10531-020-01964-0
Giere, O. (2009). Meiobenthology: The Microscopic Motile Fauna of Aquatic Sediments, 2nd Edn. Berlin: Springer Berlin Heidelberg. doi: 10.1007/978-3-540-68661-3_1
Gillis, A., Ceriani, S., Seminoff, J. A., and Fuentes, M. M. P. B. (2018). Undefined Foraging Ecology and Diet Selection of Juvenile Green Turtles in the Bahamas: Insights From Stable Isotope Analysis and Prey Mapping. Int-res.com. Available online at: https://www.int-res.com/abstracts/meps/v599/p225-238 (accessed March 17, 2021).
Goetze, E. (2010). Species discovery in marine planktonic invertebrates through global molecular screening. Mol. Ecol. 19, 952–967. doi: 10.1111/j.1365-294X.2009.04520.x
Gredzens, C., Marsh, H., Fuentes, M. M. P. B., Limpus, C. J., Shimada, T., and Hamann, M. (2014). Satellite tracking of sympatric marine megafauna can inform the biological basis for species co-management. PLoS One 9:e98944. doi: 10.1371/journal.pone.0098944
Hamann, M., Godfrey, M. H., Seminoff, J. A., Arthur, K., Barata, P. C. R., Bjorndal, K. A., et al. (2010). Global research priorities for sea turtles: informing management and conservation in the 21st century. Endanger. Species Res. 11, 245–269. doi: 10.3354/esr00279
Hardy, R. F., Tucker, A. D., Foley, A. M., Schroeder, B. A., Giove, R. J., and Meylan, A. B. (2014). Spatiotemporal occurrence of loggerhead turtles (Caretta caretta) on the west Florida shelf and apparent overlap with a commercial fishery. Can. J. Fish. Aquat. Sci. 71, 1924–1933. doi: 10.1139/cjfas-2014-0128
Hart, K. M., Guzy, J. C., and Smith, B. J. (2021). Drivers of realized satellite tracking duration in marine turtles. Mov. Ecol. 9, 1–14. doi: 10.1186/s40462-020-00237-3
Hart, K. M., Iverson, A. R., Fujisaki, I., Lamont, M. M., Bucklin, D., and Shaver, D. J. (2018). Marine threats overlap key foraging habitat for two imperiled sea turtle species in the Gulf of Mexico. Front. Mar. Sci. 5. doi: 10.3389/fmars.2018.00336
Hart, K. M., Lamont, M. M., Fujisaki, I., Tucker, A. D., and Carthy, R. R. (2012). Common coastal foraging areas for loggerheads in the Gulf of Mexico: opportunities for marine conservation. Biol. Conserv. 145, 185–194. doi: 10.1016/j.biocon.2011.10.030
Hart, K. M., Lamont, M. M., Iverson, A. R., and Smith, B. J. (2020). The importance of the Northeastern Gulf of Mexico to foraging loggerhead sea turtles. Front. Mar. Sci. 7:330. doi: 10.3389/fmars.2020.00330
Hart, K. M., Lamont, M. M., Sartain, A. R., and Fujisaki, I. (2014). Migration, foraging, and residency patterns for northern gulf loggerheads: implications of local threats and international movements. PLoS One 9:e103453. doi: 10.1371/journal.pone.0103453
Hatase, H., Omuta, K., and Tsukamoto, K. (2007). Bottom or midwater: alternative foraging behaviours in adult female loggerhead sea turtles. J. Zool. 273, 46–55. doi: 10.1111/j.1469-7998.2007.00298.x
Hawkes, L. A., Broderick, A. C., Coyne, M. S., Godfrey, M. H., Lopez-Jurado, L. F., Lopez-Suarez, P., et al. (2006). Phenotypically linked dichotomy in sea turtle foraging requires multiple conservation approaches. Curr. Biol. 16, 990–995. doi: 10.1016/j.cub.2006.03.063
Hays, G. C., and Hawkes, L. A. (2018). Satellite tracking sea turtles: opportunities and challenges to address key questions. Front. Mar. Sci. 5:432. doi: 10.3389/fmars.2018.00432
Hebert, P. D. N., Cywinska, A., Ball, S. L., and DeWaard, J. R. (2003). Biological identifications through DNA barcodes. Proc. R. Soc. B Biol. Sci. 270, 313–321. doi: 10.1098/rspb.2002.2218
Higgins, R. P., and Thiel, H. (1988). Introduction to the Study of Meiofauna. London: Smithsonian Institution Press, doi: 10.2307/3226350
Houghton, J. D. R., Broderick, A. C., Godley, B. J., Metcalfe, J. D., and Hays, G. C. (2002). Diving behaviour during the internesting interval for loggerhead turtles Caretta caretta nesting in Cyprus. Mar. Ecol. Prog. Ser. 227, 63–70. doi: 10.3354/meps227063
Ingels, J., Valdes, Y., Pontes, L. P., Silva, A. C., Neres, P. F., Corrêa, G. V. V., et al. (2020). Meiofauna life on loggerhead sea turtles-diversely structured abundance and biodiversity hotspots that challenge the meiofauna paradox. Diversity 12:203. doi: 10.3390/D12050203
Jeffers, V. F., and Godley, B. J. (2016). Satellite tracking in sea turtles: how do we find our way to the conservation dividends? Biol. Conserv. 199, 172–184. doi: 10.1016/j.biocon.2016.04.032
Kelly, J. F., Ruego, K. C., and Smith, T. B. (2005). Combining isotopic and genetic markers to identify breeding origins of migrant birds. Ecol. Appl. 15, 1487–1494. doi: 10.1890/04-1704
Lazar, B., Gracan, R., Katic, J., Zavodnik, D., Jaklin, A., and Tvrtkovic, N. (2011). Loggerhead sea turtles (Caretta caretta) as bioturbators in neritic habitats: an insight through the analysis of benthic molluscs in the diet. Mar. Ecol. 32, 65–74. doi: 10.1111/j.1439-0485.2010.00402.x
Lemons, G., Lewison, R., Komoroske, L., Gaos, A. R., Lai, C., Dutton, P., et al. (2011). Undefined Trophic Ecology of Green Sea Turtles in a Highly Urbanized Bay: Insights From Stable Isotopes and Mixing Models. Elsevier. Available online at: https://www.sciencedirect.com/science/article/pii/S0022098111002279 (accessed March 17, 2021).
Levin, L. A., and Currin, C. (2012). Stable Isotope Protocols: Sampling and Sample Processing. La Jolla, CA. Available online at: https://escholarship.org/uc/item/3jw2v1hh (accessed March 17, 2021).
López-Castro, M. C., Bjorndal, K. A., Kamenov, G. D., and Bolten, A. B. (2014). Identifying oceanic foraging grounds of sea turtles in the Atlantic using lead isotopes. Mar. Biol. 161, 2269–2278. doi: 10.1007/s00227-014-2504-9
Mansfield, K. L., Wyneken, J., Porter, W. P., and Luo, J. (2014). First satellite tracks of neonate sea turtles redefine the “lost years” oceanic niche. Proc. R. Soc. B Biol. Sci. 281:20133039. doi: 10.1098/rspb.2013.3039
Mazor, T., Beger, M., Mcgowan, J., Possingham, H. P., and Kark, S. (2016). The value of migration information for conservation prioritization of sea turtles in the Mediterranean. Glob. Ecol. Biogeogr. 25, 540–552. doi: 10.1111/geb.12434
Nolte, C. R., Pfaff, M. C., de Lecea, A. M., le Gouvello, D., and Nel, R. (2020). Stable isotopes and epibiont communities reveal foraging habitats of nesting loggerhead turtles in the South West Indian Ocean. Mar. Biol. 167:162. doi: 10.1007/s00227-020-03767-x
Pearson, R. M., van de Merwe, J. P., Gagan, M. K., Limpus, C. J., and Connolly, R. M. (2019). Distinguishing between sea turtle foraging areas using stable isotopes from commensal barnacle shells. Sci. Rep. 9:6565. doi: 10.1038/s41598-019-42983-4
Platt, H., and Warwick, R. (1983). Freeliving Marine Nematodes. Part 1: British Enoplids. Pictorial Key to World Genera and Notes for the Identification of British Species. Available online at: https://www.cabdirect.org/cabdirect/abstract/19840813084 (accessed January 13, 2021).
Plotkin, P., Lutz, P. L., Musick, J. A., and Wyneken, J. (2002). Adult migrations and habitat use. Biol. Sea Turtles 2, 225–241.
Reed, B. J., and Hovel, K. A. (2006). Seagrass habitat disturbance: how loss and fragmentation of eelgrass Zostera marina influences epifaunal abundance and diversity. Mar. Ecol. Prog. Ser. 326, 133–143. doi: 10.3354/meps326133
Rees, A. F., Alfaro-Shigueto, J., Barata, P. C. R., Bjorndal, K. A., Bolten, A. B., Bourjea, J., et al. (2016). Are we working towards global research priorities for management and conservation of sea turtles? Endanger. Species Res. 31, 337–382. doi: 10.3354/esr00801
Reeves, D. B., Chesney, E. J., Munnelly, R. T., and Baltz, D. M. (2018). Barnacle settlement and growth at oil and gas platforms in the northern Gulf of Mexico. Mar. Ecol. Prog. Ser. 590, 131–143. doi: 10.3354/meps12468
Reich, K. J., Bjorndal, K. A., and Bolten, A. B. (2007). The “lost years” of green turtles: using stable isotopes to study cryptic lifestages. Biol. Lett. 3, 712–714. doi: 10.1098/rsbl.2007.0394
Reich, K. J., Bjorndal, K. A., Frick, M. G., Witherington, B. E., Johnson, C., and Bolten, A. B. (2010). Polymodal foraging in adult female loggerheads (Caretta caretta). Mar. Biol. 157, 113–121. doi: 10.1007/s00227-009-1300-4
Robinson, N. J., Majewska, R., Lazo-Wasem, E. A., Nel, R., Paladino, F. V., Rojas, L., et al. (2016). Epibiotic diatoms are universally present on all sea turtle species. PLoS One 11:e0157011. doi: 10.1371/journal.pone.0157011
Rubenstein, D. R., and Hobson, K. A. (2004). From birds to butterflies: animal movement patterns and stable isotopes. Trends Ecol. Evol. 19, 256–263. doi: 10.1016/j.tree.2004.03.017
Rudloe, A. (1980). The breeding behavior and patterns of movement of horseshoe crabs, Limulus polyphemus, in the vicinity of breeding beaches in Apalachee Bay, Florida. Estuaries 3, 177–183. doi: 10.2307/1352067
Seney, E. E., and Musick, J. A. (2007). Historical diet analysis of loggerhead sea turtles (Caretta caretta) in Virginia. Copeia 2007, 478–489.
Shamblin, B. M., Bolten, A. B., Bjorndal, K. A., Dutton, P. H., Nielsen, J. T., Abreu-Grobois, F. A., et al. (2012). Expanded mitochondrial control region sequences increase resolution of stock structure among North Atlantic loggerhead turtle rookeries. Mar. Ecol. Prog. Ser. 469, 145–160. doi: 10.3354/meps09980
Shillinger, G. L., Palacios, D. M., Bailey, H., Bograd, S. J., Swithenbank, A. M., Gaspar, P., et al. (2008). Persistent leatherback turtle migrations present opportunities for conservation. PLoS Biol. 6:1408–1416. doi: 10.1371/journal.pbio.0060171
Szymanski, M. L., Afton, A. D., and Hobson, K. A. (2007). Use of stable isotope methodology to determine natal origins of mallards at a fine scale within the Upper Midwest. J. Wildl. Manage. 71, 1317–1324. doi: 10.2193/2006-188
Ten, S., Pascual, L., Pérez-Gabaldón, M. I., Tomás, J., Domènech, F., and Aznar, F. J. (2019). Epibiotic barnacles of sea turtles as indicators of habitat use and fishery interactions: an analysis of juvenile loggerhead sea turtles, Caretta caretta, in the western Mediterranean. Ecol. Indic. 107:105672. doi: 10.1016/j.ecolind.2019.105672
Thiel, M. (2003). “Rafting of benthic macrofauna: important factors determining the temporal succession of the assemblage on detached macroalgae,” in Migrations and Dispersal of Marine Organisms, eds M. B. Jones, A. Ingólfsson, E. Ólafsson, G. V. Helgason, K. Gunnarsson, and J. Svavarsson (Dordrecht: Springer), 49–57. doi: 10.1007/978-94-017-2276-6_7
Thomson, J. A., and Heithaus, M. R. (2014). Animal-borne video reveals seasonal activity patterns of green sea turtles and the importance of accounting for capture stress in short-term biologging. J. Exp. Mar. Bio. Ecol. 450, 15–20. doi: 10.1016/j.jembe.2013.10.020
van de Vijver, B., Robert, K., Majewska, R., Frankovich, T. A., Panagopoulou, A., and Bosak, S. (2020). Geographical variation in the diatom communities associated with loggerhead sea turtles (Caretta caretta). PLoS One 15:e0236513. doi: 10.1371/journal.pone.0236513
Vander Zanden, H. B., Bjorndal, K. A., Reich, K. J., and Bolten, A. B. (2010). Individual specialists in a generalist population: results from a long-term stable isotope series. Biol. Lett. 6, 711–714. doi: 10.1098/rsbl.2010.0124
Vander Zanden, H. B., Bolten, A. B., Tucker, A. D., Hart, K. M., Lamont, M. M., Fujisaki, I., et al. (2016). Biomarkers reveal sea turtles remained in oiled areas following the Deepwater Horizon oil spill. Ecol. Appl. 26, 2145–2155. doi: 10.1002/eap.1366
Vander Zanden, H. B., Tucker, A. D., Bolten, A. B., Reich, K. J., and Bjorndal, K. A. (2014). Stable isotopic comparison between loggerhead sea turtle tissues. Rapid Commun. Mass Spectrom. 28, 2059–2064. doi: 10.1002/rcm.6995
Vander Zanden, H. B., Tucker, A. D., Hart, K. M., Lamont, M. M., Fujisaki, I., Addison, D. S., et al. (2015). Determining origin in a migratory marine vertebrate: a novel method to integrate stable isotopes and satellite tracking. Ecol. Appl. 25, 320–335. doi: 10.1890/14-0581.1
Wahl, M. (2009). “Epibiosis,” in Marine Hard Bottom Communities, ed. M. Wahl (Berlin: Springer-Verlag), 61–72. doi: 10.1007/b76710_4
Wallace, B. P., Lewison, R. L., Mcdonald, S. L., Mcdonald, R. K., Kot, C. Y., Kelez, S., et al. (2010). Global patterns of marine turtle bycatch. Conserv. Lett. 3, 131–142. doi: 10.1111/j.1755-263X.2010.00105.x
Williams, J. L., Pierce, S. J., Rohner, C. A., Fuentes, M. M. P. B., and Hamann, M. (2017). Spatial distribution and residency of green and loggerhead sea turtles using coastal reef habitats in Southern Mozambique. Front. Mar. Sci. 3:288. doi: 10.3389/FMARS.2016.00288
Keywords: epibiont, foraging, Gulf of Mexico, isotopes, macrofauna, meiofauna, nematode, loggerhead sea turtle
Citation: Silver-Gorges I, Ingels J, dos Santos GAP, Valdes Y, Pontes LP, Silva AC, Neres PF, Shantharam A, Perry D, Richterkessing A, Sanchez-Zarate S, Acevedo L, Gillis AJ, Ceriani SA and Fuentes MMPB (2021) Epibionts Reflect Spatial and Foraging Ecology of Gulf of Mexico Loggerhead Turtles (Caretta caretta). Front. Ecol. Evol. 9:696412. doi: 10.3389/fevo.2021.696412
Received: 16 April 2021; Accepted: 24 May 2021;
Published: 02 July 2021.
Edited by:
Roksana Majewska, North-West University, South AfricaReviewed by:
Kristen Marie Hart, United States Geological Survey (USGS), United StatesLesley W. Stokes, Southeast Fisheries Science Center (NOAA), United States
Copyright © 2021 Silver-Gorges, Ingels, dos Santos, Valdes, Pontes, Silva, Neres, Shantharam, Perry, Richterkessing, Sanchez-Zarate, Acevedo, Gillis, Ceriani and Fuentes. This is an open-access article distributed under the terms of the Creative Commons Attribution License (CC BY). The use, distribution or reproduction in other forums is permitted, provided the original author(s) and the copyright owner(s) are credited and that the original publication in this journal is cited, in accordance with accepted academic practice. No use, distribution or reproduction is permitted which does not comply with these terms.
*Correspondence: Ian Silver-Gorges, ims19c@my.fsu.edu