 Katherine Berthon
 Sebastian T. Meyer
 Freya Thomas1
 Sarah Bekessy
- 1Interdisciplinary Conservation Science Group, Global Urban and Social Studies, RMIT University, Melbourne, VIC, Australia
- 2Terrestrial Ecology Research Group, Department of Ecology and Ecosystem Management, School of Life Sciences, Technical University of Munich, Freising, Germany
The ability of insects to persist in urban greenspace depends on their ability to usefully interact with available plant resources. Greenspace design influences plant–insect interactions by: (1) limiting the plant-species pool available for interaction through plant choice, (2) limiting the insects that are available for interaction through site-occupancy dynamics, and (3) mediating insect preferences based on the context of particular plant–insect interactions through structural barriers, microclimatic changes or competition. We designed an experiment to measure the effect of greenspace design attributes on site occupancy and insect preferences while keeping plant availability constant. Using a set of five functionally distinct flowering plant species (“phytometres”), we used occupancy-detection modelling to test factors affecting probability of visitation for eight groups of pollinating insects (ants, beetles, butterflies, bumblebees, honeybees, small bees, and hoverflies amend other flies) across 102 urban squares in Munich, Germany. We found that the probability of detecting an interaction was low for most functional groups, and situational factors, such as weather or competition from co-occurring flowers, were the primary drivers of visitation. Increasing the proportion of unsealed surfaces and quantity or diversity of flowers on the site had a positive influence on the probability of interaction, and, to a lesser extent, on probability of occupancy. Landscape connectivity and site area were important for only a few groups. Together, our results suggest that small-scale habitat conditions are more important than site context for influencing pollinator visitation. Designers can encourage interaction through contiguous provision of floral resources and unsealed surfaces while limiting internal barriers.
Introduction
With increasing concern about declines of biodiversity in rural and natural habitats (IPBES, 2019), urban green spaces are being increasingly investigated for their potential to provide habitat resources for wildlife (Garrard et al., 2018). While the process of urbanisation is well known to lead to habitat loss and species extinctions (Faeth et al., 2011), studies show that rare and threatened insect species can use urban habitats (Kadas, 2006; Jones and Leather, 2013). This has led to a focus on designing green space for the benefit of biodiversity and much research has been undertaken to understand which factors influence the persistence and maintenance of animals in urban green spaces [reviewed in Jones and Leather (2013) and Beninde et al. (2015)].
Of particular focus have been pollinators, whose charisma has won the hearts of many city dwellers, and for which floral resources can be readily provided even in small greenspace areas (Harrison and Winfree, 2015; Hall et al., 2017). Due to the consistent availability of floral resources, the abundance of pollinators in urban areas can be quite high (Lowenstein et al., 2014) but is mediated by landscape context (Steffan-Dewenter et al., 2002) and provision of appropriate nesting resources (Murray et al., 2009; Lowenstein et al., 2014; Theodorou et al., 2016). Urban areas may also offer refuge from the negative impacts of high pesticide use agricultural areas (Hall et al., 2017), but not all pollinators are able to take advantage of these abundant resources (Theodorou et al., 2020). For example, large-bodied beetles with low dispersal ability, and pollinators with more specialised diets are particularly susceptible to the negative impacts of urbanisation (Jones and Leather, 2013). For bees, it is small-bodied individuals, and open-flower specialists that decrease in abundance and richness in highly urbanised areas (Geslin et al., 2013). Loss of habitat, particularly nesting resources, still drives the decline of many species in urban areas (Theodorou et al., 2020) suggesting these abundant resources may not be appropriately catering for pollinator requirements.
Urbanisation not only influences the prevalence of pollinators in urban green spaces but may have flow-on effects for the structure and functioning of plant–pollinator interaction networks (Harrison and Winfree, 2015). As a result of high plant diversity, urban pollinators forage on a greater diversity of plant species compared to rural counterparts (Geslin et al., 2013; Jedrzejewska-Szmek and Zych, 2013), but are likely to forage on a smaller proportion of the total available plant species (Baldock et al., 2015). Fragmentation of urban habitats may disrupt dispersal between habitat patches and tends to favour species with small home ranges or high dispersal capacity (Jones and Leather, 2013; Hall et al., 2017). These changes to interaction patterns can influence provision of pollination services. For example, Pellissier et al. (2012) found lower pollination success in urban areas related to negative impacts of fragmentation on pollinator visitation. Similarly, a decrease in diversity of pollinators in urban gardens has been linked to decreased fruit and seed sets (Lowenstein et al., 2015).
Understanding the factors influencing changes in plant–pollinator interactions in urban greenspaces is useful for understanding how to enhance diversity and function of pollinators in newly created greenspaces (Harrison and Winfree, 2015; Daniels et al., 2020). Creation of greenspaces without consideration of these factors runs the risk of making functionally useless spaces for pollinators, either because they cannot or will not interact with them. In addition, it is through the interaction of plants and insects that many ecosystem services are achieved (e.g., pollination, pest control, and decomposition). Many insect species will not be present at a site without their specific plant hosts, nor plants without their specific pollinators (Bascompte and Jordano, 2007). It is thus a goal of urban green space design to create and maintain networks of interacting species for two reasons: ecosystem service provision and biodiversity conservation.
Different greenspace designs encourage different combinations of plant–insect interactions. For a given pollinator to successfully utilise green space resources, it must be able to persist on site or to disperse to it; the plants must provide a viable resource the pollinator can use; and the pollinator must choose to use those plant resources (Harrison and Winfree, 2015). Thus, green space design can influence plant–pollinator interactions via changes to plant availability, pollinator presence, or pollinator preferences (Figure 1). Presence of plants on site is directly influenced by plant choice and weed management by landscape designers. Presence of insects on site is affected by site design and landscape context (Mata et al., 2014; Threlfall et al., 2015; Threlfall et al., 2017) and may be modulated by retention or provision of habitat as a result of plant selection (e.g., presence of flowering plants, or nesting resources). Insects available on a site may also depend on the local species pool, which can be modified by historical land use changes (Alberti, 2015).
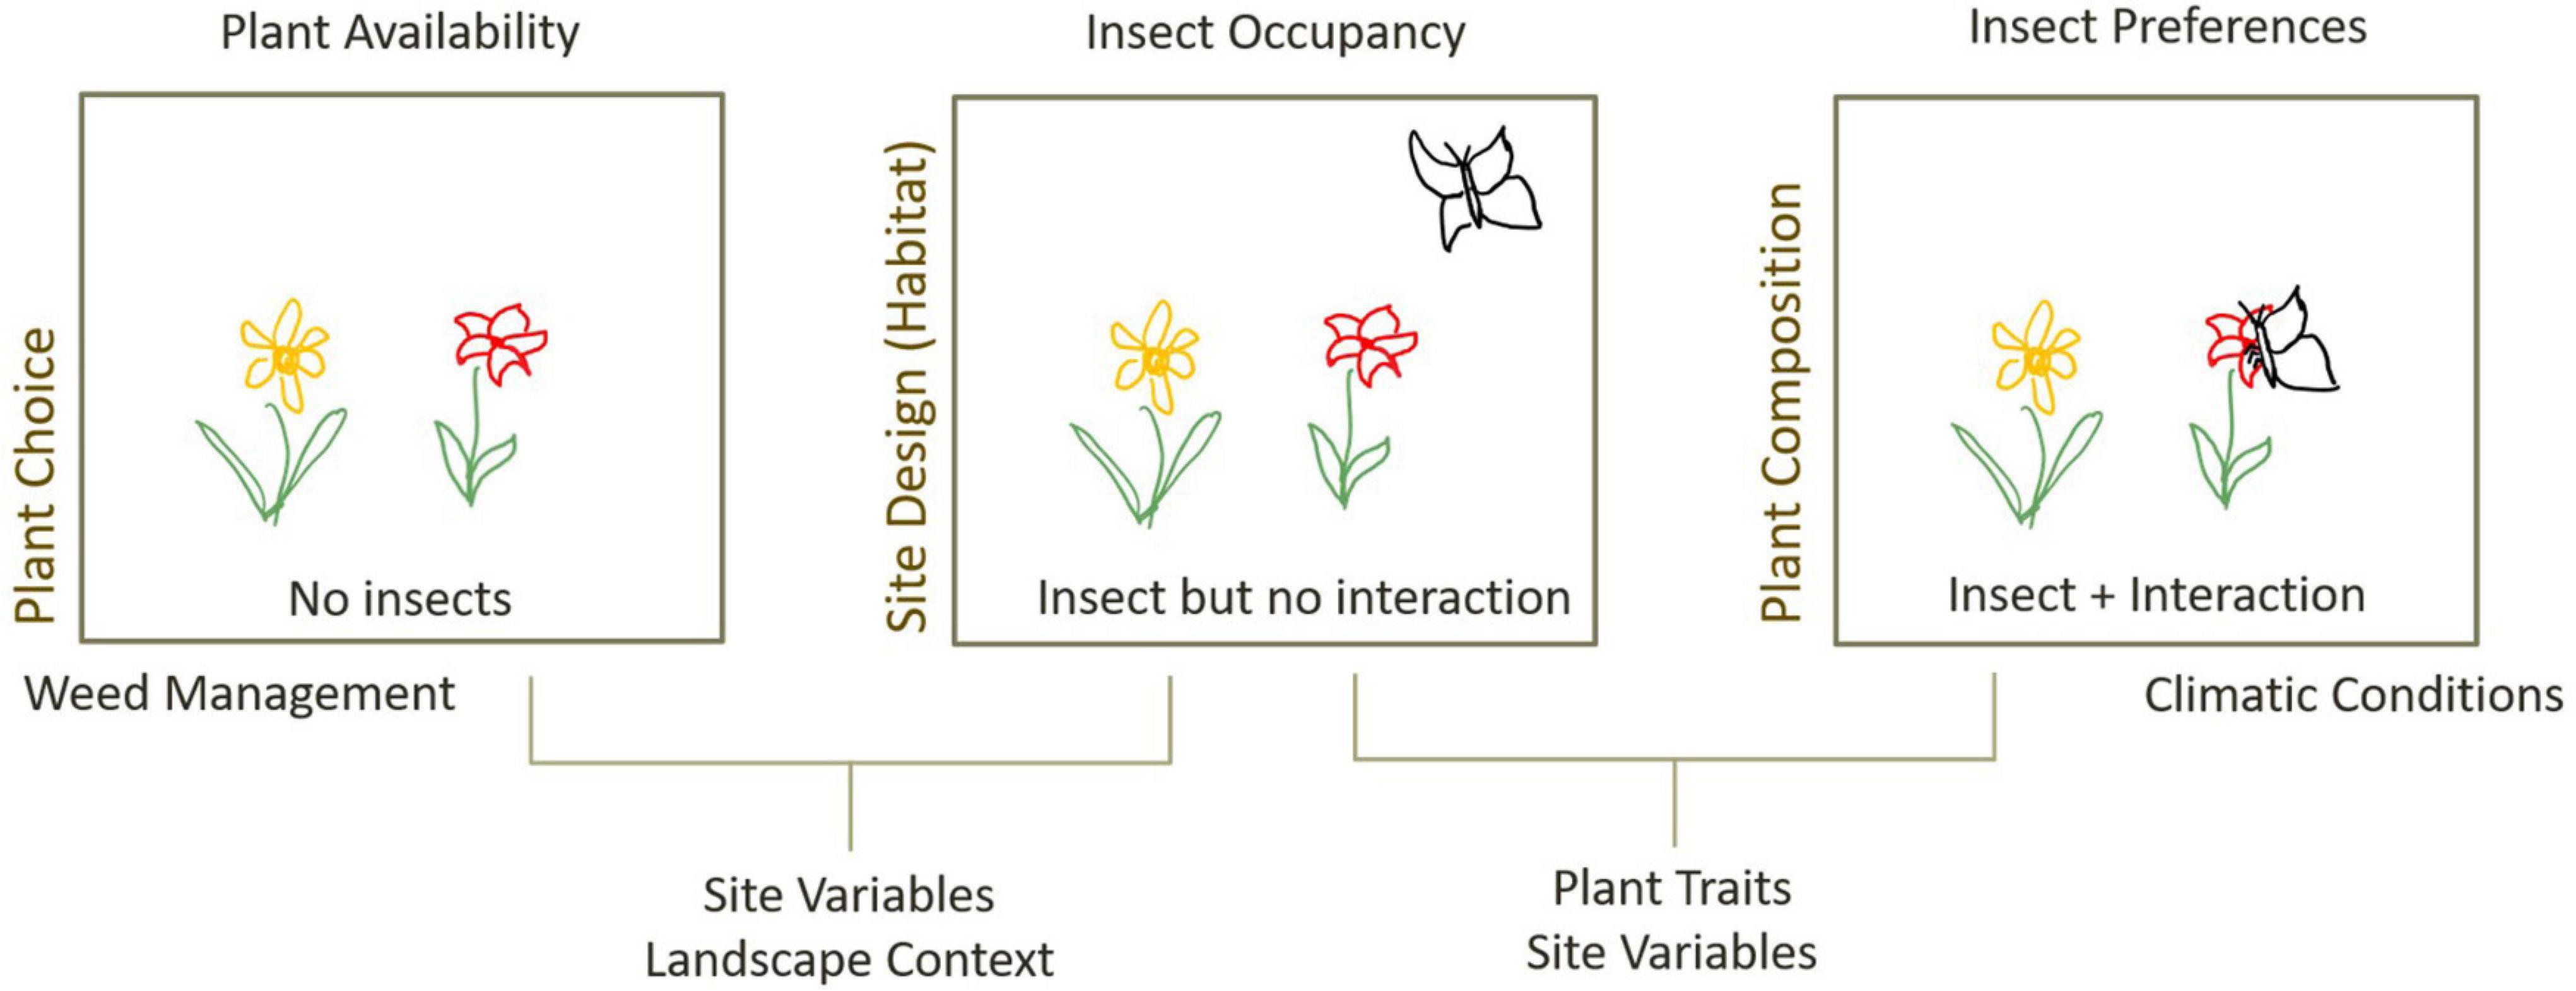
Figure 1. Processes influencing plant–insect interactions in urban greenspaces, and design interventions that can influence these processes (left-hand text). Greenspace design can influence the availability of plants and insects on a site, through plant choice, design and management practices. The presence of both insect and plant does not guarantee an interaction and is influenced by the match between plant traits and insect preferences but may also be mediated by site variables that affect internal movement patterns or competition for resources, as well as climatic conditions that influence insect activity.
The joint presence of a given insect and plant on a site does not guarantee an interaction will occur. The probability that a given plant and insect on site interact depends on the match between plant traits and insect requirements and may be modulated by relative competition from co-occurring plants (Lázaro and Totland, 2010; Hennig and Ghazoul, 2011) and other insects (Prendergast et al., 2021). Pollinator activity is also influenced by climatic conditions or microclimatic factors such as temperature or wind (Corbet et al., 1993; Inouye et al., 2015), that may be controlled for by careful design of shading or wind breaks. For example, direct radiation increases pollinator visitation (Clarke and Robert, 2018), and areas that are too shaded, or too cold may have lower visitation despite presence of abundant resources.
Teasing apart the different processes affecting plant–insect interactions is difficult due to the inherent variability of urban study sites such that no two sites are alike. This can be somewhat countered by high levels of site replication, but that is often difficult to achieve in highly urbanised areas (Mühlbauer et al., 2021). Alternatively, experimental approaches using plant “phytometres” can account for variation in plant availability and narrow the scope of study to only insect-dependent processes (Figure 1). Plant “phytometres” or “biomonitors” (Lower et al., 1997; Dietrich et al., 2013) involve the use of plants as tools to measure environmental changes, through monitoring changes in the plant traits or physiology. Phytometres are usually selected to control for traits of interest, including use of genetically identical clones when trying to understand influence of environmental variables on plant growth (Dietrich et al., 2013). This approach has been increasingly used to provide a constant flowering resource across sites to measure pollinator activity (Lowenstein et al., 2014), pollinator limitation (Williams and Winfree, 2013; Holt et al., 2014) and pollination services (Albrecht et al., 2007; Woodcock et al., 2014) in agricultural, rural and urban contexts (Supplementary Table 1).
Despite its increasing popularity, phytometre techniques have been underutilised in greenspace design contexts. Experimentation with different plant assemblages can be expensive and risky for local governments, and phytometre methods allow for temporary installation of plants to test hypotheses about insect community dynamics and resource preferences. For example, phytometres can be used to measure the activity and diversity of the pollinator community (e.g., Geslin et al., 2013) and relate visitation rates to landscape attributes (e.g., fragmentation, Hennig and Ghazoul, 2011) or functional outcomes, i.e., measures of fruit production (Pellissier et al., 2012), seed set (Albrecht et al., 2007), or other surrogates for pollination efficiency. Alternatively, phytometres can be used to measure changes in pollinator preferences and behaviour (Lázaro and Totland, 2010) in relation to changes in the plant community. This includes using network approaches to understand patterns of generalism, competition between co-occurring plant species, or changes to network structure (Geslin et al., 2013; Daniels et al., 2020).
Pollinator visitation, as measured on a phytometre, is actually the result of two processes: the presence or not of the insect on the site as a result of site and landscape context factors, and the preference for the insect to utilise phytometre resources in relation to the competitive environment and insect activity. Thus, there is some probability that you may not detect an insect on a phytometre despite its presence on a site. Detection probability is a central issue in observational approaches to plant–insect interactions, and drives space for time trade-offs for pollination ecology methods (Westphal et al., 2008). Not accounting for detection probability may lead to incorrect inferences about pollinator behaviour or site preferences (Guillera-Arroita et al., 2014), especially because resource use is a probabilistically driven event that relies on encountering a given resource (Lele et al., 2013). While a number of studies have used phytometres to compare pollinator diversity and abundance in relation to landscape (Hennig and Ghazoul, 2011; Pellissier et al., 2012; Lowenstein et al., 2014) and site attributes (Williams and Winfree, 2013; Theodorou et al., 2016), phytometre techniques have yet to be integrated with occupancy-detection modelling approaches.
Here, we use occupancy-detection modelling combined with a phytometre approach to investigate local and landscape factors influencing pollinator visitation in public squares of Munich. As in previous studies, we expect that pollinators will be more likely to exist on sites with highly diverse flowers, more nesting resources (Theodorou et al., 2016), and in locations with a greater proportion of surrounding greenspace (Hennig and Ghazoul, 2011). The probability we will observe an interaction will depend on the presence of the insect on the site but will be higher when there is greater insect activity, e.g., on sunny days with moderate temperatures, or areas with direct sunlight (Corbet et al., 1993; Inouye et al., 2015). Detection of an interaction will also depend on the preference of the insect to utilise phytometre resources in relation to the competitive environment (Lázaro and Totland, 2010; Hennig and Ghazoul, 2011), i.e., the diversity and abundance of other floral resources in the vicinity.
Materials and Methods
Study Sites
Study sites were located in public squares (“Plätze”) in Munich, the third largest city in Germany. There are over 800 public squares present across Munich. A subset of these public squares have been characterised and studied for the effect of structural and contextual attributes on bird diversity (Mühlbauer et al., 2021). Sites were selected that (i) had a formal name (so are a formally recognised unit in planning), and (ii) varied in their landscape context (e.g., distance from the city centre, and surrounding greenspace) and physical attributes (e.g., area, floral displays, shrub volume, tree diversity and abundance, unsealed surface proportion). Our study samples pollinator visitation across 102 of these sites.
Experimental Design
Temporary experimental plots consisting of five flowering plants (each of a different plant species) were used to generate an artificial but comparable plant community “phytometre” (Lower et al., 1997) across the 102 sites. This experimental approach was favoured over observing existing plant–pollinator networks because some squares contained no vegetation, and the large seasonality of flowering plants in Munich, including ongoing maintenance to change flower beds, meant that the same plants might not be able to be sampled more than once per square. Also, controlling for plant identity across squares allows for separation of the influence of structural attributes and presence of particular plant species.
The phytometre set consisted of five plant species (Table 1) representing different plant families and a variety of flower types to attract a wide breadth of pollinators. Plant species were chosen on the basis of their morphological features rather than their origin status (i.e., native or exotic) and were severely limited by commercial nursery availability. All plants included in the study were not historically present (i.e., are exotic) to the Munich region, but this was not by design. Combinations of flower shape and colour were chosen after reviewing the literature on pollination syndromes (Fenster et al., 2004; Faegri and Van Der Pijl, 2013), to offer attractive options to pollinators with different flower preferences. This is similar to pan trap approaches where varying colour is used to maximise the diversity of insects collected (Vrdoljak, 2012). Flower shape was varied such that half of the flowers contained either open (easily accessible floral resources) or tubular flowers (which select for insects with longer mouthparts), to attract pollinators with varied flower handling strategies (Geslin et al., 2013). Flower colour was then matched to these shapes according to expected pollinator preferences. Unfortunately, after the first round of sampling all individuals of one species (Lobularia maritima) were affected by weevil infestation and were no longer available as mature flowering plants in local nurseries. As phytometres were chosen using functional types, a replacement species was chosen within similar flower morphology (small, white, open flower) and expected pollinator compatibility.
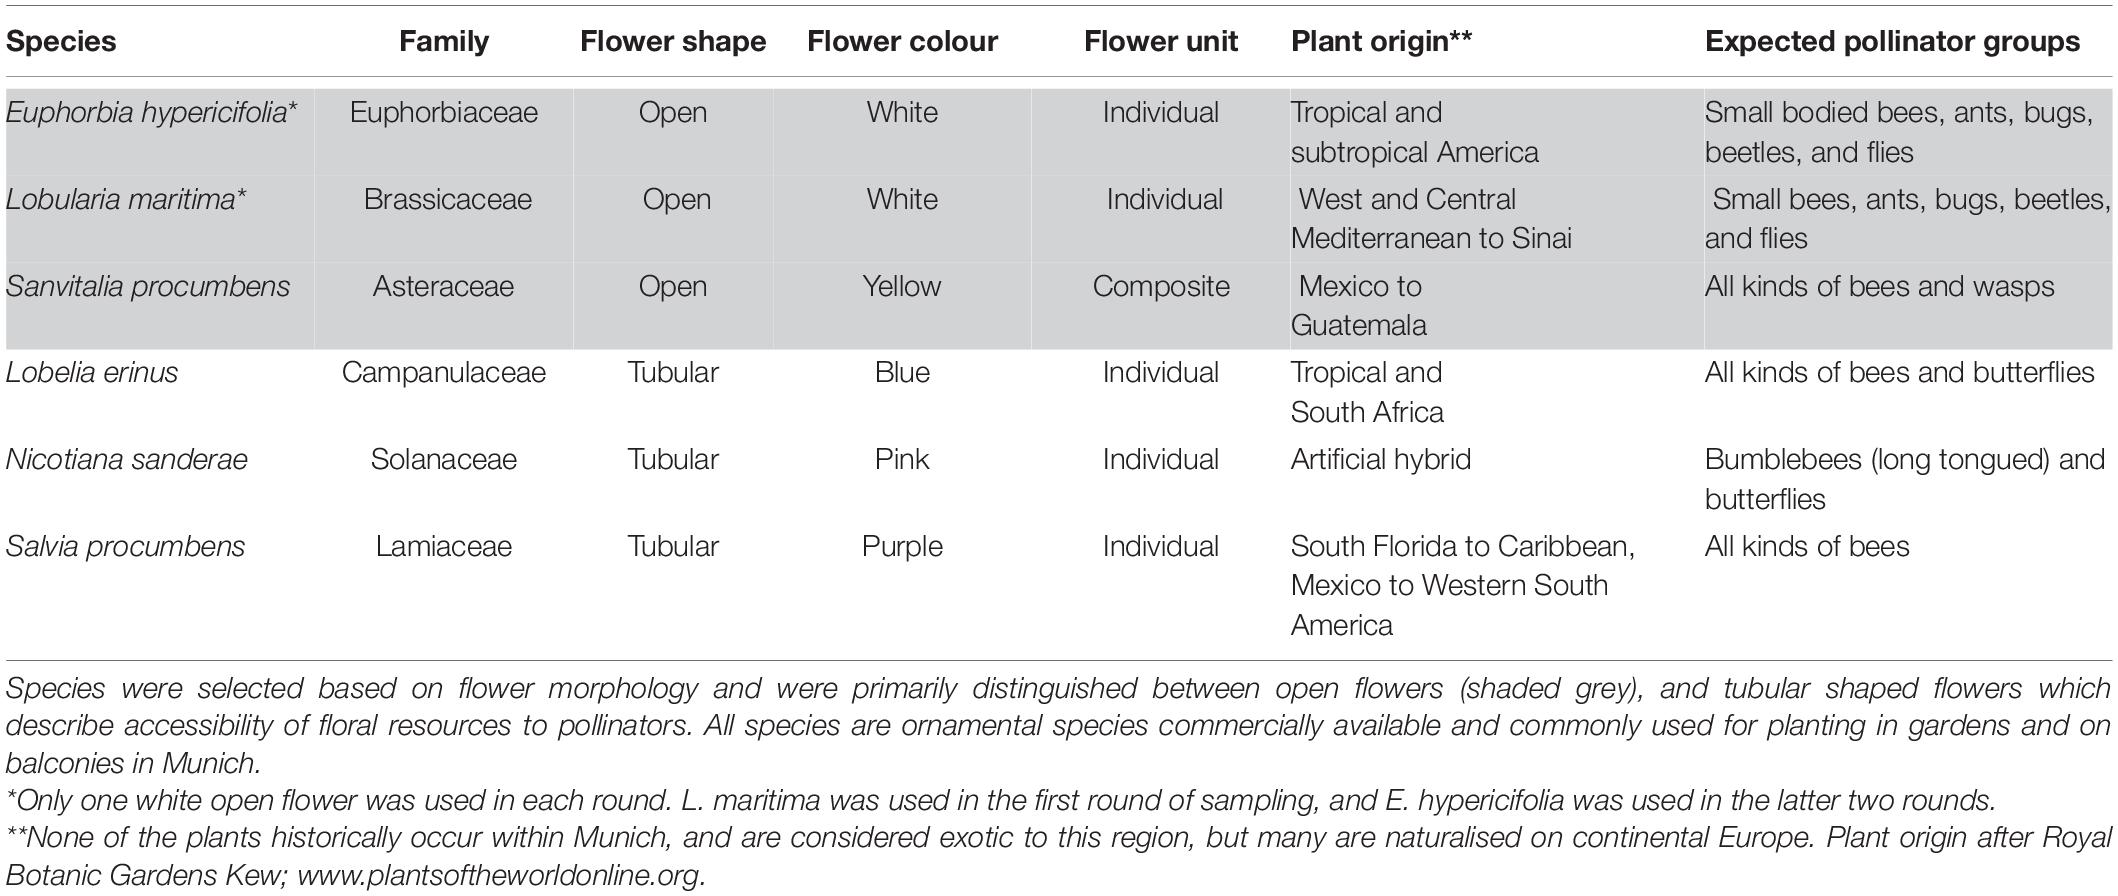
Table 1. Plant species selected as phytometres.
Due to the variation in floral form and shape, standardisation of floral resources per plant was difficult. Visual assessment of floral coverage was used in selection of plant individuals for use during a given sampling period with the goal of choosing healthy plants with newly open flowers. In all cases, the total number of distinct floral units was counted to account for variations in floral offering. These units were considered as the unit of attraction for a pollinator and varied per species, i.e., this consisted of individual flowers for large simple flowers like Nicotiana and Lobelia, composite flower heads for Sanvitalia, and single flowers on an inflorescence of Salvia, Lobularia, and Euphorbia.
Data Collection
All sites were sampled for pollinators on three occasions between May and July 2018 (approximately once per month over a period of 10 weeks). Plant phytometres were placed on the site in a straight row (Figure 2) in a random order, approximately 25 cm apart. Placement on the site was decided using the following placement rules:
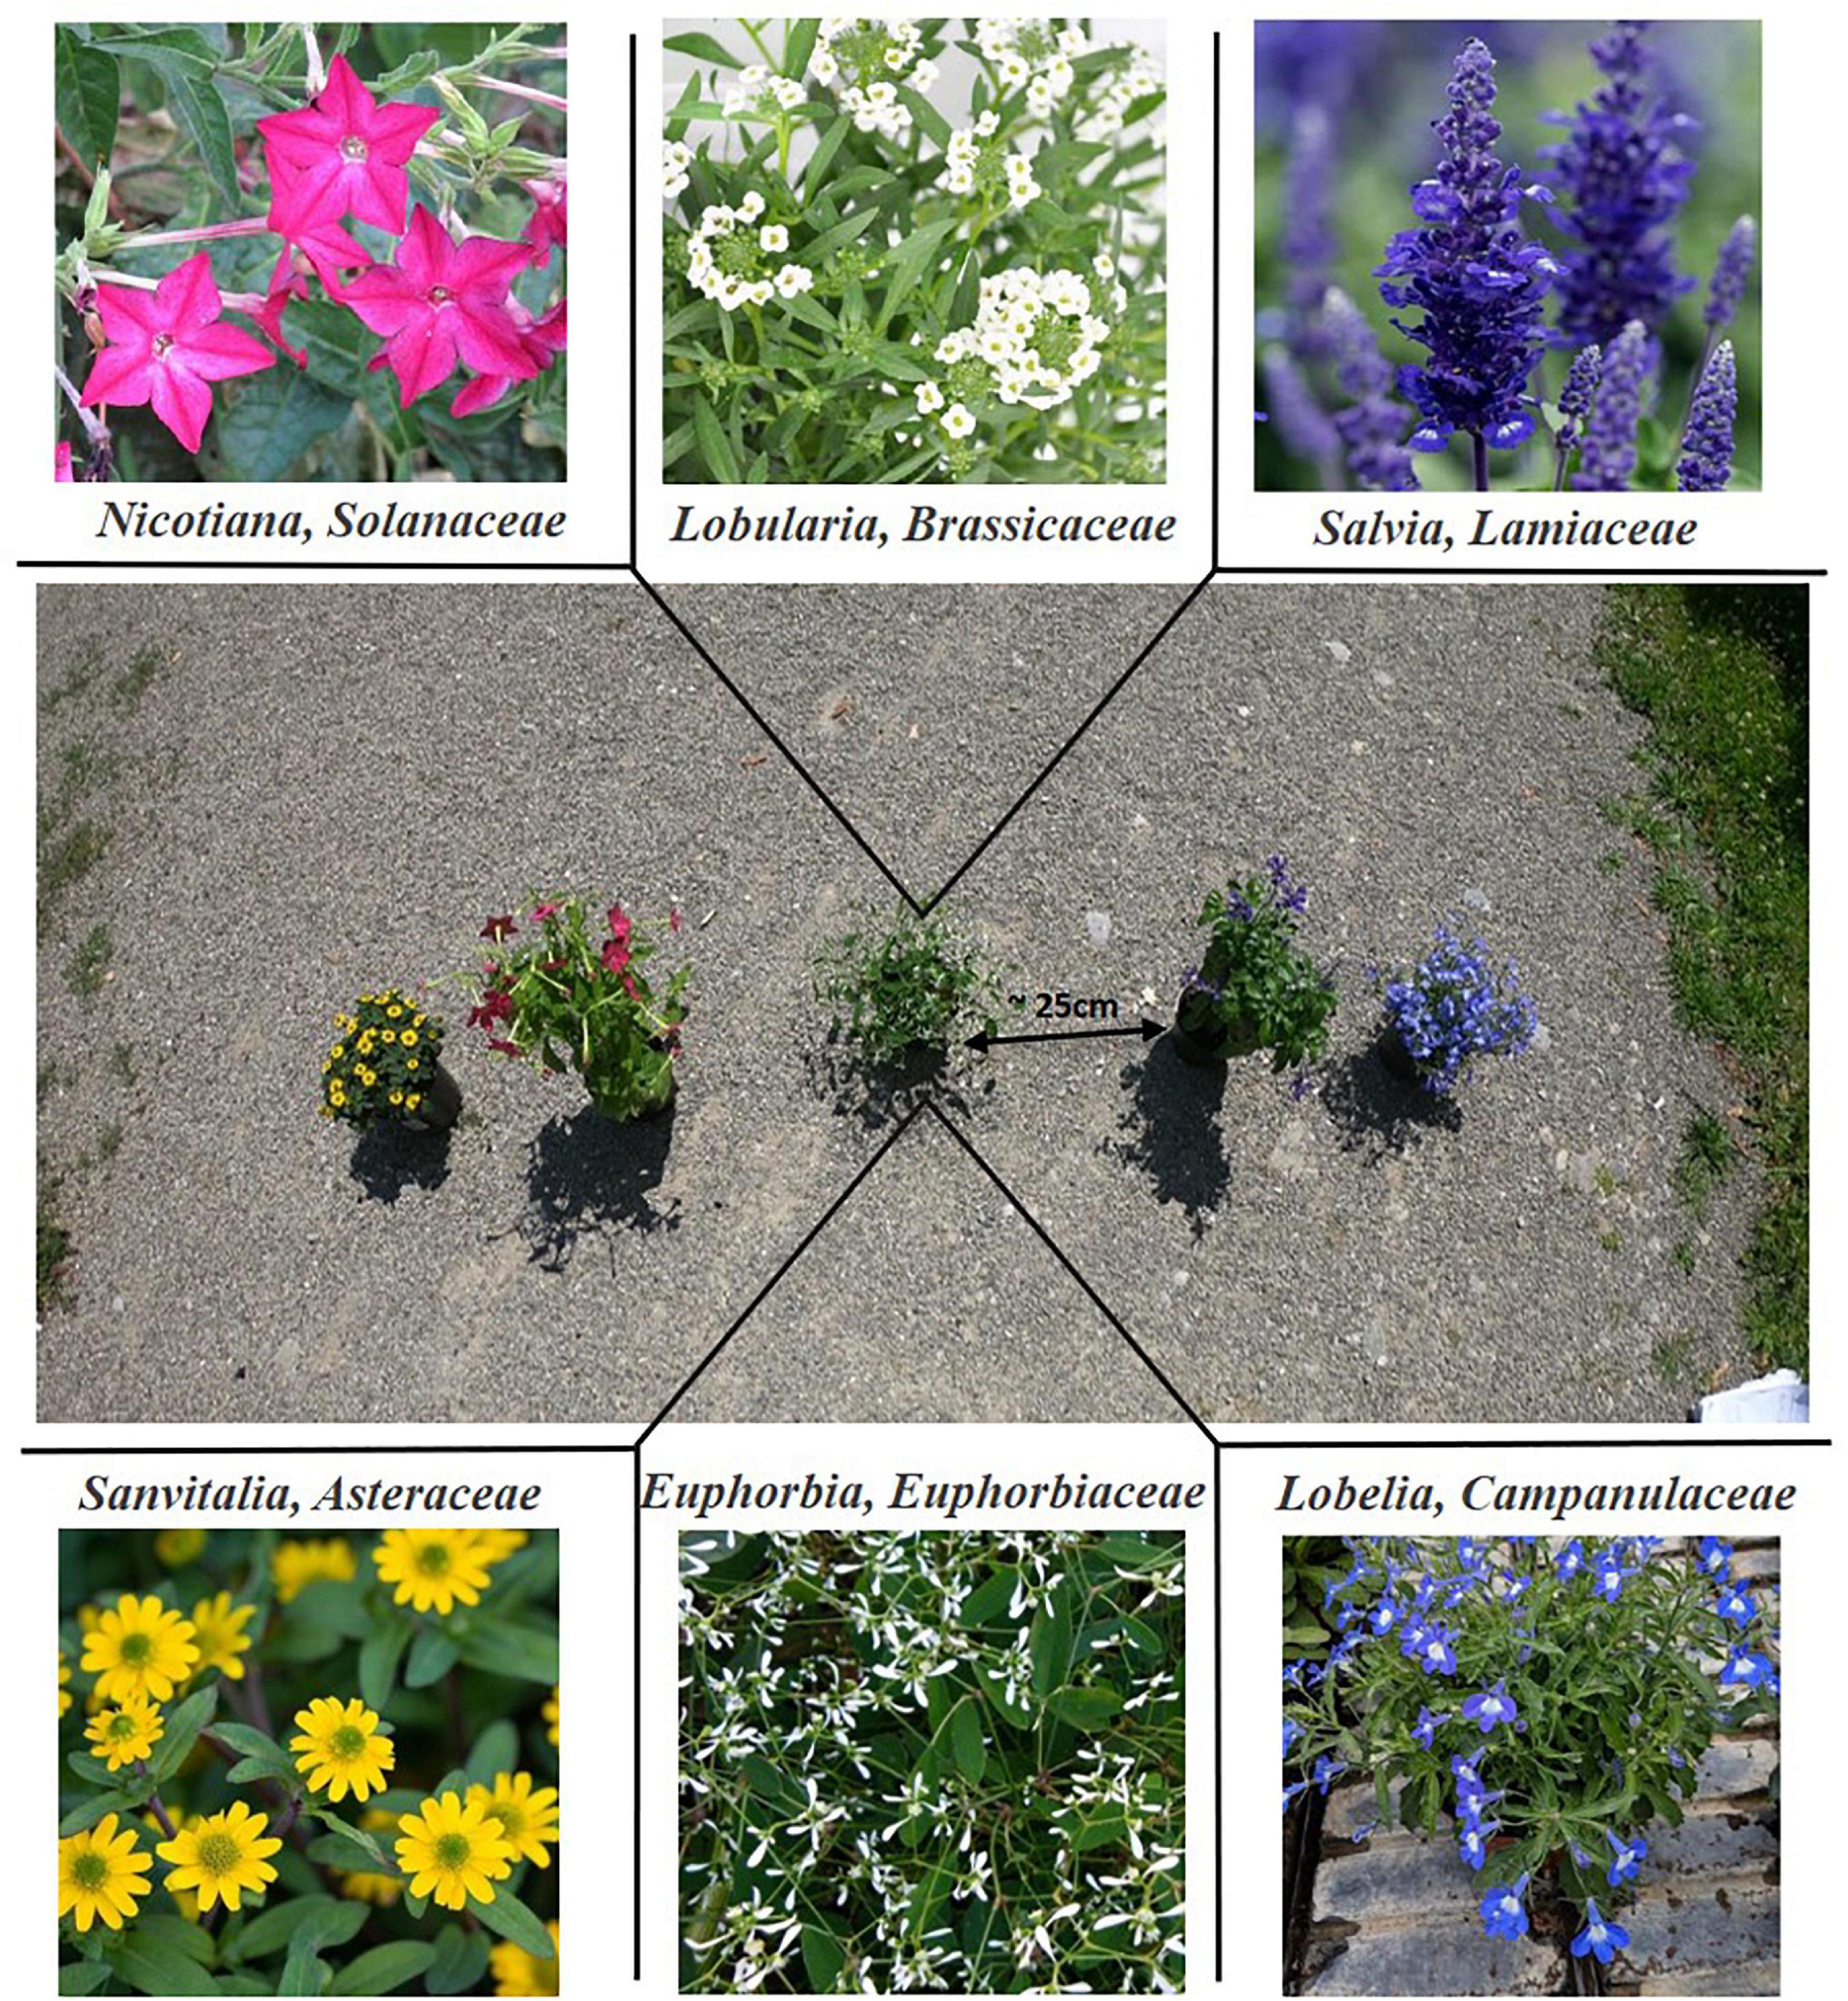
Figure 2. Placement of plant phytometres in Munich Squares. Plants were placed equal distances apart, but the wide-angle lens may distort configuration as pictured here. Only one white flowered plant was used in each sampling period. Lobularia was used in the first round of sampling and was then replaced with Euphorbia in the latter two rounds. Placement order was randomised for each site.
(1) As close to the centre as possible.
(2) Shift to the nearest open space (no tree cover).
(3) Place in sunny position.
Sun was prioritised over sky view such that plants could be placed under edge of canopy of trees depending on the angle of the sun and shadow coverage. Considering time of day, prevailing shadow and individual interpretation in the placement, the placement was slightly different on each sampling occasion.
Plants were acclimatised for a period of 30 min before beginning a 30-min observation period. All flower visitors attracted to the phytometre plants within the observation period were recorded, and classified into the following eight functional groups based on their flower type preferences and flower handling strategies: beetles (Coleoptera), true bugs (Heteroptera), wasps (Vespidae), large bees (the Bumblebee group, including Bombus spp. and members of the Megachillidae family), medium sized bees (the “Honeybee” group, including the European honeybee, Apis melifera, and similar sized species such as Andrenidae which are easy to mistake for honeybees), small bees (e.g., sweat bees, family Halictidae, and white-faced bees, Hylaeus sp.), hoverflies (Syrphidae), and “Other flies” (other Diptera). These groups are akin to those used previously in the literature (e.g., Geslin et al., 2013) and are thought to represent ecologically relevant distinctions for selection pressure on flower morphology (pers. comm. Dr. Andreas Fleischmann). A “pollination visit” was defined as the insect being observed touching or handling the sexual parts of the flower, as documented in previous studies of plant–pollinator networks (e.g., Geslin et al., 2013). Plants were also monitored during the initial acclimatisation to record the first pollinator to arrive, its functional group and plant preference.
During each sampling event, the visitation frequency of each pollinator group was recorded together with weather variables such as temperature and humidity (Table 2), which were taken using a handheld weather device. The floral abundance and richness of local flowering plants was measured within a 3-m diameter from the central plant in the phytometre set. The local attributes of the urban squares have been previously characterised (Mühlbauer et al., 2021). For use in our analysis, we selected variables related to habitat quantity (site size, unsealed surface proportion) or quality (tree richness and abundance, shrub volume, presence of water) and landscape context (distance to city centre and NDVI within 1,000 m). The floral information in this dataset was not complete, and three new variables related to floral resources were derived using site photos and landscape imagery. First, the presence of any kind of floral resources was recorded (“Any Flowers”), and then split into separate categories for presence of formal flower beds or pots (“Formal Flowers”), and grass-dwelling flowering weeds (“Grass Flowers”). More information and units for each of the final explanatory variables are given in Table 2.
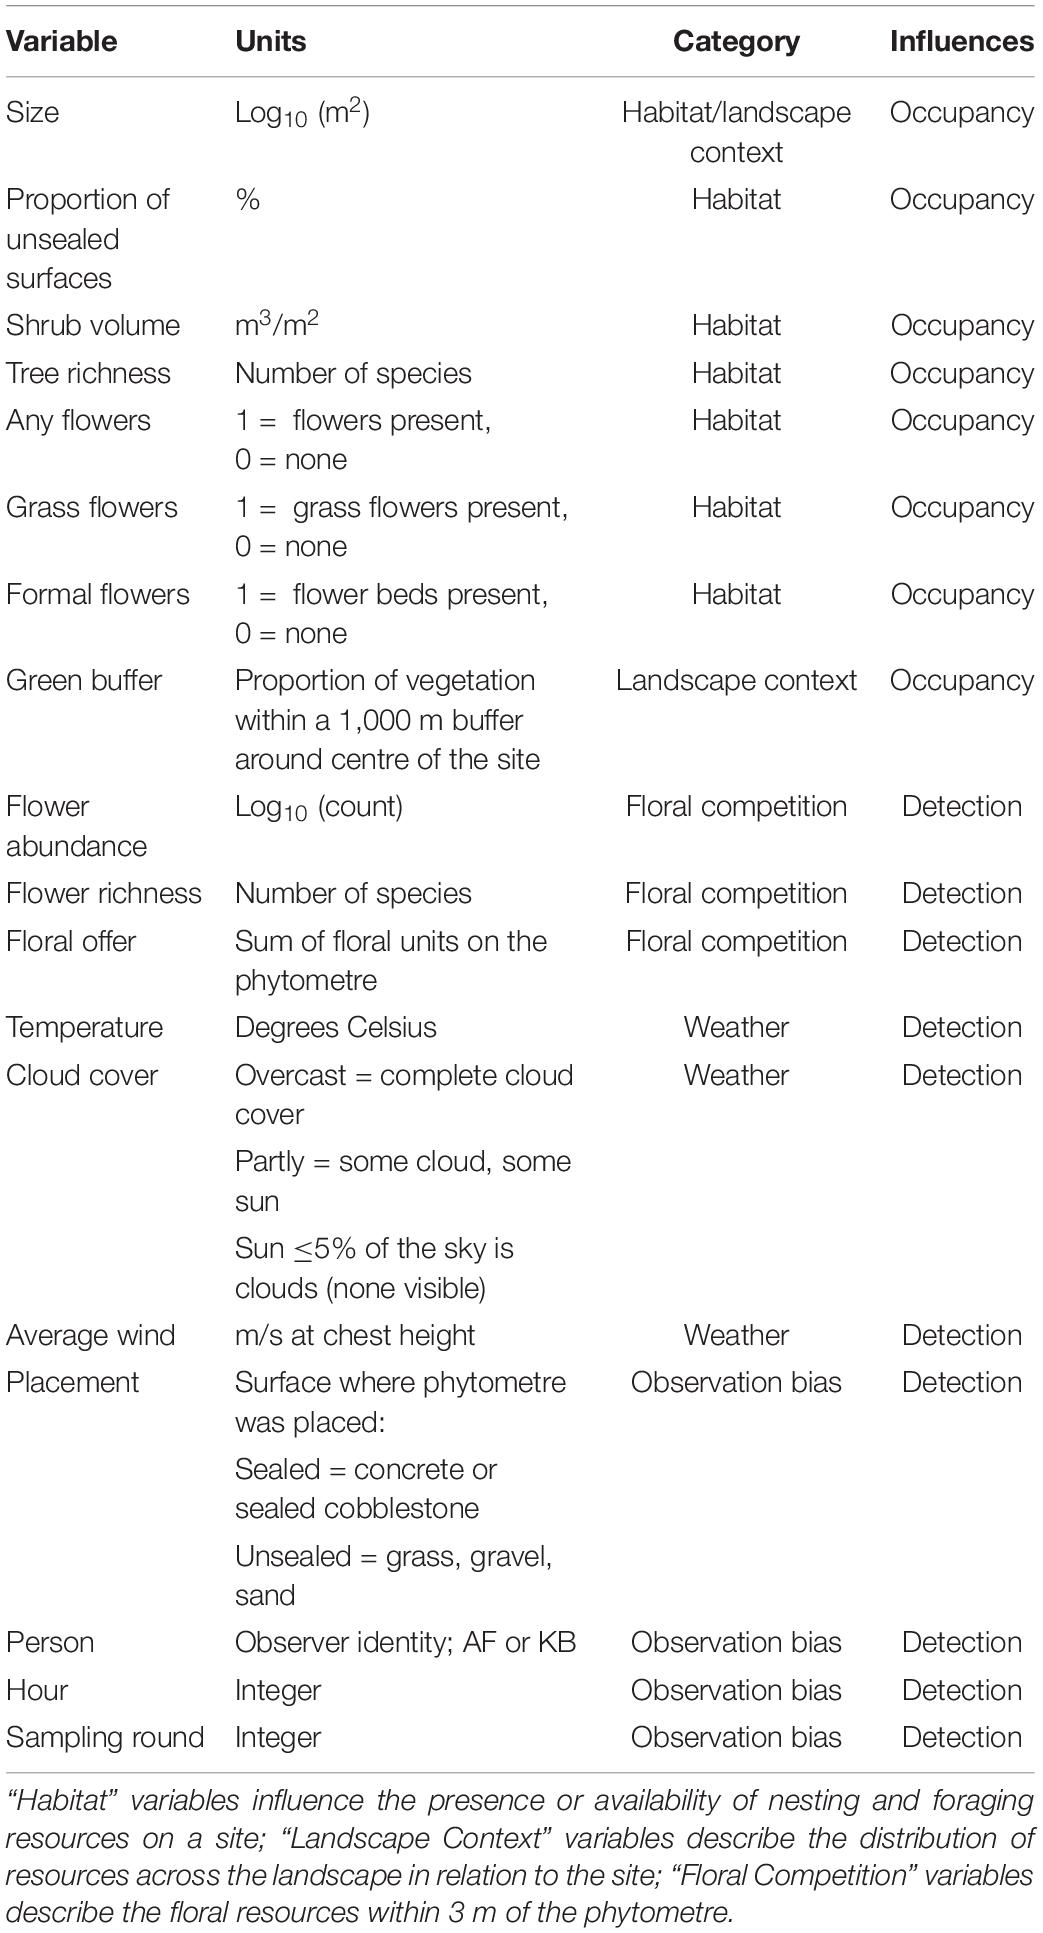
Table 2. Variables used in occupancy-detection modelling, the category of variation they explain and whether they are expected to influence probability of interaction (detection) or occupancy on the phytometre.
Statistical Analyses
Pollinator Preferences
To compare whether our plant phytometres performed as expected given plant pollinator syndrome literature, we calculated the proportion of interactions for a given plant–pollinator pair across all sites. The density of associations was visualised as an adjacency matrix calculated using the igraph package (Csardi and Nepusz, 2006).
Occupancy-Detection Models
Data exploration was carried out according to the protocol in Zuur et al. (2010). This initial exploration included checking for normality, variance, outliers, and collinearity (r > 0.7) among explanatory variables. Where multiple explanatory variables were correlated, only one was chosen to be included in the final models. Variables that were excluded from further analysis during this process were: tree abundance, diversity and density (correlated with tree richness); humidity (correlated with temperature); NDVI of the site, sealed and grass surface proportion (correlated with unsealed surface proportion); and presence of water (not enough sites contained water). Similarly, flower richness and abundance were correlated, but considered to represent different aspect of flower competition. Both were included in the modelling process, but models including both variables were considered to be overfitted.
Single season, occupancy-detection models were built for each pollinator group to model the probability of visitation in relation to local and landscape attributes. Since we are likely to have observed the same individual across multiple plants, we pooled visitation across all plant phytometres to calculate occupancy. We assume that this pooled occupancy is equivalent to occupancy on the site, since interaction with any of our phytometres indicates it is present on the site as a whole. Considering our acclimatisation period is short, we may include presence of transient visitors in our occupancy estimates. Thus, we use occupancy of a site in the broad sense of presence on site, and not to indicate residency. We acknowledge that there may be false negatives given there is a probability that the pollinator is present but not interacting with our phytometre plants. Hence, we include probability of detection in our models.
We take the probability of visitation to our phytometre on a given site (yij) to be a function of the existence of an insect on site (zi) and the probability of an interaction occurring given that the insect is present (pij; Eq. 1). The binary existence of the insect on the site is related to its probability of occupancy. We modelled the probability of occupancy (Ψi) of a given pollinator group as a function of habitat resources and context of the site within the landscape (Eq. 2). We modelled the probability of the insect interacting with our phytometre as a function of sampling weather, and the density and diversity of local floral resources (Eq. 3), which are expected to influence activity patterns and competition for visitation (Theodorou et al., 2016), respectively. Sampling biases may influence our ability to detect an interaction (e.g., observer effects, Johnston et al., 2018), so we included co-variates such as placement surface, time of day, and sampling round. A schematic of the model formulae is given below, and categories of covariates are used for simplicity. Further details of explanatory variables are given in Table 2.
All data exploration and analyses were carried out in R 4.0.2 (R Core Team, 2020). Data-wrangling and pre-processing was carried out using dplyr (Wickham et al., 2020) and reshape 2 (Wickham, 2007) packages. Occupancy models were built using the occu function in the unmarked package (Fiske and Chandler, 2011). To avoid testing all possible combinations, we used a multi-step hypothesis driven approach. First, we built detection-only models to select the variables that best explained probability of interaction (pi) for each functional group and held this constant for subsequent testing of site variables. In the second stage, we examined single-variable occupancy models for biologically relevant variation in occupancy (crossing the 0.5 threshold), and used these variables to build multi-variate models under three broad concepts: (1) a Local Habitat Model – including floral resources, area; (2) a Landscape Context Model – including site area, distance to the city and surrounding greenspace; and (3) a Full Model combining all local and landscape variables.
Models were compared using Akaike’s Information Criterion (AIC) and R2, and the best model for each functional group was selected as the model with the highest R2 within Δ2 of the model with the lowest AIC. Model fit was then confirmed using the MacKenzie-Bailey Goodness of Fit test (MacKenzie et al., 2005), as well as visual inspection of residuals for normality and homoscedasticity. Goodness of fit tests and model comparisons were performed using the AICcmodavg package (Mazerolle, 2020). Dunn-Smyth residuals were constructed separately for occupancy and detection components of the model using code modified from Warton et al. (2017).
Results
A total of 2,654 interactions were observed across all sites and all three sampling rounds. Most pollinator taxa were observed to interact at least once with each plant type, with few exceptions. Ants and bugs never interacted with Nicotiana, bumblebees did not interact with either white flowered plant, and bugs and butterflies were not observed on Lobelia. Some interactions occurred at only one site, such as beetles interacting with Saliva or butterflies interacting with Nicotiana (Supplementary Table 2).
Consistent plant preferences (i.e., a high density of interactions between certain plant–pollinator pairs) were observed for several taxa (Figure 3). For example, beetles were only ever seen as adults on white flowers of Lobularia, but larvae were occasionally observed to interact with flowers on Lobelia. Ants were also most commonly observed on both species of the white plant functional class. All bees, in particular small bees, showed strong associations with Lobelia and Salvia.
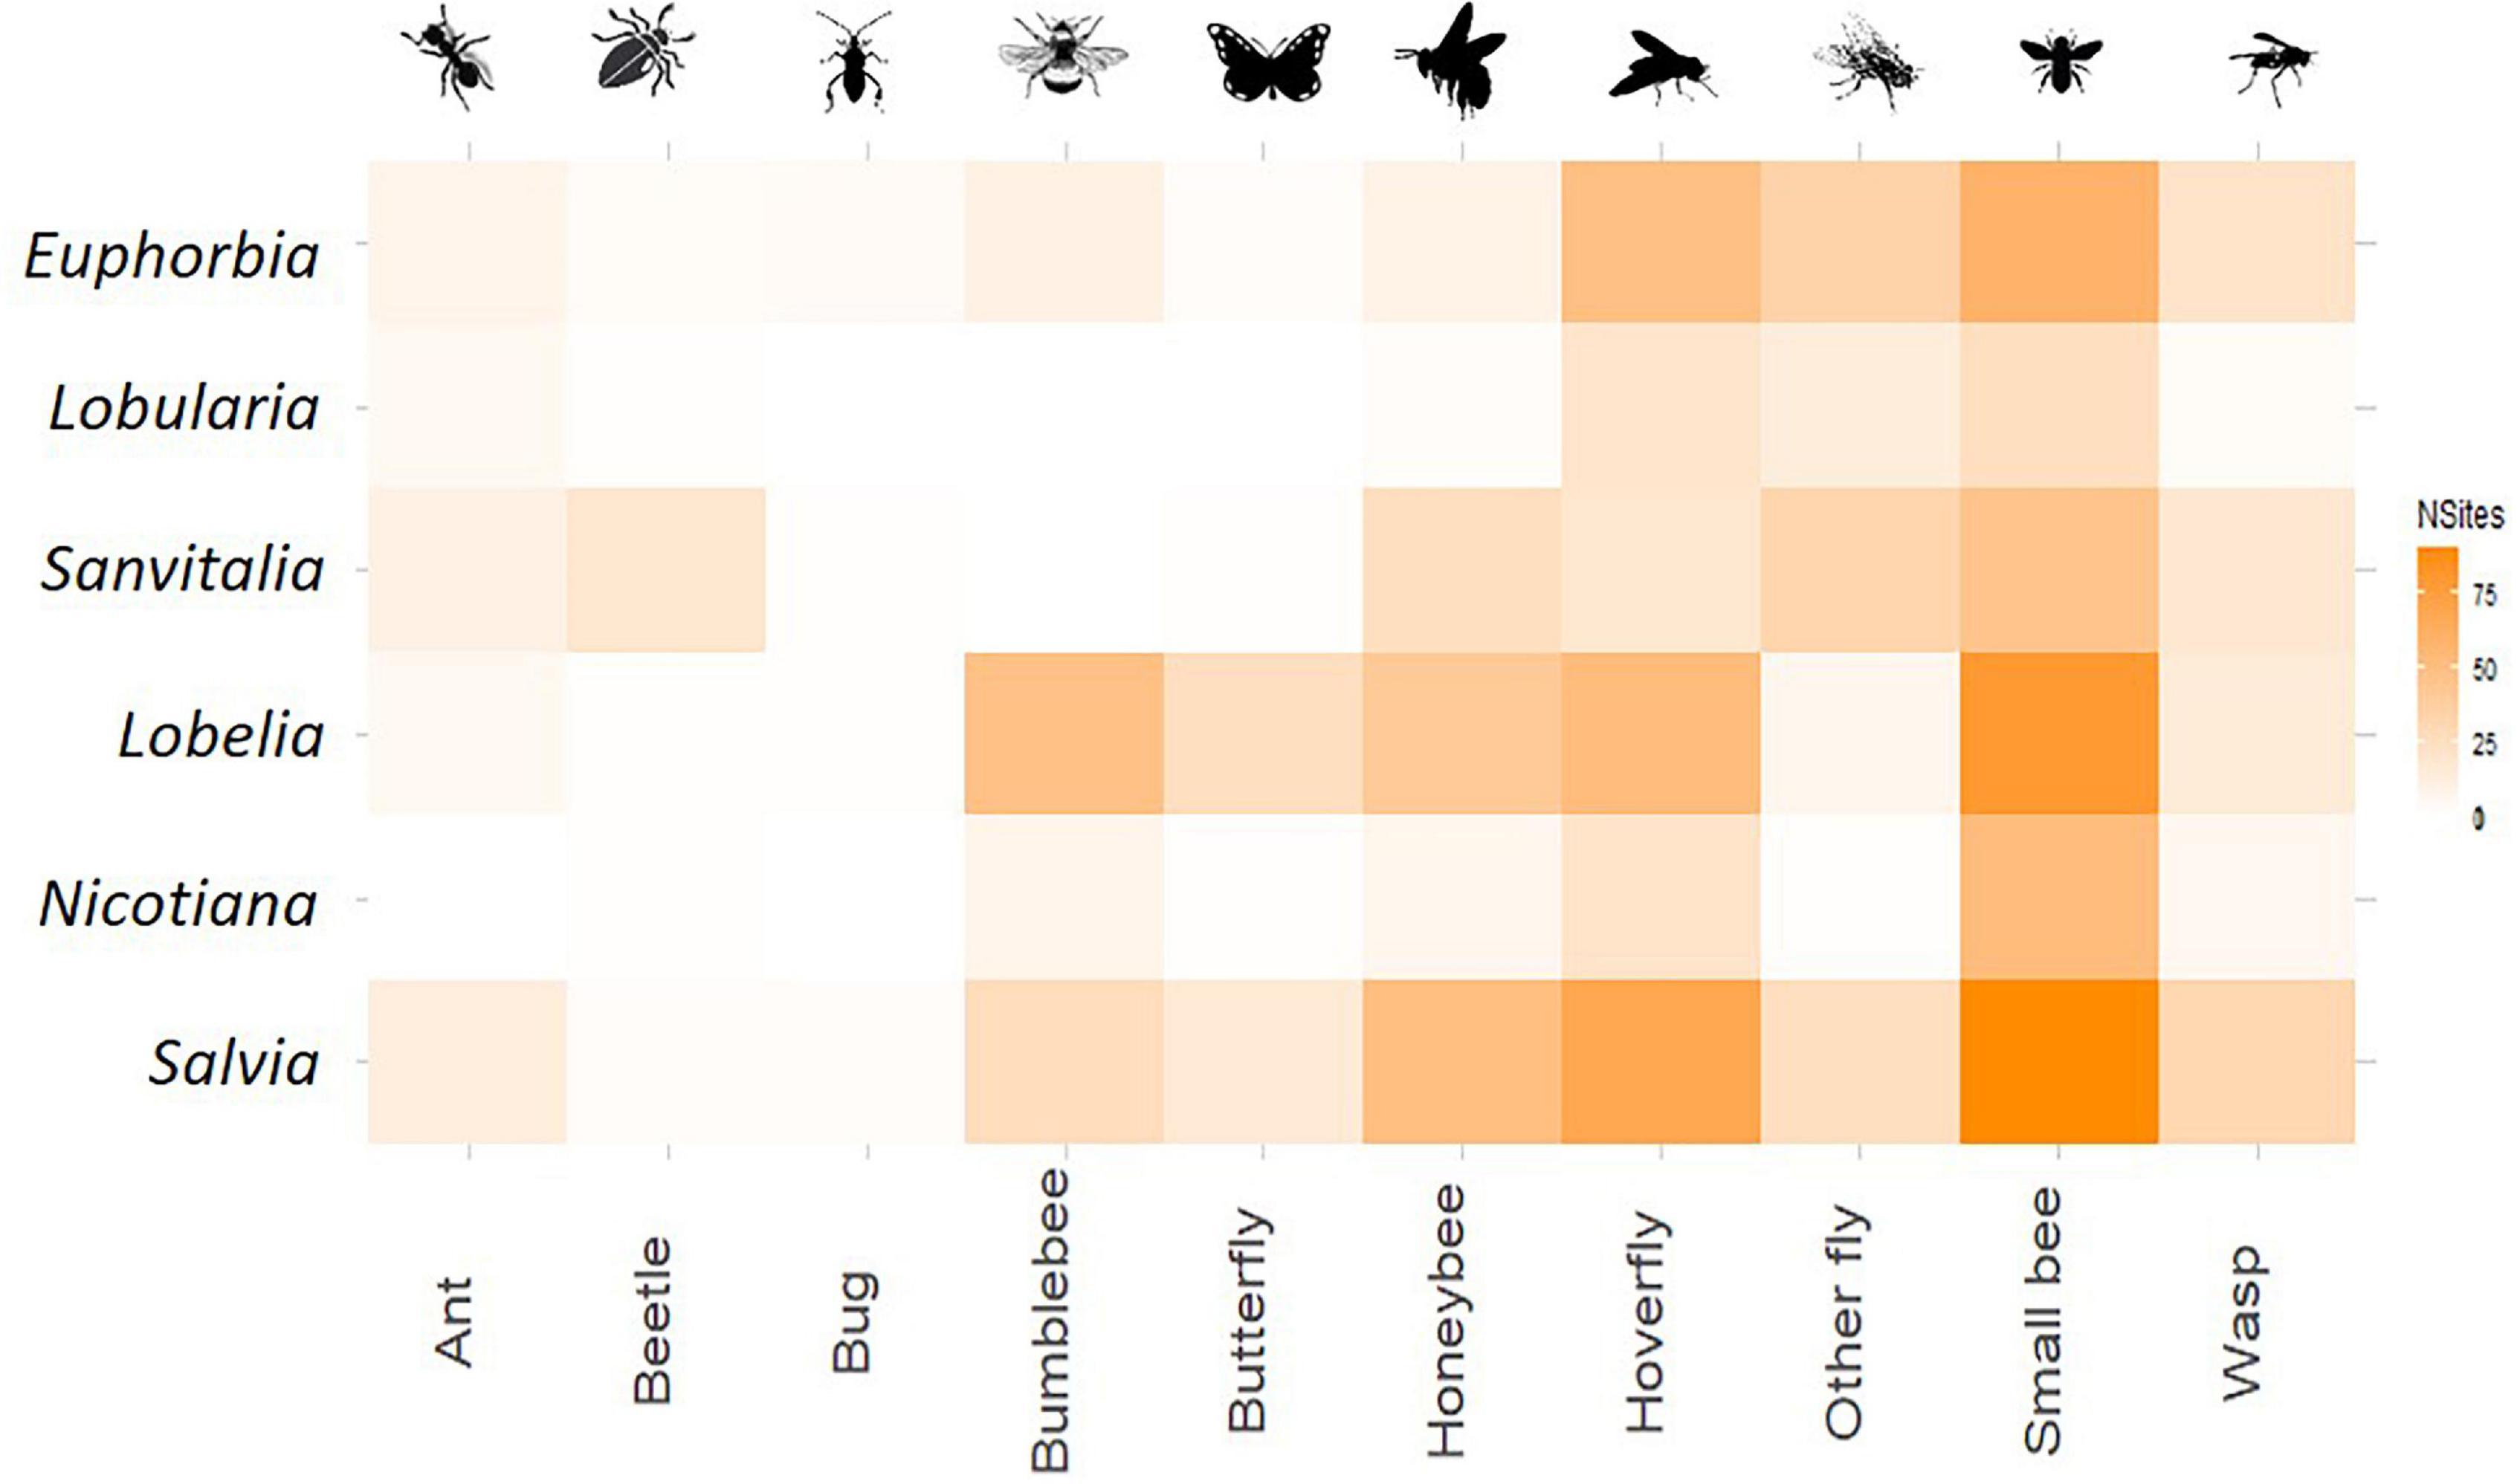
Figure 3. Meta-network of plant–insect interactions across all sites. Weighting of each pairing is given using the number of sites at which the pair was observed to interact, the darker the colour the more consistent the interaction.
Detection rate was low for all functional groups, with a high number of single detections for each group at a given site, and some groups having only a handful of detections across the whole sampling period (Supplementary Table 3). Small bees were the most commonly observed functional group (96% of sites), followed by hoverflies (85%) and honeybees (67%). Both beetles (Coleoptera) and bugs (Heteroptera) were only detected once on any given site, and butterflies were only detected twice on one occasion. Due to low detection, occupancy-detection models were unable to be built for bugs (Heteroptera).
Occupancy models explained between 15 and 53% of variation in pollinator visitation. All final models passed goodness of fit checks (statistics reported in Figure 4), and there were no patterns visible in the residuals. Main effects are highlighted in Figures 4, 5, but additional information on coefficients and their standard deviation (Supplementary Table 4), graphs for each functional group across all variables (Supplementary Figures 1, 2) and predicted occupancy and interaction probability (Supplementary Figure 3) can be found in the Supplementary Material.
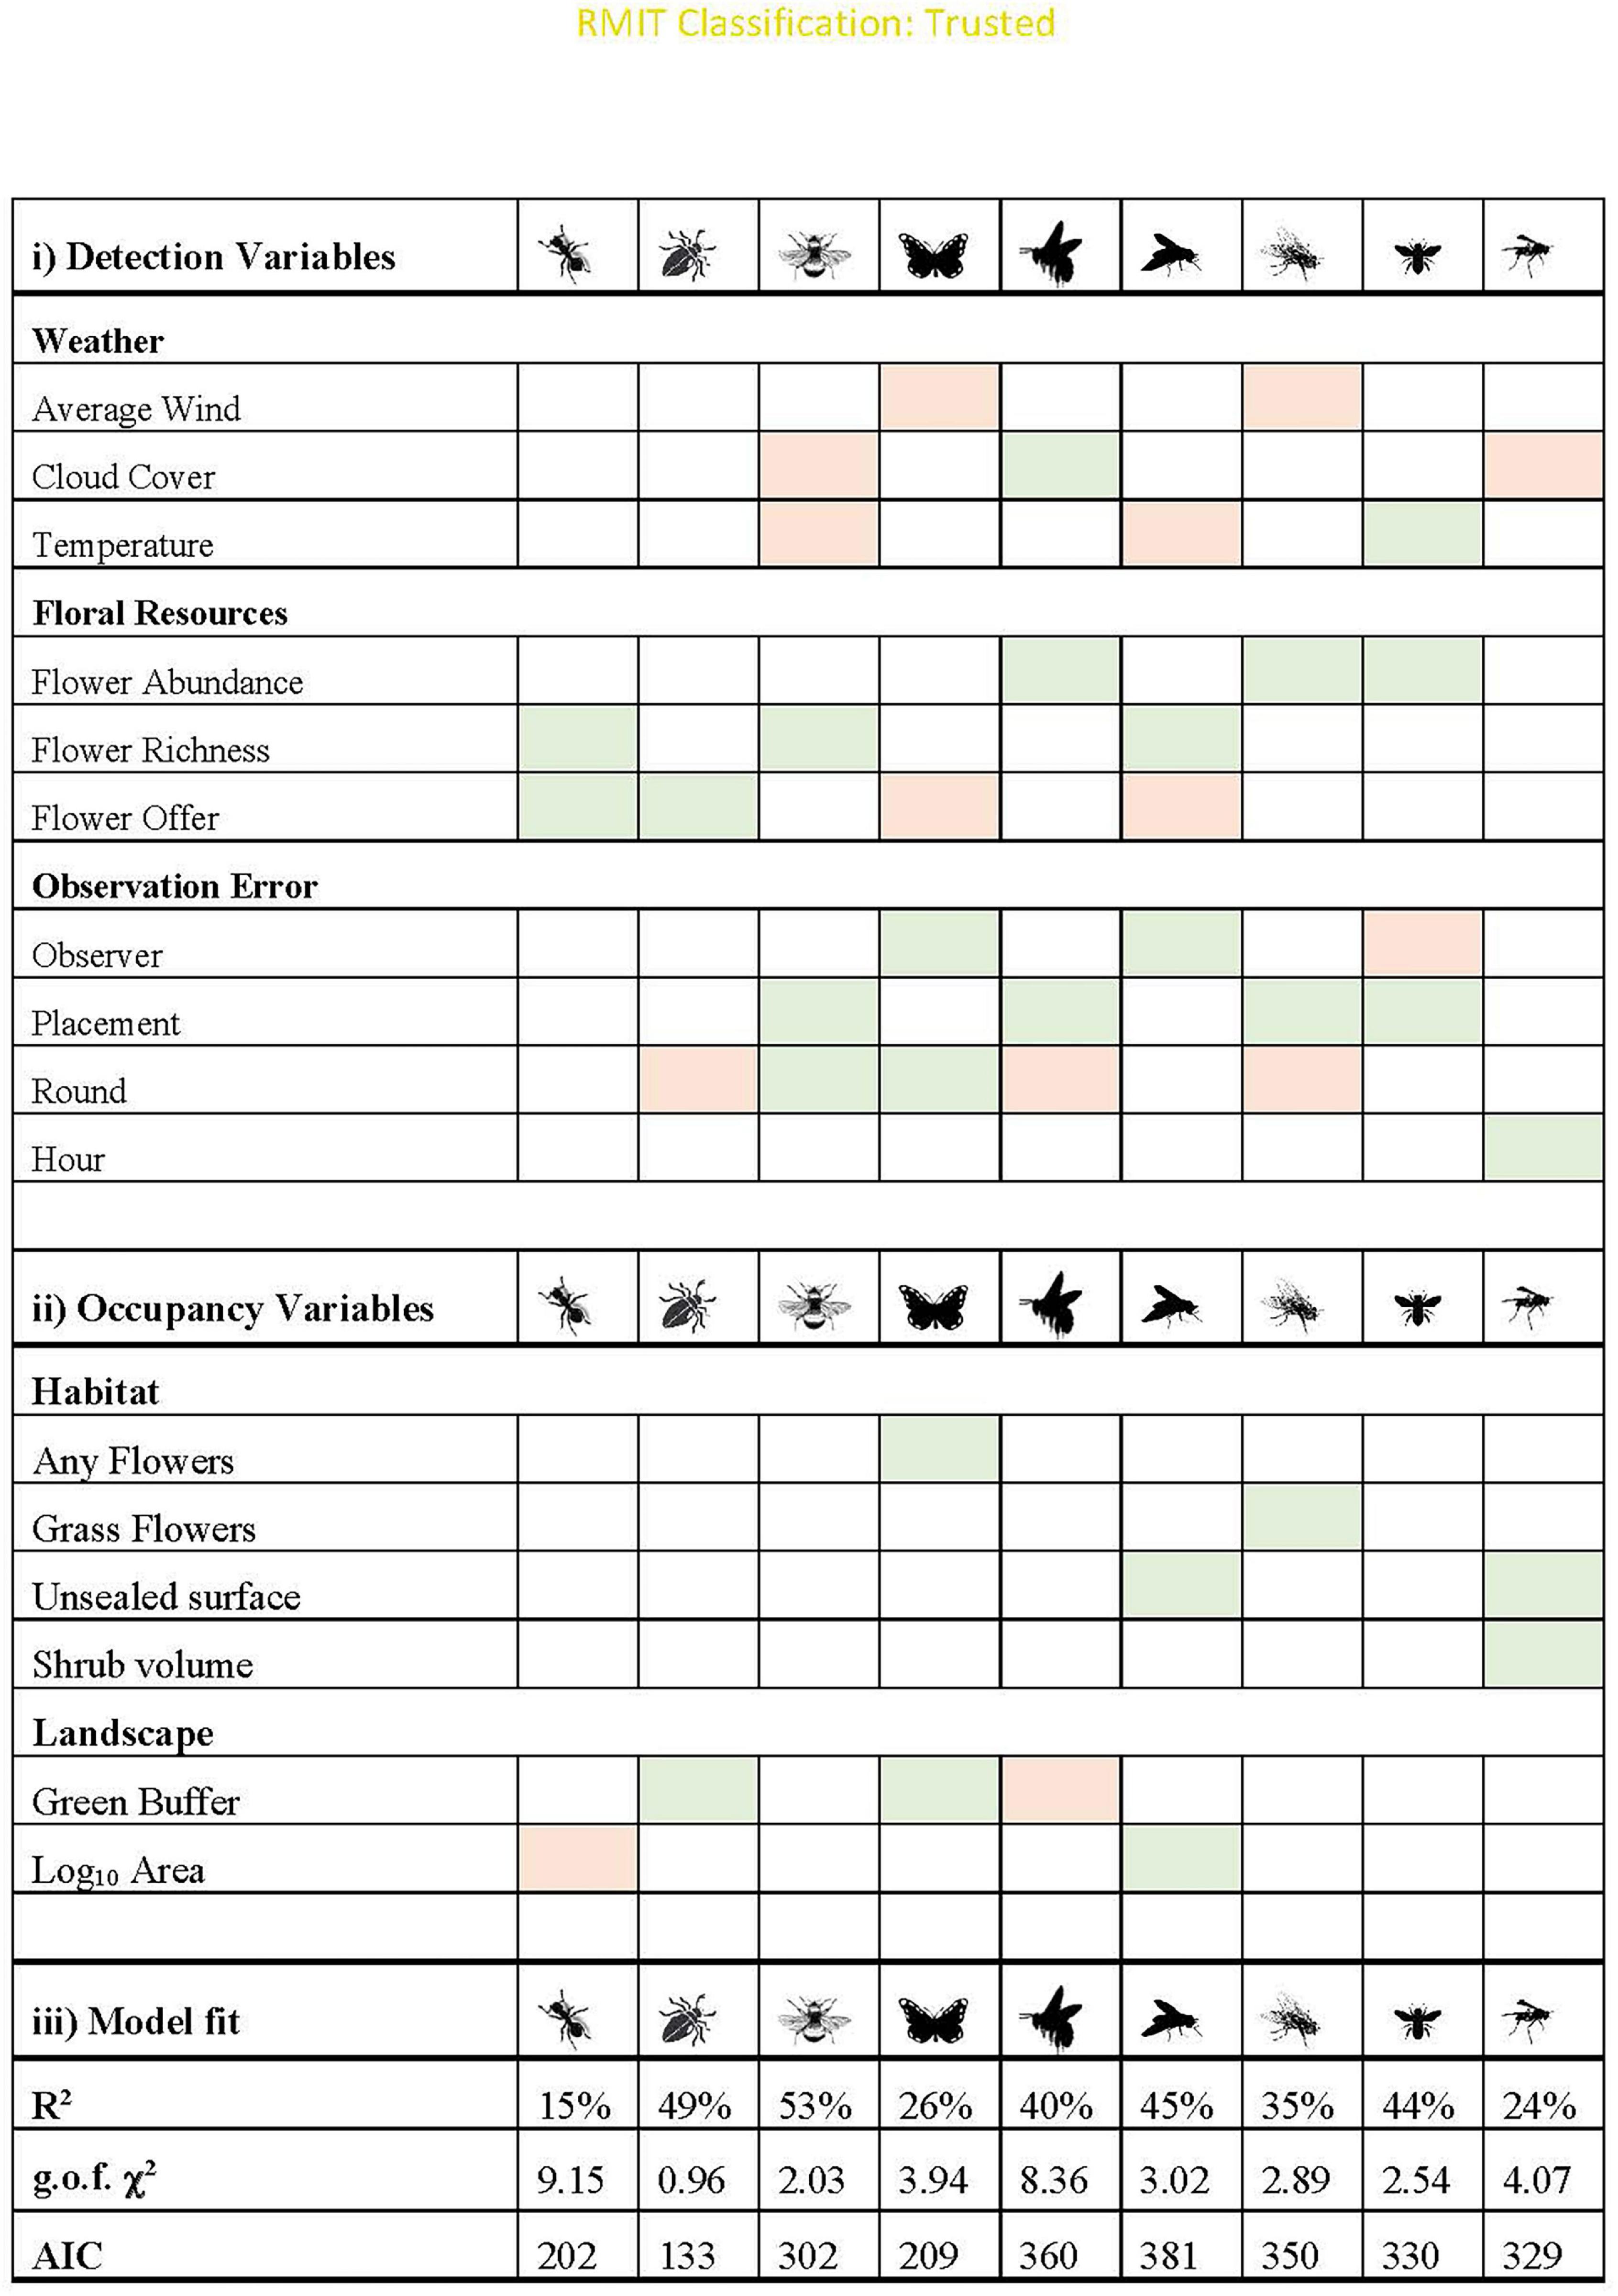
Figure 4. Main effects and model fit for the final models for each functional group. All models assume additive effects, and shading indicates whether the relationship is positive (green) or negative (orange). All models passed the g.o.f. test (p > 0.05). Cloud cover: the relationship is “negative” if there was higher detection on sunny days. Observer: positive indicates that more experienced surveyors were more likely to detect interactions. Placement: positive relationship indicates the taxa was more likely to be detected on unsealed surfaces. Round was shaded as negative if the detection probability decreased after the first round. Further graphs are in Supplementary Figures 1, 2.
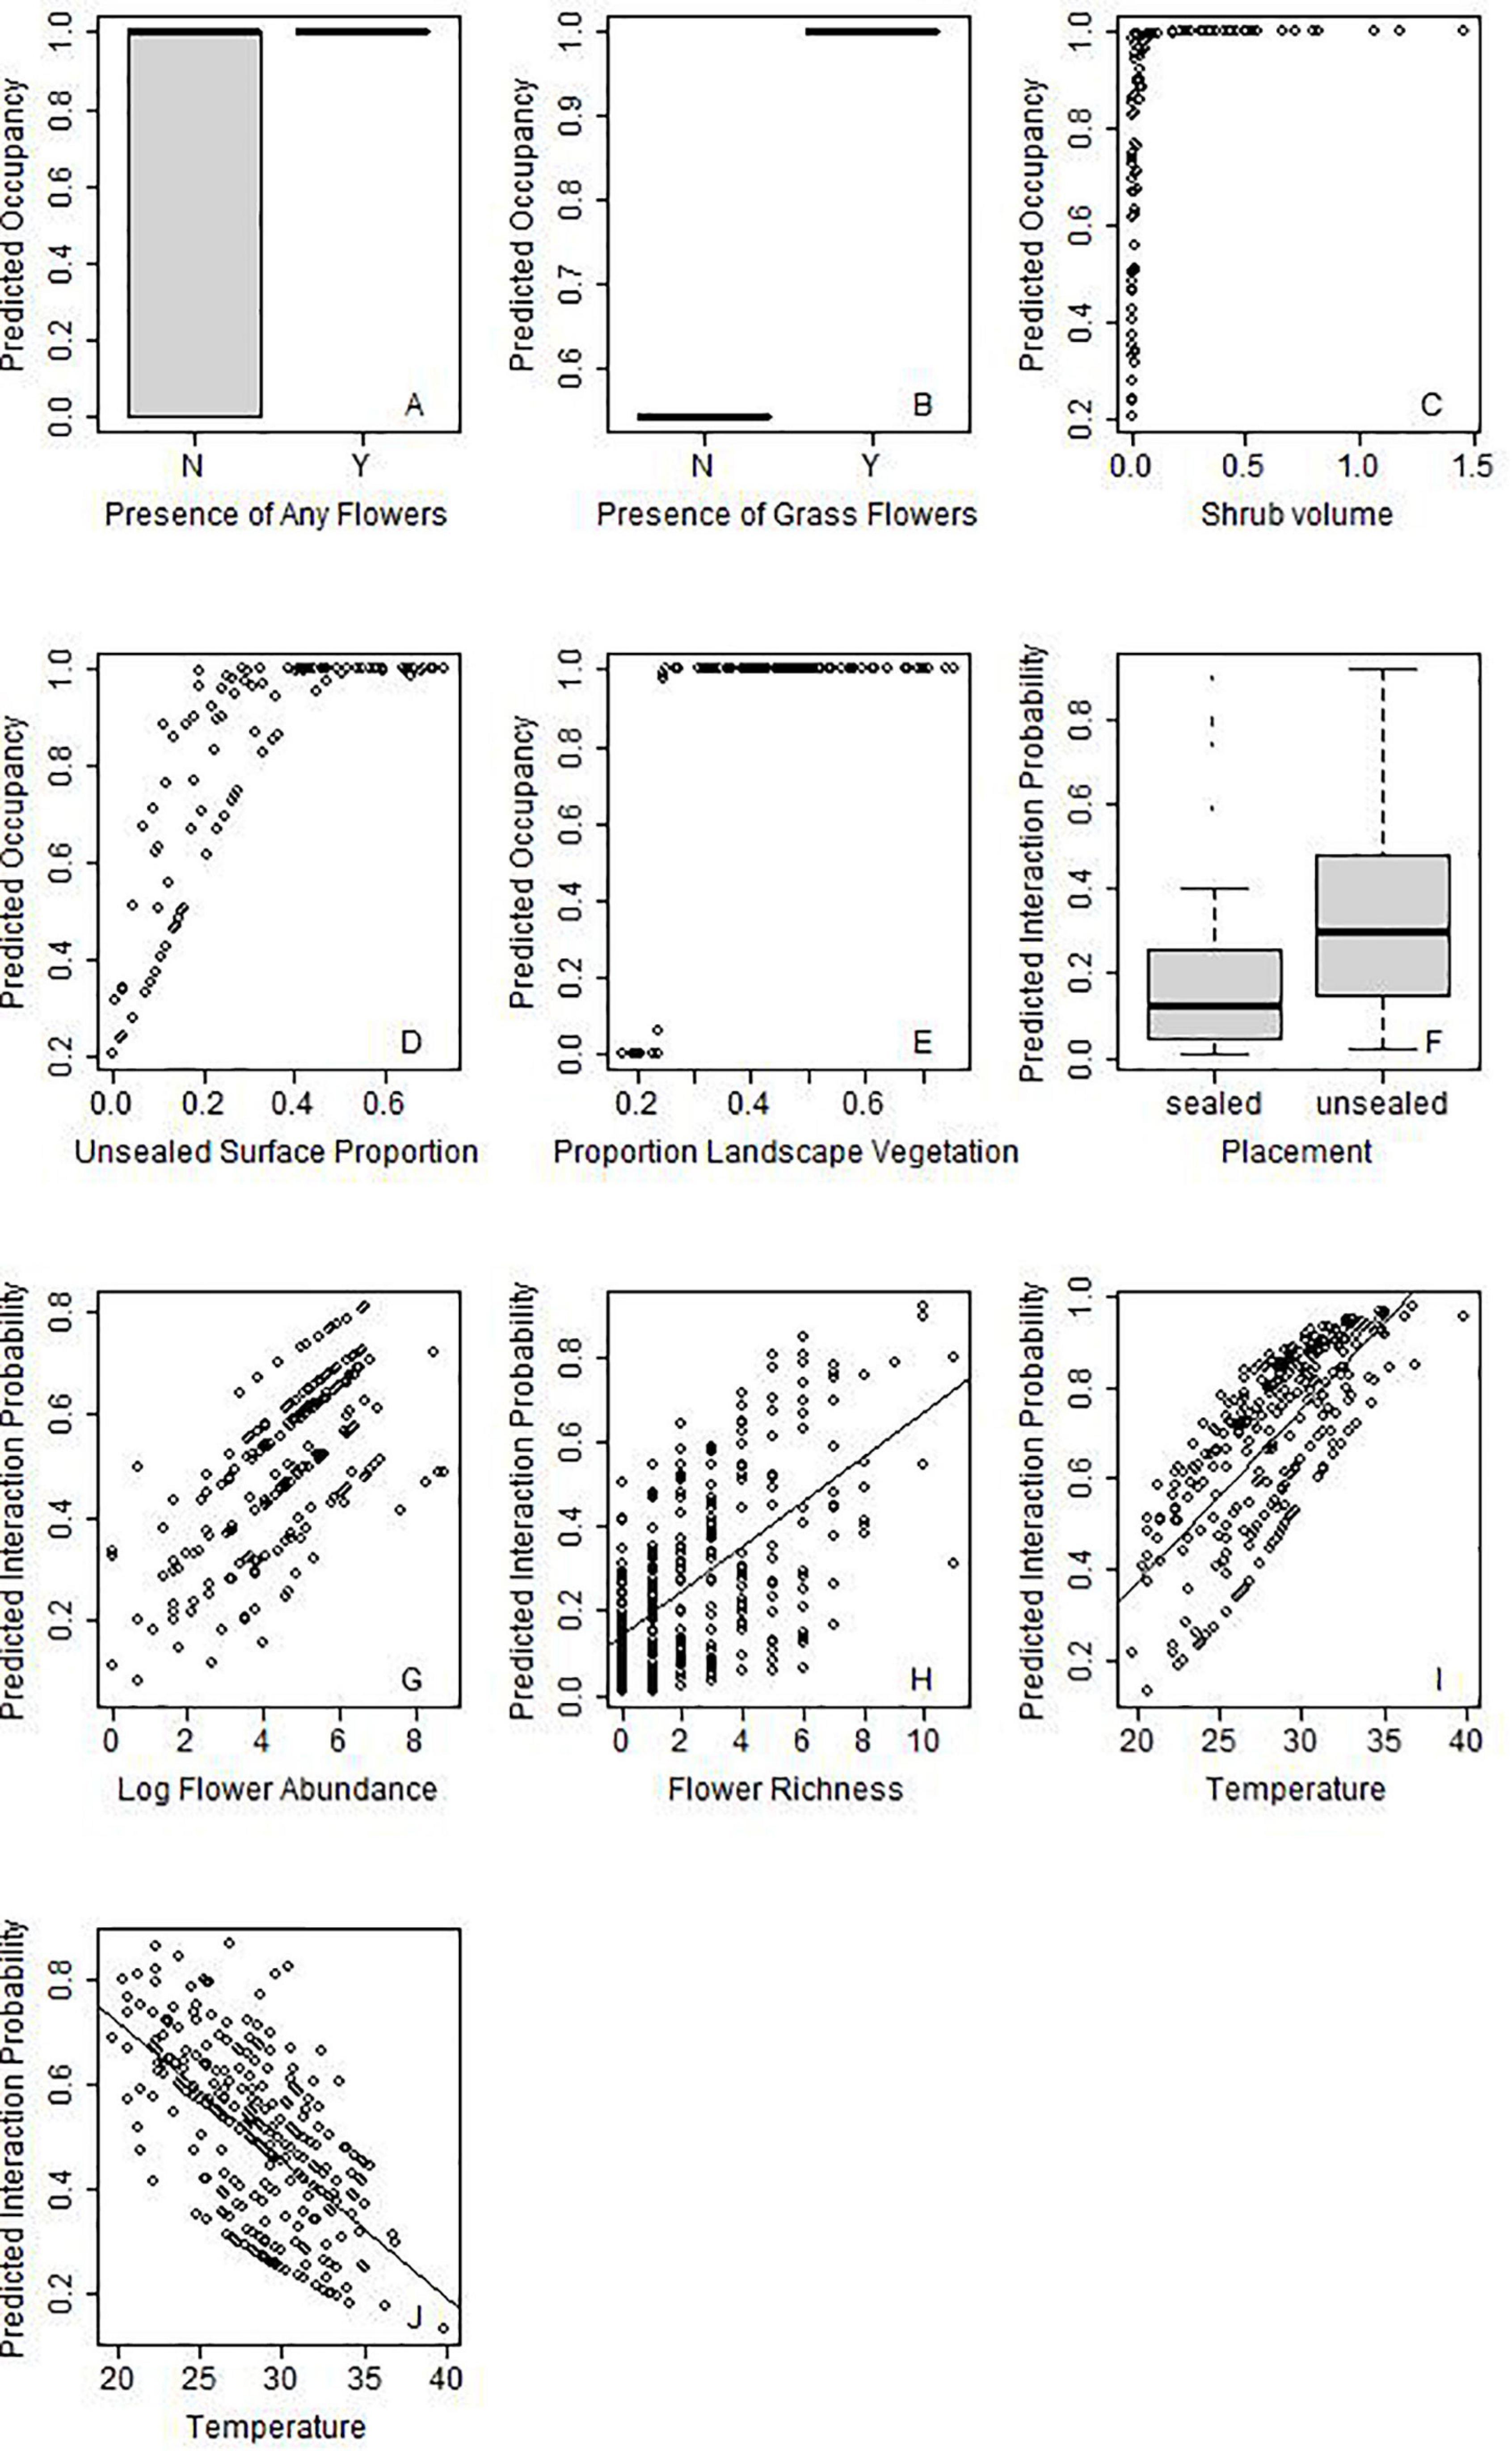
Figure 5. Selected examples of main effects for various pollinator taxa on occupancy probability (A–E) or probability of interaction (F–J). The pollinator taxa are indicated by the silhouette on the top right of the graph. Figure 4 demonstrates the variables that are significant for each taxon, but for further graphs see Supplementary Figures 1, 2.
Changes in Occupancy Across Sites
Provision of unsealed surface, and presence of floral resources increased the probability of occupancy for almost half of the insect groups: hoverflies, wasps, butterflies and “other flies” (Figure 4). While butterflies responded to the presence of any flower, “other flies” specifically increased in response to presence of grass flowers (Figures 5A,B, respectively). Only two taxa showed strong relationships with site area: hoverflies were more prevalent on larger sites, but ants showed the opposite relationship. Wasps were the only group to have shrub volume included in the final model. Tree richness was not included in the final models for any functional group, but trends were present for ants and wasps since it was highly correlated (∼r = 0.6) with unsealed surface proportion and shrub volume. Very few taxa responded to landscape context variables, and those that did showed contrasting results. While beetles and butterflies increased probability of occupancy with increasing proportion of vegetation, the probability of occupancy declined for honeybees (Figure 4).
For all groups, there was a stronger influence of site context on variation in probability of interaction rather than changes in occupancy, such that some groups (including bumblebees and small bees) were predicted to occur across all sites (Supplementary Figure 3). For those that showed strong relationships with site variables, often there were low thresholds. For example, wasps increased in occupancy with increasing shrub volume but reached 100% occupancy probability with very low increases in shrub volume of 0.1 m2/m3 (Figure 5C). Wasps are also predicted to occur on sites with >25% unsealed surface proportion (Figure 5D). Similarly, beetles reached a maximum probability of occupancy when proportion of green was above 25%, respectively (Figure 5E).
Factors Affecting Interaction Probability
Overall, placement on unsealed surfaces with abundant and diverse flowers in the surrounding 3 m increased the probability of interaction for all taxa, excluding butterflies, which only responded to floral resources on the phytometre itself (Figures 4, 5F–H). Butterflies and hoverflies decreased their probability of detecting an interaction as the floral abundance on the phytometre increased, likely as a result of search identity issues. The probability of detecting an interaction for ants and beetles was highest during the first round of sampling when the floral offer was also highest.
Honeybees and bumblebees were not influenced by temperature, wind or time of day, but were more likely to be seen interacting on days with at least partial sun (i.e., limited cloud cover). Small bees were more likely to be seen interacting on warmer days, but hoverflies were more often detected interacting in colder temperatures (Figures 5I,J). Wind speed did not appear in the final models for most taxa but had a significant negative influence on probability of detection an interaction for butterflies and “other flies.”
All groups showed variation in detection probability across sampling rounds. Beetles, ants, and “other flies” were primarily observed during the first round of sampling. Bumblebees increased detection probability over the sampling season, with each subsequent round having higher detection than the last, whereas hoverflies and butterflies were more likely to be detected on second round of sampling (Supplementary Figure 2).
Discussion
We have generated a substantial dataset investigating the influence of greenspace design and landscape context on plant–insect interactions in urban squares, yet there is much variation in insect visitation that we could not explain. Changes in interaction probability were more important in predicting pollinator visitation than larger scale site factors that influence occupancy, suggesting small scale microhabitat effects on plant–insect interactions might be the dominant mechanism of attraction to floral resources. Unsealed surfaces increased both probability of occupancy and probability of detection for pollinators, indicating that plant–insect interactions are limited by proportion of greenspace on a site. Floral resources were also important for increasing occupancy for some groups, but generally had a greater influence on interaction probability, suggesting a local facilitative effect. Below we discuss factors affecting probability of occupancy at a site, and those affecting the probability of interaction, as well as the implications of these findings for designing greenspaces to encourage plant–insect interactions.
Changes in Occupancy Across Sites
Although it is well known that the diversity of insects on a site is related to habitat quality [reviewed in Beninde et al. (2015)], we found that presence or absence of foraging resources at the site-scale had limited effects on occupancy of pollinators. Increases in site area and unsealed surface proportion, which are expected to correlate with increased habitat and nesting availability (Beninde et al., 2015), positively influenced the presence of wasps, syrphids, and other flies, but not other groups. A lack of strong habitat effects might be due to our use of functional groups rather than species. While there may have been a high probability that at least one species of hoverfly was present on a given site, there may be turnover in species that we were unable to detect (Geslin et al., 2013). Additionally, historical filtering may make observed pollinators already urban adapted (Williams and Winfree, 2013), and capable of persisting within urban habitats or the urban matrix. Thus, the effects of site variables may not have been easily observable in our study.
Alternatively, our phytometre method may be only capable of measuring occupancy at a very local scale rather than truly representative of site occupancy. Previous studies have used phytometres as an indication of abundance or richness, rather than occupancy, and are commonly used on much smaller residential or community garden scales (e.g., Lowenstein et al., 2015) or have been replicated across different habitats within parks (Daniels et al., 2020) to account for heterogeneity. Here, we assumed the centre of the site to be representative, but several sites had green patches that were dissected by paths and even whole roads. Internal barriers like roads might contribute to patchiness in distribution of insects across a site and decrease the probability that an insect present on the site would encounter and interact with the phytometre set. False negatives like these are likely given our extremely low detection rates and may also arise from extreme competition where pollinators prefer other resources existing on site.
There are two lines of evidence that suggest an influence of within-site heterogeneity. First, we found a negative effect of site area on occupancy for particularly low mobility functional groups like ants, but a positive effect for hoverflies. This result may be an artefact of detection probability interacting with within-site heterogeneity and internal barriers that we did not measure (Tylianakis et al., 2008). That is, low mobility groups may have a patchy within-site distribution and only interact with the phytometre if it is placed in a section of the site they can access. They may be relatively unresponsive to increases in total habitat because of this internal fragmentation, and the effect may be exacerbated on larger sites or where the centre of the site (the only location we sampled) is not necessarily representative. Second, placement in areas with existing habitat increases the probability of interaction, but there was a limited influence of unsealed surface proportion at the site scale. The difference in effect of unsealed surfaces at different scales may indicate that internal dynamics are more important that total quantity of habitat. Future studies would benefit from quantification of within site habitat heterogeneity and whether this acts in a similar way to distribution of resources at a landscape scale.
In a similar way, heterogeneity in the distribution and relative scarcity of resources across the landscape is expected to affect the frequency with which insects encounter certain resources (Lele et al., 2013), depending on dispersal capacity (Baguette et al., 2013; Diniz et al., 2020). However, we find very little evidence of the influence of landscape context on pollinator visitation. Typically, fragmentation effects are stronger for low mobility taxa and they respond at smaller scales (Steffan-Dewenter et al., 2002; Williams and Winfree, 2013). Despite having low dispersal capacity (Zurbuchen et al., 2010), small bees are relatively ubiquitous throughout our sample sites. Contrastingly, beetles and butterflies, insects, which have relatively higher dispersal capacity, responded positively to increasing proportion (and anticipated connectivity) of greenspace in the landscape. The difference in these results may be the result of the scale of measurement of landscape context, or differences in responses between taxa that are typically residents or transient visitors in their foraging behaviour. For example, Steffan-Dewenter et al. (2002) found that wild bees responded to connectivity at smaller scales (250–750 m) than honeybees (3,000 m). Similarly, Williams and Winfree (2013) found that pollinator abundance increased with woodland connectivity, but measured connectivity at a very local scale (200 m). Here, we measured landscape context at a relatively large scale (1,000 m), and low mobility taxa such as small bees or ants may not respond to landscape connectivity at this scale.
In addition, small bees were more often the first recruited to our phytometre (Frank, 2018) and may reside on our sites more frequently than expected. Their persistence may instead be linked to provision of potential nesting habitat (Theodorou et al., 2016), which is possible even on small sites (Williams and Winfree, 2013) as many wild bees are known to be ground nesters (Harmon-Threatt, 2020) with short foraging distances (Zurbuchen et al., 2010). Conversely, taxa with higher dispersal capacity, like adult butterflies, are likely to be transient visitors that make use of foraging resources rather than nesting sites. The probability of encountering our phytometre, while being present on the site to forage, may be more likely to be related to landscape connectivity since they are actively seeking out resources at a greater distance. Similarly, Honeybees may have foraging behaviours that are decoupled from landscape habitat provision, due to the prevalence of managed artificial hives in urban areas (Steffan-Dewenter et al., 2002). The observed decrease in prevalence of honeybees in relation to greenspace quantity may be related to a higher than expected density of hives in the inner-city areas with low greenspace availability.
Local Effects on Interaction Probability
As in previous studies (Lázaro and Totland, 2010; Hennig and Ghazoul, 2011), we show that the richness and abundance of flowers surrounding a focal species influences the probability that it is visited by pollinators. Here, we find a facilitative effect, where the presence and diversity of flowers increases the probability of interaction with our focal species. Previous literature has shown both facilitative effects, through increased abundance of pollinators at sites with high floral richness (Theodorou et al., 2016), and competitive effects that decrease visitation (Hennig and Ghazoul, 2011). The reason for these mixed effects is likely due to differences in the attraction of pollinators in-general at the patch-scale, and consistency of individual pollinator preferences, once present. Patches of diverse or abundant flowers (Lázaro and Totland, 2010) may attract a species rich and diverse suite of pollinators, that are then available for interaction (Albrecht et al., 2007; Hennig and Ghazoul, 2011; Lowenstein et al., 2014; Theodorou et al., 2016). However, pollinators are relatively consistent in their preferences (Lázaro and Totland, 2010) and the relative attractiveness of different plant species may generate competition within a patch (Hennig and Ghazoul, 2011). For example, Lowenstein et al. (2015) found little influence of local context on visitation but focal plants were consistently visited by pollinator groups specific to each plant species. Similarly, Lázaro and Totland (2010) found that Bumblebee preferences for Saliva plants were driving visitation to their experimental plots.
Pollinator preferences were also visible in our study, in the way the pollinators interacted with different plants in our phytometre. For example, ants and beetles were predominantly found to utilise the white-flowered plants, and particularly during the first round with the original species palette. This difference was expected based on the design of our phytometre set, similar to pan-trap studies where the colour of the pan trap determines the subset of insects that are attracted (Vrdoljak, 2012). Other phytometre studies (Daniels et al., 2020) have also found that pollinators interacted with plants as predicted by plant–pollinator syndromes. Despite our attempts to select a diverse phytometre set, our phytometre selection contained more plants that were attractive to bees, with relatively fewer plants attractive to ants, beetles and bugs. Previous studies involving cultivated plants attractive to insects have also shown visitation to be dominated by bees (Garbuzov and Ratnieks, 2014; Rollings and Goulson, 2019), potentially indicating a trend for nurseries to select plants that are more beneficial for bees than other pollinator taxa. Indeed, a focus on bees, particularly honeybees as conservation targets has been heavily criticised (Pearson, 2015; Rader et al., 2016), but these are the pollinators that are most often in the public awareness (Smith and Saunders, 2016). This bias in our plant selection might explain the very low detection of other pollinator groups, and the relatively high presence of small bees.
Pollinator behaviour may also be driven by weather which determines activity patterns (Corbet et al., 1993). Insects regulate their activity in order to maintain thermal optimum for flying (Corbet et al., 1993; Kasper et al., 2008) and metabolic needs (Inouye et al., 2015), but the relative optimum may differ between species. For example, hoverflies, for which some species are known to be endothermic (Inouye et al., 2015), appear to be capable of maintaining activity at much lower temperatures than bees, and were more likely to interact with the phytometres at lower temperatures in our study. Our findings also concur with studies that show the activity of flies is significantly decreased during high winds (Inouye et al., 2015), but bees appear to be less affected (Polatto et al., 2014). Many taxa also prefer direct irradiation (i.e., full sun positions; Herrera, 1995; Inouye et al., 2015; Clarke and Robert, 2018), explaining the increase in detection we observed on sunny days. Differences in detection probability across the sampling season were prevalent across all functional groups, indicating the potential of complementarity between species and the importance of optimal sampling weather, and accounting for seasonal fluctuations in activity. Taken together, our results suggest that optimal sampling times might differ for different pollinator groups. In particular, avoiding sampling on traditionally “bad” sampling days in cold temperatures may miss activity of syrphids and other flies that are more active on these days.
Implications for Greenspace Design to Encourage Plant Insect Interactions
Our results suggest that small-scale habitat conditions that influence the probability of interaction are more important than site context for influencing pollinator visitation. This emphasises that habitats and resources are likely to be used by pollinators, even when provided in small and isolated areas in a dense urban matrix, if pollinator preferences and specific habitat requirements are considered in the design. In general, these findings add to discussions in the literature on the importance of the quality of habitat as well as quantity in the urban landscape [see reviews by Beninde et al. (2015) and Lepczyk et al. (2017)]. There is a real risk of generating greenspaces that attract pollinators without providing viable resources, often referred to as the creation of ecological traps (Lepczyk et al., 2017). Lack of consideration of ecological interaction can, therefore, lead to higher overall maintenance and biodiversity costs associated with urbanisation.
Within greenspaces, designers can encourage interaction by provision of floral resources and unsealed surfaces, which provide nesting habitat or foraging resources for pollinators. Multiple pollinator groups showed sharp increases in occupancy at very low thresholds, indicating that even small amounts of greening can have a positive influence on biodiversity. Small-range insects such as bees in the Halictidae family may be capable of living their entire lives on a small site (Antoine and Forrest, 2021), and for some herbivores a single plant may be its entire habitat. In addition, traditionally weedy and unmanaged sections of greenspaces can have a large positive influence for encouraging pollinator visitation. Much of the floral abundance and diversity measured surrounding the plant phytometres on unsealed surfaces were grass flowering weeds, which supports previous research on the importance of weeds in urban landscapes (Lowenstein et al., 2019). High insect activity in these patches facilitated increased pollinator visitation.
However, attention must be paid to the internal distribution and connectivity of resources, particularly on very large sites. Placement of the phytometre set on sealed surfaces decreased detection of insects, indicating not only that sealed areas can decrease available resources, but these may also form barriers to accessing provided resources. Internal barriers such as roads and paths may dissect the resource landscape in unexpected ways, particularly for small range species. Provision of contiguous areas of unsealed surfaces with abundant floral resources maximises the attraction and quality of habitat compared to the same amount of resources dispersed over a larger area. Therefore, internal dynamics, which are readily influenced by the interface of landscape design and architecture, are an important area of future study.
Similarly, spatial placement of nesting habitat within reach of floral or other food resources is important, and the two cannot be treated in isolation. For many small-range species, this will mean having both resources co-located within the same site, but for some long-range foraging species, the spatial arrangement of habitat patches within the broader landscape will also be important. In our study, the latter was true for adult butterflies and beetles, which responded positively to increased connectivity. Co-location of resources will require coordination both within a site that has multiple functions, and between sites across a city landscape. On the topic of habitat co-ordination, the idea of “habitat zoning” has been previously proposed to increase the total contiguous habitat area in a city (Goddard et al., 2010).
The microclimate of a site is also important for influencing pollinator activity and had a significant impact on detection of pollinators on our phytometre set. Designers should be aware of how structural changes to greenspace designs can influence local climatic conditions and be careful to ensure that floral resources are provided in sunny and wind-sheltered positions to encourage higher pollinator interaction. Habitat structure is important for creating shelter for many bird and insect species (Beninde et al., 2015), but the impact of different structural vegetation designs on connectivity and discoverability of resources is much less well known.
Finally, plant identity has an impact on the probability of interaction, and designers should be aware of the different requirements of pollinators with different preferences. We have used several commonly planted exotic and commercially available species but using native plants may encourage a more diverse range of pollinator interactions (Berthon et al., 2021), based on catering for locally evolved preferences and specialised relationships (Bascompte and Jordano, 2007). However, this study has focused on functional relationships, and, as in other studies, our results suggest that pollination syndromes can be a useful guide for designing for a diverse range of pollinator species (Geslin et al., 2013; Daniels et al., 2020). Informative consideration of pollinator syndromes combined with an understanding of local pollinator preferences should be factors shaping plant choice decisions in cities. This includes accounting for shifting preferences at different life stages, e.g., host plants for butterfly larvae (Jain et al., 2021). In circumstances where knowledge of specific interactions or preferences are lacking or design decisions are not targeting particular species but a diverse pollinator community the use of a wide variety of flowers with differing pollinator syndromes is encouraged.
Data Availability Statement
The raw data supporting the conclusions of this article will be made available by the authors, without undue reservation.
Author Contributions
SM, WW, AF, and KB conceived and planned the experiments. KB and AF carried out the experiments. KB analysed the data and took the lead in writing the manuscript. SB encouraged KB to investigate the greenspace design implications and assisted in development of the underpinning theoretical framework. All authors provided critical feedback and helped shape the research, analysis, and manuscript.
Funding
This research was supported by the Australian Government through the Australian Research Council’s Linkage Projects funding scheme (project LP160100324). Fieldwork for this project was funded through the “Green Talents” program of the German Federal Ministry of Education (BMBF). The plants included in the experiments were purchased by the Terrestrial Ecology Research Group and housed at the Technical University of Munich facilities.
Conflict of Interest
The authors declare that the research was conducted in the absence of any commercial or financial relationships that could be construed as a potential conflict of interest.
Publisher’s Note
All claims expressed in this article are solely those of the authors and do not necessarily represent those of their affiliated organizations, or those of the publisher, the editors and the reviewers. Any product that may be evaluated in this article, or claim that may be made by its manufacturer, is not guaranteed or endorsed by the publisher.
Acknowledgments
We thank Francisco Encinas-Viso, David Hamilton, and the online unmarked Google community for sharing advice and code for occupancy-detection modelling, and model fit analysis in R.
Supplementary Material
The Supplementary Material for this article can be found online at: https://www.frontiersin.org/articles/10.3389/fevo.2021.703311/full#supplementary-material
References
Alberti, M. (2015). Eco-evolutionary dynamics in an urbanizing planet. Trends Ecol. Evol. 30, 114–126. doi: 10.1016/j.tree.2014.11.007
Albrecht, M., Duelli, P., Müller, C., Kleijn, D., and Schmid, B. (2007). The Swiss agri-environment scheme enhances pollinator diversity and plant reproductive success in nearby intensively managed farmland. J. Appl. Ecol. 44, 813–822. doi: 10.1111/j.1365-2664.2007.01306.x
Antoine, C. M., and Forrest, J. R. (2021). Nesting habitat of ground-nesting bees: a review. Ecol. Entomol. 46, 143–159.
Baguette, M., Blanchet, S., Legrand, D., Stevens, V. M., and Turlure, C. (2013). Individual dispersal, landscape connectivity and ecological networks. Biol. Rev. Camb. Philos. Soc. 88, 310–326. doi: 10.1111/brv.12000
Baldock, K. C., Goddard, M. A., Hicks, D. M., Kunin, W. E., Mitschunas, N., Osgathorpe, L. M., et al. (2015). Where is the UK’s pollinator biodiversity? The importance of urban areas for flower-visiting insects. Proc. R. Soc. Biol. Sci. 282:20142849. doi: 10.1098/rspb.2014.2849
Bascompte, J., and Jordano, P. (2007). Plant-animal mutualistic networks: the architecture of biodiversity. Annu. Rev. Ecol. Evol. Syst. 38, 567–593. doi: 10.1146/annurev.ecolsys.38.091206.095818
Beninde, J., Veith, M., and Hochkirch, A. (2015). Biodiversity in cities needs space: a meta-analysis of factors determining intra-urban biodiversity variation. Ecol. Lett. 18, 581–592. doi: 10.1111/ele.12427
Berthon, K., Thomas, F., and Bekessy, S. (2021). The role of ‘nativeness’ in urban greening to support animal biodiversity. Landsc. Urban Plan. 205:103959. doi: 10.1016/j.landurbplan.2020.103959
Clarke, D., and Robert, D. (2018). Predictive modelling of honey bee foraging activity using local weather conditions. Apidologie 49, 386–396. doi: 10.1007/s13592-018-0565-3
Corbet, S. A., Fussell, M., Ake, R., Fraser, A., Gunson, C., Savage, A., et al. (1993). Temperature and the pollinating activity of social bees. Ecol. Entomol. 18, 17–30. doi: 10.1111/j.1365-2311.1993.tb01075.x
Csardi, G., and Nepusz, T. (2006). The Igraph Software Package for Complex Network Research, InterJournal, Complex Systems 1695. Available online at: https://igraph.org
Daniels, B., Jedamski, J., Ottermanns, R., and Ross-Nickoll, M. (2020). A “plan bee” for cities: pollinator diversity and plant-pollinator interactions in urban green spaces. PLoS One 15:e0235492. doi: 10.1371/journal.pone.0235492
Dietrich, A. L., Nilsson, C., and Jansson, R. (2013). Phytometers are underutilised for evaluating ecological restoration. Basic Appl. Ecol. 14, 369–377. doi: 10.1016/j.baae.2013.05.008
Diniz, M. F., Cushman, S. A., Machado, R. B., and Júnior, P. D. M. (2020). Landscape connectivity modeling from the perspective of animal dispersal. Landsc. Ecol. 35, 41–58. doi: 10.1007/s10980-019-00935-3
Faeth, S. H., Bang, C., and Saari, S. (2011). Urban biodiversity: patterns and mechanisms. Ann. N. Y. Acad. Sci. 1223, 69–81. doi: 10.1111/j.1749-6632.2010.05925.x
Fenster, C. B., Armbruster, W. S., Wilson, P., Dudash, M. R., and Thomson, J. D. (2004). Pollination syndromes and floral specialization. J. Annu. Rev. Ecol. Evol. Syst. 35, 375–403.
Fiske, I., and Chandler, R. (2011). unmarked: an R package for fitting hierarchical models of wildlife occurrence and abundance. J. Stat. Softw. 43, 1–23.
Frank, A. (2018). Pollinators on Public Squares in an Urban Environment: Effects of Square Properties on Activity Patterns and Diversity. München: Technical University of Munich.
Garbuzov, M., and Ratnieks, F. L. W. (2014). Quantifying variation among garden plants in attractiveness to bees and other flower-visiting insects. Funct. Ecol. 28, 364–374. doi: 10.1111/1365-2435.12178
Garrard, G. E., Williams, N. S., Mata, L., Thomas, J., and Bekessy, S. A. (2018). Biodiversity sensitive urban design. Conserv. Lett. 11:e12411. doi: 10.1111/conl.12411
Geslin, B., Gauzens, B., Thebault, E., and Dajoz, I. (2013). Plant pollinator networks along a gradient of urbanisation. PLoS One 8:e63421. doi: 10.1371/journal.pone.0063421
Goddard, M. A., and Dougill, A. J. and Benton, T. G. (2010). Scaling up from gardens: biodiversity conservation in urban environments. Trends Ecol. Evol. 25, 90–98. doi: 10.1016/j.tree.2009.07.016
Guillera-Arroita, G., Lahoz-Monfort, J. J., Mackenzie, D. I., Wintle, B. A., and Mccarthy, M. A. (2014). Ignoring imperfect detection in biological surveys is dangerous: a response to ‘fitting and interpreting occupancy models’. PLoS One 9:e99571. doi: 10.1371/journal.pone.0099571
Hall, D. M., Camilo, G. R., Tonietto, R. K., Ollerton, J., Ahrne, K., Arduser, M., et al. (2017). The city as a refuge for insect pollinators. Conserv. Biol. 31, 24–29. doi: 10.1111/cobi.12840
Harmon-Threatt, A. (2020). Influence of nesting characteristics on health of wild bee communities. Annu. Rev. Entomol. 65, 39–56. doi: 10.1146/annurev-ento-011019-024955
Harrison, T., and Winfree, R. (2015). Urban drivers of plant-pollinator interactions. Funct. Ecol. 29, 879–888. doi: 10.1111/1365-2435.12486
Hennig, E. I., and Ghazoul, J. (2011). Plant–pollinator interactions within the urban environment. Perspect. Plant Ecol. Evol. Syst. 13, 137–150. doi: 10.1016/j.ppees.2011.03.003
Herrera, C. M. (1995). Microclimate and individual variation in pollinators: flowering plants are more than their flowers. Ecology 76, 1516–1524. doi: 10.2307/1938153
Holt, J. R., Wilson, P., and Brigham, C. A. (2014). A test of density-dependent pollination within three populations of endangered Pentachaeta lyonii. J. Pollinat. Ecol. 12, 95–100. doi: 10.26786/1920-7603(2014)3
Inouye, D. W., Larson, B. M., Ssymank, A., and Kevan, P. G. (2015). Flies and flowers III: ecology of foraging and pollination. J. Pollinat. Ecol. 16, 115–133. doi: 10.26786/1920-7603(2015)15
IPBES (2019). Global Assessment Report on Biodiversity and Ecosystem Services of the Intergovernmental Science-Policy Platform on Biodiversity and Ecosystem Services, eds E. S. Brondizio, J. Settele, S. Díaz, and H. T. Ngo (Bonn: IPBES Secretariat).
Jain, A., Zeng, Y., and Webb, E. L. (2021). Critical dependence of butterflies on a non-native host plant in the urban tropics. Front. Ecol. Evol. 9:655012. doi: 10.3389/fevo.2021.655012
Jedrzejewska-Szmek, K., and Zych, M. (2013). Flower-visitor and pollen transport networks in a large city: structure and properties. Arthropod Plant Interact. 7, 503–516. doi: 10.1007/s11829-013-9274-z
Johnston, A., Fink, D., Hochachka, W. M., and Kelling, S. (2018). Estimates of observer expertise improve species distributions from citizen science data. Methods Ecol. Evol. 9, 88–97. doi: 10.1111/2041-210x.12838
Jones, E. L., and Leather, S. R. (2013). Invertebrates in urban areas: a review. Eur. J. Entomol. 109, 463–478. doi: 10.14411/eje.2012.060
Kasper, M. L., Reeson, A. F., Mackay, D. A., and Austin, A. D. (2008). Environmental factors influencing daily foraging activity of Vespula germanica (Hymenoptera, Vespidae) in Mediterranean Australia. Insectes Soc. 55, 288–295. doi: 10.1007/s00040-008-1004-7
Lázaro, A., and Totland, Ø (2010). Local floral composition and the behaviour of pollinators: attraction to and foraging within experimental patches. J. Am. J. Bot. 35, 652–661. doi: 10.1111/j.1365-2311.2010.01223.x
Lele, S. R., Merrill, E. H., Keim, J., and Boyce, M. S. (2013). Selection, use, choice and occupancy: clarifying concepts in resource selection studies. J. Anim. Ecol. 82, 1183–1191. doi: 10.1111/1365-2656.12141
Lepczyk, C. A., Aronson, M. F., Evans, K. L., Goddard, M. A., Lerman, S. B., and Macivor, J. S. (2017). Biodiversity in the city: fundamental questions for understanding the ecology of urban green spaces for biodiversity conservation. BioScience 67, 799–807. doi: 10.1093/biosci/bix079
Lowenstein, D., Matteson, K., Xiao, I., Silva, A., and Minor, E. (2014). Humans, bees, and pollination services in the city the case of Chicago, IL (USA). Biodivers. Conserv. 23, 2857–2874. doi: 10.1007/s10531-014-0752-0
Lowenstein, D. M., Matteson, K. C., and Minor, E. S. (2015). Diversity of wild bees supports pollination services in an urbanized landscape. Oecologia 179, 811–821. doi: 10.1007/s00442-015-3389-0
Lowenstein, D. M., Matteson, K. C., and Minor, E. S. (2019). Evaluating the dependence of urban pollinators on ornamental, non-native, and ‘weedy’floral resources. Urban Ecosyst. 22, 293–302. doi: 10.1007/s11252-018-0817-z
Lower, W. R., Gorsuch, J. W., and Hughes, J. (1997). Plants for Environmental Studies. Boca Raton, FL: CRC Press.
MacKenzie, D. I, Nichols, J. D., Sutton, N., Kawanishi, K., and Bailey, L. L. (2005). Improving inferences in population studies of rare species that are detected imperfectly. Ecology 86, 1101–1113. doi: 10.1890/04-1060
Mata, L., Goula, M., and Hahs, A. K. (2014). Conserving insect assemblages in urban landscapes: accounting for species-specific responses and imperfect detection. J. Insect Conserv. 18, 885–894. doi: 10.1007/s10841-014-9696-7
Mazerolle, M. J. (2020). AICcmodavg: Model Selection and Multimodel Inference Based on (Q)AIC(c). R pac2007kage Version 2.3-0. Available online at: https://cran.r-project.org/package=AICcmodavg (accessed August 26, 2020).
Mühlbauer, M., Weisser, W., Müller, N., and Meyer, S. (2021). A green design of city squares increases abundance and diversity of birds. Basic Appl. Ecol. doi: 10.1016/j.baae.2021.05.003
Murray, T. E., Kuhlmann, M., and Potts, S. G. (2009). Conservation ecology of bees: populations, species and communities. Apidologie 40, 211–236. doi: 10.1051/apido/2009015
Pearson, G. (2015). You’re Worrying About the Wrong Bees. Wired.com. Available online at: https://www.wired.com/2015/04/youre-worrying-wrong-bees/ (accessed April 20, 2021)
Pellissier, V., Muratet, A., Verfaillie, F., and Machon, N. (2012). Pollination success of Lotus corniculatus (L.) in an urban context. Acta Oecol. 39, 94–100. doi: 10.1016/j.actao.2012.01.008
Polatto, L. P., Chaud-Netto, J., and Alves-Junior, V. V. (2014). Influence of abiotic factors and floral resource availability on daily foraging activity of bees. J. Insect Behav. 27, 593–612. doi: 10.1007/s10905-014-9452-6
Prendergast, K. S., Dixon, K. W., and Bateman, P. W. (2021). Interactions between the introduced European honey bee and native bees in urban areas varies by year, habitat type and native bee guild. Biol. J. Linn. Soc. 133:725. doi: 10.1093/biolinnean/blab024
R Core Team. (2020). R: A Language and Environment for Statistical Computing. Vienna: R Foundation for Statistical Computing.
Rader, R., Bartomeus, I., Garibaldi, L. A., Garratt, M. P. D., Howlett, B. G., Winfree, R., et al. (2016). Non-bee insects are important contributors to global crop pollination. Proc. Natl. Acad. Sci. U. S. A. 113, 146–151.
Rollings, R., and Goulson, D. (2019). Quantifying the attractiveness of garden flowers for pollinators. J. Insect Conserv. 23, 803–817. doi: 10.1007/s10841-019-00177-3
Smith, T. J., and Saunders, M. E. (2016). Honey bees: the queens of mass media, despite minority rule among insect pollinators. Insect Conserv. Divers. 9, 384–390. doi: 10.1111/icad.12178
Steffan-Dewenter, I., Münzenberg, U., Bürger, C., Thies, C., and Tscharntke, T. J. E. (2002). Scale-dependent effects of landscape context on three pollinator guilds. Ecology 83, 1421–1432. doi: 10.1890/0012-9658(2002)083[1421:sdeolc]2.0.co;2
Theodorou, P., Radzevičiūtė, R., Lentendu, G., Kahnt, B., Husemann, M., Bleidorn, C., et al. (2020). Urban areas as hotspots for bees and pollination but not a panacea for all insects. Nat. Commun. 11:576.
Theodorou, P., Radzevièiûtë, R., Settele, J., Schweiger, O., Murray, T. E., and Paxton, R. J. (2016). Pollination services enhanced with urbanization despite increasing pollinator parasitism. Proc. Biol. Sci. 283:20160561. doi: 10.1098/rspb.2016.0561
Threlfall, C. G., Mata, L., Mackie, J. A., Hahs, A. K., Stork, N. E., Williams, N. S. G., et al. (2017). Increasing biodiversity in urban green spaces through simple vegetation interventions. J. Appl. Ecol. 54, 1874–1883. doi: 10.1111/1365-2664.12876
Threlfall, C. G., Walker, K., Williams, N. S. G., Hahs, A. K., Mata, L., Stork, N., et al. (2015). The conservation value of urban green space habitats for Australian native bee communities. Biol. Conserv. 187, 240–248. doi: 10.1016/j.biocon.2015.05.003
Tylianakis, J. M., Rand, T. A., Kahmen, A., Klein, A.-M., Buchmann, N., Perner, J., et al. (2008). Resource heterogeneity moderates the biodiversity-function relationship in real world ecosystems. PLoS Biol. 6:e122. doi: 10.1371/journal.pbio.0060122
Vrdoljak, S. M. (2012). Optimising coloured pan traps to survey flower visiting insects. J. Insect Conserv. 16, 345–354. doi: 10.1007/s10841-011-9420-9
Warton, D. I., Stoklosa, J., Guillera-Arroita, G., Mackenzie, D. I., and Welsh, A. H. (2017). Graphical diagnostics for occupancy models with imperfect detection. Methods Ecol. Evol. 8, 408–419. doi: 10.1111/2041-210x.12761
Westphal, C., Bommarco, R., Carré, G., Lamborn, E., Morison, N., Petanidou, T., et al. (2008). Measuring bee diversity in different European habitats and biogeographical regions. Ecol. Monogr. 78, 653–671. doi: 10.1890/07-1292.1
Wickham, H., François, R., Henry, L., and Müller, K. (2020). dplyr: A Grammar of Data Manipulation. R package Version 1.0.2. Available online at: https://CRAN.R-project.org/package=dplyr (accessed June 18, 2021).
Williams, N. M., and Winfree, R. (2013). Local habitat characteristics but not landscape urbanization drive pollinator visitation and native plant pollination in forest remnants. Biol. Conserv. 160, 10–18. doi: 10.1016/j.biocon.2012.12.035
Woodcock, T. S., Pekkola, L. J., Dawson, C., Gadallah, F. L., and Kevan, P. G. (2014). Development of a pollination service measurement (PSM) method using potted plant phytometry. Environ. Monit. Assess. 186, 5041–5057. doi: 10.1007/s10661-014-3758-x
Zurbuchen, A., Landert, L., Klaiber, J., Müller, A., Hein, S., and Dorn, S. (2010). Maximum foraging ranges in solitary bees: only few individuals have the capability to cover long foraging distances. Biol. Conserv. 143, 669–676. doi: 10.1016/j.biocon.2009.12.003
Keywords: pollinator, greenspace design, detection, occupancy, floral resources, interaction
Citation: Berthon K, Meyer ST, Thomas F, Frank A, Weisser WW and Bekessy S (2021) Small-Scale Habitat Conditions Are More Important Than Site Context for Influencing Pollinator Visitation. Front. Ecol. Evol. 9:703311. doi: 10.3389/fevo.2021.703311
Received: 30 April 2021; Accepted: 26 July 2021;
Published: 01 September 2021.
Edited by:
Martin Drechsler, Helmholtz Centre for Environmental Research (UFZ), GermanyReviewed by:
Jennifer Lesley Silcock, The University of Queensland, AustraliaAntonio T. Monteiro, University of Lisbon, Portugal
Copyright © 2021 Berthon, Meyer, Thomas, Frank, Weisser and Bekessy. This is an open-access article distributed under the terms of the Creative Commons Attribution License (CC BY). The use, distribution or reproduction in other forums is permitted, provided the original author(s) and the copyright owner(s) are credited and that the original publication in this journal is cited, in accordance with accepted academic practice. No use, distribution or reproduction is permitted which does not comply with these terms.
*Correspondence: Katherine Berthon, a2F0aGVyaW5lLmJlcnRob25Acm1pdC5lZHUuYXU=