Regional Patterns of Late Medieval and Early Modern European Building Activity Revealed by Felling Dates
 Fredrik Charpentier Ljungqvist1,2,3*†
  Andrea Seim4,5†
  Willy Tegel4,6
  Paul J. Krusic7,8
  Claudia Baittinger9 Christelle Belingard10
  Mauro Bernabei11 Niels Bonde9 Paul Borghaerts12 Yann Couturier13 Anne Crone14 Sjoerd van Daalen15 Aoife Daly16
  Petra Doeve17 Marta Domínguez-Delmás18 Jean-Louis Edouard19 Thomas Frank20
  Christian Ginzler21
  Michael Grabner22 Friederike M. Gschwind23 Kristof Haneca24
  Anton Hansson25 Franz Herzig26
  Karl-Uwe Heussner27
  Jutta Hofmann28 David Houbrechts29 Ryszard J. Kaczka30 Tomáš Kolář31,32 Raymond Kontic33
  Tomáš Kyncl34 Vincent Labbas35 Per Lagerås36 Yannick Le Digol13 Melaine Le Roy37 Hanns Hubert Leuschner38 Hans Linderson25
  Francis Ludlow39,40 Axel Marais13 Coralie M. Mills41,42 Mechthild Neyses-Eiden43
  Kurt Nicolussi44 Christophe Perrault45 Klaus Pfeifer46 Michal Rybníček31,32 Andreas Rzepecki43 Martin Schmidhalter47 Mathias Seifert48
  Lisa Shindo49
  Barbara Spyt50 Josué Susperregi51 Helene Løvstrand Svarva52 Terje Thun52 Felix Walder53
  Tomasz Ważny54 Elise Werthe13 Thorsten Westphal20
  Rob Wilson41 Ulf Büntgen7,21,32,55
- 1Department of History, Stockholm University, Stockholm, Sweden
- 2Bolin Centre for Climate Research, Stockholm University, Stockholm, Sweden
- 3Swedish Collegium for Advanced Study, Uppsala, Sweden
- 4Chair of Forest Growth and Dendroecology, Institute of Forest Sciences, University of Freiburg, Freiburg, Germany
- 5Department of Botany, University of Innsbruck, Innsbruck, Austria
- 6Amt für Archäologie, Kanton Thurgau, Frauenfeld, Switzerland
- 7Department of Geography, University of Cambridge, Cambridge, United Kingdom
- 8Department of Physical Geography, Stockholm University, Stockholm, Sweden
- 9National Museum of Denmark, Copenhagen, Denmark
- 10GEOLAB, University of Limoges, Limoges, France
- 11Institute of BioEconomy, National Research Council, Trento, Italy
- 12Borghaerts Houtdatering, Easterein, Netherlands
- 13DendroTech, Betton, France
- 14AOC Archaeology Group, Edinburgh, United Kingdom
- 15Van Daalen Dendrochronologie, Deventer, Netherlands
- 16The Saxo Institute, University of Copenhagen, Copenhagen, Denmark
- 17BAAC Archaeology and Building History, Graaf van Solmsweg, Netherlands
- 18Amsterdam School for Heritage, Memory and Material Culture, University of Amsterdam, Amsterdam, Netherlands
- 19CNRS, CCJ, Aix-Marseille Université, Aix-en-Provence, France
- 20Laboratory of Dendroarchaeology, Department of Prehistoric Archaeology, University of Cologne, Cologne, Germany
- 21Swiss Federal Institute for Forest, Snow and Landscape Research WSL, Birmensdorf, Switzerland
- 22Institute of Wood Technology and Renewable Materials, University of Natural Resources and Life Sciences, Vienna, Austria
- 23Büro für Dendrochronologie und Baudenkmalpflege, Planegg, Germany
- 24Flanders Heritage Agency, Brussels, Belgium
- 25The Laboratory for Wood Anatomy and Dendrochronology, Department of Geology, Lund University, Lund, Sweden
- 26Bavarian State Office for Monument Protection, Thierhaupten, Germany
- 27German Archaeological Institute, Berlin, Germany
- 28Jahrringlabor Hofmann, Nürtingen, Germany
- 29Association du Patrimoine Artistique, Brussels, Belgium
- 30Department of Physical Geography and Geoecology, Faculty of Science, Charles University, Prague, Czechia
- 31Department of Wood Science and Technology, Mendel University in Brno, Brno, Czechia
- 32CzechGlobe Global Change Research Institute CAS, Brno, Czechia
- 33Labor Dendron, Basel, Switzerland
- 34DendroLab Brno, Brno, Czechia
- 35Department of Historical Sciences, Art, Archaeology, Heritage, University of Liège, Liège, Belgium, and Royal Institute for Cultural Heritage (KIK-IRPA), Brussels, Belgium
- 36The Archaeologists, National Historical Museums, Lund, Sweden
- 37Climate Change Impacts and Risks in the Anthropocene (C-CIA), Institute for Environmental Sciences, University of Geneva, Geneva, Switzerland
- 38Department of Palynology and Climate Dynamics, Georg-August-University, Göttingen, Germany
- 39Department of History and Trinity Centre for Environmental Humanities, School of Histories and Humanities, Trinity College Dublin, Dublin, Ireland
- 40Department of History and Harvard University Center for the Environment, Harvard University, Cambridge, MA, United States
- 41School of Earth and Environmental Sciences, University of St Andrews, Fife, United Kingdom
- 42Dendrochronicle, Edinburgh, United Kingdom
- 43Generaldirektion Kulturelles Erbe Rheinland-Pfalz, Direktion Rheinisches Landesmuseum Trier, Trier, Germany
- 44Department of Geography, Universität Innsbruck, Innsbruck, Austria
- 45Centre d’Etudes en Dendrochronologie et de Recherche en Ecologie et Paléo-Ecologie, Besançon, France
- 46Labor für Dendrochronologie, Egg, Austria
- 47Dendrosuisse: Labor für Dendrochronologie, Brig-Glis, Switzerland
- 48Archäologischer Dienst Graubünden, Amt für Kultur, Chur, Switzerland
- 49Cluster of Excellence ROOTS, Kiel University, Kiel, Germany
- 50Faculty of Natural Sciences, University of Silesia in Katowice, Katowice, Poland
- 51Arkeolan Foundation, Irun, Spain
- 52The National Laboratory for Age Determination, NTNU University Museum, Norwegian University of Science and Technology, Trondheim, Norway
- 53Competence Center for Underwater Archaeology and Dendrochronology, Zurich, Switzerland
- 54Centre for Research and Conservation of Cultural Heritage, Faculty of Fine Arts, Nicolaus Copernicus University, Toruń, Poland
- 55Department of Geography, Masaryk University, Brno, Czechia
Although variations in building activity are a useful indicator of societal well-being and demographic development, historical datasets for larger regions and longer periods are still rare. Here, we present 54,045 annually precise dendrochronological felling dates from historical construction timber from across most of Europe between 1250 and 1699 CE to infer variations in building activity. We use geostatistical techniques to compare spatiotemporal dynamics in past European building activity against independent demographic, economic, social and climatic data. We show that the felling dates capture major geographical patterns of demographic trends, especially in regions with dense data coverage. A particularly strong negative association is found between grain prices and the number of felling dates. In addition, a significant positive association is found between the number of felling dates and mining activity. These strong associations, with well-known macro-economic indicators from pre-industrial Europe, corroborate the use of felling dates as an independent source for exploring large-scale fluctuations of societal well-being and demographic development. Three prominent examples are the building boom in the Hanseatic League region of northeastern Germany during the 13th century, the onset of the Late Medieval Crisis in much of Europe c. 1300, and the cessation of building activity in large parts of central Europe during armed conflicts such as the Thirty Years’ War (1618–1648 CE). Despite new insights gained from our European-wide felling date inventory, further studies are needed to investigate changes in construction activity of high versus low status buildings, and of urban versus rural buildings, and to compare those results with a variety of historical documentary sources and natural proxy archives.
Introduction
Variations in building activity reflect changing demographic, economic, and social conditions (e.g., Barras, 2009; Aksözen et al., 2017a,b) and, potentially, provide a broad overview of societal well-being over space and time. However, prior to the modern period building activity rates are poorly documented in Europe, precluding the use of written sources for their assessment. An alternative source for estimating building activity rates are large datasets of dendrochronologically obtained felling dates of historical construction timbers. Such data, derived from the efforts of many to date individual constructions in archeological research and cultural heritage work, when collated into an aggregate dataset, can be highly useful for exploring large-scale changes in building activity (e.g., Ljungqvist et al., 2018).
Recent historical scholarship has increasingly employed data from the natural sciences and archeology to understand macro scale changes not readily detectable or quantifiable using documentary sources or traditional archeological materials. Such studies include pollution data from ice-cores as a proxy for mining activity (e.g., McConnell et al., 2019), numbers of shipwrecks to estimate commerce (e.g., Wilson, 2011), pollen to reconstruct agricultural production (e.g., Izdebski et al., 2016), glacier microfossil records to estimate changes in land use (Brugger et al., 2021), ancient DNA to reconstruct migration patterns (e.g., Margaryan et al., 2020), and anthropometric estimates of the biological standard of living from skeleton-based stature measurements (e.g., Kopke and Baten, 2005). These disparate types of data have the potential to detect and analyze patterns of prosperity and hardship in human history (Fischer, 1996), whereas the heterogeneous character of most documentary sources limits their suitability for such studies (see, e.g., Turchin and Nefedov, 2009).
Inferring variations in building activity from annually resolved and absolutely dated felling dates can reveal information about large-scale societal changes. The very large amount of available data in combination with their exact dating to a calendar year makes felling dates unique among non-documentary sources of human activity. Felling dates have hitherto mainly been used to infer large-scale demographic and societal changes only for those periods and regions lacking written sources from which to reconstruct demographic trends, e.g., among the Ancestral Puebloans in the southwestern United States (pioneered by Douglass, 1921, 1929, 1941; more recently, see Bocinsky et al., 2016; Robinson et al., 2021).
In Europe, there are limited examples in archeological and historical research of using felling dates for reconstructing building activity changes at large spatial scales, but several small-scale studies have provided valuable insights into demographic declines or the timing of societal crises (Baillie, 1982, 1995, 1999; Mallory and Baillie, 1988; Schweingruber, 1988; Wrobel and Eckstein, 1993; Nicolussi, 2002; Eckstein, 2007), and also into past settlement and demographic dynamics in the Swiss Alps (Büntgen et al., 2006), the northwestern Carpathian arc (Büntgen et al., 2013), the north-eastern France (Tegel et al., 2016), in Sweden (Bartholin, 1989, 1990; Lagerås et al., 2016), in parts of Norway (Thun and Svarva, 2018), in eastern Austria (Grabner et al., 2018), and Ireland (Brown and Baillie, 2012; Campbell and Ludlow, 2020).
Using 49,640 precisely dated felling dates, between 1250 and 1699 CE, Ljungqvist et al. (2018) identified variations in European building activity, and attempted to quantify the major drivers behind those variations. They found (a) building activity decreased during periods with multiple or severe plague outbreaks, (b) building activity was significantly lower when grain prices were high, (c) first evidence of the Late Medieval Crisis as early as c. 1300 CE and lasting until c. 1415 CE, and (d) building activity decreased abruptly by about 36 percent of prior levels during the Thirty Years’ War (1618–1648 CE). In sum, Ljungqvist et al. (2018) demonstrated how sudden declines in building activity are sensitive indicators of the onset of a crisis. However, the spatial aspects of the timing, duration, and amplitude of decreased building activity associated with the Late Medieval Crisis and the Thirty Years’ War (1618–1648) were not investigated.
To date, no study has attempted to use dendrochronological felling dates from historical construction timbers to investigate the spatial dynamics of past European-scale building activity. This article aims to fill that gap by assessing regional patterns of construction activity during the 1250–1699 CE period in relation to regional demographic, economic, and social conditions. To do so we apply geostatistical analysis to explore regional differences in the number of felling dates to infer the timing, duration, and intensity of periods of crisis and prosperity at different spatial and temporal scales. This study thereby constitutes a considerable extension in scope, and aim, and geographical coverage, compared to Ljungqvist et al. (2018).
Materials and Methods
Felling Dates
We collected 54,045 georeferenced felling dates for the period 1250–1699 from western and central Europe, north of ∼42°N (Figure 1A). This collection is the result of a European-wide collaborative network that includes data from laboratories in Austria, Belgium, Czechia, Denmark, France, Germany, Ireland, Italy, Netherlands, Norway, Poland, Slovakia, Spain, Sweden, Switzerland, and United Kingdom (Table 1). The same criteria as in Ljungqvist et al. (2018) were applied and only data where the last measured tree ring is the terminal ring (so-called waney edge) were used. The determination of the exact year of tree felling is termed waney edge dating (Bannister, 1962). The majority of felling dates were derived from timbers in different parts of buildings such as roof trusses, ceiling joints, basement pillars, etc. A small number of felling dates were obtained from archeological materials (Figure 2).
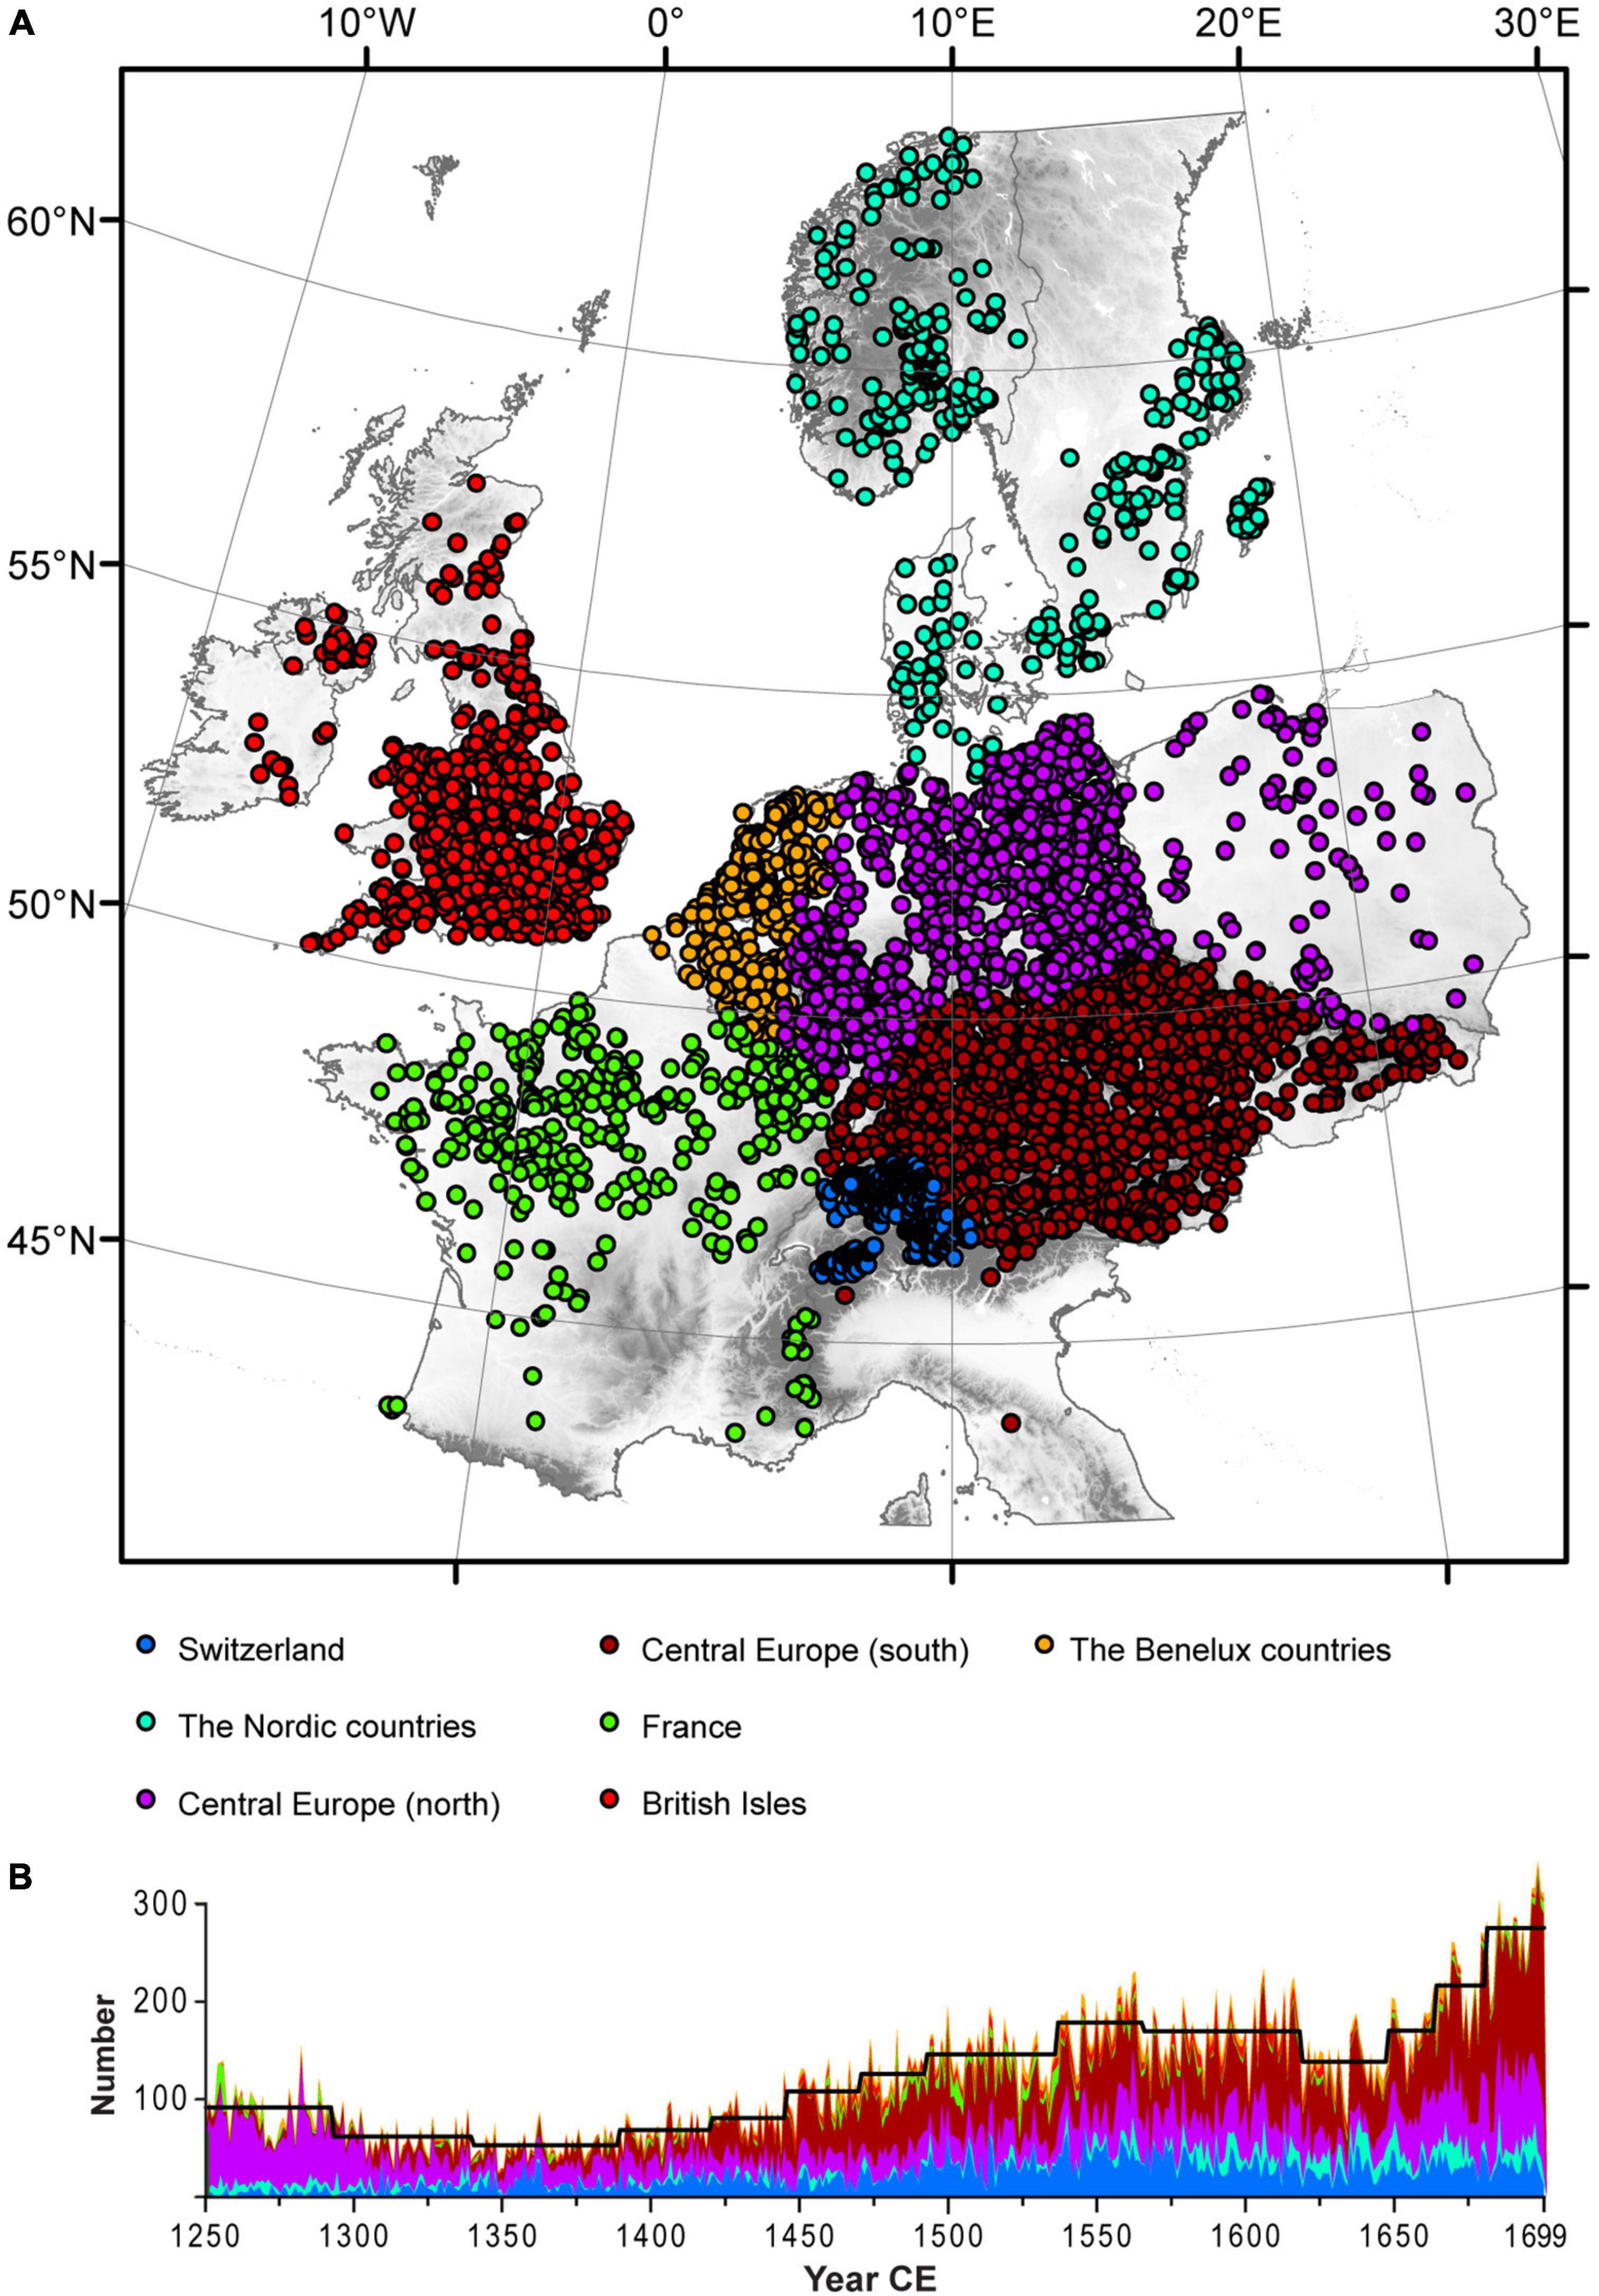
Figure 1. (A) The geographical distribution of all 54,045 tree felling dates 1250–1699 CE from archeological and historical construction timber displayed using the Lambert conformal conic projection in ArcGIS and displayed with contemporary political boundaries. (B) Number of felling dates per year for each regional dataset [color-coded as in (A)] over the period 1250–1699 CE. The black line shows the significant regime shifts in the number of felling dates using the full dataset.
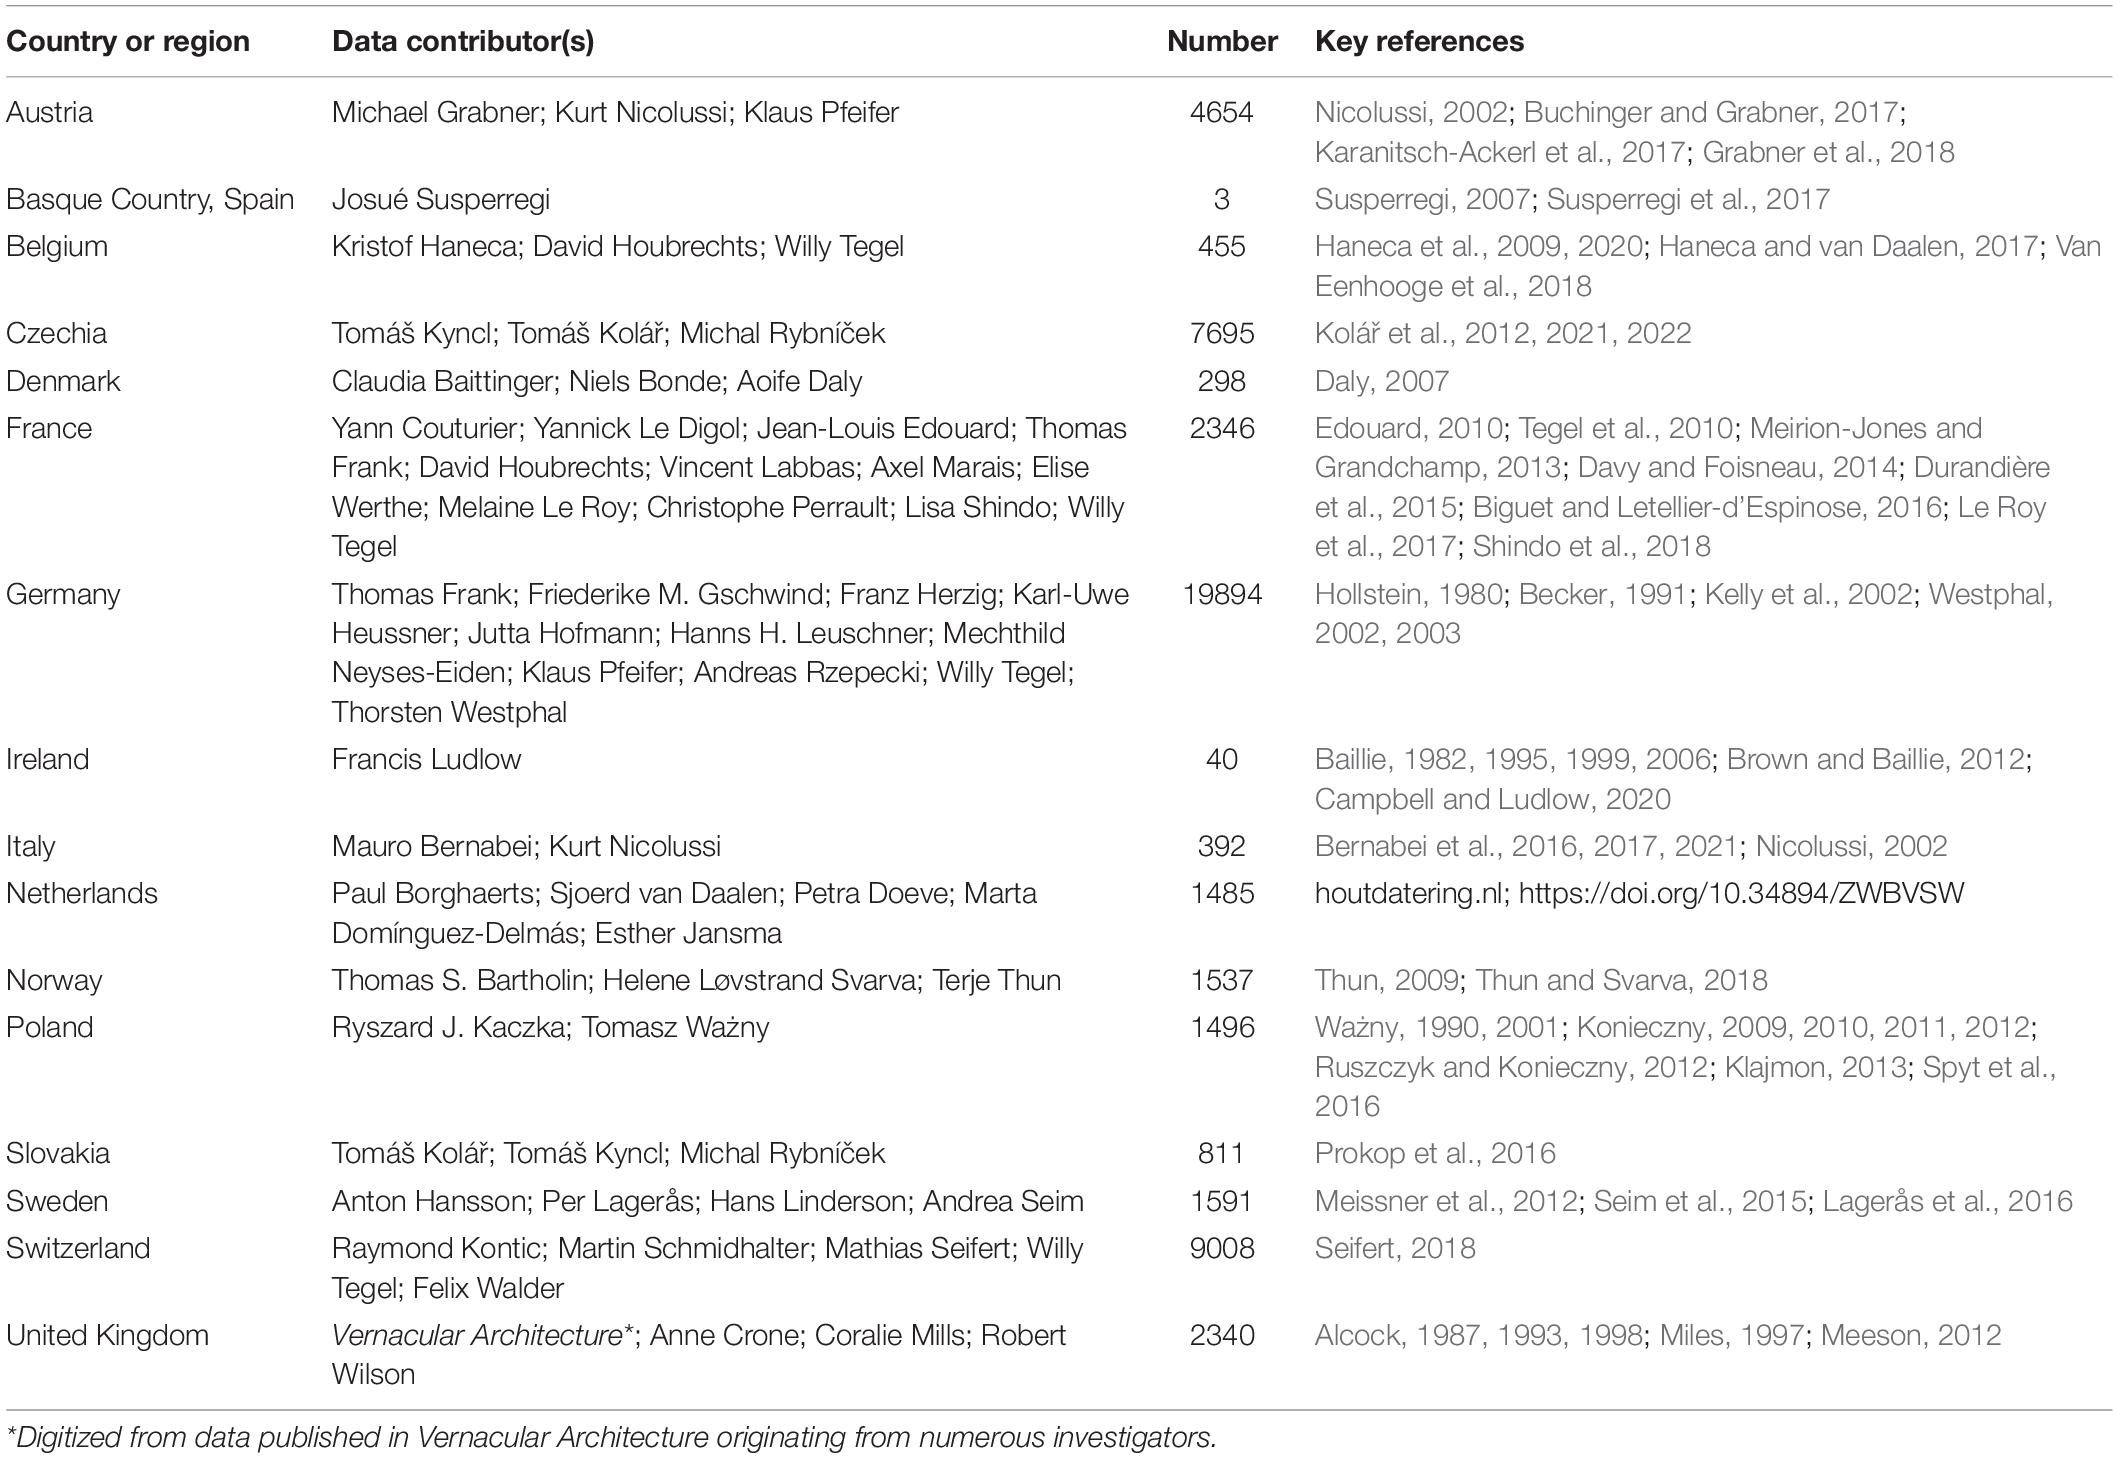
Table 1. List of data contributors of the felling dates, contribution size, the geographical origin of their samples, and key references to the contributed data.
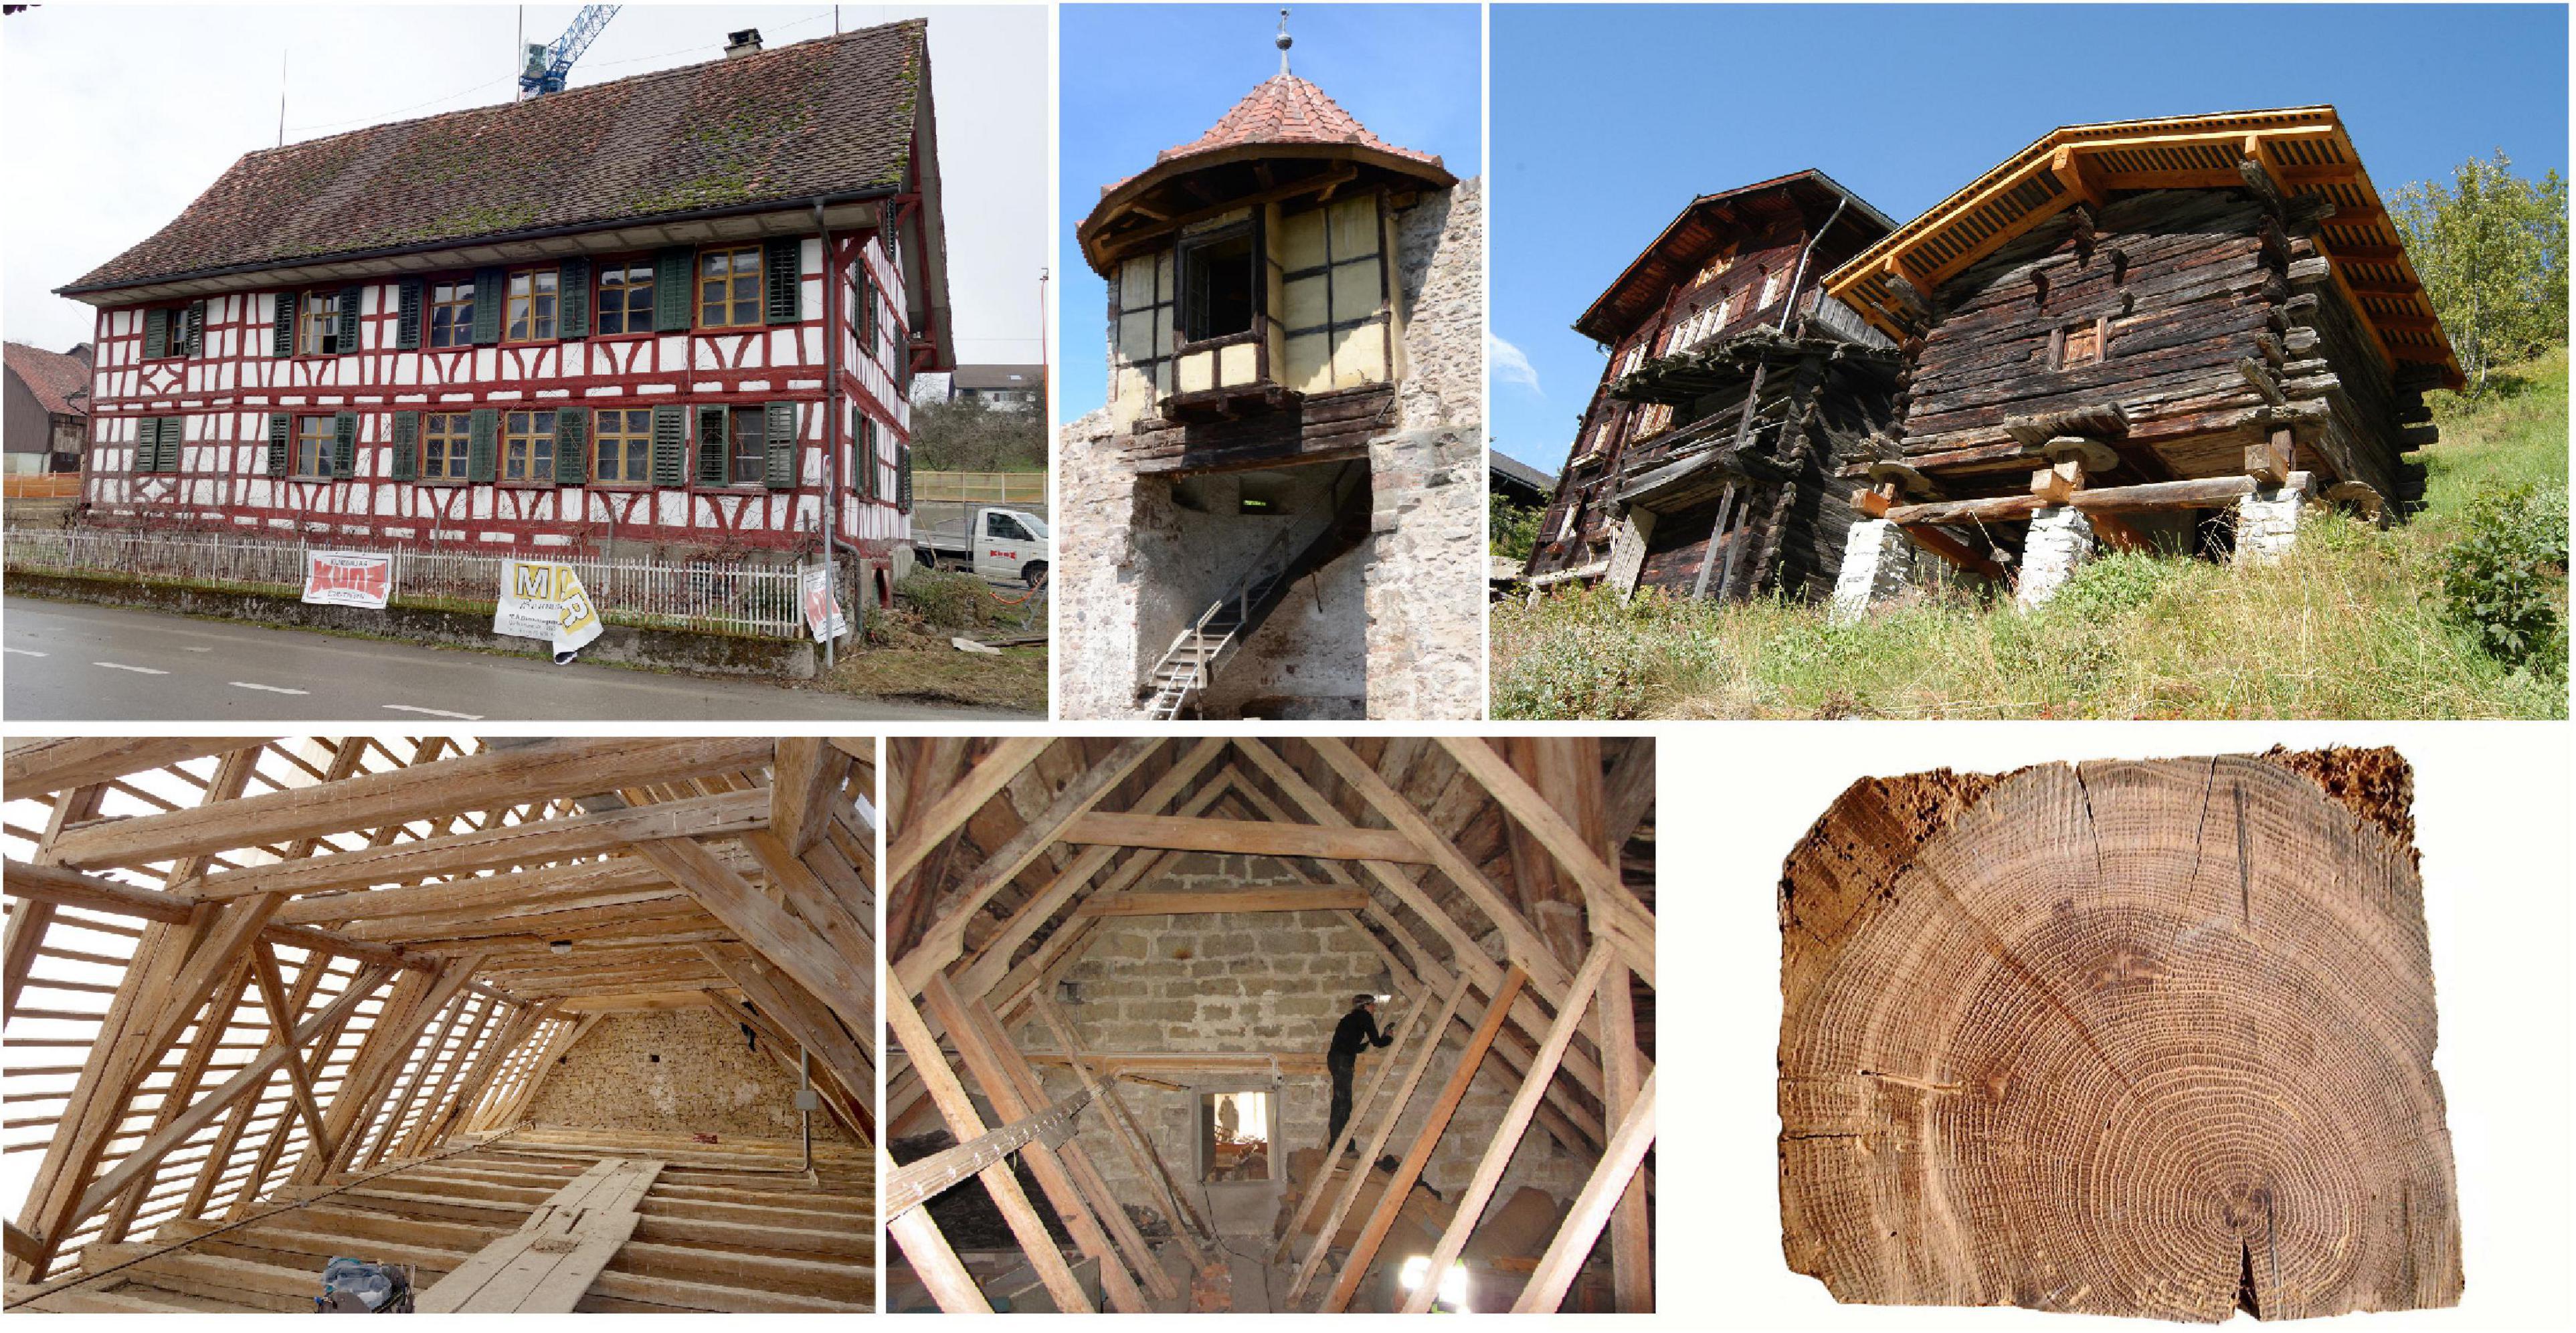
Figure 2. Examples of type of buildings and material used to derive the felling dates from. Top: Half-timbered building in Sonterswil (Thurgau, Switzerland) from the 17th century. Tower of the town wall from Ribeauvillé (Alsace, France) from the 16th century. Log houses in the Lötschental Valley (Valais, Switzerland) from the 18th century. Below: Roof truss of the Chapelle Saint-Denis in Marmoutier (Alsace, France) from the 16th century. Roof truss from the church in Forshem, southwestern Sweden, with a nave from the 12th century and a chancel from the 13th century. Cross section of an oak beam from the Cathedral of Reims (France) from the 13th century.
The tree species used for constructions can vary greatly from region to region. For exterior/exposed applications like bridges and hydraulic engineering, oak (Quercus spp.) and fir (Abies alba Mill.) were used almost exclusively. Conifer species such as fir, spruce (Picea abies L.), pine (Pinus sylvestris L.) and larch (Larix decidua Mill.) were preferred for half-timbering and roof trusses (Tegel et al., 2010). However, the species’ natural distribution also played a decisive role in dictating the application. In the western Euro-Atlantic region, where oak woodlands predominated, this was the species used for construction purposes. In northern Europe, pine was the preferred species for construction timber (e.g., Mills et al., 2017), whereas fir and spruce were mostly used in central Europe (Grabner et al., 2018; Kolář et al., 2021). The natural distribution of larch is limited to the high altitudes of the Alps and parts of the Tatra Mountains (Büntgen et al., 2009), where this species was preferred as construction timber.
Other Datasets Used for Comparisons
Inferred building activity levels were compared with different independent indicators of periods of “crisis” and “prosperity” representative of large spatial scales. The indicators of past economic, societal, and demographic conditions include: (a) atmospheric lead emissions data, an indicator of mining activity (in particular silver production); (b) church construction, an indicator of societies’ available economic surplus as well as demographic trends; (c) grain price data, reflecting the availability of the most important food source and general economic well-being; (d) wine prices, indicating economic conditions and general purchasing power; and (e) consumer price indices, also indicating general purchasing power and thus economic well-being. In addition, we compare building activity levels with reconstructed growing season temperature, soil moisture levels and a reconstruction of southwestern German groundwater levels.
Changes in the amount of atmospheric lead in high-resolution Arctic and alpine ice-cores have been linked to the mining and smelting of raw ores, especially silver, in Europe. Such records have proved to be an indicator of prosperity and crisis (i.e., in times of prosperity, pollution levels were high) over the past two millennia (Hong et al., 1994; Rosman et al., 1997; More et al., 2017; Loveluck et al., 2018; McConnell et al., 2018, 2019; Carvalho and Schulte, 2021). We employ the lead pollution series of McConnell et al. (2019) as proxies for mining activity in western Europe and central Europe.
To a large extent, church building in medieval and early modern times reflected a society’s surplus, although it can be argued the Catholic Church, as an institution and major financial power, was much more resilient to crises that would otherwise affect secular constructions. We employ an independent time-series of urban church building in western Europe, measured in millions of cubic meters per 20-year period, compiled from data of extant church structures (Buringh et al., 2020). The spatial coverage of this time-series is restricted to present-day Italy, France, Switzerland, Germany, the Low Countries, and Great Britain, and it only extends to 1500 CE.
Grain-based foods were by far the most important food source in medieval and early modern Europe (Rahlf, 1996; Bateman, 2015). During medieval and early modern times, the price of grain had a determining effect on the entire economy and the general standard of living (Allen, 2000, 2001). To compare building activity history with the price of grain we used the 300-year detrended European grain price average as published by Ljungqvist et al. (2022). This grain price record consists of 56 series from cities across most of central and western Europe, standardized to z-scores relative to the 1546–1650 period. These data include 25 price series of wheat, 14 of rye, 10 of barley, and of 7 oats. This new price compilation is much more comprehensive than the European grain price average of 19 series from Esper et al. (2017) used in Ljungqvist et al. (2018), and represents a much larger spatial domain. We also calculated an average of multiple wine price series from across Europe (Allen and Unger, 2019), as wine was an important market commodity in much of Europe, and its price level is indicative of the economic conditions on a broad scale (Chilosi and Federico, 2021).
Recognizing that other living costs besides grain and wine affected the population’s purchasing power, and thus economic well-being, we use annual consumer price indices for London (1264–1699), Strasbourg (1386–1699), Krakow (1409–1699) (Allen, 2001), and Stockholm (1290–1699, Edvinsson and Söderberg, 2010) to estimate changes over time in consumer price indices. These indices are highly correlated to changes in real wages (Allen, 2000) and thereby provide an indication of relative societal wealth among ordinary people (De Pleijt and van Zanden, 2016). Despite considerable uncertainties in calculating the annual consumer price indices, we maintain that these indices still capture the economic feasibility to construct new buildings or to undertake major repair of existing ones.
To represent growing season temperature, we used the June–August temperature reconstruction by Luterbacher et al. (2016), as updated by Ljungqvist et al. (2019), resolved on a 5° × 5° grid across Europe. From these data we extracted the grid-cells covering 60°N–40°N by 10°W–30°E. For relative soil moisture availability, we use data from the Old World Drought Atlas (OWDA; Cook et al., 2015). The OWDA is a tree-ring-based reconstruction of annually resolved June–August (JJA) self-calibrating Palmer Drought Severity Index (scPDSI) values (Palmer, 1965; van der Schrier et al., 2011, 2013) resolved on a 0.5° × 0.5° grid across Europe. For obvious reasons, the spatial and temporal extent of both reconstructions is limited by the distribution and length of the tree-ring chronologies available for reconstruction. Consequently, for portions of Europe as one goes further back in time, the quality of the reconstructions decreases (Cook et al., 2015).
For further comparison, we used an annually resolved groundwater level (GWL) reconstruction for the Upper Rhine Valley (Germany and France) derived from tree-ring width data (Tegel et al., 2020). This reconstruction is entirely independent from the tree-ring data used to produce the OWDA. The GWL reconstruction is a proxy for long and short-term hydroclimate variations over western and central Europe, which has been linked to the multi-decadal North Atlantic climate variability (Tegel et al., 2020).
Regional Grouping of the Felling Dates and (Geo)statistical Analyses
Applying quantitative spatial and geostatistical analyses to the felling date data (such as grouping analysis) in ArcMap 10.6 (program package of ArcGIS; ESRI, 2017), produced no distinct regional groups or clusters. Hence, we manually grouped the data, over the period 1250–1699 CE, into seven separate regions in a way that made the most historical sense, acknowledging that any such clustering is to a degree subjective. The seven regions are: (1) the British Isles; (2) the Nordic countries, including Schleswig-Holstein, present-day Germany; (3) France, excluding Alsace, and Basque Country (Spain); (4) the Benelux countries, Belgium, the Netherlands, and Luxembourg; (5) central Europe (north), consisting of Germany, excluding Baden-Württemberg, Bavaria and Schleswig-Holstein, and Poland; (6) central Europe (south), consisting of Alsace, Austria, Baden-Württemberg, Bavaria, Czechia, Slovakia, and South Tyrol (Italy); and (7) Switzerland. The groups are based on natural, geographical, cultural, historical, ecological, social and economic features which, over the period of investigation or at least over longer historical periods, shared close economic relations and cultural unity.
Long-term trends toward fewer available dates in the felling dataset are partly related to a general decrease in the preservation of constructions back in time. This time-dependent constraint must be removed to provide a meaningful construction history. As in Ljungqvist et al. (2018), we thus removed the long-term trends by calculating the ratios between the raw values and 300-year cubic smoothing splines (Cook and Peters, 1981). After removing the long-term trend, the felling date data were transformed to standard normal deviates with a mean of zero and a standard deviation of one.
For correlation statistics all datasets are, when not using the annual values, smoothed using 10-year splines as well as 10-year, non-overlapping, box-car filters. Throughout this study, we use the p < 0.05 significance level for both the Pearson correlation (r) and Spearman rank correlation (rs) coefficients. The fewer available degrees of freedom were taken into consideration when using 10-year smoothed series. For detecting the timing of significant regime shifts, i.e., trends toward increasing or decreasing numbers, we employ the Rodionov (2004) sequential algorithm, as updated by Rodionov (2006) to accommodate autocorrelation, and consider only years with regime shifts significant at the p < 0.05 level. The software is a macro-based implementation for Microsoft Excel (called Regime test shift v6-2). Shifts in the time-series were computed on the mean felling date numbers using the default cut-off length of 20 years and omitting the last 10 years at each end of the time-series.
Heat maps for consecutive 50-year periods between 1250 and 1699, and for periods of 31 years around the Late Medieval Crisis and the Thirty Years’ War, were generated using the software ArcGIS 10.6. Here, the kernel density function in the Spatial Analyst toolbox was applied on the recorded felling date location (i.e., point data) for the above-mentioned periods (DiBiase et al., 2006). We used a search radius of 60 km to estimate the spatial concentrations of the felling dates within the individual periods. The Kernel density maps were reclassified for final comparison. To evaluate the regional impact of the Late Medieval Crisis and the Thirty Years’ War, we calculated the absolute differences in the number of felling dates between the 31-year periods by using the Raster Calculator in the Map Algebra toolbox (Spatial Analyst Tools) in ArcGIS 10.6. Again, the resulting maps were standardized (i.e., reclassified) to make them comparable. Regarding the Thirty Years’ War, only the regions with a population loss of at least 33% (Eickhoff et al., 2012, p. 26) were georeferenced and digitized by us for this purpose.
Results
Patterns of Spatio-Temporal Change in Building Activity
The felling dates show a clear decline just prior to c. 1300 followed by a second decline c. 1340 (Figure 1B). Step-wise increases in building activity subsequently occurred during the late 14th century and throughout the 15th century. This feature is not merely a consequence of increasing data coverage over time, as it is also clearly apparent in the detrended data. Only toward the end of the 15th century did building activity levels become comparable to those of the 13th century. A peak in building activity can be observed in the mid-16th century, followed by a rather pronounced decline. The sharpest, and most distinct decline in building activity coincides with the Thirty Years’ War (1618–1648). By the end of the 17th century building activity reached levels comparable to those of the 13th and mid-16th centuries.
Considerable regional-scale variations in building activity were found. These variations are expressed in the relatively low correlation coefficients between the seven regions (see Figure 3 and Table 2). Exceptions are the strong correlation between the regions central Europe (south) and the British Isles, and between central Europe (south) and central Europe (north). The biggest differences between the regional-scale datasets relate to the timing and duration of the Late Medieval Crisis and the effect of the Thirty Years’ War (1618–1648). On the whole, times of high and low building activity are far from synchronized across regions even though some general patterns can be identified (Table 3). Moreover, the building activity history for the Nordic countries looks rather different from that of the regions on the continent. This may, partly, be related to the lower number of felling dates available for the Nordic countries.
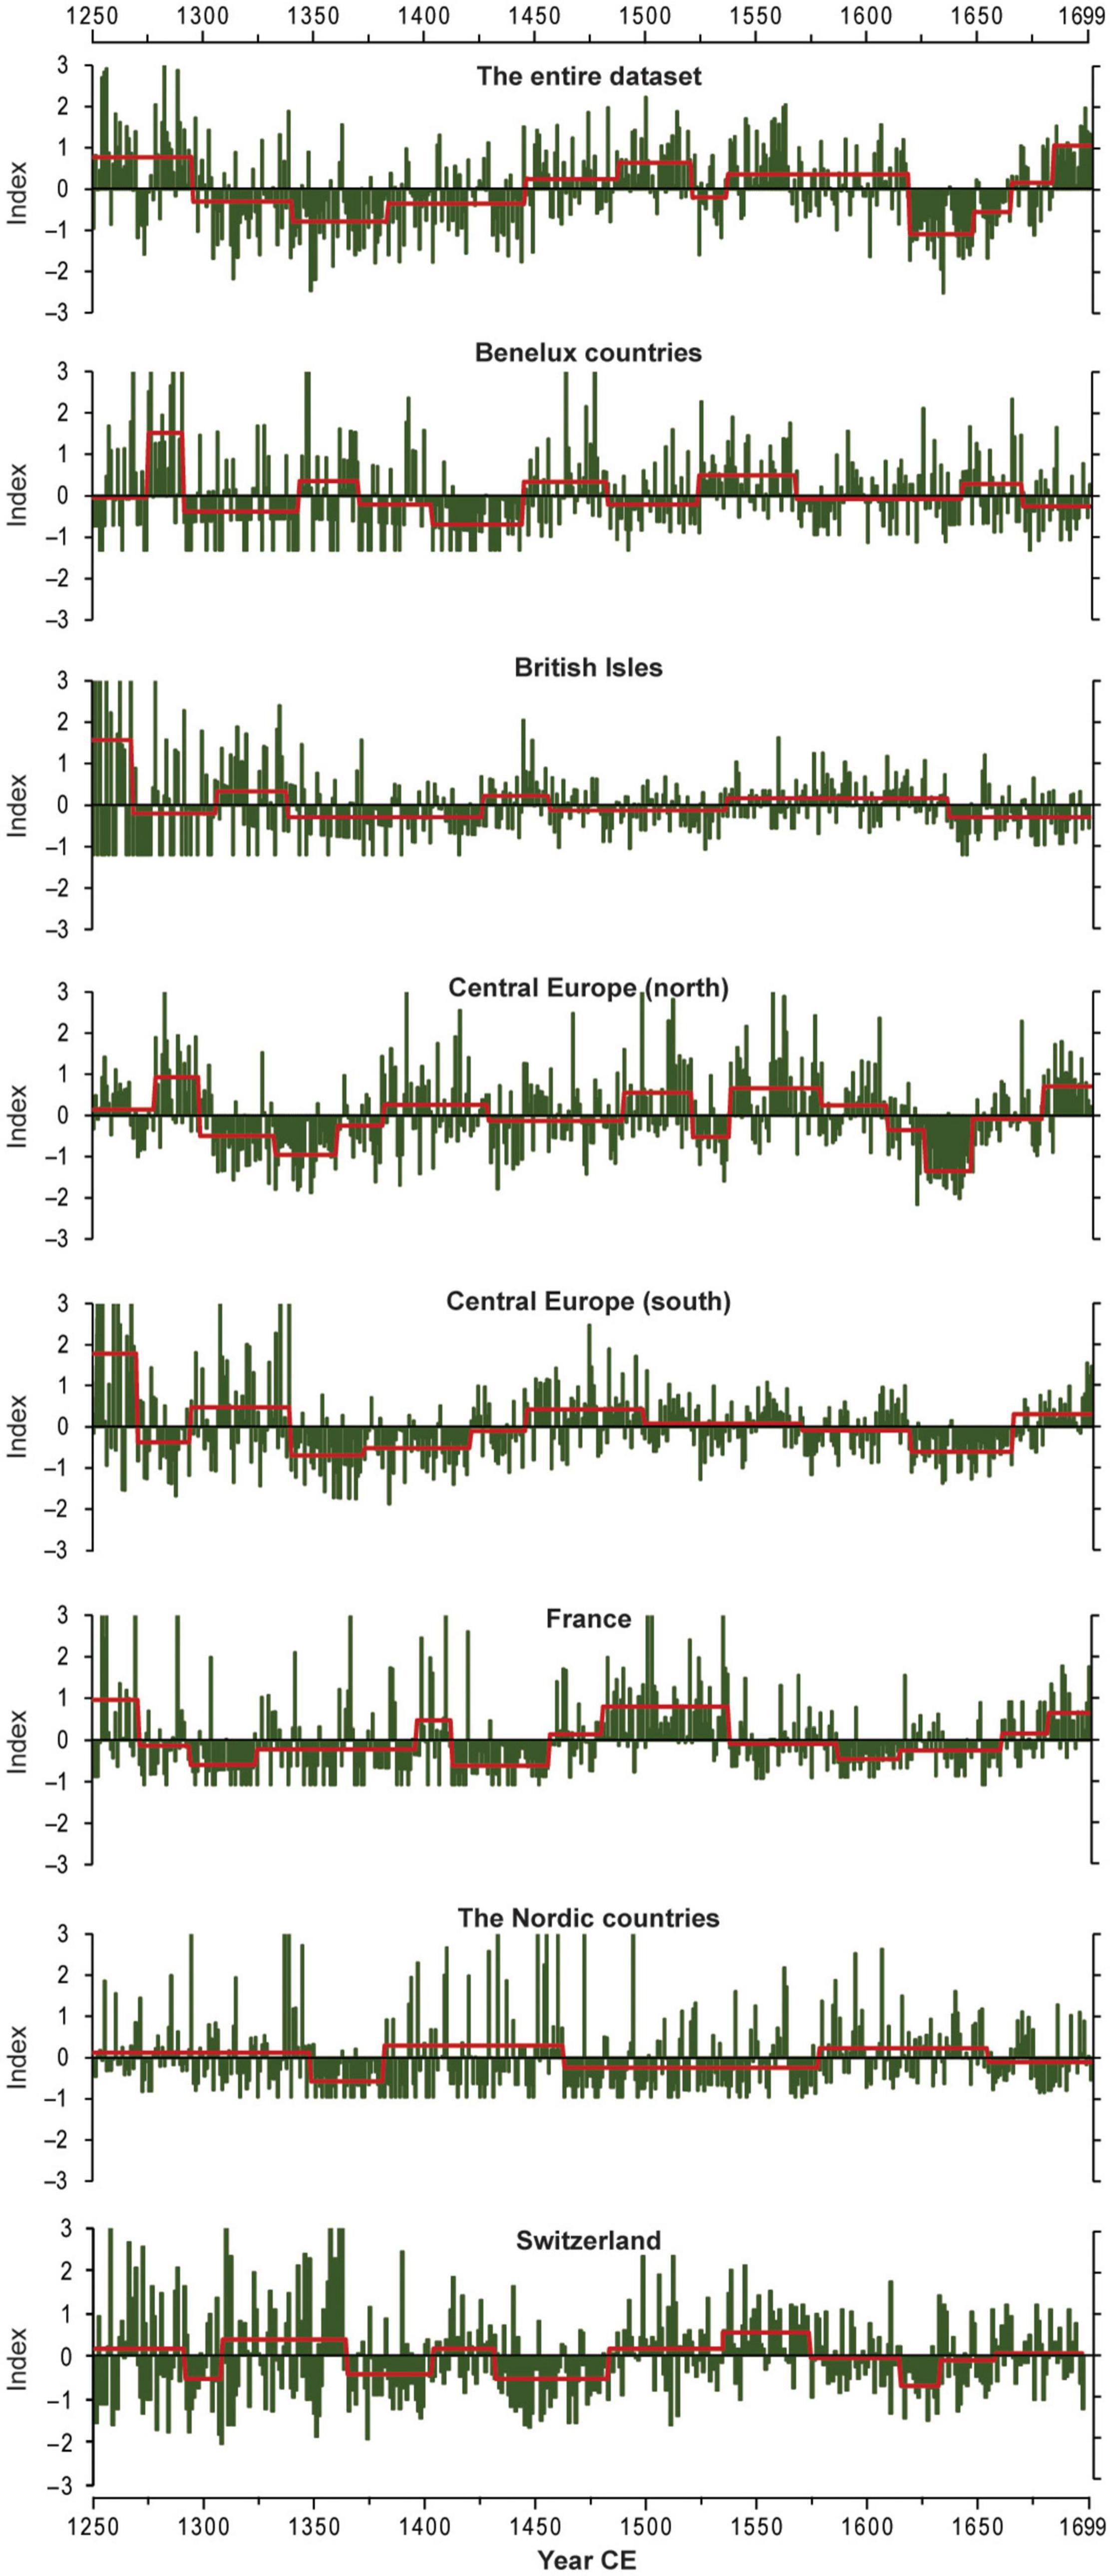
Figure 3. The felling date data 300-year filtered and standardized to z-score values over the entire 1250–1699 CE period for the regional subsets as well as for the full dataset. The red lines show the significant regime shifts in the number of felling dates, using a 30-year cut-off length.
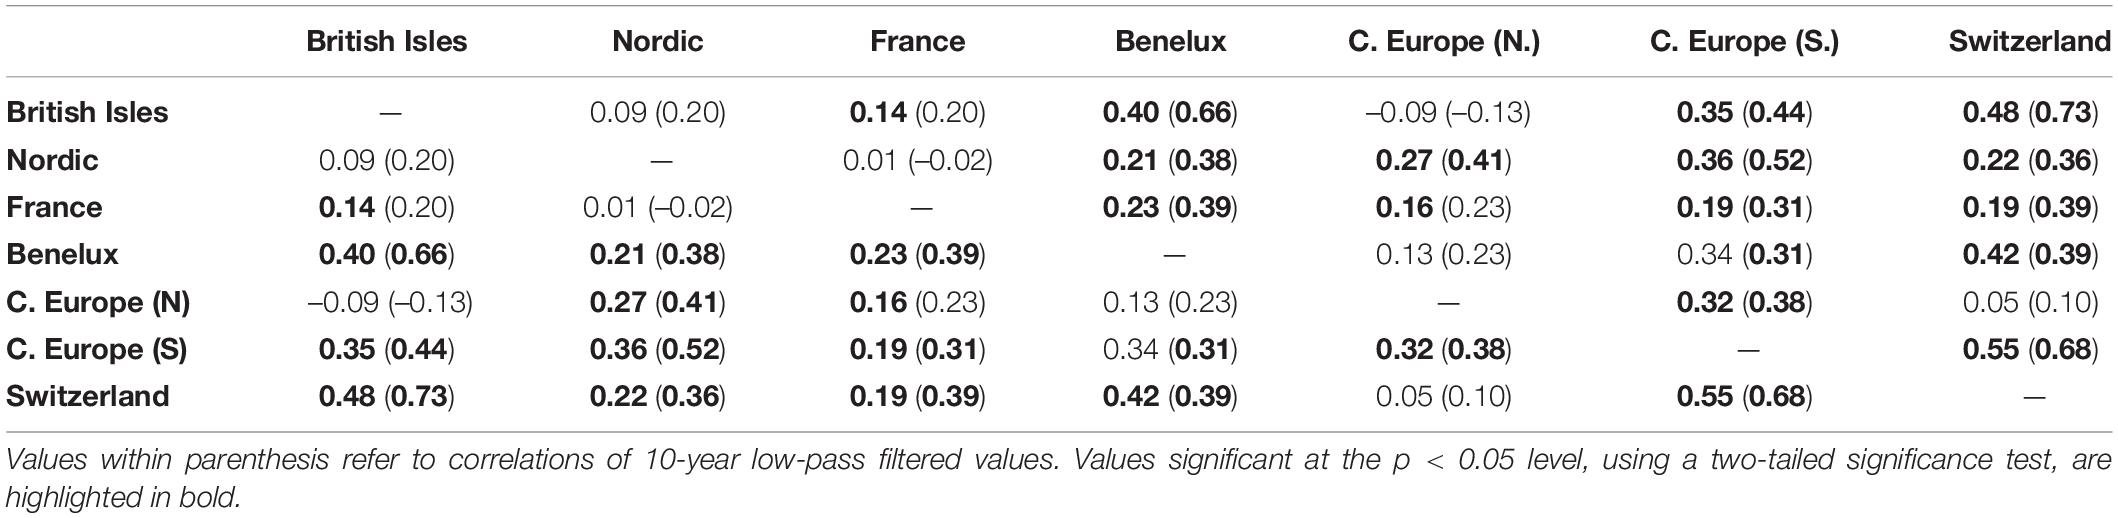
Table 2. Annual correlation between the 300-year filtered and standardized regional subsets of felling dates.
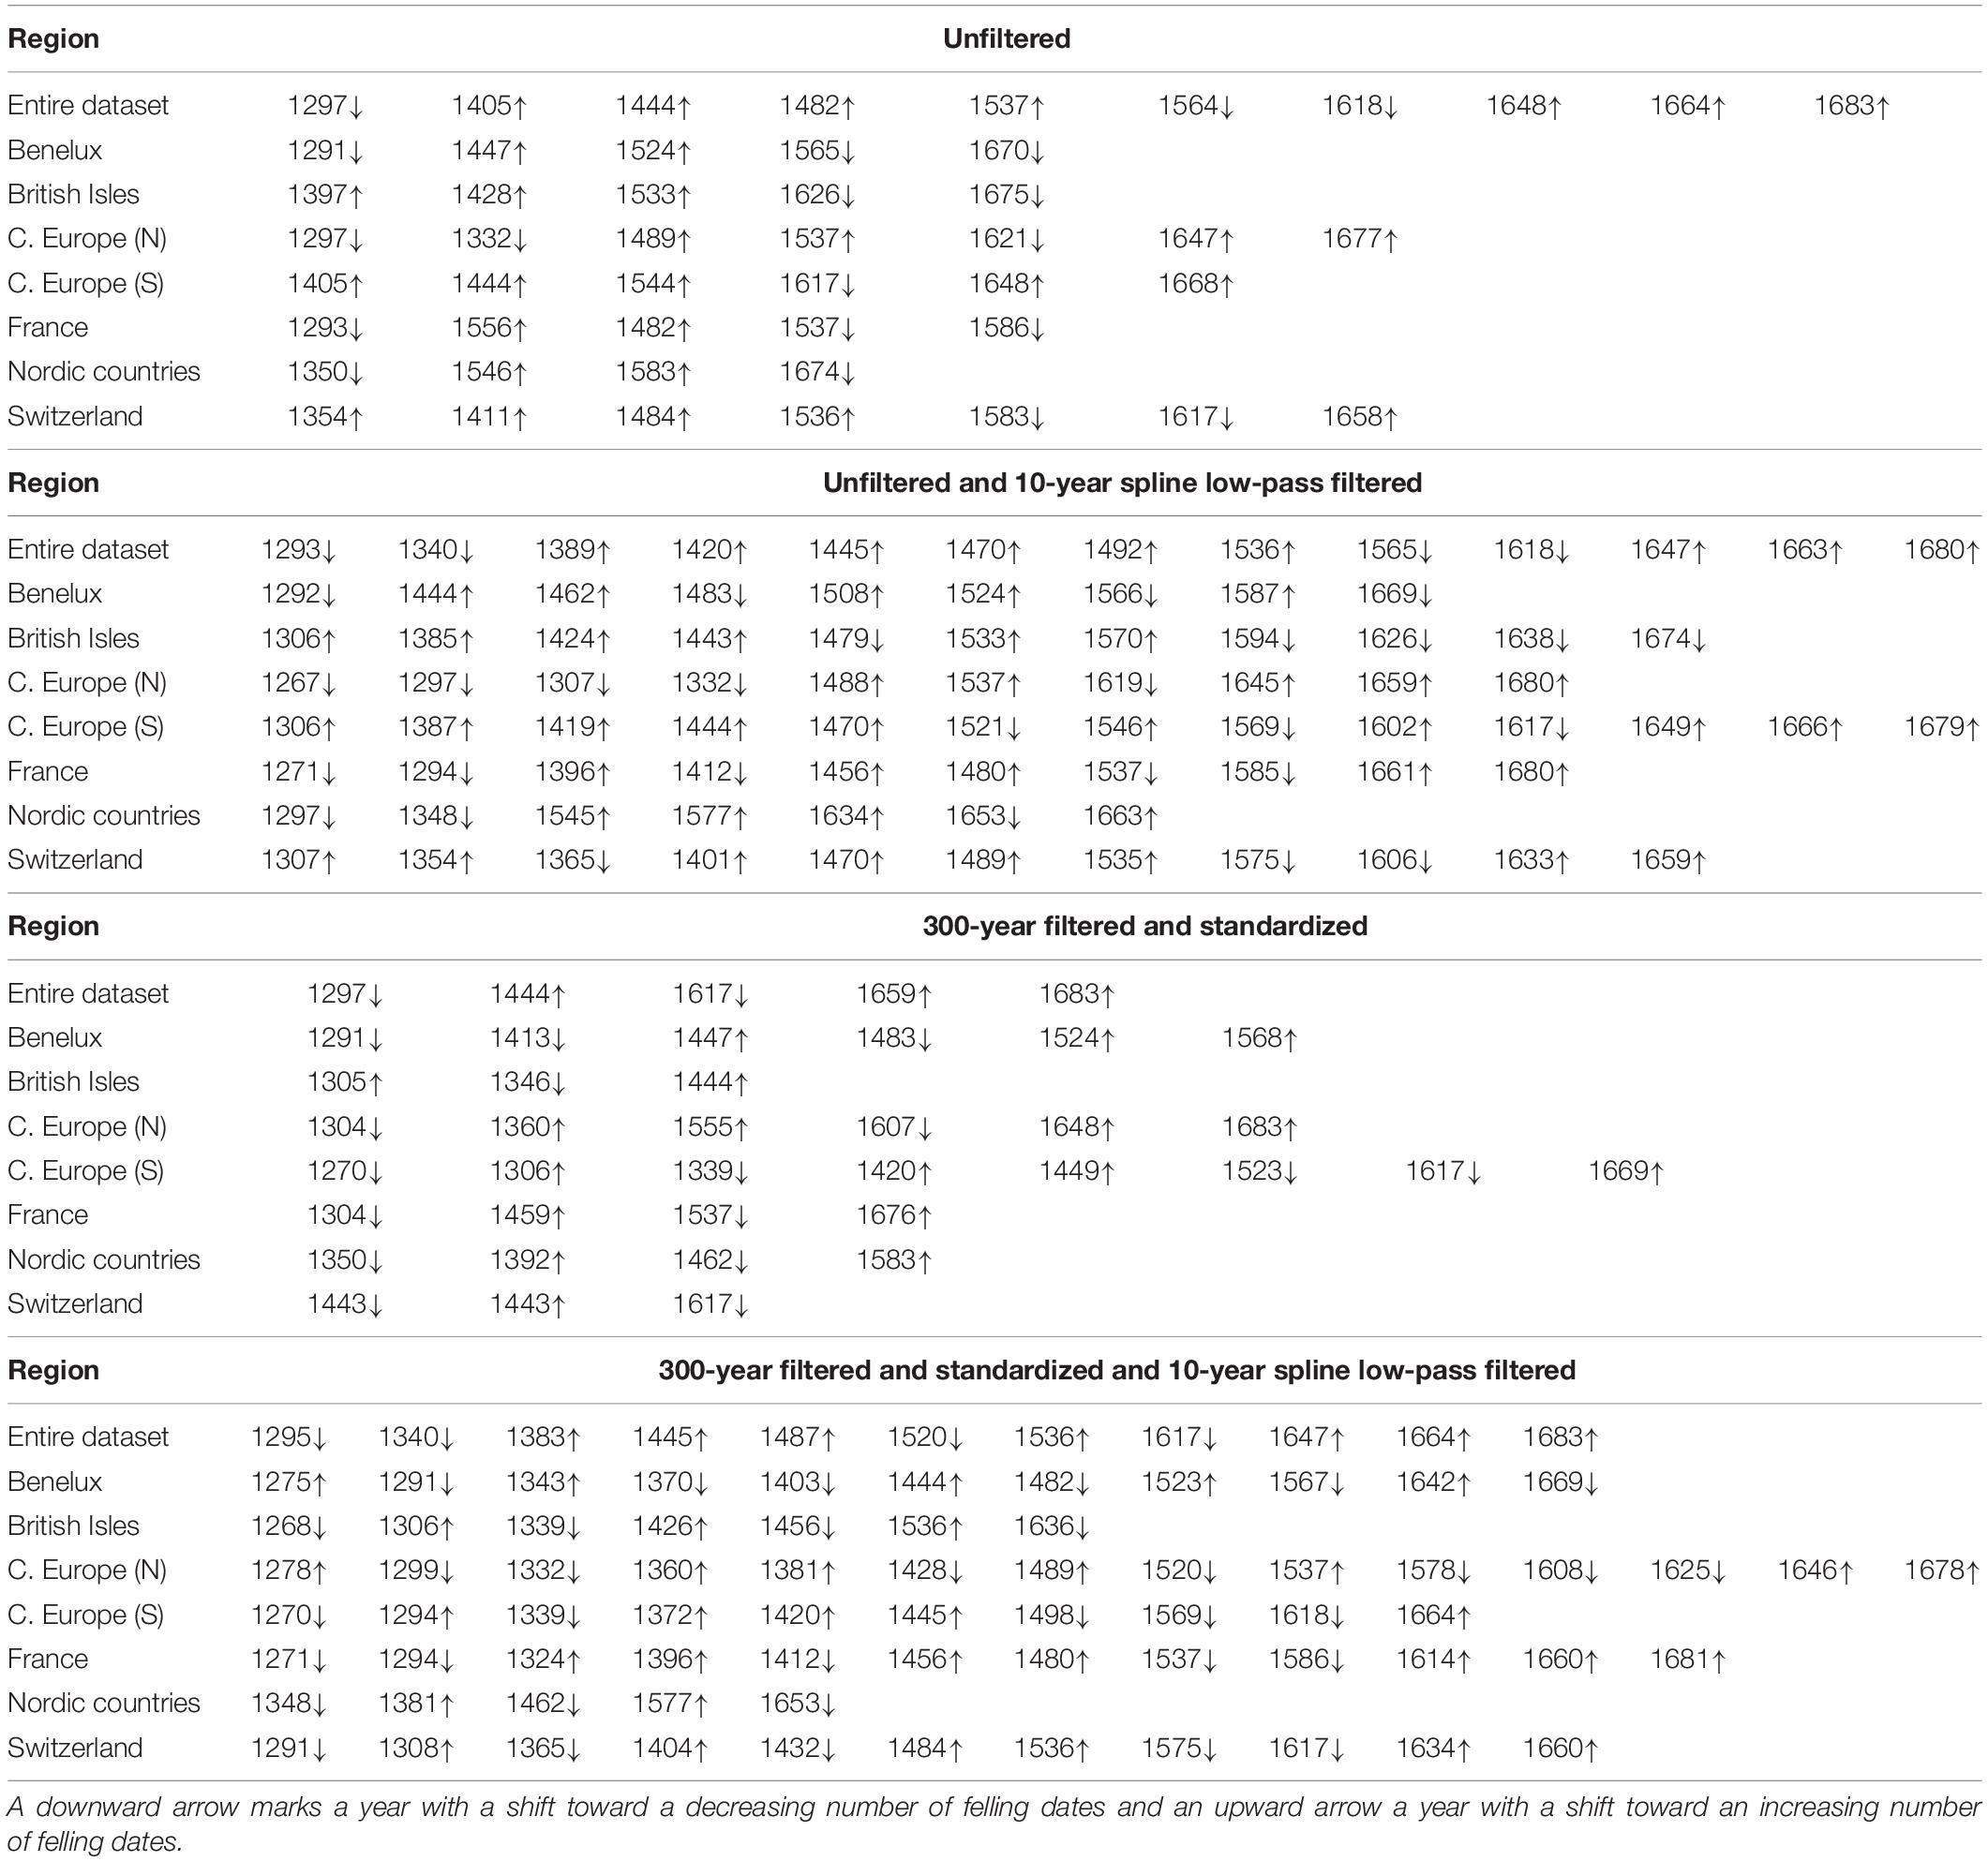
Table 3. List, in chronological order, of significant regime shifts in the unfiltered regional subsets of felling dates as well as in the full dataset.
Clear spatial patterns in the form of changing hot-spots of building activity can be observed for the 50-year periods ranging from 1250–1299 to 1650–1699 (Figure 4). However, as the maps in Figure 4 contain absolute values, with their increasing trends over time, the periods of relative increase and decrease activity are arguably better captured in Figure 3. What is notable is that the different sub-regions, to a large extent, show different and even opposing trends for certain periods. For example, in the British Isles, in central Europe (north) and Switzerland, building activity increases around the 1530s. At the same time in France building activity begins to decline. In general, the different sub-regions show rather similar long-term trends, albeit with different start and end years containing periods of high and low building activity.
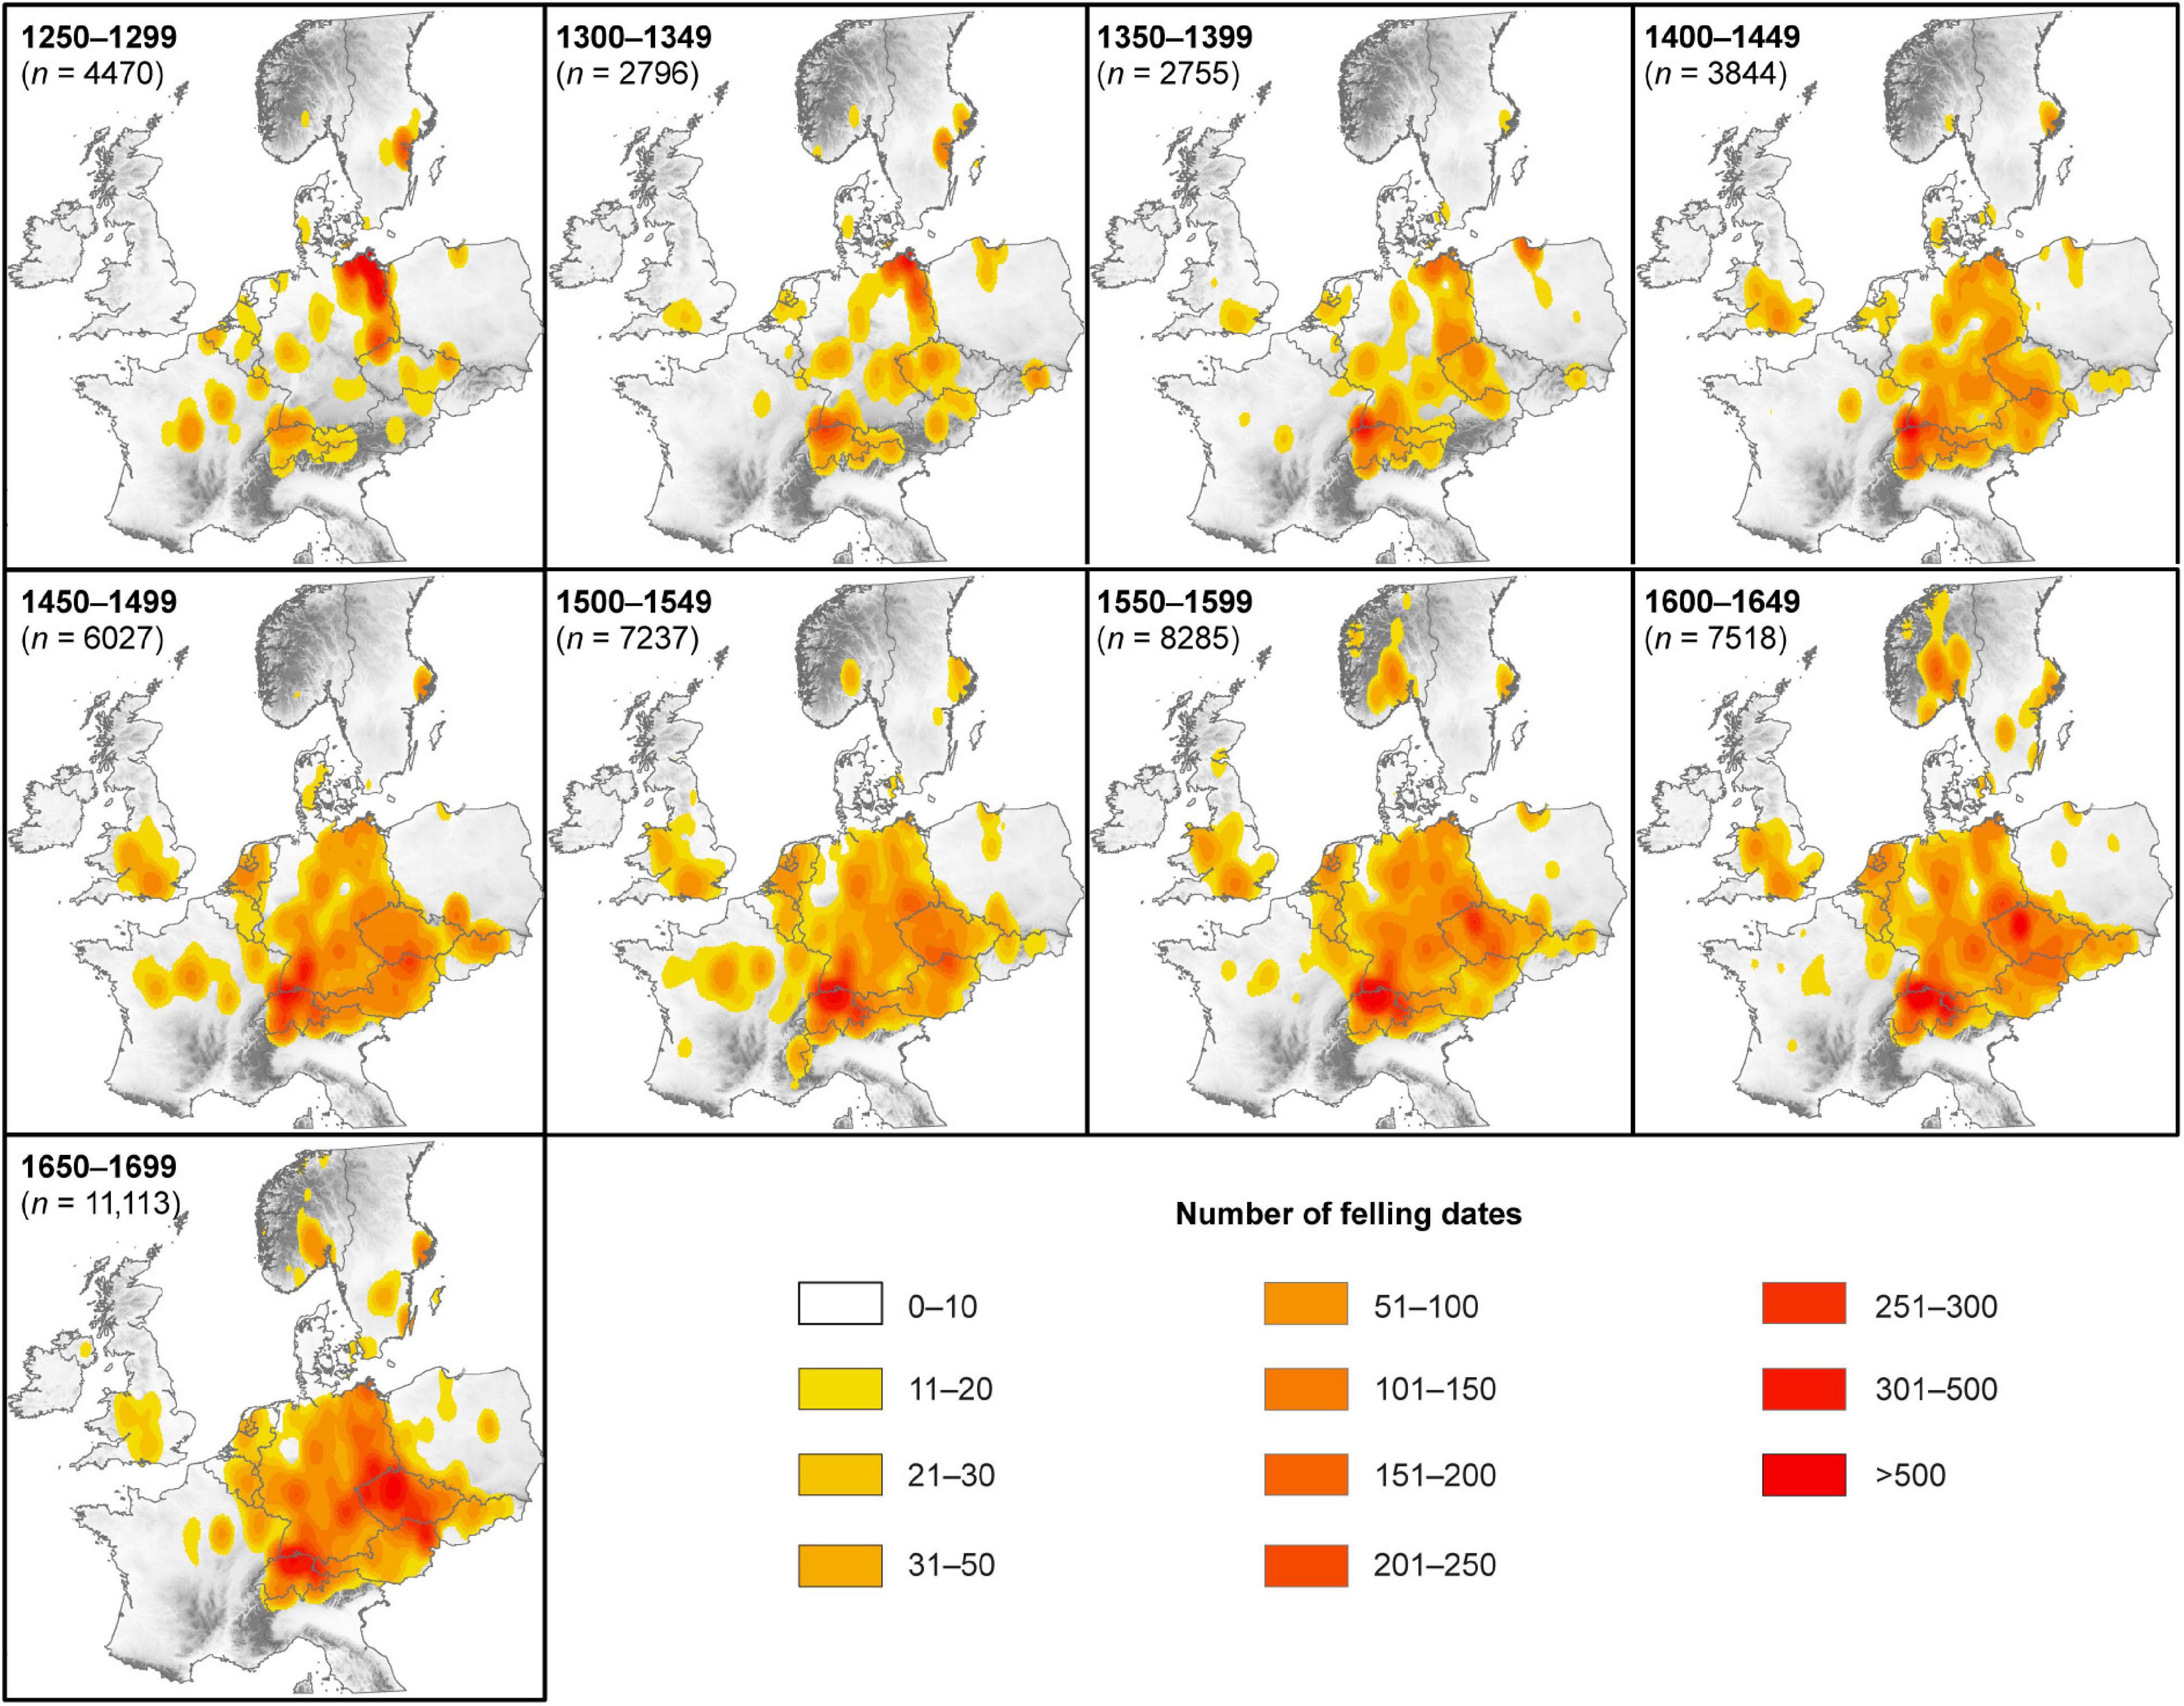
Figure 4. Heat-maps of the number of felling dates for each 50-year period covered by our dataset. The maps are shown with contemporary political boundaries.
The Late Medieval Crisis
The decreasing building activity during the Late Medieval Crisis occurs well before the Black Death (1346–1353). The decline in the number of felling dates between 1250–1299 and 1300–1349 is 37%, whereas the declines between 1300–1349 and 1350–1399 are insignificant an 1%. Between 1350–1399 and 1400–1449 building activity recovers by 28% (Table 4). On a 31-year time-scale, the decrease between 1286–1316 and 1317–1347 is 18% whereas between 1317–1347 and 1348–1378, following the establishment and spread of the plague, the decrease is only 12% (Figure 5). In total, the decrease in the number of felling dates between 1286–1316 and 1348–1378 is 28%. The 28% increase between 1348–1378 and 1379–1409, brings building activity levels to nearly the same levels as between 1286–1316 (Table 4).
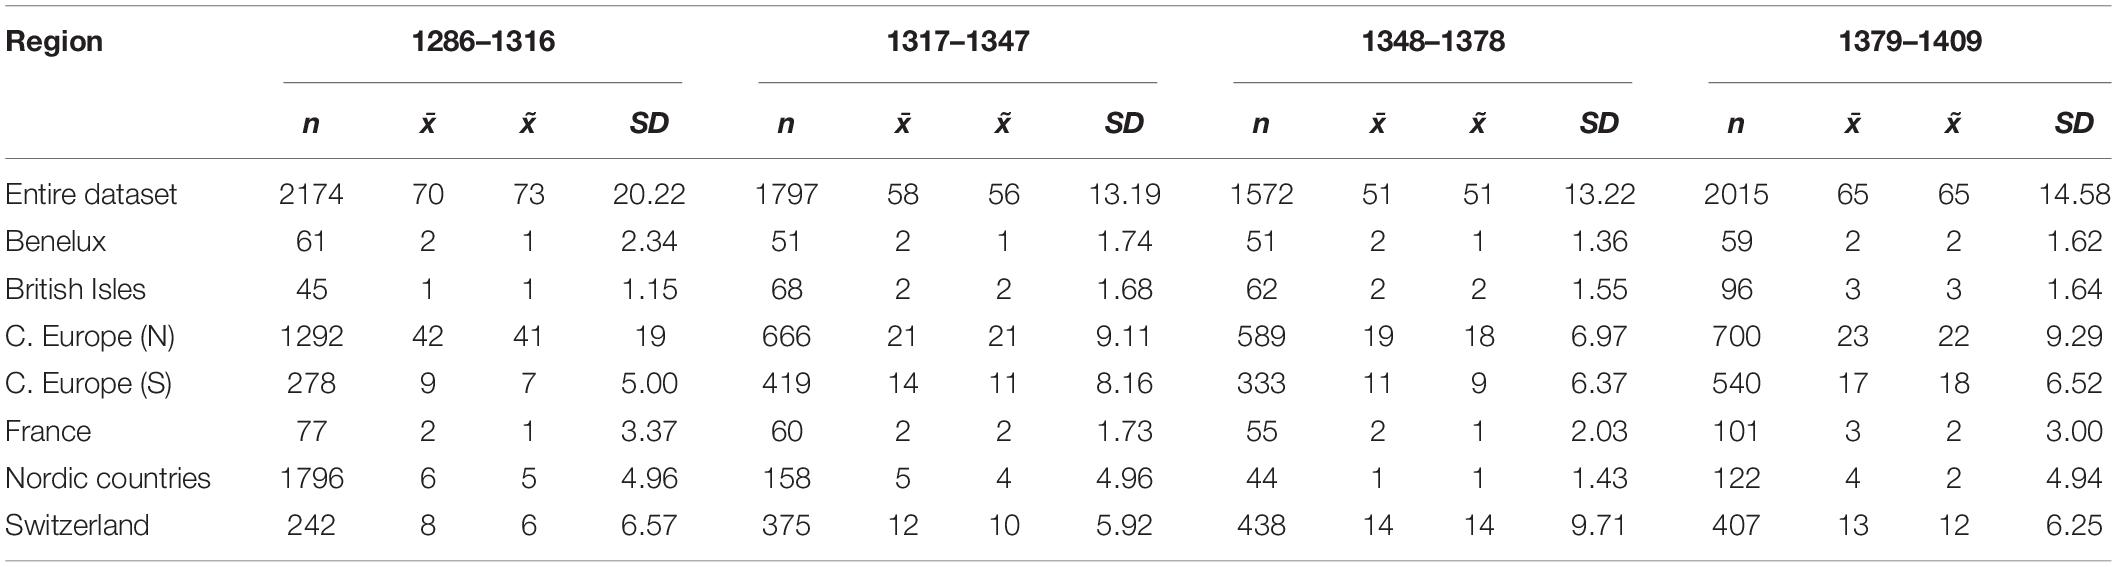
Table 4. Summary statistics for the felling dates for the 31-year periods around the time of the Late Medieval Crisis including the number (n) mean (x̄), median (x̃), and standard deviation (SD).
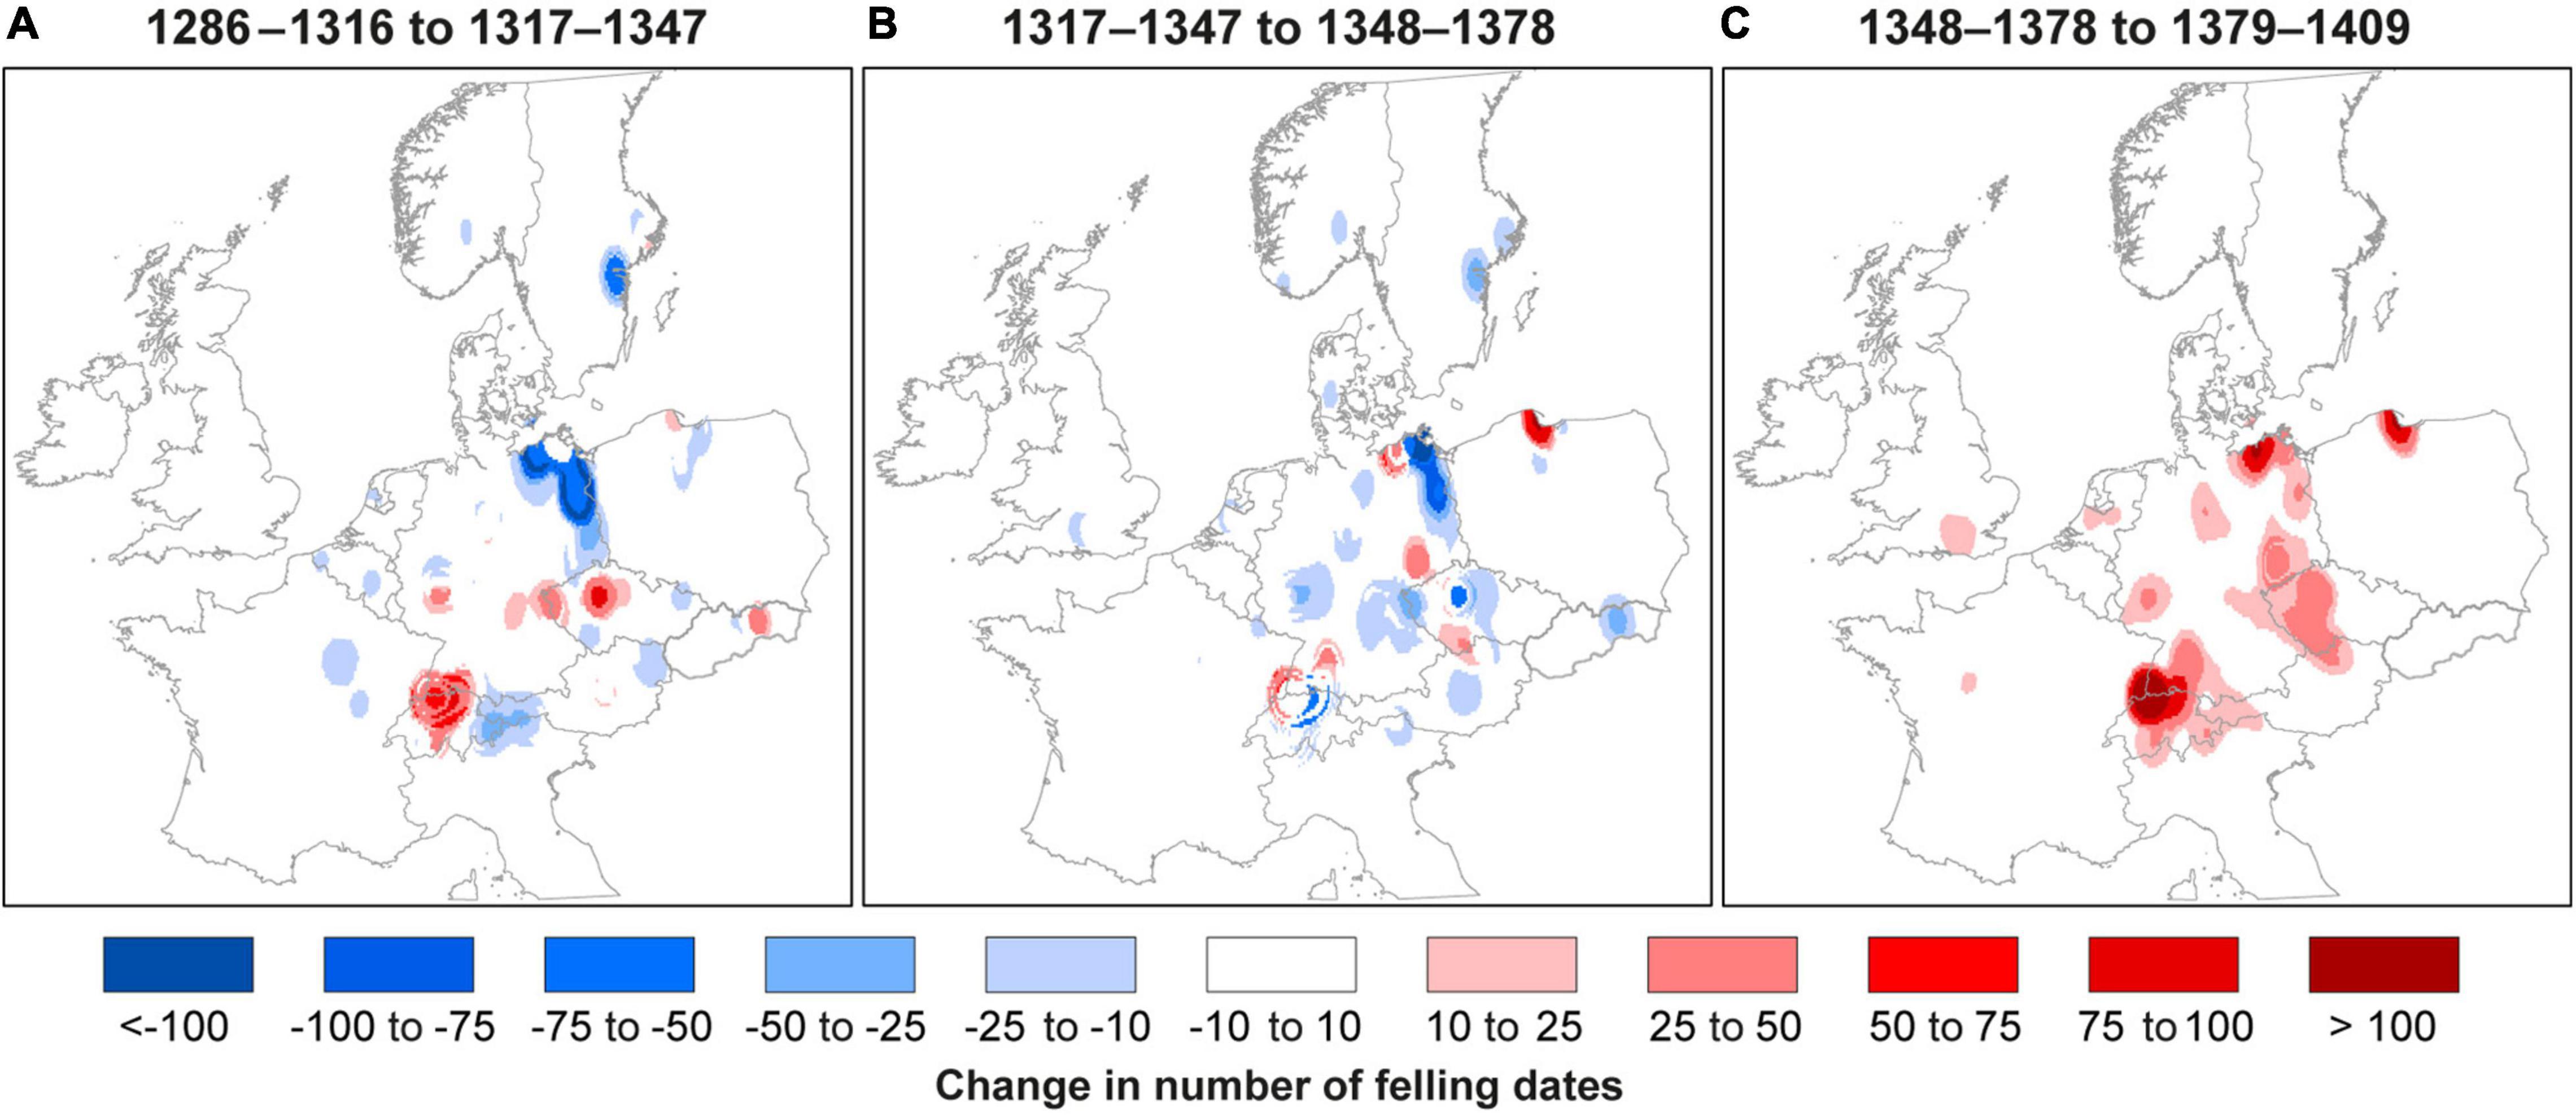
Figure 5. Changes in the number of felling dates for four 31-year periods around the time of the Late Medieval Crisis. (A) Between 1286–1316 and 1317–1347, (B) Between 1317–1347 and 1348–1378, (C) Between 1348–1378 and 1379–1409. The maps are shown with contemporary political boundaries.
The magnitude and timing of the decrease in building activity during the Late Medieval Crisis is, however, highly variable between regions (Figure 5). The strongest decrease, pre-dating the Black Death, is seen in northeastern Germany and in France. In central Europe (south) this decrease is smaller and first occurs following the arrival of the plague. Considering the timing of significant regime shifts in the 300-year detrended and 10-year low-pass filtered building activity data of the entire dataset, the late medieval decrease in felling dates first appears in c. 1295 and then intensifies c. 1340. The recovery occurs in three phases c. 1383, 1445, and 1487. In more detail, several regions either show periods of declining building activity or an increasing building activity prior to the Black Death (Figure 5 and Table 3). The Nordic countries, dominated by data from Sweden, stand out for their lack of any significant evidence of decreasing numbers of felling dates prior to 1348 and the Black Death (Figure 3). The recovery from the Late Medieval Crisis shows a similar heterogeneous pattern between regions. Both central Europe (south) and central Europe (north), France and Switzerland show increases in the second half of the 14th century followed by new decreases in the first half of the 15th century (Figure 3). Looking at the heat-maps of building activity, the expansion of building activities continues from the 13th century into and throughout the 14th century in Austria, Czechia, and Switzerland. In these southern regions the evidence, as derived from felling date data, for any crisis is not clear. Other regions contain too few felling dates for the period to arrive at any more definitive conclusions (Figure 4).
The Thirty Years’ War (1618–1648)
A distinct decrease in building activity is recorded during the Thirty Years’ War (1618–1648) (Figure 6). The number of felling dates is reduced by 22% between 1587–1617 and 1618–1648, followed by a subsequent increase of 41% between 1618–1648 and 1649–1679 (Table 5). However, the impact of the Thirty Years’ War is very unevenly distributed across Europe, and largely limited to the parts of central Europe directly affected by the conflict. The decrease in the number of felling dates was largest in central Europe (north) (43%) compared to 24% in central Europe (south). However, in central Europe (south) the recovery of building activity first starts in the 1660s. Switzerland also experienced a decrease in the number of felling dates by 16% during the Thirty Years’ War, but this decrease is mainly limited to the c. 1618–1634 period (Table 5). Swiss building activity levels were again close to the long-term average during the latter portion of the Thirty Years’ War, with successive years of unusually high construction levels. Considering the spatial pattern in more detail, the strongest decrease during the Thirty Years’ War occurred in central Germany and portions of eastern Germany (Figure 6).
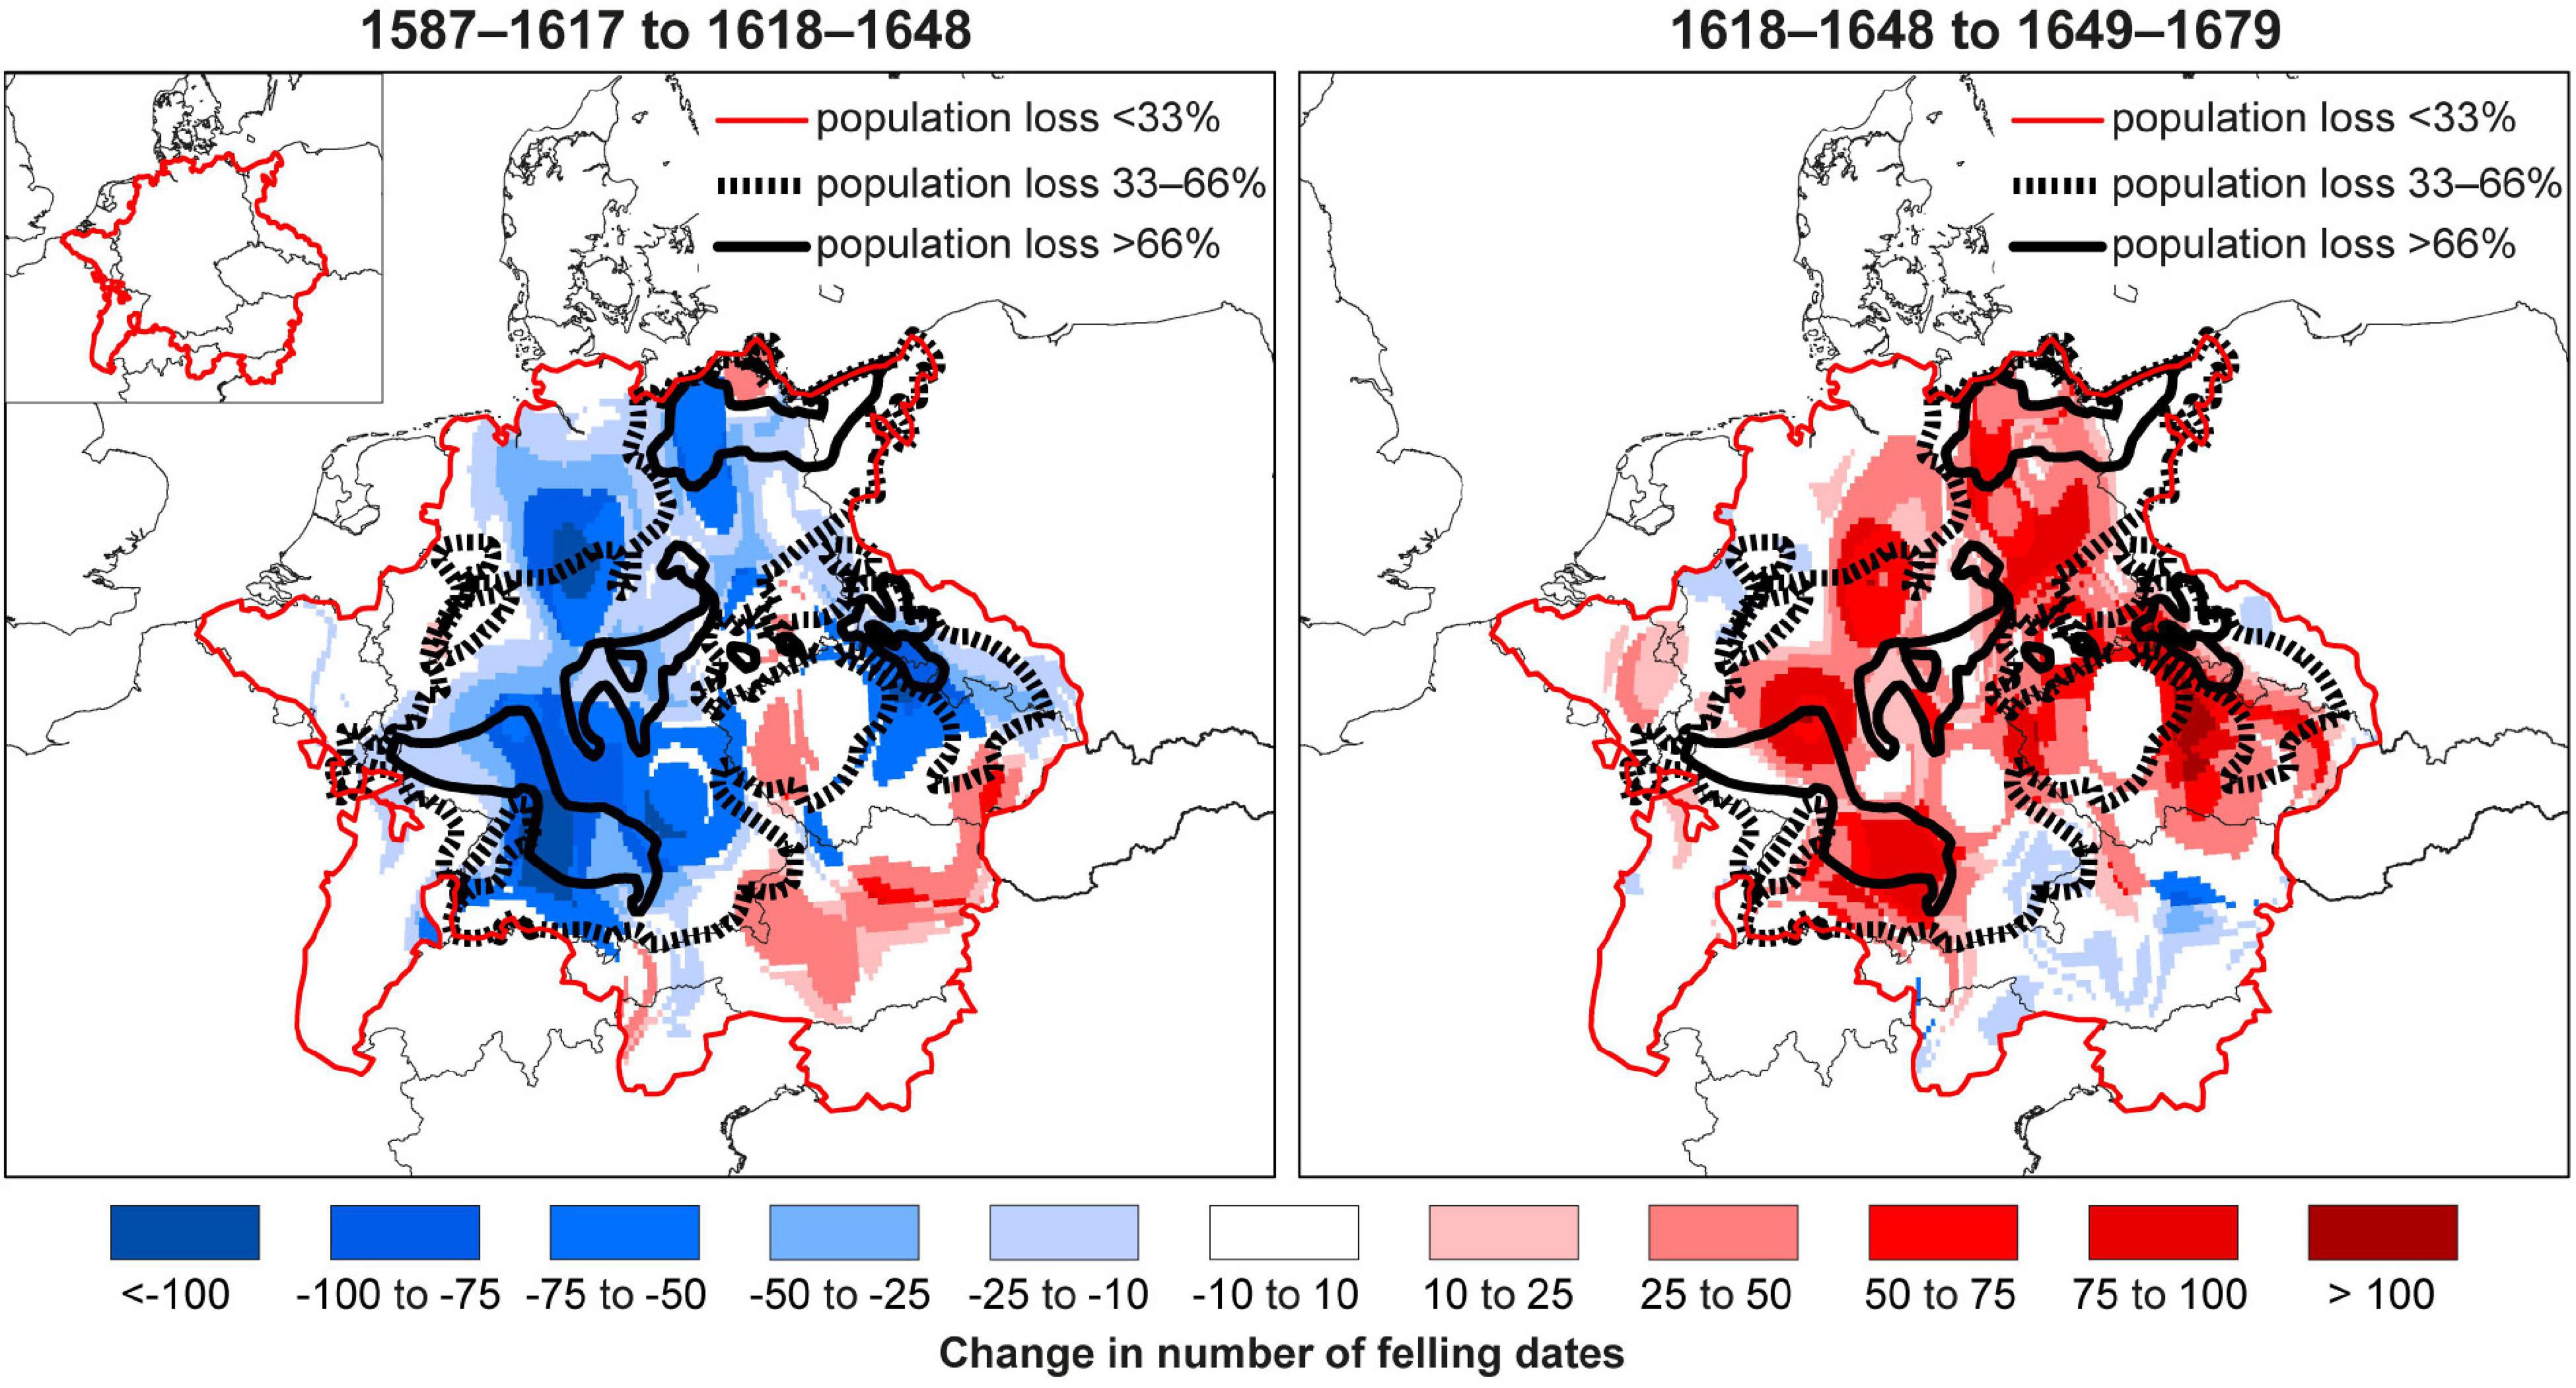
Figure 6. Changes in the number of felling dates for three 31-year periods of the time of the Thirty Years’ War (1618–1648) to the period 1587–1617 and to the period 1649–1679 CE. The maps are shown with contemporary political boundaries. Regions with a population loss of 66% and above, of 33–66%, and below 33% are shown on the map.
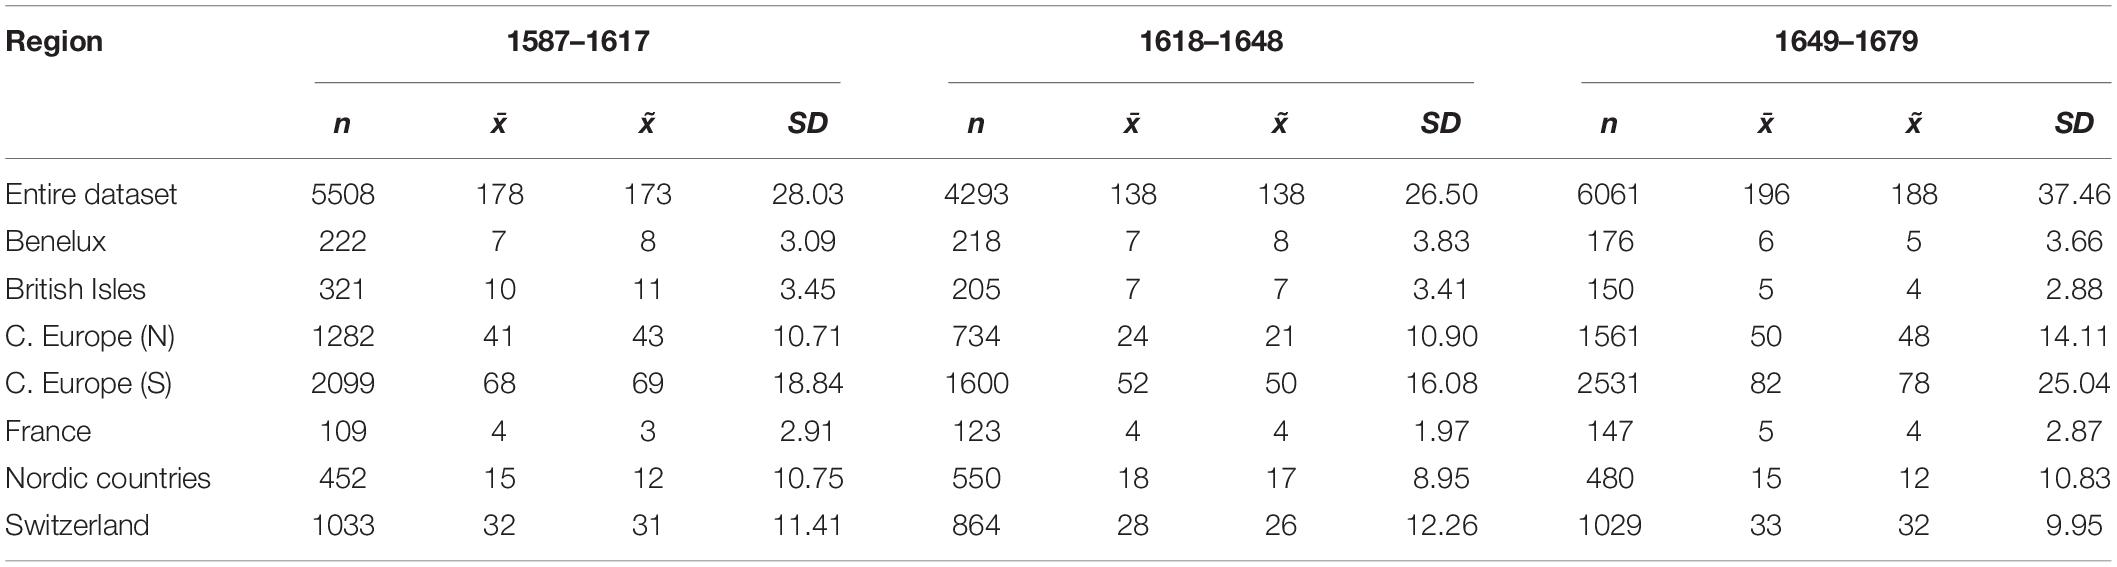
Table 5. Summary statistics for the felling dates for the 31-year periods around the Thirty Years’ War (1618–1648) including the number (n) mean (x̄), median (x̃) and standard deviation (SD).
In regions affected by the Thirty Years’ War, and having an estimated population loss of less than 33%, the decrease in number of felling dates was 31.84% between 1587–1617 and 1618–1648. In contrast, the decrease in number of felling dates was 41.4% in war-affected regions with an estimated population loss between 33 and 66%. Finally, in regions with a population loss exceeding 66%, the decrease in number of felling dates was as high as 68.3% (Figure 6). These differences are statistically significant at a p ≤ 0.01 level. Thus, it is clearly evident that there is a strong correspondence between the magnitude of population loss and the magnitude of decreased building activity, demonstrating the ability of the felling dates to capture not only the timing, but also the extent, of larger demographic changes.
Periods of High Building Activity
Despite small regional variations, common periods of high building activity are detected c. 1250–1295, c. 1445–1520, for a few decades in the mid-16th century, and in the second half of the 17th century (Figures 3, 4). Pre-Late Medieval Crisis construction peaks are absent from Switzerland and the Nordic countries, while occurring earlier in the British Isles, France, central Europe (south), the Benelux countries, and central Europe (north). Regarding the late-15th century period of high building activity levels, this building boom is most evident in the Benelux countries, central Europe (both north and south), and in France where it occurs slightly later. It is absent in the British Isles, Switzerland, and the Nordic countries. The mid-16th century period of high building activity is only distinctive in the Benelux countries, central Europe (north), and Switzerland. Finally, the building activity boom in the second half of the 17th century, following the Thirty Years’ War, is most evident in central Europe (both north and south) and France (Table 3).
Building Activity, Grain Price Level, Economic Well-Being, and Climatic Change
A significant negative correlation, r = –0.29 (rs = –0.29) using annual data and r = –0.55 (rs = –0.59) at decadal time-scales, is found between European building activity levels and the average European grain price level (Table 6). This significant negative grain price–building activity association strongly suggests less construction activity occurred when grain prices were high and vice versa. No other indicator of economic or social well-being shows such a strong relationship with building activity as grain prices. For example, the correlations between European building activity levels and average European wine prices are much weaker and only partly significant with r = –0.20 (rs = –0.22) at annual and r = –0.29 (rs = –0.23) at decadal time-scales (Table 6). Common regime shifts are also detected in the grain prices and the felling date numbers, whereas such a similarity is lacking in the wine price data.
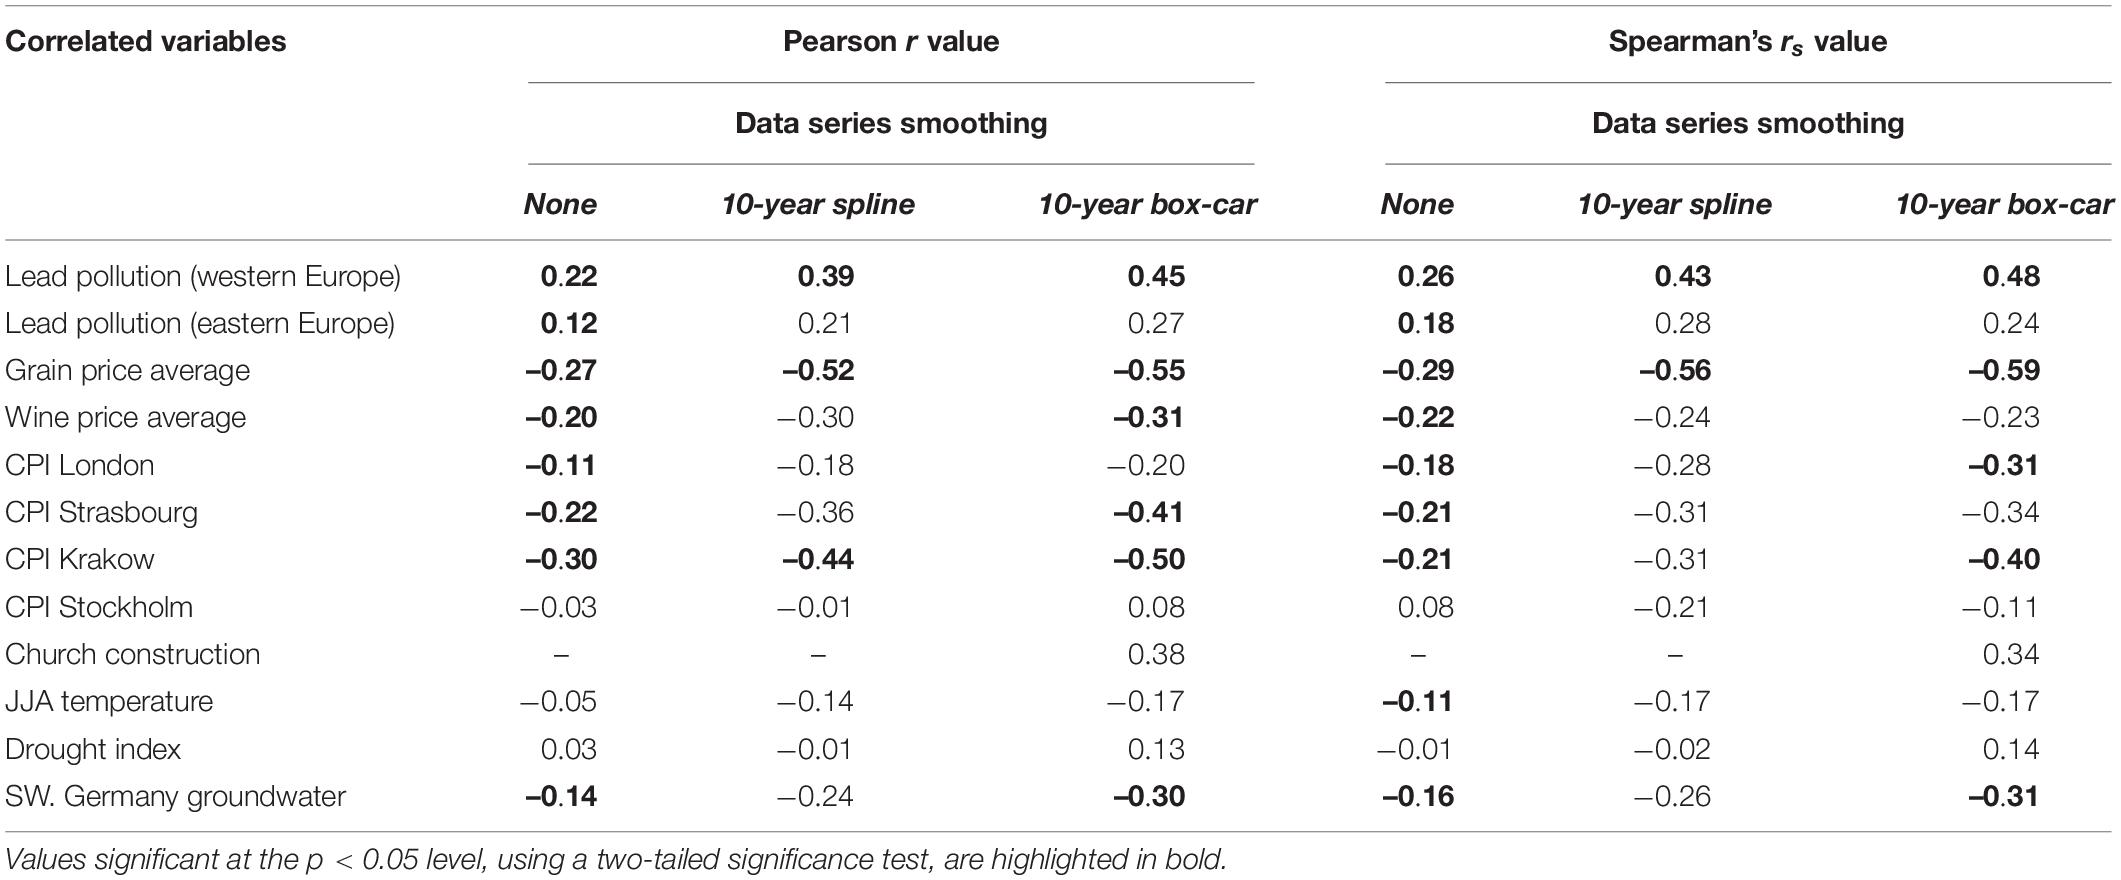
Table 6. Correlation between 300-year filtered and standardized subsets for comparison with the entire felling date dataset.
A positive correlation is also found between European building activity and lead pollution originating from mining in western Europe at both annual time-scales (r = 0.22 and rs = 0.26) and decadal times-scales (r = 0.45 and rs = 0.48) (Table 6). The lead pollution record originating from eastern Europe shows a much weaker positive relationship with building activity levels and is only statistically significant at annual resolution. Decreasing values of lead pollution from western Europe c. 1308 suggests the onset of the Late Medieval Crisis started about a decade later than that indicated by the felling dates (Table 7). A further decrease in lead pollution occurs in 1360, as opposed to the 1340 downturn in the felling dates (Figure 7). The step-wise recovery from this crisis mostly coincides in timing with a recovery in European building activity. Shifts toward decreased lead pollution, originating from western Europe, are seen in 1569 and 1589, signaling the start of the so-called Crisis of the Seventeenth Century (Hobsbawm, 1954; Parker, 2013). Unlike the felling date data, the Thirty Years’ War (1618–1648) is not defined by significant regime shifts in lead pollution. The lead pollution record for eastern Europe shows only five regime shifts, suggesting a later onset and longer duration of the Late Medieval Crisis (Figure 7).
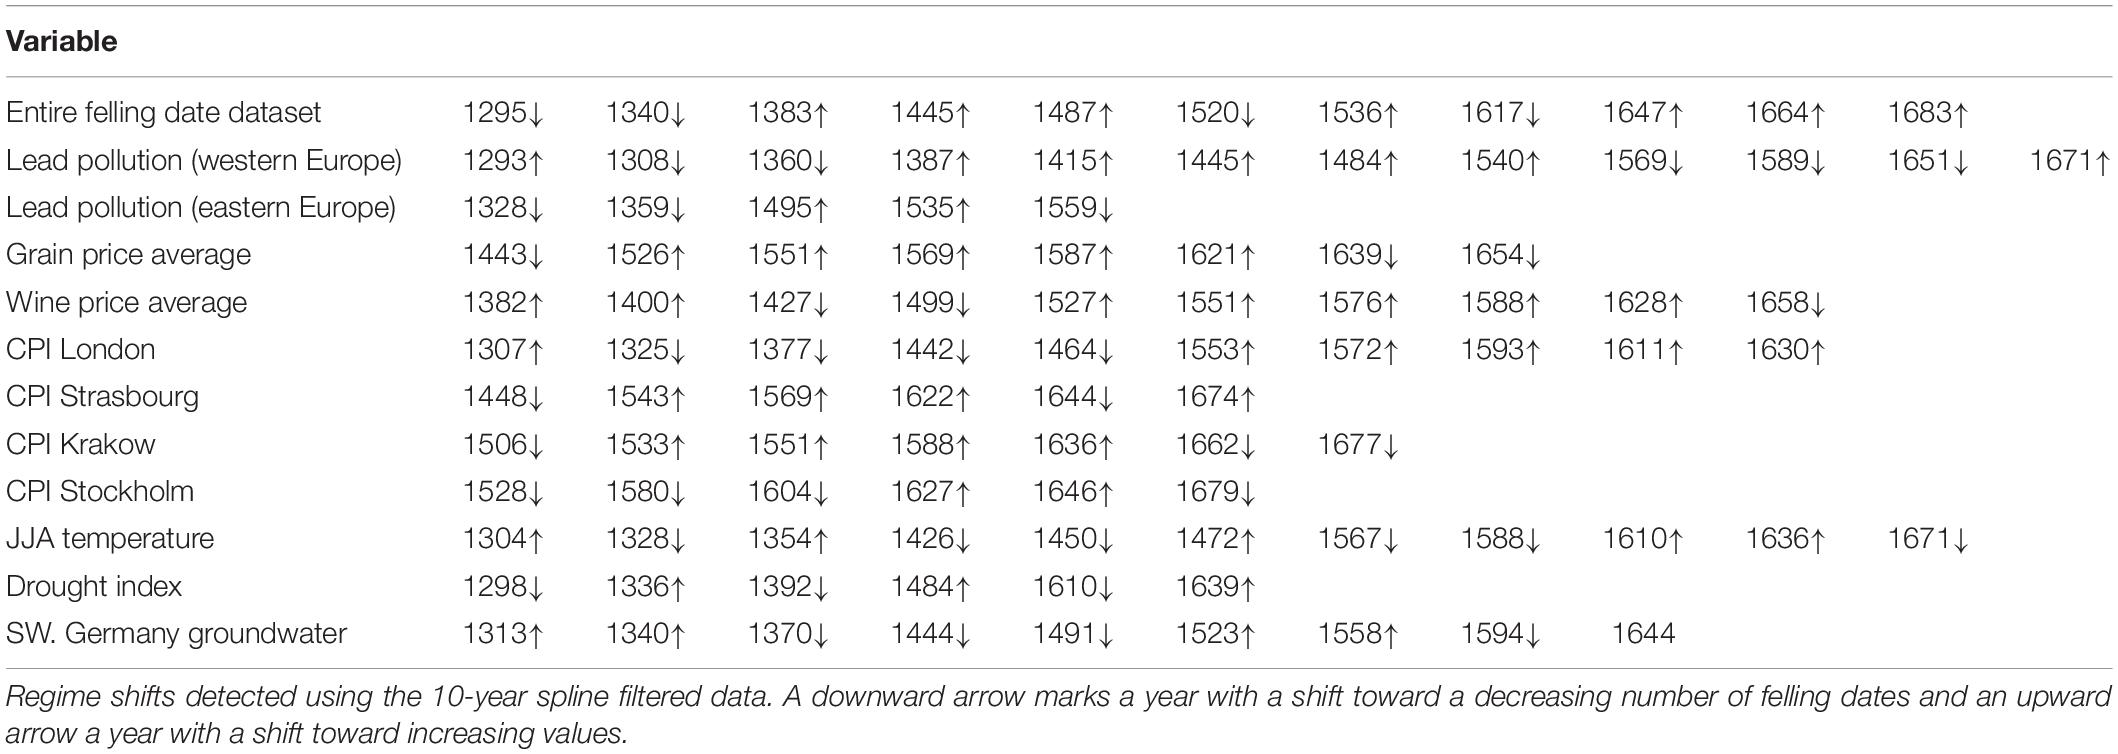
Table 7. List of significant regime shifts in the in 300-year filtered and standardized subsets for comparison with the regime shifts in the felling date dataset.
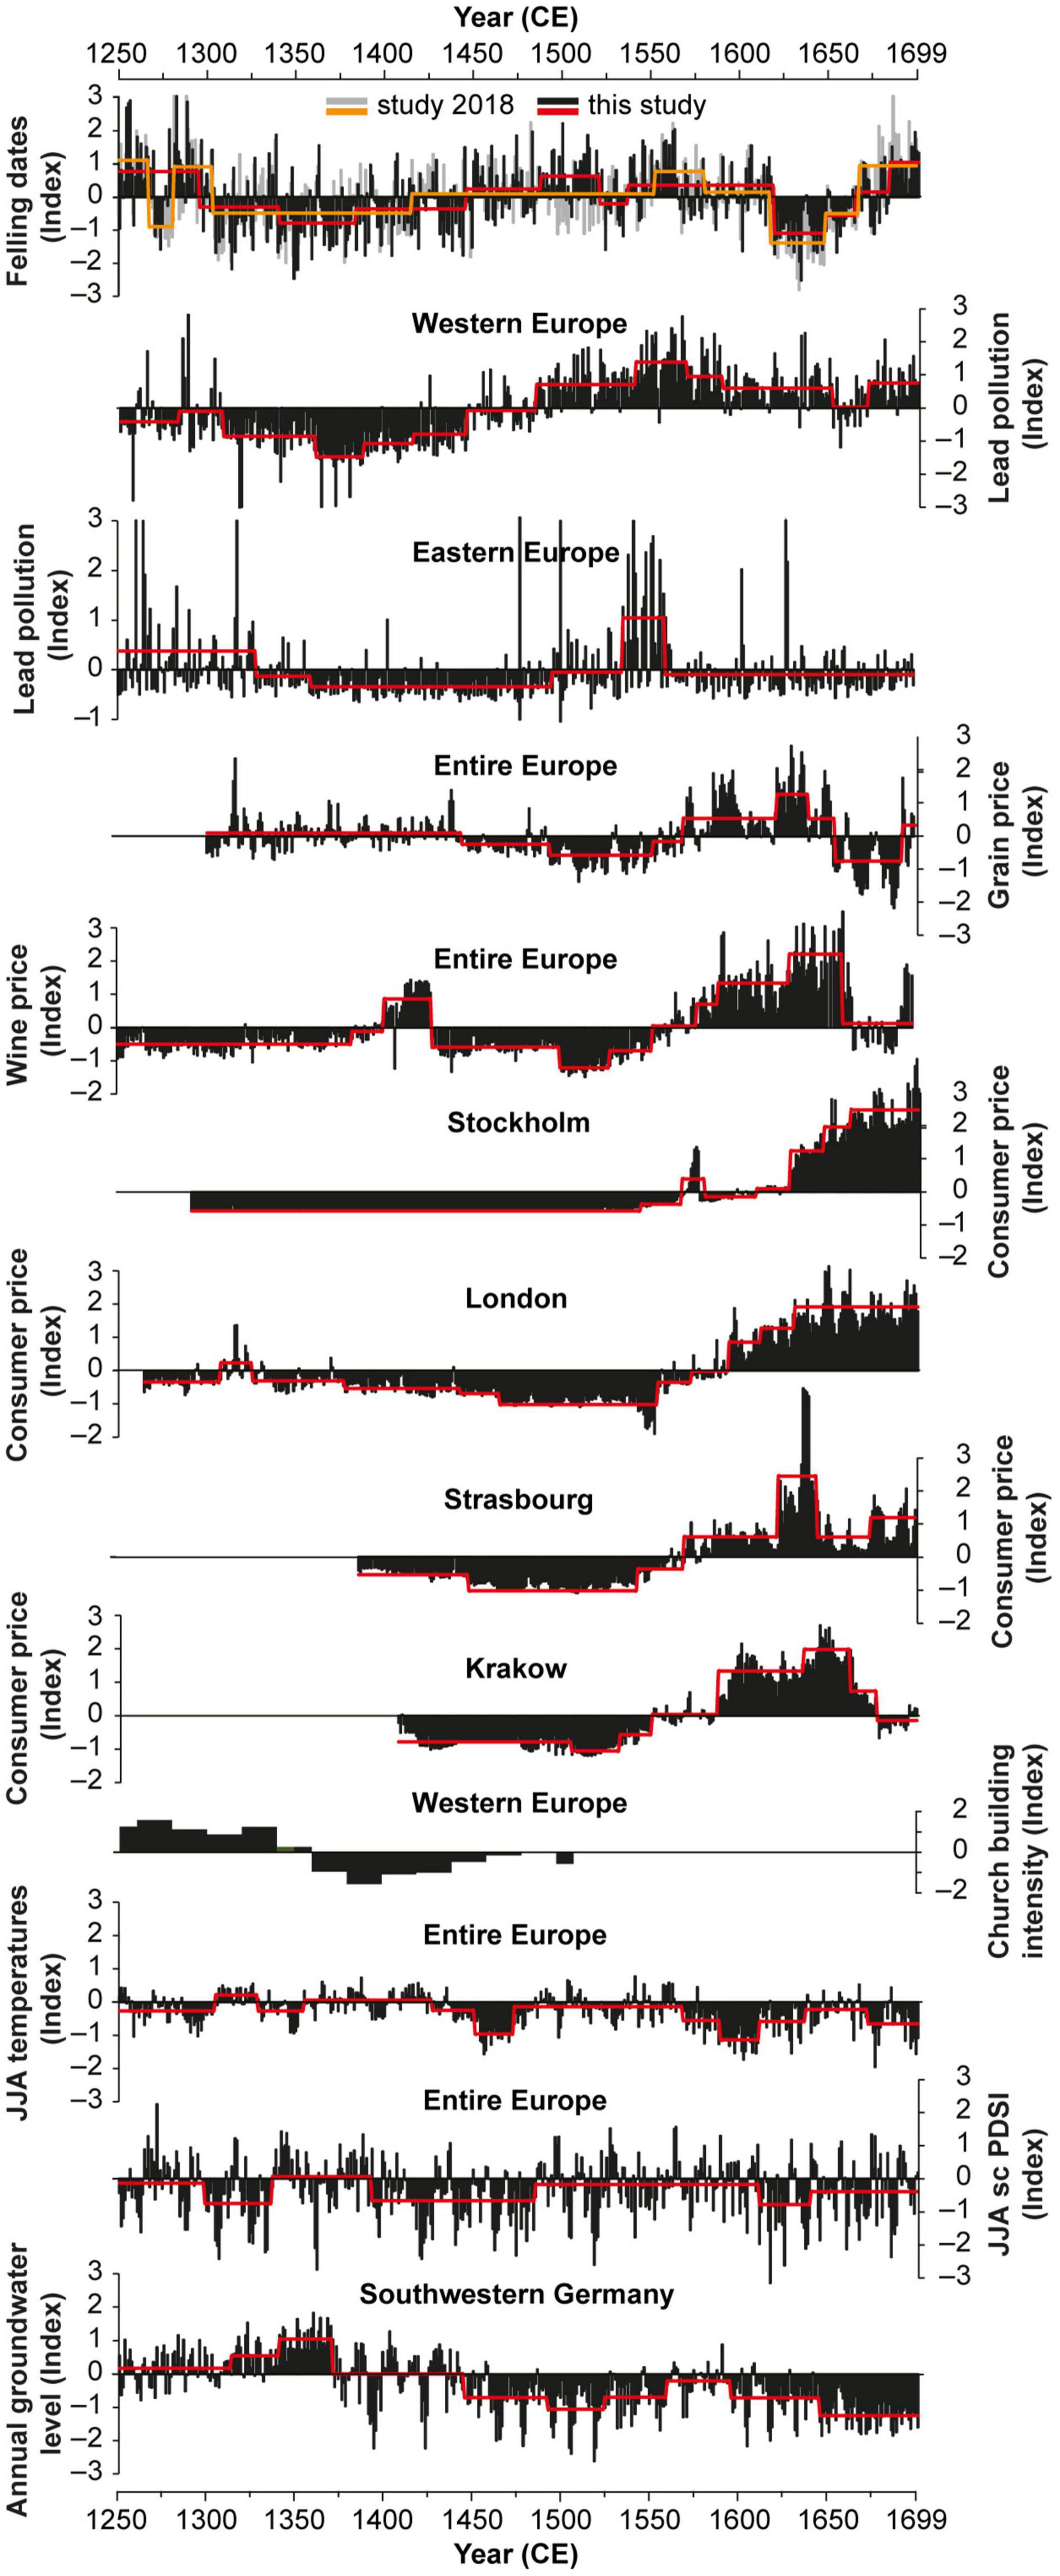
Figure 7. Figure showing the new entire felling date dataset, and the one Ljungqvist et al. (2018) for comparison, together with other datasets indicating general societal well-being and prevailing climate conditions. All data is standardized to z-score values over the entire period and 300-year filtered values. The red lines show the significant regime shifts in the number of felling dates, using a 30-year cut-off length.
A significant negative relationship is found between annual consumer price indices from Krakow and Strasbourg, and European building activity levels; r = –0.30 and r = –0.22, respectively for annual data; and r = –0.50 and r = –0.44, respectively, for 10-year box-car filtered data (Table 6). Interestingly, the Pearson correlations are higher than the Spearman’s implying a rather linear relationship between the two indices (Table 6). The relationship with the London annual consumer price index is considerably weaker and of a more non-linear nature. Correlations with the Stockholm annual consumer price index, despite being the second longest index considered, are weak and insignificant. It should be noted that the Stockholm index also does not show much agreement with the other three consumer price indices. Finally, a positive correlation (r = 0.38, rs = 0.34) is found between church construction rates and European building activity level.
Weak, but in some cases significant, are the associations between climate reconstructions and European building activity levels. The strongest negative correlations are obtained using the tree-ring-width-based southwestern Germany GWL reconstruction (r = –0.14 for annual data, and r = –0.30 for 10-year box-car filtered data). Thus, periods of low GWL s appear to correspond to periods of higher building activity and vice versa. On the other hand, no significant correlations can be found between building activity levels and the tree-ring based drought (scPDSI) reconstruction. The relationship between building activity and reconstructed June–August temperature is negative but does not reach statistical significance. We also analyzed the presence of regime shifts in the climate reconstructions and found little agreement with the regime shifts in building activity.
Discussion
Felling Dates as a Historic Source Material
The results of this study demonstrate that felling dates contain genuine information about variations in past societal well-being at regional and macro-historical scales. The ability to capture the Late Medieval Crisis (Figure 5), the mid-16th century population boom (Clark, 1977; McEvedy and Jones, 1978; Turchin and Nefedov, 2009), the Thirty Year’s War (Figure 5), and the demographic increase in the latter 17th century (Biraben, 1979; Bardet and Dupâquier, 1997; Bulst and Pfister, 1997) demonstrates the usefulness of the felling dates as a historical source material. In particular, the ability of the felling dates to capture relative population losses in regions affected by the Thirty Years’ War confirms their skill as a demographic proxy (Figure 6). No notable population decreases were found in regions known to have been little impacted by the war such as the Netherlands (Parker, 2006; De Pleijt and van Zanden, 2016). However, large numbers of felling dates are needed for establishing statistically significant changes, particularly on smaller spatial scales. Thus, using the felling dates on their own appears to have its limitations, rendering them most useful within a source pluralistic framework (e.g., Myrdal, 2012).
Admittedly, the regional trends in building activity observed here depend heavily on the regional groupings used in this study. The merits of the groupings employed in this study can be debated, and alternatives offered, but data-driven approaches proved unable to deterministically identify statistically defendable and historically consistent alternatives (see Section “Other Datasets Used for Comparisons”). Future studies are needed to possibly disentangle and quantify construction phases at sub-regional to regional scales. We note, for example, the central Europe (north) region is heavily dependent on felling dates from cities along the German Baltic Sea coast (Figure 1A). Thus, the high building activity levels in medieval times derived from these data follow the expansion phases of the Hanseatic League during the 13th century (Jahnke, 2013). High levels of building activity, related to mining activity, in the Ore Mountain Range in German Saxony and Czech Bohemia is particularly evident in the periods 1250–1299, 1350–1399, and 1500–1599. While the first period represents the peak of medieval mining activity, the high level of building activity during the second period suggests this mining district experienced lesser stagnation than most other regions subsequent to the Black Death. The high building activity level in the 16th century in this region coincides with a phase mining industry growth in central Europe as well as elsewhere (Bohdálková et al., 2018).
To some extent, the choice of detrending and filter length influences our results, especially in the detection of statistically significant regime shifts (Table 3). We noted a difference in the number and timing (year) of regime shifts depending on whether the data have been 300-year spline detrended as well as 10-year smoothed. For example, considerably fewer regime shifts were obtained using data without 10-year smoothing, suggesting that for investigation of decadal regime shifts, filters of short lengths are useful.
As expected, a strong agreement (r = 0.83) in the annual felling dates, and in the timing of regime shifts, is found between the slightly different datasets used by Ljungqvist et al. (2018) and the one presented here. The new felling date dataset is slightly larger but only contains data that are georeferenced. In comparison to Ljungqvist et al. (2018), this new dataset reveals lower levels of building activity around c. 1400 CE, c. 1500 CE, and a somewhat less pronounced decline in activity during the Thirty Years’ War. The latter difference can be explained by the larger geographical coverage that includes more regions unaffected by the war. However, the lower rates in construction during the fourteenth and 15th century presented here cannot be readily explained and are unrelated to the inclusion of new data from any particular region. The most important difference is arguably a more step-wise, and slightly later, recovery in building activity following the Late Medieval Crisis. Another noteworthy feature is an earlier onset of the “Crisis of the Seventeenth Century” (Hobsbawm, 1954; Parker, 2013), also evident in the recent felling-date-based study for Czechia by Kolář et al. (2022).
Biases in the Collected Material
Our felling date dataset contains inevitable geographical biases (Figure 1A), and smaller temporal ones (Figure 1B). It is also biased toward artisan and bourgeois houses in urban settings and ecclesiastical buildings. This implies that construction activities in areas where forestry systems such as coppice or coppice-with-standards were in place are not well reflected in our dataset. Other biases may exist as well, particularly the unknown quantity of recycled building timbers distributed over time. The latter is difficult to directly address without more detailed construction and renovation histories for each building. However, we find it reasonable to presume that the proportion of freshly cut to recycled building timber remains approximately the same during both low and high periods of building activity. As noted in Bannister (1962), a clustering of dates, when sufficient in number, helps to distinguish between renovation work and original construction. Thus, large groups of felling dates clustered within a few years of each other suggest new constructions.
For studies such as this, the amount of data available from any particular region and sub-region is largely related to the length of time during which tree-ring dating has been implemented to study historic buildings and to the continuity of those studies. In the southwestern part of Europe, for example, dendrochronological studies on historic buildings are almost absent in Portugal, and while they started in the 1980s for Spain (Richter, 1986; Richter and Eckstein, 1986), little has been published in spite of the abundance of built heritage (Rodriguez-Trobajo, 2008; Domínguez-Delmás et al., 2015, 2017, 2018). An exception is the Basque Country region in the northeast, where dendrochronological techniques are regularly applied in historic buildings since the late 1990s (Susperregi, 2007; Susperregi et al., 2017). Similarly, the southeastern part of central Europe poses a particular problem. For example, Slovenia has little historical tree-ring material prior to c. 1500 CE (Čufar et al., 2008, 2014a,2014b). A large proportion of medieval structures in Slovenia were destroyed during Ottoman attacks in the 15th and 16th centuries and during the subsequent Ottoman–Habsburg Wars (1526–1791 CE) (Murphey, 1999; Dávid and Fodor, 2000) as well as the huge earthquake in 1511 CE (Ribarič, 1979; Čufar et al., 2014b). The situation in Slovenia is, in a certain way, similar to that in Hungary. We have, thus, not been able to include these regions of southeastern Europe. By contrast, though many felling date data exist in Sweden (Bartholin, 1990), only a fraction are accessible in digital form, and only for parts of the country (Meissner et al., 2012; Lagerås et al., 2016).
Compared to most other parts of the British Isles, limited data is available from Scotland (Crone and Mills, 2003; Mills et al., 2017). The timber-framed building tradition, which was so ubiquitous on the Continent and in England and Wales, did not develop to the same extent in Scotland, especially in the countryside (Stell, 2010). The medieval housing stock that survives is primarily high status, the tower houses, mansions, churches and castles of the ruling and ecclesiastical elite, and of these very few retain their original timbers. Of the 45 Scottish buildings with felling dates only seven pre-date 1500. By the 16th century Scottish builders were almost entirely reliant on oak and pine imports from Scandinavia and the Baltic Countries (Crone and Mills, 2012).
Comparison With Other Indicators of Societal Well-Being
The strongest association between European building activity rates and metrics of societal well-being is found with the grain price average for Europe (see section “Building Activity, Grain Price Level, Economic Well-Being, and Climatic Change”). Grain was the main (>70%) calorie source for most of the population (Allen, 2000; Collet and Schuh, 2018), despite some minor regional variation as per the notable focus on dairying in Gaelic Ireland (Campbell and Ludlow, 2020). Considering this, and the fact that grain price levels reflected the interplay of supply and demand (Persson, 1999), it is reasonable to use grain price levels as an indicator for both the availability of food, and the average standard of living (Campbell, 2016). It is known that grain price levels considerably affected real wage levels (Allen, 2001) as well as the long-term demographic development in the medieval and early modern periods (Turchin and Nefedov, 2009; Alfani and Ó Gráda, 2017). Thus, when grain price levels were low the general standard of living was higher, demographic growth was stronger, and there was both a need for new buildings and the resources to fund their construction. Wine price level data show a much weaker, but apparently more linear, association with European building activity than grain prices. This can be explained in two ways. First, there are fewer wine price series than grain price series available for comparison, and their spatial distribution is much more limited (Allen and Unger, 2019). Second, wine was a far less essential commodity than grain, and its price thus reflected general societal well-being to a lesser extent.
The strong positive association between European building activity and lead pollution originating in western Europe, compared to pollution originating from eastern Europe, can presumably be explained by the dominance of felling dates from western and central Europe in our dataset. The many synchronized regime shifts, shared by both European building activity and western European lead pollution levels, suggest that the two datasets, when combined in this manner, may be a defensible measure of large-scale development and relative prosperity.
Some of the reconstructed annual consumer price indices also show strong (negative) associations with reconstructed European building activity levels. However, it is important to emphasize that the reconstructed annual consumer price indices are not independent from the grain price data (see, e.g., Allen, 2001). The Krakow annual consumer price index shows the strongest correlation, followed by the Strasbourg index. This is hardly surprising considering both cities are located in the central European region, the region with the largest number of felling date data. A positive, but insignificant, relationship is also found between the independent church construction series and reconstructed European building activity levels. However, the short period of overlap (1250–1500 CE), and the fact that the church construction series is only available at 20-year time-steps, means that the degrees of freedom are too few to compute statistical significance.
The correlations between European building activity and past temperature and drought are mostly negative and insignificant. The weak relationship between temperature and building activity is surprising considering that temperature has been shown to have a strong negative association with grain prices (Ljungqvist et al., 2022) while this study has revealed a strong positive association between grain price and building activity. However, significant (negative) correlations between building activity and groundwater supply are found for the Upper Rhine Valley watershed (Table 6). The groundwater reconstruction is located in the approximate center of our felling data coverage. The observed association with building activity strongly suggests that drier conditions coincided with higher building activity and vice versa. The likely causal mechanism here is a groundwater connection with grain production (for details, see Ljungqvist et al., 2022). In addition, periods of low building activity correspond to the first two maximum glacier advances during the Little Ice Age in the Alps. The Great Aletsch and Gorner glaciers peaked at c. 1300–1370 CE and 1600–1670 CE (Holzhauser et al., 2005; Holzhauser, 2010). Le Roy et al. (2015) show that Mer de Glace glacier was advancing during the late 13th century and reached very high levels as early as 1280s–1290s, before peaking in the c. 1350s, which is paralleled by late medieval drop in the number of felling dates.
Prospects for Future Research
This study has made evident that the sparse coverage of felling dates in many regions limits robust identification and comparison of spatial patterns to certain portions of Europe. Thus, efforts to collect felling dates from currently sparsely covered regions should be encouraged when it is possible; we acknowledge that not every region has old buildings preserved. This problem could, in theory, be partly mitigated by including all available felling dates, meaning even those without waney edge felling dates, but for which estimated felling dates are available (e.g., when samples contain sapwood rings). We have refrained from doing so for mainly two reasons: (1) The spatial coverage would not be dramatically increased. (2) A degree of annual precision would be lost due to the “smoothing” effect created by introducing dating uncertainties (Bocinsky et al., 2016).
Future studies could address changes in the relative building activity rates of different types of constructions e.g., high status and low status buildings, to investigate social stratification, and their (financial) resilience to sudden social or demographic disruptions. For example, Haneca et al. (2020) demonstrated that the Catholic Church as an institution and financial power was much more resilient to social crises (e.g., recurrent plague outbreaks) compared to the general population. Likewise, it would be interesting to assess urban and rural building activity separately to study the inter-linkage between urban and rural economic and demographic development over time and space. Furthermore, it would be of interest to investigate the changes in the composition of tree species used for construction over time. The use of less preferred tree species would indicate changes in forest species composition, advancing deforestation and resulting in a lack local construction timber. Similarly, changes in the age of the trees used for construction activities could be informative with regard to resource availability (e.g., Baillie, 1982, 1995; Eckstein, 2007). Answering these types of questions, however, would require the collection of more extensive contextual data from each construction, a serious challenge on its own.
Finally, the strikingly strong agreement found in this study between reconstructed building activity history from felling dates and grain prices merits further investigations. Felling dates could be compared with grain prices on regional scales where the grain prices are identified through hierarchical cluster analysis to strongly co-vary. Future studies could strive to compare the association between the number of felling dates and plague outbreaks on local to regional scales [as done for Ireland by Mallory and Baillie (1988) and Baillie (2006), and for Czechia by Kolář et al. (2022)]. Ljungqvist et al. (2018) found that the number of plague outbreaks, at an aggregated scale, showed an even stronger association with the number of felling dates than grain prices. However, this required improved plague data at finer spatial scales. Extant plague datasets contain too many geographical biases, for most parts of Europe, to allow for meaningful regional studies of plague–building activity associations (e.g., Roosen and Curtis, 2018). Furthermore, comparing the number of felling dates with the number of major armed conflicts, or their intensity, on local to regional scales would be of interest, for example for Czechia (Kolář et al., 2022). This would be challenging as the quantification of the number of armed conflicts is prone to bias (see van Bavel et al., 2019; Ljungqvist et al., 2021) and available war datasets do not properly capture the societal costs of the conflicts of interest.
Conclusion
This article has demonstrated that large datasets of dendrochronologically dated felling dates from historical construction timbers can serve as useful source material for exploring the spatial dimensions of construction rates. The broader spatio-temporal patterns of building activity rates in western and central Europe were investigated employing 54,045 georeferenced waney edge felling dates spanning the 1250–1699 CE period. Using geostatistical and statistical techniques, we investigated the spatial-temporal dynamics of reconstructed building activity, as inferred from the felling dates, in relation to various measures of demographic, economic, climate, and social conditions. We compared regional similarities and differences in the timing, duration, and magnitude of periods of “crisis” and “prosperity” at different spatial and temporal scales as reflected by changes in building activity. Our conclusions are: (a) in regions with adequate data coverage, felling dates capture major demographic trends, (b) there is a strong negative association between the number of felling dates and grain prices, (c) there is a moderately strong positive association between the number of felling dates and mining activity, and (d) there are more regime shifts detected in regions with dense felling date coverage. Finally, we can demonstrate that quantitative research based on felling dates reflecting building activity offers an important tool to test hypotheses, and better explain causal relationships in demographic developments.
Data Availability Statement
The data analyzed in this study is subject to the following licenses/restrictions: Private data. Requests to access these datasets should be directed to FCL, fredrik.c.l@historia.su.se.
Author Contributions
FCL and AS designed the study, set up the experiments, and wrote the manuscript together with WT, PJK, and UB. All remaining authors contributed with felling date data and with additions to, and edits of, the text. All the authors reviewed the final manuscript.
Funding
FCL and AS were supported by the Swedish Research Council (Vetenskapsrådet, grant no. 2018-01272). FCL conducted the work with this article as a Pro Futura Scientia XIII Fellow funded by the Swedish Collegium for Advanced Study through Riksbankens Jubileumsfond. WT was supported by the German Research Foundation (DFG, TE 613/3-1). AD received funding from the European Research Council (ERC) under the European Union’s Horizon 2020 research and innovation programme (grant agreement no. 677152). AH was supported by Riksbankens Jubileumsfond (grant no. IN20-0026). MD-D was funded by the Dutch Research Council (Nederlandse organisatie voor Wetenschappelijk Onderzoek, grant no. 016.Veni.195.502). TK, MR, and UB were supported the SustES project – “Adaptation strategies for sustainable ecosystem services and food security under adverse environmental conditions” (CZ.02.1.01/0.0/0.0/16_019/0000797). LS was supported by Deutsche Forschungsgemeinschaft (DFG, German Research Foundation) under Germany’s Excellence Strategy – EXC 2150 ROOTS – 390870439. FL was supported by a European Research Council (ERC) Synergy Grant (4-OCEANS; grant agreement no. 951649) under the European Union’s Horizon 2020 research and innovation programme.
Conflict of Interest
The authors declare that the research was conducted in the absence of any commercial or financial relationships that could be construed as a potential conflict of interest.
Publisher’s Note
All claims expressed in this article are solely those of the authors and do not necessarily represent those of their affiliated organizations, or those of the publisher, the editors and the reviewers. Any product that may be evaluated in this article, or claim that may be made by its manufacturer, is not guaranteed or endorsed by the publisher.
Acknowledgments
We thank Barbara Leuschner, Dendrochronologisches Labor Göttingen, for making felling date data from northern and central Germany available for the study. We thank Esther Jansma for constructive comments on an earlier version of this article, for contributing with felling dates data from the Netherlands, and for making them publicly available at https://doi.org/10.34894/ZWBVSW. We thank Mike Baillie and David Brown for access to Irish felling dates data, and David Brown, Brendan Maione-Downing, and Brianán Nolan for assisting their compilation, as kindly supported by the Initiative for the Science of the Human Past at Harvard University. Finally, we would like to thank the British scholars that have published their felling dates and associated metadata in the journal Vernacular Architecture, including in particular Nat W. Alcock, Bob Meeson, and Daniel Miles.
References
Aksözen, M., Hassler, U., and Kohler, N. (2017a). Reconstitution of the dynamics of an urban building stock. Build. Res. Inf. 45, 239–258. doi: 10.1080/09613218.2016.1152040
Aksözen, M., Hassler, U., Rivallain, M., and Kohler, N. (2017b). Mortality analysis of an urban building stock. Build. Res. Inf. 45, 259–277. doi: 10.1080/09613218.2016.1152531
Alcock, N. W. (1987). Index of tree-ring dates for British buildings: 1976–1987. Vernac. Arch. 18, 56–58. doi: 10.1179/vea.1987.18.1.56
Alcock, N. W. (1993). Index of tree-ring dates for British buildings: 1988–1992. Vernac. Arch. 24, 61–65. doi: 10.1179/vea.1993.24.1.61
Alcock, N. W. (1998). Index of tree-ring dates for British buildings: 1993–1997. Vernac. Arch. 29, 136–145. doi: 10.1179/vea.1998.29.1.136
Alfani, G., and Ó Gráda, C. (eds) (2017). Famines in European History. Cambridge: Cambridge University Press. doi: 10.1017/9781316841235
Allen, R. C. (2000). Economic structure and agricultural productivity in Europe, 1300–1800. Eur. Rev. Econ. Hist. 4, 1–25. doi: 10.1017/S1361491600000125
Allen, R. C. (2001). The great divergence in European wages and prices from the Middle Ages to the First World War. Explor. Econ. Hist. 38, 411–447. doi: 10.1006/exeh.2001.0775
Allen, R. C., and Unger, R. W. (2019). The Allen-Unger Global Commodity Prices database. Res. Data J. Humanit. Soc. Sci. 4, 1–10. doi: 10.1163/24523666-00401006
Baillie, M. G. L. (1995). A Slice Through Time: Dendrochronology and Precision Dating. London: Routledge.
Baillie, M. G. L. (1999). Exodus to Arthur: Catastrophic Encounters with Comets. London: BT Batsford.
Bannister, B. (1962). The interpretation of tree-ring dates. Am. Antiq. 27, 508–514. doi: 10.2307/277675
Bardet, J.-P., and Dupâquier, J. (eds) (1997). Histoire des Populations de l’Europe I: Des Origines aux Prémices de la Révolution Démographique [in French]. Paris: Fayard.
Barras, R. (2009). Building Cycles: Growth & Instability. Chichester: Wiley-Blackwell. doi: 10.1002/9781444310009
Bartholin, T. S. (1989). Dendrokronologiske undersøgelser af Ystadsområdets kirker [in Danish]. Lund Stud. Mediev. Archaeol. 5, 211–219.
Bartholin, T. S. (1990). Dendrokronologi – og metodens anvendelsesmuligheder indenfor bebyggelseshistorisk forskning [in Danish]. Bebyggelsehistorisk Tidskr. 19, 43–61.
Bateman, V. N. (2015). Markets and Growth in Early Modern Europe. London: Routledge. doi: 10.4324/9781315655321
Becker, B. (1991). “Dendrochronologische datierung von nadelhölzern (Tanne, Fichte, Kiefer) in Süddeutschland,” in Dendrochronologische Datierung von Nadelhölzern in der Hausforschung – Süddeutschland und Angrenzende Gebiete Internationales Symposium im Freilichtmuseum des Bezirks Oberbayern an der Glentleiten, 18. Mai 1990, Vol. 10, eds D. Eckstein and B. Becker (Großweil: Freundeskreis Freilichtmus. Südbayern, Schriftenreihe), 108–109. [in German]
Bernabei, M., Bontadi, J., and Diodato, M. (2017). The timber dating of Giotto’s Bell Tower in Florence (Italy). Int. J. Archit. Herit. 11, 305–313.
Bernabei, M., Bontadi, J., Quarta, G., Calcagnile, L., and Diodato, M. (2016). The baptistry of Saint John in Florence: the scientific dating of the timber structure of the dome. Int. J. Archit. Herit. 10, 704–713. doi: 10.1080/15583058.2015.1109734
Bernabei, M., Brunetti, M., Macchioni, N., Nocetti, M., and Micheloni, M. (2021). Surveying and dating the wooden roof structure of St. Francis of Assisi Church in Valletta, Malta. Int. J. Archit. Herit. 15, 1886–1894. doi: 10.1080/15583058.2020.1734688
Biguet, B., and Letellier-d’Espinose, D. (2016). Angers: Formation de la Ville, Évolution de L’habitat [in French]. Nantes: Éditions 303, 527.
Biraben, J. N. (1979). Essai sur L’évolution du nombre des hommes [in French]. Population 34, 13–25. doi: 10.2307/1531855
Bocinsky, R. K., Rush, J., Kintigh, K. W., and Kohler, T. A. (2016). Exploration and exploitation in the microhistory of the pre-Hispanic Pueblo Southwest. Sci. Adv. 2:e1501532. doi: 10.1126/sciadv.1501532
Bohdálková, L., Bohdálek, P., Břízová, E., Pacherová, P., and Kuběna, A. A. (2018). Atmospheric metal pollution records in the Kovářská Bog (Czech Republic) as an indicator of anthropogenic activities over the last three millennia. Sci. Total Environ. 633, 857–874. doi: 10.1016/j.scitotenv.2018.03.142
Brown, D. M., and Baillie, M. G. L. (2012). Confirming the existence of gaps and depletions in the Irish oak tree-ring record. Dendrochronologia 30, 85–91. doi: 10.1016/j.dendro.2010.09.003
Brugger, S. O., Schwikowski, M., Gobet, E., Schwörer, C., Rohr, C., Sigl, M., et al. (2021). Alpine glacier reveals ecosystem impacts of Europe’s prosperity and peril over the last millennium. Geophys. Res. Lett. 48:e2021GL095039. doi: 10.1029/2021GL095039
Buchinger, G., and Grabner, M. (2017). Wald-Holz-Viertel: Historische Holzkonstruktionen Vom 12. Jahrhundert bis in die Frühmoderne. Schriftenreihe des Waldviertler Heimatbundes Band 57 [in German]. Horn: Waldviertler Heimatbund, 488.
Bulst, N., and Pfister, C. (1997). L’Allemagne. In: Bardet, J.-P., Dupâquier, J., Histoire des Populations de l’Europe I: Des Origines aux Prémices de la Révolution Démographique [in French]. Paris: Fayard, 509–526.
Büntgen, U., Bellwald, I., Kalbermatten, H., Schmidhalter, M., Freund, H., Frank, D. C., et al. (2006). 700 years of settlement and building history in the Lötschental/Switzerland. Erdkunde 60, 96–112. doi: 10.3112/erdkunde.2006.02.02
Büntgen, U., Frank, D., Liebhold, A., Johnson, D., Carrer, M., Urbinati, C., et al. (2009). Three centuries of insect outbreaks across the European Alps. New Phytol. 182, 929–941. doi: 10.1111/j.1469-8137.2009.02825.x
Büntgen, U., Kyncl, T., Ginzler, C., Jacks, D. S., Esper, J., Tegel, W., et al. (2013). Filling the Eastern European gap in millennium-long temperature reconstructions. Proc. Natl. Acad. Sci. U. S.A. 110, 1773–1778. doi: 10.1073/pnas.1211485110
Buringh, E., Campbell, B. M. S., Rijpma, A., and van Zanden, J. L. (2020). Church building and the economy during Europe’s ‘Age of the Cathedrals’, 700–1500 CE. Explor. Econ. Hist. 76, 101316. doi: 10.1016/j.eeh.2019.101316
Campbell, B. M. S. (2016). The Great Transition: Climate, Disease and Society in the Late-Medieval World. Cambridge: Cambridge University Press. doi: 10.1017/CBO9781139031110
Campbell, B. M. S., and Ludlow, F. (2020). Climate, disease and society in late-medieval Ireland. Proc. R. Ir. Acad. 120C, 159–252. doi: 10.3318/priac.2020.120.13
Carvalho, F., and Schulte, L. (2021). Reconstruction of mining activities in the Western Alps during the past 2500 years from natural archives. Sci. Total Environ. 750:141208. doi: 10.1016/j.scitotenv.2020.141208
Chilosi, D., and Federico, G. (2021). The effects of market integration during the first globalization: a multi-market approach. Eur. Rev. Econ. Hist. 25, 20–58. doi: 10.1093/ereh/heaa009
Clark, C. (1977). Population Growth and Land Use. London: Macmillan Press. doi: 10.1007/978-1-349-15775-4
Collet, D., and Schuh, M. (eds) (2018). Famines During the ‘Little Ice Age’ (1300–1800): Socionatural Entanglements in Premodern Societies. Cham: Springer. doi: 10.1007/978-3-319-54337-6
Cook, E. R., and Peters, K. (1981). The smoothing spline: a new approach to standardizing forest interior tree-ring width series for dendroclimatic studies. Tree Ring Bull. 41, 45–53.
Cook, E. R., Seager, R., Kushnir, Y., Briffa, K. R., Büntgen, U., Frank, D., et al. (2015). Old World megadroughts and pluvials during the Common Era. Sci. Adv. 1:e1500561. doi: 10.1126/sciadv.1500561
Crone, A., and Mills, C. M. (2003). Dendrochronologically dated buildings from Scotland. Vernac. Arch. 34, 84–89. doi: 10.1179/vea.2003.34.1.84
Crone, B. A., and Mills, C. M. (2012). Timber in Scottish buildings, 1450–1800; a dendrochronological perspective. Proc. Soc. Antiq. Scot. 142, 329–369.
Čufar, K., Bizjak, M., Kitek Kuzman, M., Merela, M., Grabner, M., and Brus, R. (2014a). Castle Pišece, Slovenia – building history and wood economy revealed by dendrochronology, dendroprovenancing and historical sources. Dendrochronologia 32, 357–363. doi: 10.1016/j.dendro.2014.08.002
Čufar, K., Bizjak, M., Kitek Kuzman, M., Merela, M., Grabner, M., and Brus, R. (2014b). “Environmental history of the Pišece castle reconstructed with the aid of wood investigation, dendrochronology and written sources,” in Man, Nature and Environment Between the Northern Adriatic and the Eastern Alps in Premodern Times, eds P. Štih and Ž Zwitter (Ljubljana: Znanstvena založba Filozofske fakultete Univerze v Ljubljani), 24–35.
Čufar, K., De Luis, M., Zupanèiè, M., and Eckstein, D. (2008). A 548-year long tree-ring chronology of oak (Quercus spp.) for SE Slovenia and its significance as dating tool and climate archive. Tree Ring Res. 64, 3–15. doi: 10.3959/2007-12.1
Daly, A. (2007). Timber, Trade and Tree-Rings: A Dendrochronological Analysis of Structural Oak Timber in Northern Europe, c. AD 1000 to c. AD 1650. Ph.D. thesis. Odense: University of Southern Denmark.
Dávid, G., and Fodor, P. (eds) (2000). Ottomans, Hungarians and Habsburgs in Central Europe: The Military Confines in the Era of Ottoman Conquest. Leiden: Brill.
Davy, C., and Foisneau, N. (2014). Sainte-Suzanne: Un Territoire Remarquable en Mayenne. Recherches et Creìations [in French]. Nantes: Éditions 303, 384.
De Pleijt, A. M., and van Zanden, J. L. (2016). Accounting for the “Little Divergence”: what drove economic growth in pre-industrial Europe, 1300 1800? Eur. Rev. Econ. Hist. 20, 387–409. doi: 10.1093/ereh/hew013
DiBiase, D., DeMers, M., Johnson, A., Kemp, K., Luck, A. T., Plewe, B., et al. (2006). Kernels and Density Estimation. The Geographic Information Science & Technology Body of Knowledge. Washington, DC: Association of American Geographers.
Domínguez-Delmás, M., Alejano-Monge, R., van Daalen, S., Rodríguez-Trobajo, E., García-González, I., Susperregi, J., et al. (2015). Tree-rings, forest history and cultural heritage: current state and future prospects of dendroarchaeology in the Iberian Peninsula. J. Archaeol. Sci. 57, 180–196. doi: 10.1016/j.jas.2015.02.011
Domínguez-Delmás, M., Trapaga-Monchet, K., Nayling, N., and García-González, I. (2017). Natural hazards and building history: roof structures of Segovia cathedral (Spain) reveal its history through tree-ring research. Dendrochronologia 46, 1–13. doi: 10.1016/j.dendro.2017.09.002
Domínguez-Delmás, M., van Daalen, S., Alejano-Monge, R., and Wazny, T. (2018). Timber resources, transport and woodworking techniques in post-medieval Andalusia (Spain): insights from dendroarchaeological research on historic roof structures. J. Archaeol. Sci. 95, 64–75. doi: 10.1016/j.jas.2018.05.002
Douglass, A. E. (1921). Dating our prehistoric ruins: how growth rings in trees aid in the establishing the relative ages of the ruined pueblos of the southwest. Nat. Hist. 21, 27–30.
Douglass, A. E. (1929). The secret of the Southwest solved by talkative tree-rings. Natl. Geogr. Mag. 56, 736–770.
Durandière, R., Devals, C., Buron, G., Gallicé, A., Pillet, D., and Desvigne, V. (2015). Ville Close, Territoire Ouvert [in French]. Nantes: 303-Arts, 399.
Eckstein, D. (2007). Human time in tree rings. Dendrochronologia 24, 53–60. doi: 10.1016/j.dendro.2006.10.001
Edouard, J.-L. (2010). “Longue chronologie de cernes du mélèze et occupation humaine depuis plus de mille ans dans la vallée de la Clarée (Briançonnais, Alpes françaises),” in Archéologie de la Montagne Européenne, Actes de la Table Ronde Internationale de Gap, 29 Septembre–1er Octobre 2008, Vol. 4, eds S. Tzortzis and X. Delestre (Paris: Bibliothèque D’archéologie Méditerranéenne et Africaine), 325–333. [in French]. doi: 10.4000/books.pccj.506
Edvinsson, R., and Söderberg, J. (2010). The Evolution of Swedish Consumer Prices 1290–2008. Stockholm: Ekerlids Förlag & Sveriges Riksbank.
Eickhoff, S., Groth, A., Jungklaus, B., Grup, G., and Schopper, F. (2012). 1636 – Ihre Letzte Schlacht: Leben im Dreissigjährigen Krieg [in German]. Brandenburg an der Havel : Archäologisches Landesmuseum Brandenburg.
Esper, J., Büntgen, U., Denzer, S., Krusic, P. J., Luterbacher, J., Schäfer, R., et al. (2017). Environmental drivers of historical grain price variations in Europe. Clim. Res. 72, 39–52. doi: 10.3354/cr01449
Fischer, D. H. (1996). The Great Wave: Price Revolutions and the Rhythm of History. Oxford: Oxford University Press.
Grabner, M., Buchinger, G., and Jeitler, M. (2018). Stories about building history told by wooden elements – case studies from Eastern Austria. Int. J. Archit. Herit. 12, 178–194. doi: 10.1080/15583058.2017.1372824
Haneca, K., Čufar, K., and Beeckman, H. (2009). Oaks, tree-rings and wooden cultural heritage: a review of the main characteristics and applications of oak dendrochronology in Europe. J. Archaeol. Sci. 36, 1–11. doi: 10.1016/j.jas.2008.07.005
Haneca, K., Debonne, V., and Hoffsummer, P. (2020). The ups and downs of the building trade in a medieval city: tree-ring data as proxies for economic, social and demographic dynamics in Bruges (c. 1200–1500). Dendrochronologia 64, 125773. doi: 10.1016/j.dendro.2020.125773
Haneca, K., and van Daalen, S. (2017). The roof is on fire! A dendrochronological reconstruction of the restoration of the Basilica of Our Lady in Tongeren (Belgium). Dendrochronologia 44, 153–163. doi: 10.1016/j.dendro.2017.05.001
Hobsbawm, E. (1954). The general crisis of the European economy in the 17th century. Past Present 5, 33–53. doi: 10.1093/past/5.1.33
Hollstein, E. (1980). Mitteleuropäische Eichenchronologie: Trierer Dendrochronologische Forschungen zur Archäologie und Kunstgeschichte [in German]. Mainz am Rhein: P. von Zabern.
Holzhauser, H. (2010). Zur Geschichte des Gornergletschers: Ein Puzzle aus Historischen Dokumenten und Fossilen Hoölzern aus dem Gletschervorfeld G84 [in German]. Bern: Geographisches Institut der Universität.
Holzhauser, H., Magny, M., and Zumbuühl, H. J. (2005). Glacier and lake-level variations in west-central Europe over the last 3500 years. Holocene 15, 789–801. doi: 10.1191/0959683605hl853ra
Hong, S. M., Candelone, J. P., Patterson, C. C., and Boutron, C. F. (1994). Greenland ice evidence of hemispheric lead pollution two millennia ago by Greek and Roman Civilizations. Science 265, 1841–1843. doi: 10.1126/science.265.5180.1841
Izdebski, A., Koloch, G., Słoczyński, T., and Tycner-Wolicka, M. (2016). On the use of palynological data in economic history: new methods and an application to agricultural output in Central Europe, 0–2000 AD. Explor. Econ. Hist. 59, 17–39. doi: 10.1016/j.eeh.2015.10.003
Jahnke, C. (2013). “The city of Lübeck and the internationality of early Hanseatic trade,” in The Hanse in Medieval and Early Modern Europe, eds J. Wubs-Mrozewicz and S. Jenks (Leiden: Brill), 37–58. doi: 10.1163/9789004241930_003
Karanitsch-Ackerl, S., Holawe, F., Laaha, G., Wimmer, R., and Grabner, M. (2017). Parameter-specific hydroclimatic sensitivity of a low-elevation network of living and historical tree-ring series from north-eastern Austria. Dendrochronologia 45, 39–51. doi: 10.1016/j.dendro.2017.06.004
Kelly, P. M., Leuschner, H. H., Briffa, K. R., and Harris, I. C. (2002). The climatic interpretation of pan-European signature years in oak ring width series. Holocene 12, 689–695. doi: 10.1191/0959683602hl582rp
Klajmon, B. (2013). Kościół pod Wezwaniem św. Marcina w Ćwiklicach w Świetle Najnowszych Odkryæ: Wstęp do Badań [in Polish]. Ćwiklice: The Church of St. Martin.
Kolář, T., Dobrovolný, P., Szabó, P., Mikita, T., Sochová, I., Kyncl, T., et al. (2021). Wood species utilization for timber constructions in the Czech lands over the period 1400–1900. Dendrochronologia 70:125900. doi: 10.1016/j.dendro.2021.125900
Kolář, T., Dobrovolný, P., Szabó, P., Mikita, T., Kyncl, T., Kyncl, J., et al. (2022). Effects of social and climatic factors on building activity in the Czech lands between 1450 and 1950: a dendrochronological analysis. J. Quat. Sci. 37, 123–132. doi: 10.1002/jqs.3381
Kolář, T., Kyncl, T., and Rybníček, M. (2012). Oak chronology development in the Czech Republic and its teleconnection on a European scale. Dendrochronologia 30, 243–248. doi: 10.1016/j.dendro.2012.02.002
Konieczny, A. (2009). Report from Dendrochronological Studies of Heritage Wooden Churches in Silesian Wojewodship Conducted in 2008. [in Polish], Vol. 1. Katowice: Śla̧skiego Wojewódzkiego Konserwatora Zabytków, 95–126.
Konieczny, A. (2010). Dendrochronological Studies of Heritage Wooden Churches in Silesian Wojewodship Conducted in 2009. [in Polish], Vol. 2. Katowice: Śla̧skiego Wojewódzkiego Konserwatora Zabytków, 187–202.
Konieczny, A. (2011). “The history of chapels construction in St. Jacob church in Toruń in light of archeological and dendrochronological researche,” in Dzieje i Skarby Kościoła Świêtojakubskiego w Toruniu. Towarzystwo Naukowe Organizacji i Kierownictwa, ed. K. Kluczwajd (Toruń: Dom Organizatora), 91–120.
Konieczny, A. (2012). Dendrochronological Studies of Heritage Wooden Architecture in Silesian Wojewodship Conducted in 2010–2011. [in Polish], Vol. 4. Katowice: Śla̧skiego Wojewódzkiego Konserwatora Zabytków, 188–220.
Kopke, N., and Baten, J. (2005). The biological standard of living in Europe during the last two millennia. Eur. Rev. Econ. Hist. 9, 61–95. doi: 10.1017/S1361491604001388
Lagerås, P., Broström, A., Fredh, D., Linderson, H., Berg, A., Björkman, L., et al. (2016). “Abandonment, agricultural change and ecology,” in Environment, Society and the Black Death: An Interdisciplinary Approach to the Late-Medieval Crisis in Sweden, ed. P. Lagerås (Oxford: Oxbow Books), 30–68. doi: 10.2307/j.ctvh1dr32.7
Le Roy, M., Astrade, L., Édouard, J.-L., Bazan, M.-P., and Iancovescu, C. (2017). Datation dendrochronologique de chalets d’alpage dans la zone cœur du Parc National de la Vanoise [in French]. Archeosciences 41, 7–22. doi: 10.4000/archeosciences.4944
Le Roy, M., Nicolussi, K., Deline, P., Astrade, L., Edouard, J. L., Miramont, C., et al. (2015). Calendar-dated glacier variations in the Western European Alps during the Neoglacial: the Mer de Glace record, Mont Blanc massif. Quat. Sci. Rev. 108, 1–22. doi: 10.1016/j.quascirev.2014.10.033
Ljungqvist, F. C., Seim, A., and Huhtamaa, H. (2021). Climate and society in European history. Wiley Interdiscip. Rev. Clim. Change 12:e691. doi: 10.1002/wcc.691
Ljungqvist, F. C., Seim, A., Krusic, P. J., González-Rouco, J. F., Werner, J. P., Cook, E. R., et al. (2019). Summer temperature and drought co-variability across Europe since 850 CE. Environ. Res. Lett. 14:084015. doi: 10.1088/1748-9326/ab2c7e
Ljungqvist, F. C., Tegel, W., Krusic, P. J., Seim, A., Gschwind, F. M., Haneca, K., et al. (2018). Linking European building activity with plague history. J. Archaeol. Sci. 98, 81–92. doi: 10.1016/j.jas.2018.08.006
Ljungqvist, F. C., Thejll, P., Christiansen, B., Seim, A., Hartl, C., and Esper, J. (2022). The significance of climate variability on early modern European grain prices. Cliometrica 16, 29–77. doi: 10.1007/s11698-021-00224-7
Loveluck, C. P., McCormick, M., Spaulding, N. E., Clifford, H., Handley, M. J., Hartman, L., et al. (2018). Alpine ice-core evidence for the transformation of the European monetary system, AD 640–670. Antiquity 92, 1571–1585. doi: 10.15184/aqy.2018.110
Luterbacher, J., Werner, J. P., Smerdon, J. E., Barriopedro, D., Fernández-Donado, L., González-Rouco, F. J., et al. (2016). European summer temperatures since Roman times. Environ. Res. Lett. 11:024001. doi: 10.1088/1748-9326/11/2/024001
Mallory, J. P., and Baillie, M. G. L. (1988). Tech nDaruch: the fall of the House of Oak. Emania Bull. Navan Res. Group 5, 27–33.
Margaryan, A., Lawson, D., Sikora, M., Racimo, F., Rasmussen, S., Moltke, I., et al. (2020). Population genomics of the Viking world. Nature 585, 390–396. doi: 10.1038/s41586-020-2688-8
McConnell, J. R., Chellman, N. J., Wilson, A. I., Stohl, A., Arienzo, M. M., Eckhardt, S., et al. (2019). Pervasive Arctic lead pollution suggests substantial growth in Medieval silver production modulated by plague, climate and conflict. Proc. Natl. Acad. Sci. U.S.A. 116, 14910–14915. doi: 10.1073/pnas.1904515116
McConnell, J. R., Wilson, A. I., Stohl, A., Arienzo, M. M., Chellman, N. J., Eckhardt, S., et al. (2018). Lead pollution recorded in Greenland ice indicates European emissions tracked plagues, wars, and imperial expansion during Antiquity. Proc. Natl. Acad. Sci. U.S.A. 115, 5726–5731. doi: 10.1073/pnas.1721818115
Meeson, B. (2012). Structural trends in English medieval buildings: new insights from dendrochronology. Vernac. Arch. 43, 58–75. doi: 10.1179/0305547712Z.0000000006
Meirion-Jones, G. I., and Grandchamp, P. G. (2013). La Demeure Seigneuriale Dans L’espace Plantagenet: Salles, Chambres et Tours [in French]. Rennes: Presses universitaires de Rennes, 488.
Meissner, K., Buckland, P. I., Linderson, H., and Hammarlund, D. (2012). Pilotprojekt “Dendro-Databas” i SEAD April 2012–Juni 2012. [in Swedish]. Umeå: Nationella Laboratoriet för Vedanatomi och Dendrokronologi, Lund University and Miljöarkeologiska Laboratoriet, Umeå University.
Miles, D. (1997). The interpretation, presentation and use of tree-ring dates. Vernac. Arch. 28, 40–56. doi: 10.1179/030554797786050563
Mills, C. M., Crone, A., Wood, C., and Wilson, R. (2017). Dendrochronologically dated pine buildings from Scotland: the SCOT2K native pine dendrochronology project. Vernac. Arch. 48, 23–43. doi: 10.1080/03055477.2017.1372674
More, A. F., Spaulding, N. E., Bohleber, P., Handley, M., Hoffmann, H., Korotkikh, E., et al. (2017). Next-generation ice core technology reveals true minimum natural levels of lead (Pb) in the atmosphere: insights from the Black Death. Geohealth 1, 211–219. doi: 10.1002/2017GH000064
Myrdal, J. (2012). “Source pluralism as a method of historical research,” in Historical Knowledge: In Quest of Theory, Method and Evidence, eds S. Fellman and M. Rahikainen (Newcastle upon Tyne: Cambridge Scholars Publishing), 155–189.
Nicolussi, K. (2002). Zur verwendung von holz als baumaterial im bereich von Tirol – ergebnisse dendrochronologischer untersuchungen [in German]. Jahrb. Hausforschung 51, 235–242.
Palmer, W. C. (1965). Meteorological Drought. Res. Paper No. 45. Washington, DC: U.S. Department of Commerce Weather Bureau, 58.
Parker, G. (2013). Global Crisis: War, Climate Change and Catastrophe in the Seventeenth Century. New Haven, CT: Yale University Press.
Persson, K. G. (1999). Grain Markets in Europe, 1500–1900: Integration and Deregulation. Cambridge: Cambridge University Press. doi: 10.1017/CBO9780511496820
Prokop, O., Kolář, T., Büntgen, U., Kyncl, J., Kyncl, T., Bošel’a, M., et al. (2016). On the paleoclimatic potential of a millennium-long oak ring width chronology from Slovakia. Dendrochronologia 40, 93–101. doi: 10.1016/j.dendro.2016.08.001
Rahlf, T. (1996). Getreide in der Sozial- und Wirtschaftsgeschichte vom 16. bis 18. Jahrhundert, Das Beispiel Köln im Regionalen Vergleich [in German]. Trier: Auenthal Verlag.
Ribarič, V. (1979). The Idrija earthquake of March 26, 1511 – a reconstruction of some seismological parameters. Tectonophysics 53, 315–324. doi: 10.1016/0040-1951(79)90076-3
Richter, K. (1986). Dendrocronología aplicada en la provincia de Teruel. Primer avance 1985/86. Kalathos 5–6, 199–210.
Richter, K., and Eckstein, D. (1986). Estudio dendrocronologico en España. Dendrochronologia 4, 59–71.
Robinson, E., Bocinsky, R. K., Bird, D., Freeman, J., and Kelly, R. L. (2021). Dendrochronological dates confirm a late prehistoric population decline in the American Southwest derived from radiocarbon dates. Philos. Trans. R. Soc. Lond. B Biol. Sci. 376:20190725. doi: 10.1098/rstb.2019.0718
Rodionov, S. N. (2004). A sequential algorithm for testing climate regime shifts. Geophys. Res. Lett. 31:L09204. doi: 10.1029/2004GL019448
Rodionov, S. N. (2006). The use of prewhitening in climate regime shift detection. Geophys. Res. Lett. 31:L12707. doi: 10.1029/2006GL025904
Rodriguez-Trobajo, E. (2008). Procedencia y uso de madera de pino silvestre y pino laricio en edificios históricos de Castilla y Andalucía [in Spainish]. Arqueol. Arquit. 5, 33–53. doi: 10.3989/arq.arqt.2008.88
Roosen, J., and Curtis, D. R. (2018). Dangers of noncritical use of historical plague data. Emerg. Infect. Dis. 24, 103–110. doi: 10.3201/eid2401.170477
Rosman, K. J. R., Chisholm, W., Hong, S., Candelone, J. P., and Boutron, C. F. (1997). Lead from Carthaginian and Roman Spanish mines isotopically identified in Greenland ice dated from 600 BC to 300 AD. Environ. Sci. Technol. 31, 3413–3416. doi: 10.1021/es970038k
Ruszczyk, G., and Konieczny, A. (2012). Churches in Silesia Region from XV and Beginning of XVI Century. Warszawa: Instytut Sztuki Polskiej Akademii Nauk.
Schweingruber, F. H. (1988). Tree Rings: Basics and Applications of Dendrochronology. Dordrecht: Kluwer Academic Publishers. doi: 10.1007/978-94-009-1273-1
Seifert, M. (2018). “Zur chronologie und typologie der wohnbauten Graubündens im Zeitraum von 1350 bis 1850,” in Die Schweiz von 1350 bis 1850 im Spiegel Archäologischer Quellen, ed. Archéologie Suisse, Groupe de travail suisse pour l’archéologie du Moyen Age et de l’époque moderne, and Association suisse Châteaux forts (Basel: Verlag Archäologie Schweiz). [in German]
Seim, A., Linscott, K., Heussner, K.-U., Bonde, N., Baittinger, C., Stornes, J.-M., et al. (2015). Diverse construction types and local timber sources characterize early medieval church roofs in southwestern Sweden. Dendrochronologia 35, 39–50. doi: 10.1016/j.dendro.2015.06.001
Shindo, L., Labbas, V., Edouard, J.-L., and Guibal, F. (2018). La construction en mélèze dans les Alpes du Sud depuis le Xe siècle: une nouvelle lecture dendrochronologique de l’occupation humaine en montagne et des ressources forestières, données et méthodologies inédites. Archéosci. Rev. D’archéométrie 42, 63–75. [in French] doi: 10.4000/archeosciences.5877
Spyt, B., Kaczka, R. J., Kściuszyk, K., and Zawadzka, M. (2016). Zastosowanie intensywności odbicia światła niebieskiego w datowaniu drewna historycznego [in Polish]. Stud. Mater. CEPL Rogowie 18, 201–207. doi: 10.1007/s10163-015-0422-7
Susperregi, J. (2007). “Oak dendrochronology at the Basque country,” in TRACE – Tree Rings in Archaeology, Climatology and Ecology, Vol. 5, Proceedings of the DENDROSYMPOSIUM 2006, April 20 the 22nd 2006, Tervuren, Belgium, Vol. 74, eds K. Haneca, A. Verheyden, H. Beekman, H. Gärtner, G. Helle, and G. Schleser (Tervuren: Schriften des Forschungszentrums Jülich, Reihe Umwelt), 35–42.
Susperregi, J., Telleria, I., Urteaga, M., and Jansma, E. (2017). The Basque farmhouses of Zelaa and Maiz Goena: new dendrochronology-based findings about the evolution of the built heritage in the northern Iberian Peninsula. J. Archaeol. Sci. Rep. 11, 695–708. doi: 10.1016/j.jasrep.2016.12.035
Tegel, W., Seim, A., Skiadaresis, G., Ljungqvist, F. C., Kahle, H.-P., Land, A., et al. (2020). Higher groundwater levels in western Europe characterize warm periods in the Common Era. Sci. Rep. 10:16284. doi: 10.1038/s41598-020-73383-8
Tegel, W., Vanmoerkerke, J., and Büntgen, U. (2010). Updating historical tree-ring records for climate reconstruction. Quat. Sci. Rev. 29, 1957–1959. doi: 10.1016/j.quascirev.2010.05.018
Tegel, W., Vanmoerkerke, J., Hakelberg, D., and Büntgen, U. (2016). “Des cernes de bois à l’histoire de la conjoncture de la construction et à l’évolution de la pluviométrie en Gaule du Nord entre 500 BC et 500 AD,” in Évolution des Sociétés Gauloises du Second Âge du Fer, Entre Mutations Internes et Influences Externes, eds G. Blancquaert and F. Malrain (Amiens: Revue Archéologique de Picardie), 639–653. [in French]
Thun, T. (2009). Norwegian dendrochronology; almost a victim of the Black Death. AmS Varia 49, 37–42.
Thun, T., and Svarva, H. (2018). Tree-ring growth shows that the significant population decline in Norway began decades before the Black Death. Dendrochronologia 47, 23–29. doi: 10.1016/j.dendro.2017.12.002
Turchin, P., and Nefedov, S. A. (2009). Secular Cycles. Princeton, NJ: Princeton University Press. doi: 10.1515/9781400830688
van Bavel, B., Curtis, D., Hannaford, M., Moatsos, M., Roosen, J., and Soens, T. (2019). Climate and society in long-term perspective: opportunities and pitfalls in the use of historical datasets. Wiley Interdiscip. Rev. Clim. Change 10:e611. doi: 10.1002/wcc.611
van der Schrier, G., Barichivich, J., Briffa, K. R., and Jones, P. D. (2013). A scPDSI-based global data set of dry and wet spells for 1901–2009. J. Geophys. Res. Atmos. 118, 4025–4048. doi: 10.1002/jgrd.50355
van der Schrier, G., Jones, P. D., and Briffa, K. R. (2011). The sensitivity of the PDSI to the Thornthwaite and Penman – Monteith parameterizations for potential evapotranspiration. J. Geophys. Res. 116:D03106. doi: 10.1029/2010JD015001
Van Eenhooge, D., Debonne, V., and Haneca, K. (2018). Middeleeuwse Dakkappen in Brugge en Ommeland. Een Catalogus, Onderzoeksrapporten Agentschap Onroerend Erfgoed 97 [in Dutch]. Brussel: Agentschap Onroerend Erfgoed.
Ważny, T. (1990). Aufbau und Anwednung der Dendrochronologie für Eichenholz in Polen [in German]. Ph.D. dissertaion. Hamburg: University of Hamburg, 213.
Ważny, T. (2001). Dendrochronologia Obiektów Zabytkowych w Polsce [in Polish]. Gdańsk: Muzeum Archeologiczne w Gdańsku, 137.
Westphal, T. (2002). “Frühe stadtentwicklung zwischen mittlerer Elbe und unterer Oder zwischen ca. 1150 und 1300 aufgrund der dendrochronologischen daten,” in Mit Einem Beitrag zur Dendrochronologischen Untersuchung Frühmittelalterlicher Burgwälle der Niederlausitz, ed. T. Westphal (Bonn: Universitätsforschungen zur Prähistorischen Archäologie (UPA), Bd. 86), 194. [in German]
Westphal, T. (2003). “High-medieval urban development between the middle Elbe River and the lower Oder based on dendrochronological data,” in Tree Rings in Archaeology, Climatology and Ecology, Bd.1. Proceeding of the Dendrosymposium 2002, Vol. 33, eds G. Schleser, M. Winiger, A. Bräuning, G. Gärtner, G. Helle, E. Jansma, et al. (Jülich: Schriften des Forschungszentrums Jülich, Reihe Umwelt), 20–22.
Wilson, A. I. (2011). “Developments in Mediterranean shipping and maritime trade from the Hellenistic period to AD 1000,” in Maritime Archaeology and Ancient Trade in the Mediterranean, eds D. Robinson and A. I. Wilson (Oxford: Oxford Centre for Maritime Archaeology), 33–59.
Keywords: archeology, cultural heritage, dendrochronology, dendroarchaeology, felling dates, history, historical demography
Citation: Ljungqvist FC, Seim A, Tegel W, Krusic PJ, Baittinger C, Belingard C, Bernabei M, Bonde N, Borghaerts P, Couturier Y, Crone A, van Daalen S, Daly A, Doeve P, Domínguez-Delmás M, Edouard J-L, Frank T, Ginzler C, Grabner M, Gschwind FM, Haneca K, Hansson A, Herzig F, Heussner K-U, Hofmann J, Houbrechts D, Kaczka RJ, Kolář T, Kontic R, Kyncl T, Labbas V, Lagerås P, Le Digol Y, Le Roy M, Leuschner HH, Linderson H, Ludlow F, Marais A, Mills CM, Neyses-Eiden M, Nicolussi K, Perrault C, Pfeifer K, Rybníček M, Rzepecki A, Schmidhalter M, Seifert M, Shindo L, Spyt B, Susperregi J, Svarva HL, Thun T, Walder F, Ważny T, Werthe E, Westphal T, Wilson R and Büntgen U (2022) Regional Patterns of Late Medieval and Early Modern European Building Activity Revealed by Felling Dates. Front. Ecol. Evol. 9:825751. doi: 10.3389/fevo.2021.825751
Received: 30 November 2021; Accepted: 31 December 2021;
Published: 26 January 2022.
Edited by:
Martin De Luis, University of Zaragoza, SpainReviewed by:
Katarina Čufar, University of Ljubljana, SloveniaChris J. Caseldine, University of Exeter, United Kingdom
Copyright © 2022 Ljungqvist, Seim, Tegel, Krusic, Baittinger, Belingard, Bernabei, Bonde, Borghaerts, Couturier, Crone, van Daalen, Daly, Doeve, Domínguez-Delmás, Edouard, Frank, Ginzler, Grabner, Gschwind, Haneca, Hansson, Herzig, Heussner, Hofmann, Houbrechts, Kaczka, Kolář, Kontic, Kyncl, Labbas, Lagerås, Le Digol, Le Roy, Leuschner, Linderson, Ludlow, Marais, Mills, Neyses-Eiden, Nicolussi, Perrault, Pfeifer, Rybníček, Rzepecki, Schmidhalter, Seifert, Shindo, Spyt, Susperregi, Svarva, Thun, Walder, Ważny, Werthe, Westphal, Wilson and Büntgen. This is an open-access article distributed under the terms of the Creative Commons Attribution License (CC BY). The use, distribution or reproduction in other forums is permitted, provided the original author(s) and the copyright owner(s) are credited and that the original publication in this journal is cited, in accordance with accepted academic practice. No use, distribution or reproduction is permitted which does not comply with these terms.
*Correspondence: Fredrik Charpentier Ljungqvist, fredrik.c.l@historia.su.se
†These authors have contributed equally to this work