Does the development of the digital economy improve carbon emission efficiency?
 Jun Han
 Tianhe Jiang
- 1High-Quality Development Evaluation Institute, Nanjing University of Posts and Telecommunications, Nanjing, China
- 2Institute of Population Research, Nanjing University of Posts and Telecommunications, Nanjing, China
The improvement of carbon emission efficiency is guided by high-quality economic development, and the organic integration of ecology and economy is an important goal of putting sustainable economic development into action. Based on China's provincial panel data from 2008 to 2019, this article constructs a digital economy development index from the perspective of the digital economy and analyzes its impacts on carbon emission efficiency. The conclusion is that the development of the digital economy has significantly improved carbon emission efficiency. Through the analysis of the spatial spillover effect, it is found that regional carbon emission efficiency has a spatial correlation, but the development of the digital economy has no significant impact on the carbon emission efficiency of neighboring regions. Industrial structure adjustment, the energy structure, and technological progress are further analyzed as three mechanisms affecting carbon emission efficiency. It is found that the quality of industrial structure adjustment significantly promotes the improvement of carbon emission efficiency, while the energy structure significantly inhibits its improvement, and the range of industrial structure adjustment and technological progress have no significant impact on carbon emission efficiency. Based on the threshold effect, carbon emission efficiency be promoted only when the energy structure is in the interval unit (0.1288, 0.2441) and technological progress is >1.0591. Based on the above conclusion, we put forward corresponding policy suggestions.
Introduction
Economic development has greatly improved people's living standards, which is a need for human progress and civilization, as well as an inevitable result of social development. However, in the process of modernization, the considerable consumption of coal, oil, gas, and other energy sources inevitably leads to considerable carbon emissions. This sustained growth of carbon emissions is not only a need for sustainable economic development in developing countries but also determines the right of subsistence and the pursuit of a better material life for citizens in developing countries. However, with the intense interest game and political contest at the Copenhagen Conference in 2009, carbon emissions and the low-carbon economy have gradually triggered a debate around the world. In particular, China, as the largest developing country in the world, has become the world's largest carbon emitter, as its total carbon emissions are equivalent to those of the United States and the European Union combined. Although its per capita carbon emissions are far lower than those of the United States and Australia, it is still criticized by other countries. However, in the process of modernization, many developing countries, including China, will continue to expand their consumption of steel, cement, and fossil energy, and their carbon emissions will continue to increase for some time to come.
The development model characterized by high carbon has brought a huge leap forward for China's economic take-off, bringing China's per capita GDP above $10,000, but the strong carbon lock-in effect has also imposed a heavy cost on China's ecological environment. Such carbon emissions led to very serious air pollution, particularly in some parts where environmental pollutant discharge capacity exceeds local ecological capacity. Environmental pollution problems have become increasingly sharp, especially serious fog weather in recent years, which has become the key to environmental pollution and triggered the further reflection of society as a whole. As China's economic growth turns from a high-speed stage to a high-quality one, China's huge population base, unbalanced regional development and poverty problems, and employment structural contradictions, such as long-standing still are the most difficult tasks facing the Chinese government; in this difficult process, carbon emissions caused by the strong carbon lock-in effect and economic development will continue to grow. Meanwhile, the Chinese government has proposed the goals of carbon emissions peaking by 2030 and carbon neutrality by 2060. Under the constraints of the dual-carbon goals of “carbon peaking” and “carbon neutrality,” local governments will be faced with the problem of balancing economic development with green and low-carbon development for a long time.
Nowadays, climate change is increasingly becoming a core environmental issue. The important purpose of digital economy development is to change the habits and motivations of producers, consumers, and investors, and to obtain as many useful products or services as possible with as low-carbon emissions or related environmental costs, so as to improve carbon emission efficiency. Therefore, carbon emission efficiency is integrated with economic and ecological sustainability, and it is an important goal that puts sustainable development into practice. Compared with simple economic efficiency indicators, it has the advantage of high comprehensiveness, representativeness, and clear directionality, so as to promote governments around the world to focus on the goal of carbon neutrality.
Given this, this article first constructs the indicator structure of the digital economy from five dimensions proposed by previous scholars and then calculates the carbon emission efficiency of China's provinces. Next, it empirically examines the relationship between the digital economy and carbon emission efficiency, and on this basis, discusses the heterogeneity and mechanism of the digital economy's impact on carbon emission efficiency. The possible marginal contributions of this article are as follows: First, from a research perspective, unlike most studies that only focus on the impact of digital economy development on high-quality development, productivity, inclusive growth, employment, and other economic factors, this article focuses on the impact of the digital economy on carbon emission efficiency from the perspective of possible environmental effects of the digital economy. Second, in terms of research content, this article takes into account the impacts of spatial differences and digital economy characteristics on benchmark regression results, and then studies the heterogeneous impact of the digital economy on carbon emission efficiency from the perspective of regional heterogeneity and the digital economy's dimensional heterogeneity, and also discusses the mechanism of the digital economy's impact on regional carbon emission efficiency from the perspective of industrial structure adjustment, the energy structure, and technological progress. Third, in a practical sense, it provides empirical support for further strengthening the construction of the digital economy and provides a scientific basis for China to achieve the dual-carbon goals.
Literature review
Severe environmental problems make countries increasingly aware of coping with global climate change, and scholars have carried out in-depth discussions on carbon emissions intensity, carbon emissions rate, and green economic growth from various aspects and perspectives.
Technological innovation and carbon emissions
In terms of research on technological innovation and carbon emissions, many studies have pointed out that technological innovation or progress is not only a positive measure to save energy and reduce emissions but also an important way to solve carbon dioxide emissions and climate warming (Camarero et al., 2013). For example, Wang et al. (2016) believe that increasing R&D investment in green technology will not only reduce energy consumption per unit of GDP but also significantly reduce total carbon emissions and per capita carbon emissions in both developed and developing countries. Basu and Fernald (2008) discuss the impact path of technological progress on carbon emissions. For developed countries, technological progress reduces household energy consumption, but for industry, it will expand energy consumption. Nie et al. (2021) believe that the government's expansion of R&D expenditure can alleviate enterprises' emission behavior to a certain extent. Meanwhile, ordered environmental regulation can force enterprises to reduce carbon emissions in the short term, but in the long run, it may increase enterprises' behavior of emissions theft or excess. Wu et al. (2021) believe that regional technological innovation makes a significant difference in the ecological environment. The higher the level of economic development, the more technological innovation can bring about the improvement of carbon emission efficiency; on the contrary, the less developed the economy, the less significant the improvement of carbon emission efficiency will be.
Moreover, some scholars hold different views on the positive role of technological innovation in reducing carbon emissions, i.e., technological innovation may have long-term and short-term phased or cyclical impacts on carbon emissions. For example, Craig et al. (2018) study the driving factors of carbon emission efficiency based on population, capital, and technology models, and find that technological progress has no significant impact on improving carbon emission efficiency, which is mainly influenced by multiple factors such as city size, human capital, and foreign-funded enterprises. Sturgeon (2021) shows that technological progress has an inhibitory effect on carbon emission efficiency only in the long term, but has no significant impact in the short term. Zhu et al. (2009) find that technological progress has a rebound effect on carbon emission efficiency through the decomposition of total factor productivity, mainly because technological progress can promote economic growth and increase energy consumption, but in the short term, technical capacity often fails to deal with the increase of carbon emissions, leading to the reduction of carbon emission efficiency. In addition, some studies show that the impact of technological progress on carbon emissions reduction is random and volatile. Ferreira et al. (2018) decompose the factors affecting carbon emissions through the log-average Dirichlet exponential decomposition (LMDI) theory and point out that scientific and technological progress brought by R&D investment has certain randomness to carbon emissions brought by energy consumption. By studying China's carbon emissions, Li D. et al. (2022) suggest that although the technological innovation effect of carbon emissions is generally positive, there is a large fluctuation, and the role of science and technology in reducing carbon emissions is still insufficient. Camarero et al. (2013) find that technological progress has a significant threshold effect on reducing carbon intensity by studying the effect of technological progress on carbon emissions intensity in different European countries.
Digital economy and industrial structure
With the change in economic development patterns, the digital economy, which is driven by data elements, is booming and attracting the attention of people from all walks of life. For example, Nunes (2016) points out that although the vigorous development of the digital economy has brought about the deep integration of traditional industries, there are significant differences in the penetration of the digital economy into different industries, and more technology-intensive industries have a higher demand for digital technology. Liu et al. (2022a) believe that the digital economy promotes the rapid transformation of old and new drivers, drives the transformation and upgrading of industries to the middle and high ends, and results in a series of innovations in the connotation, space, and field of industrial development. Jiang et al. (2022) point out that the digital economy promotes the construction of digital infrastructure, brings application innovation of digital technology, optimizes the allocation efficiency of factor resources, and promotes the deep integration of industrial development and technology. Sun et al. (2019) hold that the deep integration of the digital economy and traditional industries has spawned more new industries or new forms of business, and led to the diversification of industries. Liu et al. (2020) conclude through an empirical analysis of the spatial spillover effect that both the development of information technology and the transformation and upgrading of the manufacturing industry are characterized by spatial aggregation, and that information technology plays a role in promoting the development of industrial enterprises from the low end to the high end. Zhang et al. (2019) empirically analyze the impact of digital economy development on urban ecological efficiency and point out that there is path dependence on digital economy development→industrial structure upgrading→ecological efficiency improvement, and the development of the digital economy reduces pollutant emissions through the transformation and upgrading of the industrial structure. Sun et al. (2022) comparatively analyze the drivers of digital economy development in different countries in manufacturing transformation and upgrading and point out that the digital economy significantly promotes the development stage of manufacturing transformation from a lower level to a higher level, and there is a long-term dynamic non-reciprocal interaction between digital economy development and manufacturing transformation and upgrading. Centobelli et al. (2018) construct an economic growth model by building more departments, where the digital economy is divided into the supply and demand sides, and set up a digital industrial department and a digital convergence network, suggesting that figures do not curry favor with the simple push between industrialization and industrial digitalization, and digital industrial department and the department of digital convergence is not balanced. Chitra (2007) and Chiou et al. (2011) analyze the impact of the digital economy on the speed of industrial transformation and the sophistication and rationalization of the industrial structure and conclude that the digital economy can significantly improve the speed of industrial transformation and has a backward advantage of increasing marginal return on industrial structure transformation.
Industrial restructuring and carbon emissions
In industrial structure and carbon emission-related research, the evolution or change in the industrial structure will have a profound impact on carbon emissions and the ecological environment. Chen et al. (2013) point out from a microscopic perspective that industrial structure adjustment is a complex system evolution process among various industries and components within the industry. In this process, industrial structure adjustment reduces resource mismatch, improves the internal operation efficiency of the industry as a whole, and reduces carbon emissions on the whole. Drake et al. (2016) suggest that the impacts of different peak carbon emissions scenarios on the industrial structure, among which energy-consuming industries have the most significant impact on the energy output structure, and environmental protection policies ordered by the government are the most effective way to promote industrial adjustment. Esenduran et al. (2017) analyze the coupling between carbon emission efficiency and the industrial structure and point out that regional carbon emission efficiency and the industrial structure of different levels of economic development have great differences in the spatio-temporal pattern. The more developed the region is, the higher the coupling coordination level between carbon emission efficiency and the industrial structure is. In addition, the higher the internal coupling coordination between industries is, the lower the carbon emissions intensity is. Kannan et al. (2012) control the impact of energy structure, economic development, and industrial structure on carbon emissions in the urbanization stage. The results show that upgrading the industrial structure can significantly reduce carbon emissions intensity in the process of urbanization. Luken and Rompaey (2008) point out that there is not a complete linear change between the industrial structure and carbon emissions intensity, both of which are inverted “U-shaped.” As the investment in clean industries increases, carbon emissions from energy consumption of enterprises with high energy consumption will gradually decrease. Liu et al. (2015) analyze the impact of the industrial structure on carbon emissions from both horizontal and vertical dimensions and conclude that the higher the proportion of secondary industries in the economic structure, the higher the carbon emissions intensity is, and the higher the contribution rate to the carbon emissions intensity of the whole society is. However, by implementing industrial transformation and changing the energy consumption structure, carbon emissions can be reduced in the short term. Özdemir and Denizel (2012) divide China's economic structure into 16 industries and analyze the relationship between green productivity and industrial structure change. The study shows that industrial factors are negatively correlated with green productivity and technical efficiency at the industrial level of the light industry, and positively correlated with technological progress. In carbon emissions reduction, policies and regulations are formulated according to the characteristics and development trends of each industry.
Through a review of existing literature, it is found that the following deficiencies exist in relevant studies. First, existing studies mainly focus on the impact of the industrial structure on carbon emissions, especially the effect of the industrial structure on carbon emissions, and rarely analyze the efficiency of carbon emissions from the perspective of the quality and extent of industrial structure adjustment. Second, most literature mainly focus on carbon emission or ecological environment evaluation, while there are few studies on carbon emission efficiency. This article enriches existing literature by considering carbon emission efficiency from the perspective of energy input and output. Third, few scholars analyze the behavior of carbon emission efficiency from the perspective of digital economy development and the influence mechanism of the energy structure and technological progress.
Research design and data sources
Development of the digital economy
Index selection
There is still no unified standard for assessing the development level of the digital economy, although the digital economy has not only been widely used in production and life but has also penetrated various industries due to its rapid development. Considering the difficulty of data acquisition and the maximum acquisition of data within the research period, by referring to existing literature and understanding the development system of the digital economy (Nunes, 2016; Jiang et al., 2022), we select the following four primary indicators and 18 secondary indicators to calculate the comprehensive development index of the digital economy. The specific indicators are shown in Table 1. The index source range is 30 provincial-level units selected from 2007 to 2019 (Hong Kong, Macao, and Taiwan are temporarily excluded based on data availability), including the National Bureau of Statistics, State Information Center, China Academy of Information and Communication Technology, etc. It also includes the China Information Industry Yearbook, China Information Industry Statistical Yearbook, China Information Yearbook, Statistical Report on the Development of the Internet in China, White Paper on the Development and Employment of China's Digital Economy, etc.
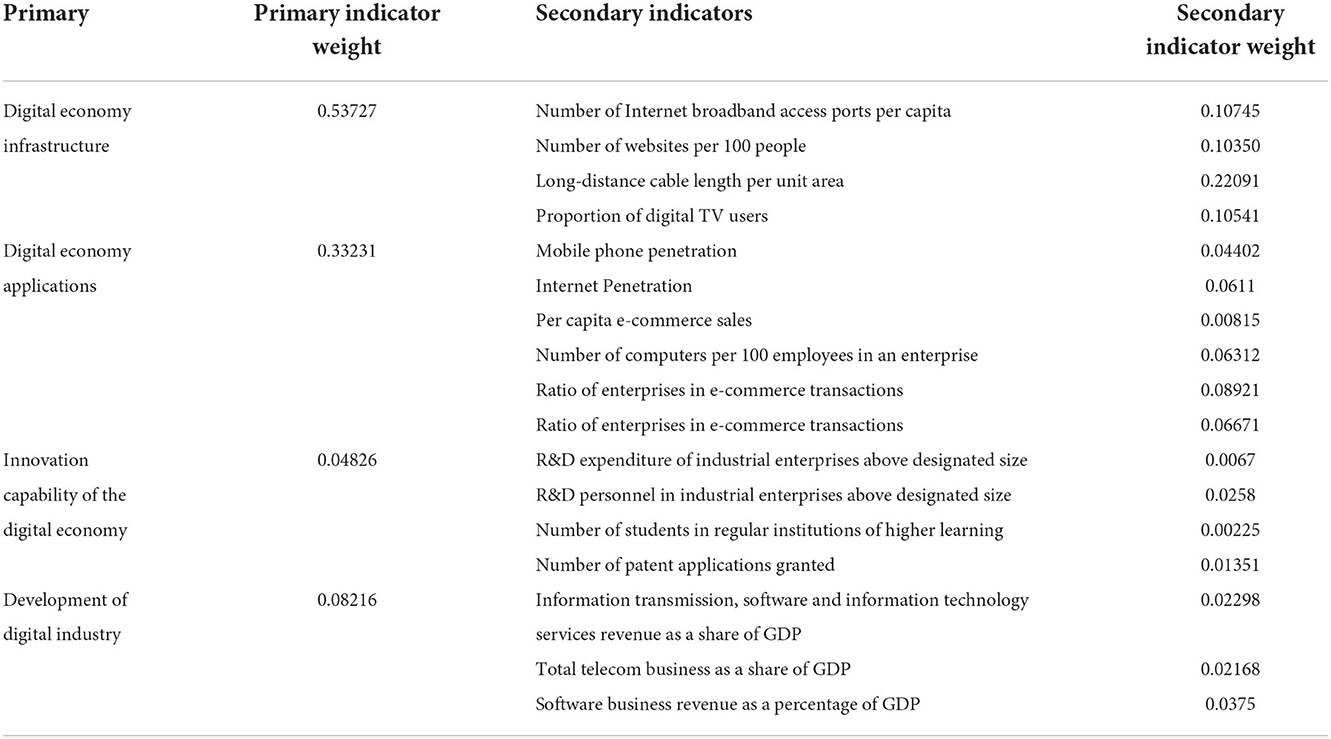
Table 1. Development indicators of the digital economy.
Data processing and indicator weight
After the selection of digital economy indicators, it is necessary to assign weight to different indicators. There are two main methods to assign weight: The first is the subjective value method, which means that relevant people who master knowledge, experience, or the importance of each indicator perform comparison sorting and assignment, and the disadvantage of this method is that the importance of the selected indicator is determined subjectively so that the information inside the selected indicator is not manifested, and the final weights are subjective, without a scientific basis, and the evaluation results may be distorted. The second is the objective weighting method. Based on the objective original data, the information reflected by the data is closely related to each other, or evaluated by the amount of information in the selected indicator. The weights calculated by the objective weighting method can better reflect the relevant distribution of the data. Compared with the subjective weighting method, the objective weighting method can avoid the shortcoming of subjectivity and get more objective evaluation results. The objective weight method includes entropy and principal component analysis. Among them, factor analysis makes an overall calculation based on a weighted average, but does not reflect the differences between different regions, while entropy can reflect the amount of information transmitted by the selected indicator and its proportion in the total amount of information, and further weight assignment is based on this. To ensure the objectivity and accuracy of the results, entropy is used to calculate the results.
The standardized value of the original data is calculated. Since different indicators are selected, the units between the indicators are not the same, so the purpose of data standardization is to eliminate the impact of the disunity of units.
For the standardization of positive indicators:
For the standardization of negative indicators:
In the formula, Dij represents the standardized value of the j-th indicator in the i-th year; Xij represents the data of the j-th indicator in the i-th year; max(Xij) represents the maximum value of the sample in the i-th year; min(Xij) represents the minimum value of the sample in the i-th year.
The proportion Cij of the indicator value of the i-th plan under the j-th indicator is calculated as follows:
In the formula, Cij represents the proportion of the i scheme indicator value under indicator j; Xij represents the j scheme indicator value of the j indicator; m represents the number of all indices under the j indicator.
The entropy value ej of the j-th indicator is calculated as follows:
In the formula, ej represents the entropy value of the j-th indicator; m represents the number of selected indicators, k = 1/ln(tn), where t represents the number of years and n represents the number of provinces.
The coefficient of variance for the j-th indicator is calculated as follows:
The weight of the j-th indicator is calculated as follows:
Finally, after determining the weight, the digital economy development level of each region can be calculated by the formula (7). By substituting the standardization of the original data into the formula, the comprehensive score (Si) of the digital economy development level of each region can be obtained.
Carbon emission efficiency
Input–output indicators of carbon emissions
Input indicators: (1) Capital input is measured by capital stock. Capital stock calculation method: Kit = (1−δ) × Kit−1 + Eit, where Kit represents the capital stock in the t period of the i region. δ represents the depreciation rate, referring to the study of Kannan et al. (2012), Wu et al. (2021) and the depreciation rate (δ) is set to be 10%. The gross fixed capital formation of each province is adjusted to the comparable price of 2000 as the base period, and the missing data are estimated by the perpetual inventory method. The capital stock in 2000 is based on the continuous growth model: Ki2000 = Ei2000/(δ + gi). gi represents the average growth rate of fixed asset investment in each province in China from 2000 to 2019 (Zhu et al., 2009; Xu et al., 2022); (2) labor input is measured by the total number of employees in the three major industries at the end of each province; (3) energy input is measured by the total energy consumption of each region.
Output indicators: (1) expected output is the actual GDP output of each province, and is adjusted to 2000 as the base period; (2) unexpected output is measured by the total carbon emissions of each province. As the International Energy Administration (IEA) and other foreign institutions have good estimation methods for carbon dioxide emissions of various countries or regions, carbon emissions of specific internal regions of the country have not been calculated or given specific values. Based on the research methods of Chiou et al. (2011) and Esenduran et al. (2017), this article estimates the carbon dioxide produced by fossil fuels through the following formula:
In formula (8), i represents the consumption type of fossil energy, CFi represents the average low heating value of various primary energy sources, CCi represents the carbon content of energy, COFi represents the carbon oxidation factor. Ei represents the energy consumption (physical quantity), 44 represents the molecular weight of carbon dioxide, and 12 represents the molecular weight of carbon. Since carbon dioxide is mainly from fossil fuels, based on the studies of Heryadi and Hartono (2016), Bian et al. (2017), and Nie et al. (2021), eight kinds of energy are selected: natural gas, fuel oil, diesel oil, kerosene, gasoline, crude oil, coking coal, and coal. The parameters of eight kinds of energy under formula (8) are given in Table 2. The above data are from the China Statistical Yearbook and China Energy Statistical Yearbook, China Science and technology Statistical Yearbook, and China Industrial Economy Statistical Yearbook.
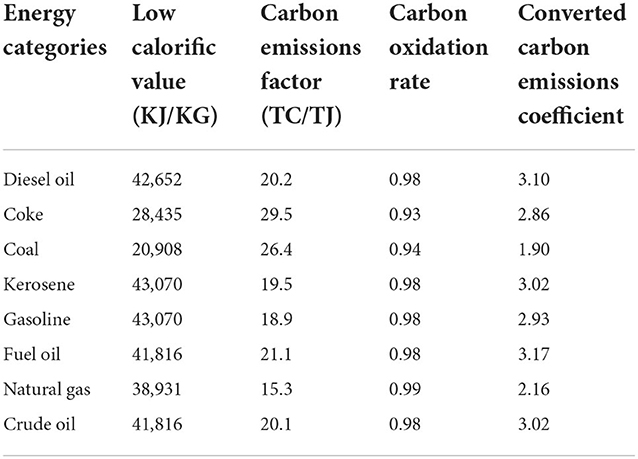
Table 2. Conversion table of carbon emissions coefficients of main energy sources.
Research methods
In order to incorporate environment, energy, and output into the measurement system, according to research methods such as Gaspareniene et al. (2018) and Schiederig et al. (2012), it is assumed that the production system has n decision-making units. There are m kinds of resource inputs, the expected output is μ1 (μ1 can include multiple types of expected output) and the undesired output is μ2 (μ2 also includes multiple undesired outputs), and the corresponding vectors are expressed as x ∈ Rm, , , the matrix is defined as X = (xij) ∈ Rm×n, where X is a possible set satisfying bounded and closed sets; , where Yg represents the expected output set; , where Yb represents the undesired output set, and X > 0 , Yg > 0, Yb > 0. The specific model can be transformed into:
In formula (9), λ ∈ Rn is the weight vector, λ ≥ 0 means constant return to scale (CRS), and if the formula satisfies both λ ≥ 0 and ∑ λ = 1, it means variable return to scale. x ≥ Xλ indicates that the actual expected output is less than the expected output of the production frontier, and yb ≥ Ybλ indicates that the actual unexpected output is greater than the expected output of the production frontier. Camarero et al. (2013) point out that if the results obtained under the assumption of constant return to scale and variable return to scale are different, the assumption of a variable return to scale should be selected. The analysis of carbon emission efficiency in this article is based on variable return to scale.
Since this article considers the problem of unexpected output, the traditional radial method cannot consider the impact of the “relaxation variable” on the efficiency value, as well as the change in efficiency resulting from the change in expected output and unexpected output. To solve this problem, Tone (2001) proposed a slack-based measure (SBM) model based on input and output slack variables, and further proposed the goal constraint problem under the condition of unexpected output. Assuming that there is a specific decision-making unit DMU (), based on the constraints of carbon emissions intensity, the following objective planning is constructed:
Formula (10) is an efficiency model based on the CRS hypothesis. μb, μg, and μ− represent the relaxation of undesirable output, expected output, and input, respectively. The objective function ρ* is strictly decreasing about μb, μg, and μ−. When μb = μg = μ− = 0 (ρ* = 1), the function is stored in the optimal solution. If 0 ≤ ρ* ≤ 1, it indicates that there is an efficiency loss in the decision-making unit, i.e., inefficiency, and corresponding improvement can be made in the input and output. The extent of improvement is determined by the ratio of the relaxation variable to their input and output. Based on the above analysis methods, we use the MAXDEA software to calculate the carbon emission efficiency of 30 provinces.
Control variables
The selection principle of control variables is mainly based on the factors that may have a significant impact on carbon emissions and are uncontrollable. Based on existing studies, considering the availability of data and the representativeness of variable indicators, the most influential indicators of the economy, technological innovation, and system are selected as important endogenous variables affecting carbon emission efficiency.
• Economic development level (pgdp). On the one hand, economic development means greater energy consumption, more carbon emissions, and lower carbon emission efficiency (Li D. et al., 2022; Sun et al., 2022). On the other hand, with the improvement of the economic development level, the upgrading of the industrial structure and the use of clean facilities, energy utilization, and pollutant treatment capacity have been improved (Sun et al., 2019). The regional per capita GDP is used to express the regional economic development level.
• Urbanization level (urb). There is usually an “inverted U” feature between urbanization and carbon emission (Tayibnapis et al., 2018; Wu et al., 2021), because when urban development is at a lower level, the industrial structure of the town may weaken carbon emission efficiency. On the contrary, when urban development is at a higher level, the industrial structure will change to an advanced level and the changes in the energy structure will improve carbon emission efficiency (Liu et al., 2022a). It is expressed by urban residents and the total population of the region.
• Open to the outside world (ope). Opening up has made many contributions to China's economic development, but also led to a large amount of energy consumption and substantial carbon emissions, especially the expansion of foreign trade brought by labor-intensive industries, which has brought the burden of energy conservation and emission reduction. In addition, due to technology spillover, the technological progress brought by opening up to the outside world can further reduce carbon emissions and improve energy efficiency (Li J. et al., 2022). The ratio of total foreign investment to GDP is used to measure the degree of opening up to the outside world.
• R&D investment (inno). The technological progress brought by R&D investment will improve production capacity, promote the utilization of clean energy, improve the efficiency of energy utilization, and then improve the efficiency of carbon emissions (Tayibnapis et al., 2018; Jiang et al., 2022). Considering the effectiveness and availability of data, this article selects the ratio of R&D expenditure to GDP to measure R&D investment.
• Environmental regulation (poll). Known as environmental awareness or sewage cost, it refers to the investment made by the government to control the intensity of environmental pollution control. It is also the social cost that the region needs to pay for the negative externalities arising from economic development. It is measured by the ratio of regional pollution control investment to GDP.
• Infrastructure construction (roa). Infrastructure has a systematic connotation and includes not only physical infrastructure networks, means of transportation, and equipment, but also specific transportation activities. The construction and expansion of infrastructure promote the increase of the whole socio-economic activity (Zhang et al., 2015; Li and Xu, 2020), which directly increases energy consumption and carbon emissions intensity, which is expressed by per capita road area.
Benchmark model
To explore the impact of digital economy development on carbon emission efficiency, the following benchmarking model is first constructed:
where, i represents region, t represents time, lncarb represents carbon emission efficiency, lndige represents digital economy development index, lnpgdp represents economic development level, lnurb represents urbanization level, lnope represents opening up to the outside world, lninno represents R&D investment, lngov represents government regulation, lnpoll represents environmental regulation, lnroa represents infrastructure construction, αit represents individual effect, and uit represents error term.
Spatial econometric model
Due to economic development, industrial transformation, energy structure, technology spillover, population flow, interregional trade transactions, market division and cooperation, and other factors, the distribution of carbon emissions among different regions will be affected. Carbon emissions have strong temporal and spatial characteristics in both time and space. Moreover, the application of digital technology realizes the efficient utilization and open sharing of data resources, breaks the geographical distance between economic entities, eliminates the constraints of geographical physical space, and strengthens the process of learning and knowledge socialization among subjects. Therefore, carbon emissions not only reflect the impact of other factors in the region but also will be more affected by the dynamic changes in the spatial pattern of other regional factors. Therefore, if the correlation of spatial factors is ignored, an error in analysis results may arise. Given this, based on the benchmark regression model, this article also considers the spatial econometric model. Economists represented by Anselin (1988) put forward the spatial error model (SEM), spatial auto-regression (SAC), and spatial Dobbin models (SDMs). Currently, the spatial transmission mechanisms assumed by these spatial econometric models are different. LeSage and Pace (2009) deeply demonstrate the application conditions of various spatial models in economics, and the representative economic meanings are also different. First, the most basic spatial econometric model is constructed:
where Y represents the observed value of the dependent variable (explained variable); X represents the observed value of the independent variable (exogenous explanatory variable); the β parameter reflects the effect of the independent variable X on the dependent variable Y; ε represents the random error term vector; μ represents the normal distribution random error vector; w represents the spatial weight coefficient matrix; wε is the interaction effect between the interference terms of different spatial observation units; λ represents the spatial error coefficient (or spatial autocorrelation coefficient), the value of λ reflects the strength of the spatial dependence between the random error terms (ε), and the value range is (−1, 1).
When θ = 0, the spatial Durbin model can be reduced to a spatial autoregressive (SAR) model.
When ρ = 0, the spatial Durbin model can be simplified to the spatial error model (SEM).
When θ = 0, ρ = 0, the spatial Durbin model degenerates to the standard least squares regression method (or linear regression).
In addition, if the spatial Doberman model is selected, due to its spatial lag term, the interpretation of parameters becomes more complex and it is difficult to explain the explained variables clearly. It should be derived from the perspective of partial differential of the SDM model, and the impact of independent variables on dependent variables should be decomposed into direct and indirect effects, so as to better describe the spatial impact. The SDM model can be transformed into the following vector form:
The partial differential matrix of explained variable Y to variable k in the explanatory variables (xit,i = 1, 2, ⋯ , N, i represents the i-th spatial observation unit) at time t is:
Formula (14): The mean of the diagonal elements of the matrix represents the direct utility; the mean of the sums of the non-main diagonal elements of all rows (or columns) is the indirect effect, and the change in a certain explanatory variable of a space individual has on itself or the direct and indirect effects brought by different space individuals are different. Through the above analysis, we construct a common spatial econometric model, then select an appropriate model for empirical analysis according to the test of the spatial econometric model, and construct the following basic spatial econometric model.
Formula (15): The explanatory variable and the explained variable are the same as the above formula, Control represents the control variable, w represents the spatial weight matrix, and w is defined as is the spatial lag term of the dependent variable, reflecting the spatial correlation between the dependent variables. wlndigeit and reflect the spatial effect of exogenous explanatory variables, and β2 and ξit reflect the spatial autocorrelation coefficients of exogenous explanatory variables. γt represents the time effect, μit represents the individual effect, and εit represents the disturbance term.
Results
This section first uses the benchmark regression results for analysis, and then further tests the spatial effect of carbon emission efficiency based on the benchmark regression results. The impact of progress on carbon emission efficiency is the main research topic of the carbon neutrality improvement path. Finally, a robustness test is carried out for possible endogeneity and measurement errors.
Benchmark results
Before analyzing the spatial effect of the development of the digital economy on carbon emission efficiency, we first choose the benchmark panel regression. This article uses Stata15 to adopt a stepwise regression method. To maintain the robustness of the explained variables, we choose to gradually add control variables for regression. The results are shown in Table 3.
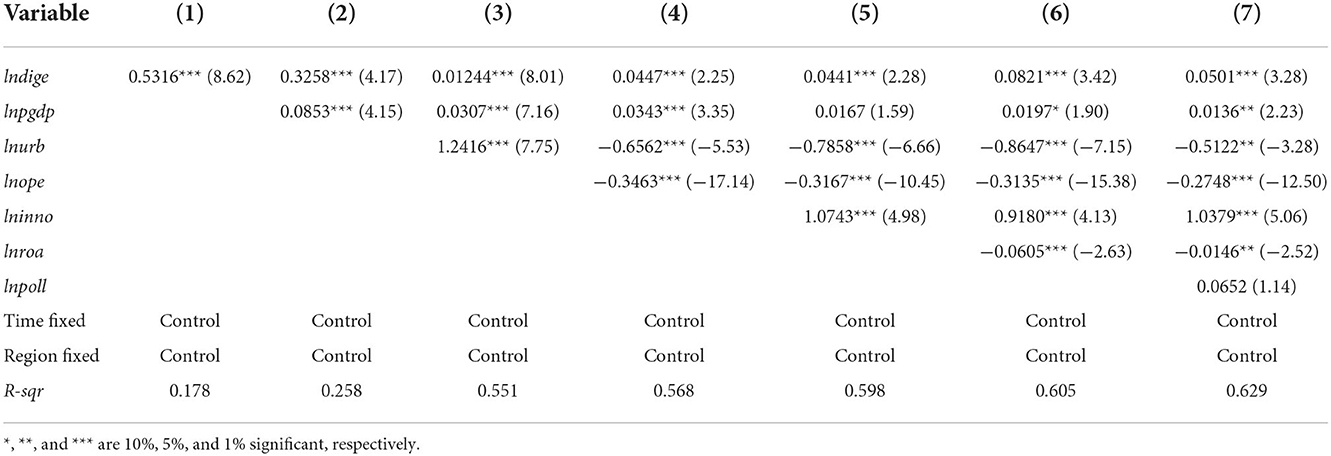
Table 3. Benchmark panel regression.
From the regression results of the benchmark panel in Table 3, it can be seen that without considering the control variables [model (1)], the regression coefficient of digital economy development on carbon emission efficiency is positive (0.5316), which has a significant positive promotion effect. It shows that the development of the digital economy has effectively improved carbon emission efficiency. After gradually adding control variables, it can be seen that although the regression coefficient of digital economy development on carbon emission efficiency is gradually decreasing, its significance and direction have not changed. In this regard, we believe that with the wide application of the Internet or information technology in the economy and society, the generation of a large amount of real-time online data, and the rapid development of computing, storage and network technologies, cloud computing, big data, artificial intelligence, 5G communication, biological identification, blockchain, mobile payment, virtual reality, and other products and services, the extensive application of these advanced information technologies in production and life has abandoned the original physical data carriers, and also changed the original energy consumption mode. It not only saves transaction costs but also reduces energy demand with less resource consumption, and promotes the formation of a new concept of energy consumption, ultimately improving energy use efficiency, and achieving an overall improvement in carbon emission efficiency. Through the regression results of the control variables, it can be seen that the level of economic development and the level of regional R&D investment has significantly promoted the improvement of carbon emission efficiency at a significance level of 5%. The transformation from “quantity” to “quality,” especially supply-side structural reform, has promoted the green and low-carbon development of industries and improved the energy utilization rate. Second, it is obvious that the level of regional R&D investment can improve carbon emission efficiency. Regional R&D investment has improved the application of clean energy practical technologies or the efficiency of energy utilization.
In addition, the urbanization process, opening up to the outside world, and transportation construction all significantly inhibit the improvement of carbon emission efficiency at a significance level of 5%. First, the process of urbanization is always accompanied by the inevitable trend of population and industrial spatial agglomeration. One view holds that in the early stage of the urbanization process, although the spatial agglomeration of population increases the pressure on the environment, the scale of population agglomeration affects the efficiency of carbon emissions. The disadvantages are less than the scale benefits of population growth for carbon efficiency. However, when the urbanization process reaches a certain limit, the disadvantages of urban population increase, especially industrialization clustering around cities and towns, begin to appear, and there is a lack of necessary environmental regulations and energy saving and emissions reduction measures. The effect will be smaller than the adverse effect it brings, that is, the scale effect of urbanization at this time is smaller than the crowding effect, which means that the urbanization process will aggravate production and living carbon emissions, and reduce carbon emission efficiency. Second, opening up to the outside world has restrained the improvement of carbon emission efficiency. The most important reason is that foreign-invested enterprises in China are mainly labor-intensive or capital-intensive enterprises, which usually have the characteristics of high energy consumption and high-carbon emissions, resulting in the decline of carbon emission efficiency. Third, for transportation construction, although the improvement of transportation infrastructure can improve the level of economic development, it also brings industrial agglomeration, the expansion of residents' travel range, and the increase in carbon emissions intensity.
Spatial effect results
Spatial correlation test
Since economists adopted the method of spatial or systematic correlation in the 20th century, it is only possible that there has been a problem of spatial correlation between them since economists adopted the method of econometric analysis. If we choose the spatial measurement method to solve the problem, whether there is a spatial correlation or not, we must first test the spatial correlation. If there is a spatial correlation between the variables, the spatial econometric model can solve this problem well. If there is no spatial correlation, the traditional method is used for analysis.
Through the spatial correlation test of carbon emission efficiency in Figure 1, it can be seen that the Moran test values are hovering between 0.2 and 0.38, and the Z statistics are more than 2. Except for 2013, the carbon emission efficiency values in other years have passed the significance test, indicating that the carbon emission efficiency values of different regions do not show complete randomness, showing a very obvious spatial positive correlation.
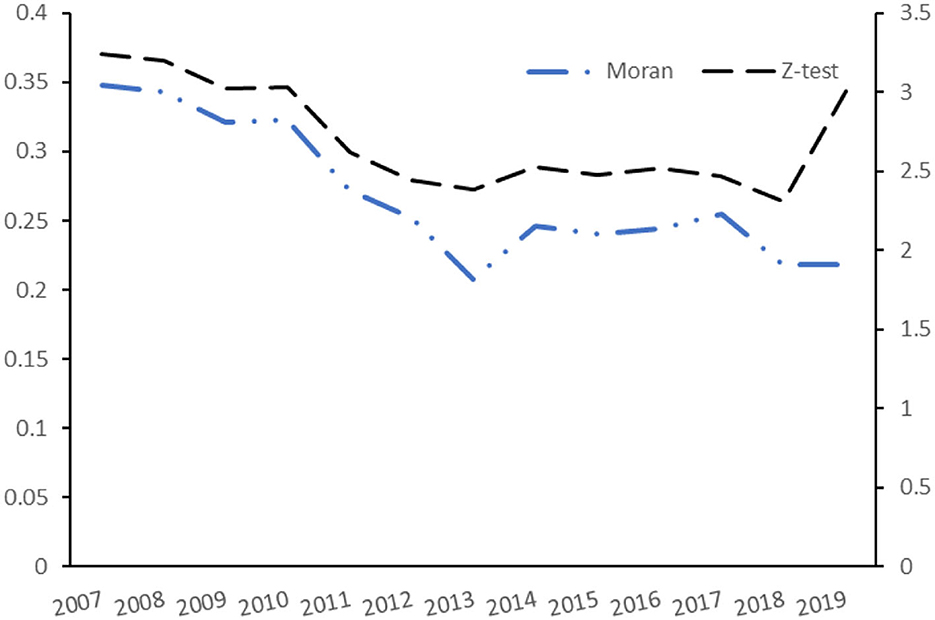
Figure 1. Spatial correlation test.
After determining the spatial correlation of the explained variables, it is necessary to select an appropriate model for analysis. According to the main classification of the three spatial econometric models, whether the spatial fixed, time fixed, or double fixed effect is selected, these three fixed effects can only be screened by different test methods. The spatial error model (SEM) or the spatial lag (SAR) model is selected according to the LM test. If the LM-error test is passed, but the LM-lag test is failed, the SEM model is selected; if the test result is the opposite, the SAR model is selected. If the two test results are not significant, the Robust-LM-lag and Robust-LM-err tests need to be further passed. If the Robust-LM-err test is passed, but the other test is failed, the SEM model is selected, otherwise, the SAR model is selected. If all Lagrangian significance tests are failed, the spatial Doberman model needs to be used for measurement.
In addition, whether the Hausman test selects a fixed effect or a random effect, if a fixed effect is selected for panel data, the fixed effect is divided into a time-fixed effect and a space-fixed effect. These two fixed effects are determined by the LR test. In case the effect test is passed, the double fixed effect is selected for analysis. The relevant test results are shown in Table 4. Through the above-mentioned spatial econometric model selection test, it can be seen that the use of the spatial Durbin model (SDM) under the double fixed effect to analyze the development of the digital economy is most suitable for carbon emission efficiency.
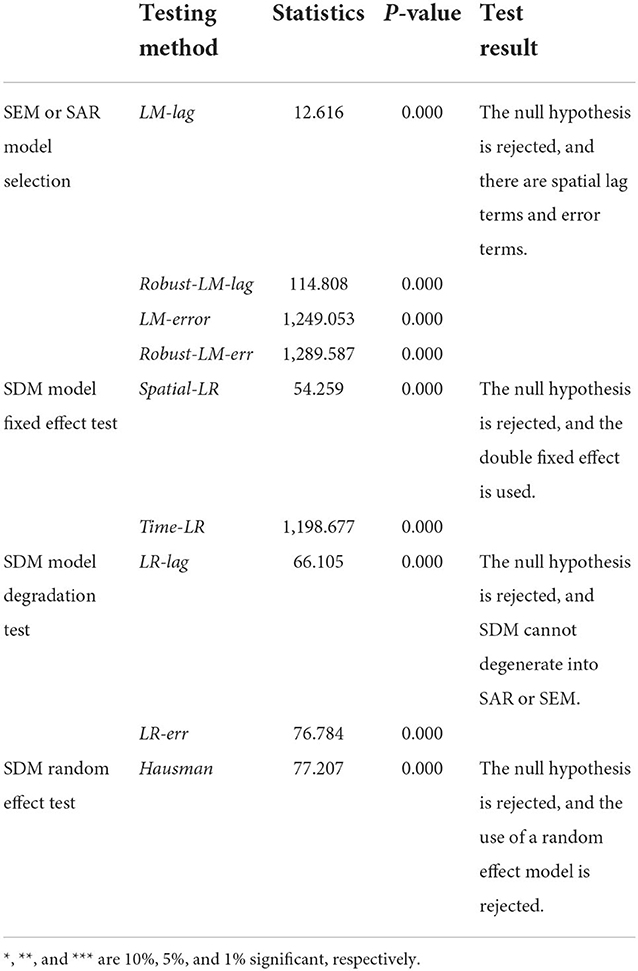
Table 4. Selection and test of a spatial econometric model.
Spatial spillover effect
According to Table 5, the SDM model is used to analyze the spatial spillover regression results of carbon emission efficiency. The goodness of fit of the regression coefficient is 0.679, slightly higher than that of ordinary panel regression (0.629), indicating that the Durbin model has a better fitting effect than the ordinary panel model. Specifically, the significance and direction of the core explanatory variable (digital economy development) on carbon emission efficiency and the ordinary panel regression coefficient have not changed. The regression coefficient of (0.1551) is significantly larger than that of the ordinary panel model (0.0501), which also indicates that ordinary panel regression without considering the spatial model underestimates the positive effect of digital economy development on carbon emission efficiency. By comparing the results of spatial panel regression and ordinary panel regression of control variables, it is found that only the significance of opening up to the outside world and environmental regulation has changed. Since control variables are not the focus of this article, the above-mentioned benchmark model prevails and is not repeated here. In addition, it is also found that the significance of the spatial lag term of the digital economy development and other control variables is not high, but since the regression coefficient of the spatial model lag term often cannot fully reflect the impact of the independent variable on the dependent variable, the spatial spillover effect can be obtained by combining the spatial spillover effect, which is broken down into direct effects, indirect effects and total effects for an explanation.
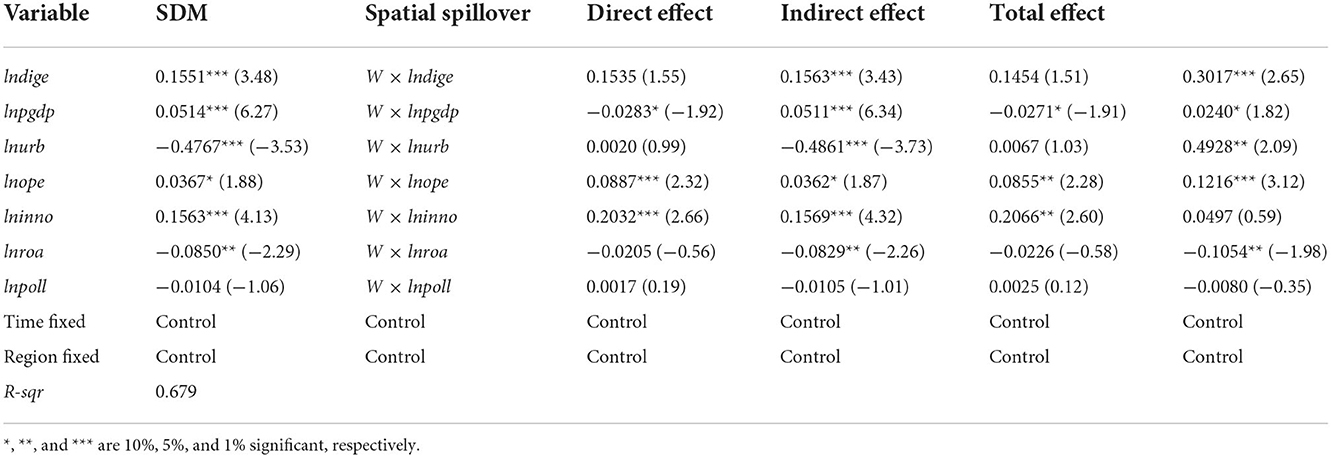
Table 5. Spatial effects of carbon emission efficiency.
From the decomposition of the influencing factors of the spatial Durbin model, it can be seen that the direct effect of the development of the digital economy has significantly promoted the improvement of carbon emission efficiency in the region, but the indirect spillover effect of the development of the digital economy is not significant, indicating that the development of the digital economy will not improve the near future. However, from the overall effect, the development of the digital economy has significantly promoted the improvement of the carbon emission efficiency of the entire region. By controlling the decomposition of variable effects, it can also be seen that the level of economic development and regional R&D investment only improves local carbon emission efficiency but does not improve the carbon emission efficiency of neighboring regions. In addition, although urbanization and transportation convenience directly inhibit carbon emission efficiency, the improvement of carbon emission efficiency has no significant impact on the carbon emission efficiency of neighboring regions, but from the overall effect, the two promote the improvement of carbon emission efficiency. In a word, looking at the control variables of carbon emission efficiency, the level of influence on carbon emission efficiency has both the influence of local factors and spillover effects from other regions, but the influence of this region is significantly greater than the effect of spatial spillovers on carbon emission efficiency.
Influence mechanism of carbon emission efficiency
In the process of the development of human society, with a new round of scientific and technological revolution and industrial transformation in the ascendant, technological progress and industrial transformation always go hand in hand. The industry often surpasses the traditional industry and gradually becomes the leading industry in the industrial system, which promotes the accelerated evolution of the industrial structure to a higher level, presents new characteristics, and provides a way for transformation and upgrading. In this process, the industrial structure and technological progress, energy consumption, and energy. There is a strong correlation between utilization efficiencies (Figure 2).
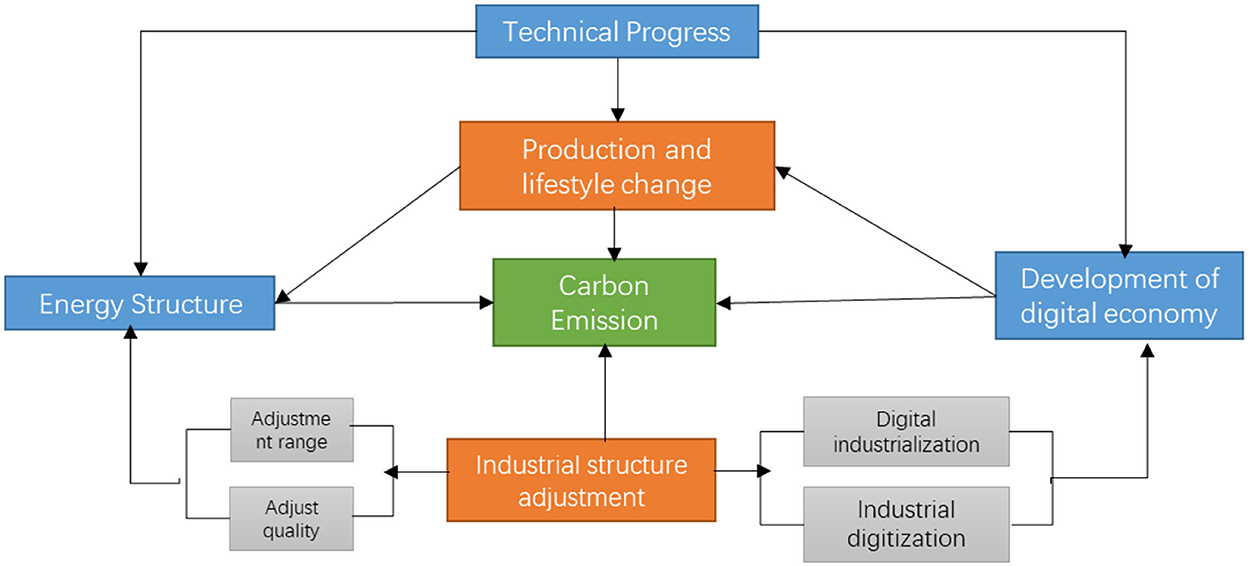
Figure 2. The impact mechanism of carbon emission.
The consensus of all sectors of society is that adjusting the industrial structure, changing the energy structure, and technological progress are important implementation paths to reduce carbon emissions, improve carbon emission efficiency and carbon neutralization (Zhou et al., 2011; Tseng and Hung, 2014; Zhang et al., 2015). First, the adjustment of the industrial structure mainly affects the development of the digital economy through two aspects; first, the digital industrialization (or information industry) provides technologies, services, or solutions for the development of the digital economy to promote the development of the digital economy. Second, the application of digital technologies through industrial digitization, including but not limited to the industrial Internet, artificial intelligence, the Internet of Things, and the platform economy brings about the deep integration of industries and the digital economy, which significantly promotes the R&D and technology application of the digital economy. Second, the adjustment range and quality of the industrial structure determine the impact on the total energy consumption and energy use intensity and indirectly affect the carbon emissions intensity. Finally, the impact of technological progress on carbon emissions. First, technological progress is the internal driving force for the transformation of production and life. Its impact on the digital economy lies in the continuous exploration of new technologies, the transformation of technologies into productive forces, and their application in actual production. It enables social productive forces to enter a new stage and bring about changes in economic paradigms. Second, the impact of technological progress on the structure of energy consumption. On the one hand, technological progress has improved the energy conversion efficiency or replaced the original high-energy consumption and high-emission machinery and equipment, which has fundamentally improved the energy structure and reduced energy consumption. On the other hand, because technological progress can promote economic growth and bring more energy demand to the whole society, it may have a negative impact on energy utilization efficiency, that is, there is a rebound effect.
Indicator construction
Adjustment range of industrial structure
For the calculation of the index of industrial structure change, refer to the methods of Findeisen and Jens (2008). The adjustment range of industrial structure (adj) is reflected by measuring the intensity of the total employment of industrial enterprises and the reconfiguration of the total employment in the region.
Among them, e(i, t + 1) and e(i, t), respectively, represent the number of employees in the secondary industry of industry i in period t + 1 and period t, and e(t+1) and e(t), respectively, represent the total number of employees in industry i in period t + 1 and period T. The index reflects the range of cross-industry allocation of the labor force. Only when the employment of all industries in the region increases or decreases in the same proportion as the total employment, adj is equal to 0.
Quality of industrial structure adjustment
The quality of the adjustment of the industrial structure is that the adjustment of the industrial structure causes the original market factors to be transferred from sectors with lower productivity to sectors with higher productivity and technical complexity (Wang et al., 2020). That is to say, the quality of industrial structure adjustment has two connotations in essence: one is the change in the ratio of input factors; the other is the improvement of labor productivity. Its calculation method is;
Among them, i, j, and t represent the region, industry, and time, respectively; Sijt represents the ratio of the added value of j industry to the total added value of the industry in the time i area; Fijt represents the labor productivity of j industry in i region. The higher the labor productivity in a region, the greater the proportion of all industries, and the greater the quality of its industrial structure adjustment qua.
Measurement of technological progress
For the measurement of technological progress, the measured green total factor productivity (GTFP) is often decomposed to obtain pure efficiency, technical efficiency, and scale efficiency. The technological progress index is measured by the technical efficiency index, drawing on the research indicators of Liu et al. (2020) and Wang and Liu (2017). The input and output indicators are respectively; the expected output is the real GDP of the region, and the nominal GDP of each year in the region is adjusted to the real GDP based on 2007 after excluding the factors of price and inflation. Unexpected outputs are three industrial wastes, including three indicators of industrial wastewater, sulfur dioxide, and industrial soot emissions. The factor input is capital, labor, and energy. Capital input refers to the practice of Liu et al. (2020) and uses the perpetual inventory method to calculate the total fixed capital formation in each year with 2,000 as the base period to obtain the capital stock data. The labor input uses the number of employees in urban units at the end of each year in the region. The energy input uses standard coal converted from eight main energy sources, including coal, coke, crude oil, gasoline, kerosene, diesel, fuel oil, and natural gas. Regarding the calculation of GTFP, this article adopts the widely used Malmquist–Luenberger index based on the SBM model. Finally, the total factor productivity is calculated and decomposed by MAXDEA software, and the technological progress index is separated.
Energy structure
Energy consumption is the direct cause of carbon emission intensity, so the impact of changes in energy structure on carbon emission efficiency has always been the focus of attention from all walks of life. Some scholars measure the energy structure by converting various energy sources into the ratio of standard coal to the total consumption of all energy sources, while Kannan et al. (2012) and Zhang et al. (2015) believe that the ratio of output value to GDP brought by coal consumption in the industry is more suitable. The specific formula is as follows:
Among them, enesit represents the proportion of coal in the energy consumption structure of region i in year t, GDPit represents the gross regional product of region i in year t, HCIitj represents the output value of the j-th high coal-consuming industry in the t-th year in region i, and the number of high coal-consuming industries, m represents the number of industries with high coal consumption, which are electricity, heat production and supply, petroleum processing, coking and nuclear fuel processing, ferrous metal smelting and rolling, non-metallic mineral products, coal mining, and washing, chemical raw materials and chemical products manufacturing, non-ferrous metal smelting and rolling processing, paper and paper products industry, and other eight categories of industries. This indicator directly measures the proportion of the output of high coal-consuming industries in GDP and reflects the energy consumption structure of the regional economy.
Modeling
Based on the construction of methods 5.1.1–5.1.4, the effects of industrial structure adjustment quality (qua) and adjustment range (adj) on carbon emission efficiency are first investigated, and the basic model is constructed as follows:
Among them, i and t represent the region and time and ind represents the adjustment of industrial structure (adjustment range and adjustment quality, respectively). Other variables have the same meaning as the above formula. Similarly, considering the impact of energy structure (enes) and technological progress (tec) on carbon emission efficiency, the following models are constructed, respectively:
Based on the above baseline model, this article also focuses on the interaction effect of other variables and the development of the digital economy, so as to analyze whether the existence of interaction terms has synergistic or antagonistic effects on carbon emission efficiency. Therefore, on the basis of models (7) and (8), the interaction terms of industrial structure adjustment, energy structure, and technological progress multiplied by digital economic development are introduced to construct the model (22).
Results
According to formulas (6)–(11), the regression results in Tables 6, 7 are obtained. The impact of the quality and range of industrial structure adjustment on carbon emission efficiency are analyzed in Table 6. First, we analyze the impact of industrial structure adjustment on carbon emission efficiency after excluding the development variables of the digital economy [Table 6 model (1)]. We can find that the adjustment range of the industrial structure has no significant impact on carbon emission efficiency. In the case of spatial spillover, the adjustment range of industrial structure has no significant effect on carbon emission efficiency. After adding the development variables of the digital economy, we find that the adjustment range of industrial structure, as well as the interactive term between digital economy development and industrial structure adjustment (lndige×lnadj), has no significant impact [Table 6 model (2)]. In this regard, it can be considered that although the rapid development of the service industry has become a new engine of economic growth, making the added value of China's tertiary industry exceed the secondary industry with high energy consumption and high emissions since 2012, for the whole society, the efficiency of carbon emissions has not improved the input–output efficiency of carbon emissions intensity due to the change in the adjustment range of industrial structure.
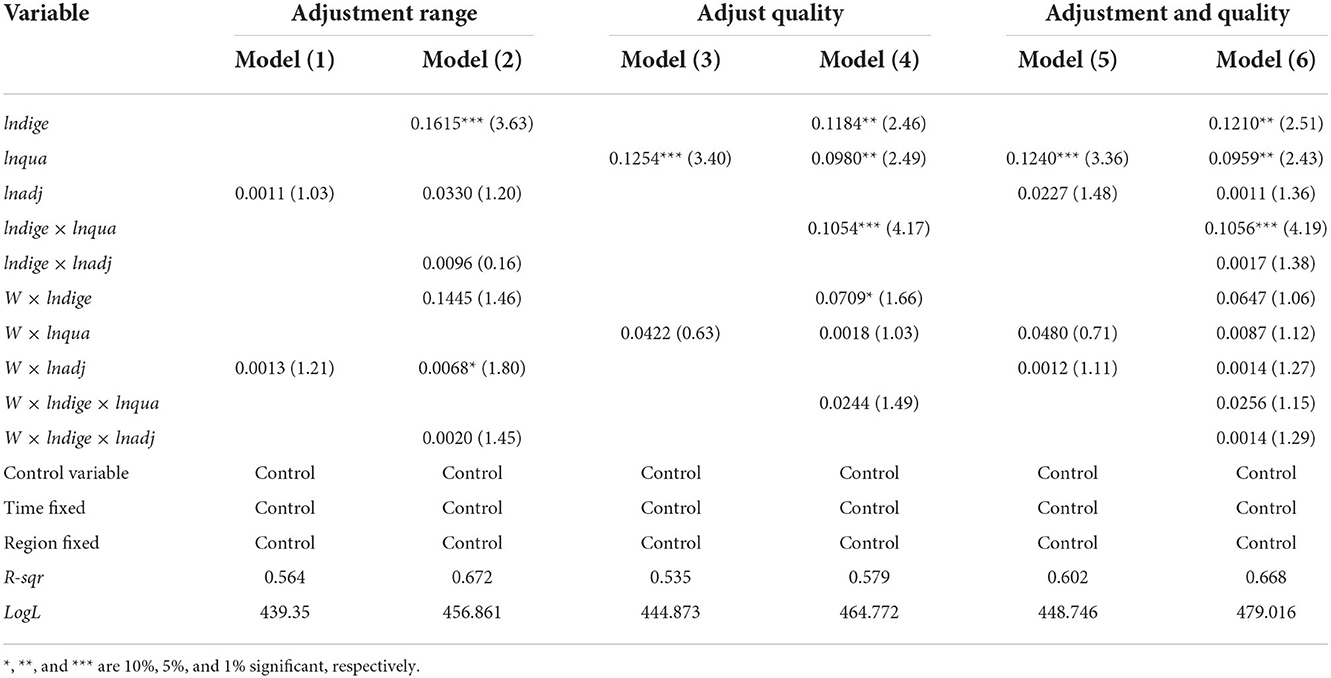
Table 6. Impact of industrial structure adjustment on carbon emission efficiency.
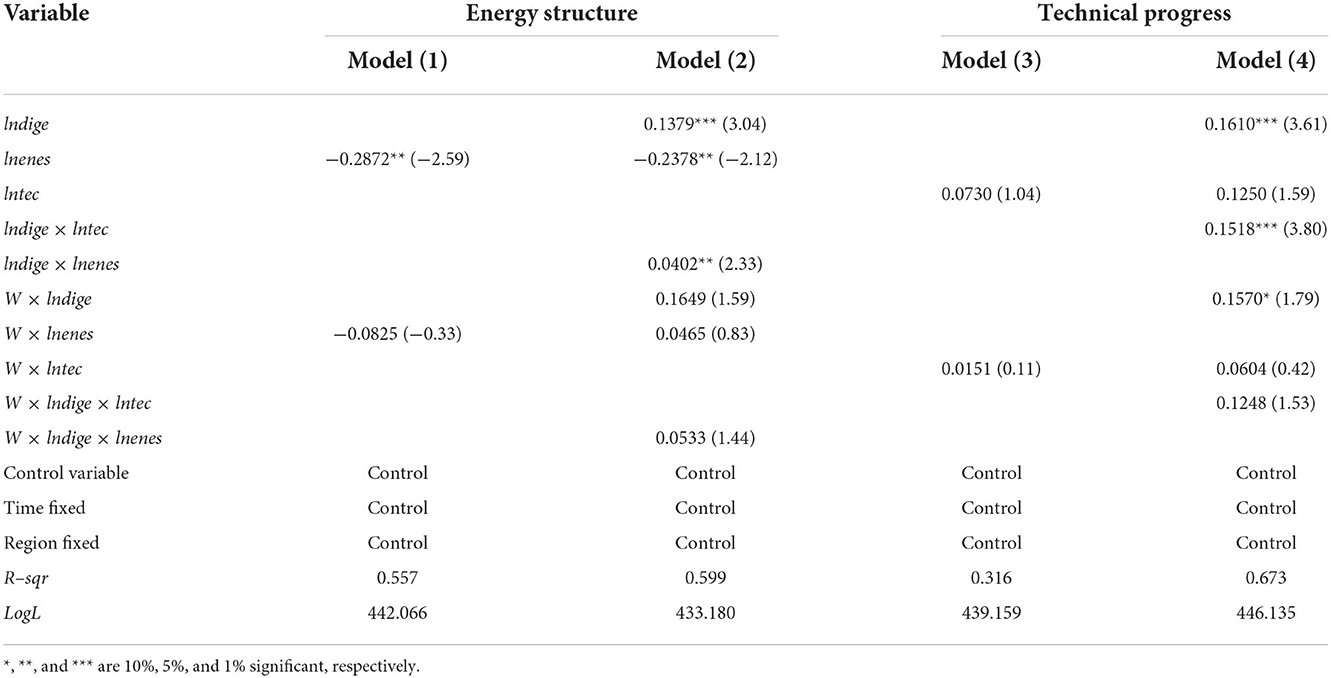
Table 7. Impact of energy structure and technological progress on carbon emission efficiency.
Second, considering the impact of the quality of industrial structure adjustment on carbon emission efficiency, it can be seen that the quality of industrial structure adjustment has a significant positive effect on carbon emission efficiency [models (3) and (4) in Table 6], indicating that industrial structure adjustment The quality changes the input and output of the original factors, the reduction of the factor input reduces the carbon emissions of the undesired output, and the expected output increases, which brings about the improvement of the carbon emission efficiency. The results of the interaction term of the quality of digital economy and industrial structure adjustment (lndige×lnqua) and the interaction term of digital economy development and industrial structure adjustment (lndige× × lnadj) show that the current synergy between digital economy development and industrial structure adjustment does not bring about carbon emission efficiency improvement. In addition, it can also be found that the spatial spillover of the quality of industrial structure adjustment has no significant effect on the carbon emission efficiency of neighboring regions. It can be seen that the impact of the quality of industrial structure adjustment on carbon emission efficiency is mainly through the behavior of the region. For neighboring regions, the level of carbon emission efficiency will not change with industries in other regions.
According to the impact of the energy structure on carbon emission efficiency in Table 7 [models (1) and (2)], first, the energy structure significantly inhibits the improvement of carbon emission efficiency, which shows that although China's energy structure is constantly adjusting and reducing the proportion of coal use, coal is still China's largest energy source, which has not changed, and the application technology of fossil energy utilization is insufficient. It is only limited to the one-time combustion and utilization of fossil energy. Obviously, the current energy structure is not conducive to the improvement of energy efficiency. Even in future, China will still be dominated by fossil energy. Through the interaction term of digital economy development and the energy structure (lndige×lntec), it is found that they have no significant impact on carbon emission efficiency. Although the development of the digital economy can improve carbon emission efficiency, the only energy source for the application of the digital economy is electric energy. Currently, the power source is mainly thermal power generation with coal consumption, and the energy structure with coal consumption needs to emit high-intensity carbon dioxide, which is bound to reduce carbon emission efficiency. Therefore, China's energy structure adjustment has a long way to go.
Second, through the impact of technological progress on carbon emission efficiency [models (3) and (4) in Table 7], it can be seen that technological progress also has no significant impact on carbon emission efficiency. This conclusion is the same as the research result of Bian et al. (2017). In this regard, we believe that although technological progress can reduce carbon dioxide emissions through the allocation of production factors, thereby playing an important role in energy conservation, emissions reduction, and carbon neutrality, the main contribution to China's current economic growth does not come from technological progress. The main way is still to rely on the continuous superposition of labor, capital, and energy factors to achieve the increase in economic scale. The inertia caused by this long-term extensive economic growth mode is unlikely to change in the short term. This also explains why China's technological progress has improved in recent years but has not had a positive effect on carbon emission efficiency. Through the interaction term (lndige×lntec) between technological progress and digital economy development, it can be seen that the interaction term between the two significantly promotes the improvement of carbon emission efficiency. First, the impact of technological progress on the development of the digital economy lies in the continuous exploration of new technologies and their application in actual production. Second, the development of the digital economy is also an internal driving force for reducing energy consumption and improving energy efficiency. Therefore, for carbon emission efficiency, although technological progress has not led to an increase in carbon emission efficiency, the development of the digital economy brought about by technological progress can significantly improve carbon emission efficiency.
Robustness test
Considering that there may be errors in model setting and variable selection, which will affect the reliability of regression results, to further test the impact of digital economy development on carbon emission efficiency, Koronen et al. (2020) have studied and adopted the Internet comprehensive development index as the proxy variable of digital economy development. Among them, the Internet investment indicators include Internet penetration rate and the number of Internet-related employees. The Internet penetration rate is represented by the number of Internet agents per 100 people, and the number of Internet-related employees by the ratio of computer service and software employees to all employees. The Internet output indicators include the total amount of telecommunication services per capita and the number of mobile Internet users. The number of mobile Internet users is expressed by the number of mobile phones per 100 people. The processing method of the Internet comprehensive development indicator is the same as that of the digital economy development indicator. The quality and range of industrial structure adjustment are replaced with the indicators of industrial structure upgrading and rationalization, respectively1, the energy structure with the ratio of total coal consumption to the energy converted into standard coal, and technological progress with green total factor productivity (ML index). The robustness test results are shown in Table 8.
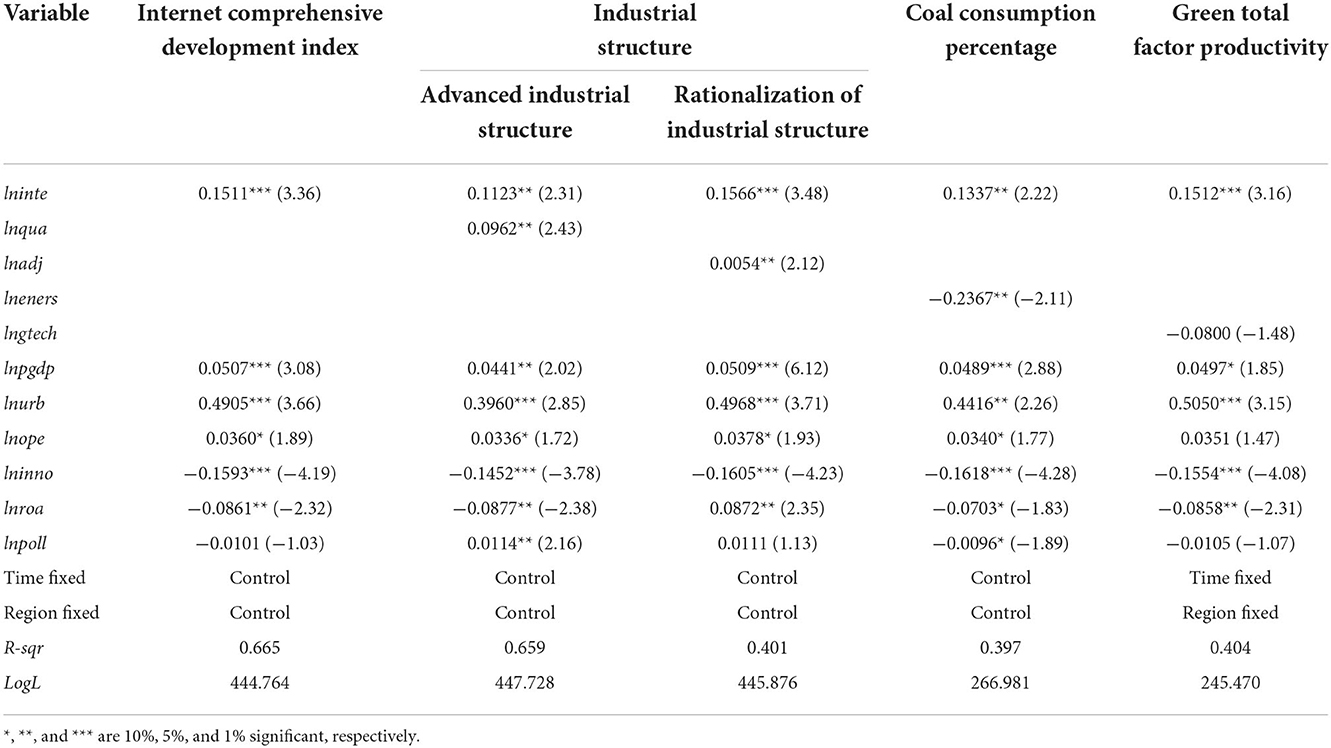
Table 8. Robustness test.
From the robustness test estimation results in Table 8, it can be seen that the significance and direction of the regression results after replacing the digital economy development indicator with the Internet comprehensive development indicator under the conditions of the full sample have not changed. The advanced industrial structure has a significant positive impact on carbon emission efficiency, which shows the rationality of replacing industrial adjustment quality with the advanced industrial structure. It rationalizes the industrial structure and also replaces the energy structure and technological progress with the proportion of coal consumption and green total factor productivity. This explanation is not repeated.
According to the above mechanism analysis, it is found that carbon emission efficiency is significantly inhibited by the energy structure under the full sample condition. Based on the regression results, it is believed that the current energy consumption in China is still high. The coal consumption structure has not completely changed. We guess when the energy structure is lower than how much, and when we can improve carbon emission efficiency. In addition, according to theoretical analysis and previous research conclusions, technological progress should have a positive effect on carbon emission efficiency. However, the conclusions of empirical regression are different from the expected results. We guess that there may be a threshold effect. To further verify this transmission, the threshold regression model is used to verify whether the effect exists. In addition, since the quality of industrial structure adjustment and the energy structure is based on the adjustment range, and the industrial structure adjustment range has no significant impact on carbon emission efficiency, we will analyze the adjustment range of industrial structure as a threshold variable here.
Threshold effect
For the estimation of traditional threshold variables, if the threshold value of a variable is subjectively determined, then the sample is divided into two samples or multiple sample intervals according to the determined threshold value. The subjectivity of this approach is very large, which makes the regression conclusion unreliable. In this regard, according to Hansen (1999), threshold method estimation and parameter hypothesis testing are proposed, which objectively avoid many disadvantages of sample division.
Assuming that the panel data set is {yit, Xit, qit:1 ≤ i ≤ n, 1 ≤ t ≤ T}, where i represents the individual and t represents the time, the following one-level threshold model can be considered:
In formula (25), I represents an indicative function. When the content in the parentheses is true, its value is 1; Otherwise, it is 0; yit, xit, qit are the dependent variable and the threshold variable, respectively, and qit can be a part of Xit. and represent the regulation interval coefficient, and ε represents the disturbance term that follows i.i.d and the normal distribution.
On the basis of the one-threshold model, a double-to-multiple threshold model is constructed.
For the above threshold model, dispersion transformation needs to be performed before estimation, the residual sum of squares is minimized in two steps, and then the non-linear least squares method is used for estimation. If there are two or more threshold variables, on the basis of fixing the first threshold variable, the second threshold variable is solved according to the above idea, and then the first threshold variable is verified on the basis of fixing the second threshold variable. Then, the third threshold variable is sought, and so on until all threshold values are found.
According to the test results of the threshold effect in Table 9, the significance level of statistic F of the threshold value indicates that there is a significant primary threshold for the adjustment of the industrial structure, and there is a double-threshold effect for technological progress and the energy structure. Under the condition that there are different numbers of thresholds mentioned above, we choose to divide different thresholds into different intervals and then perform regression. To ensure the impartiality of the regression results, this article adopts the maximum likelihood estimation (MLE) method according to the panel model test. The estimated results are shown in Table 10.
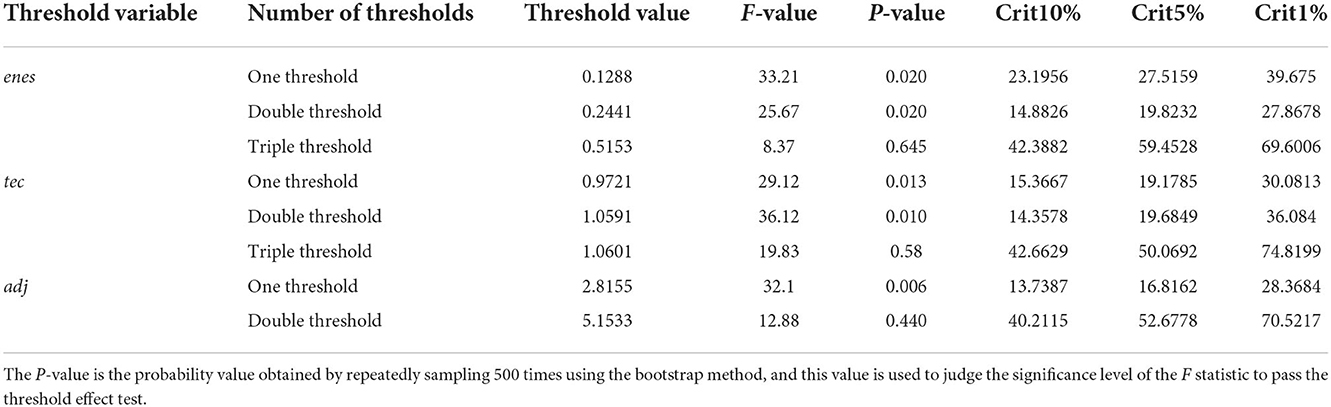
Table 9. Threshold effect test results.
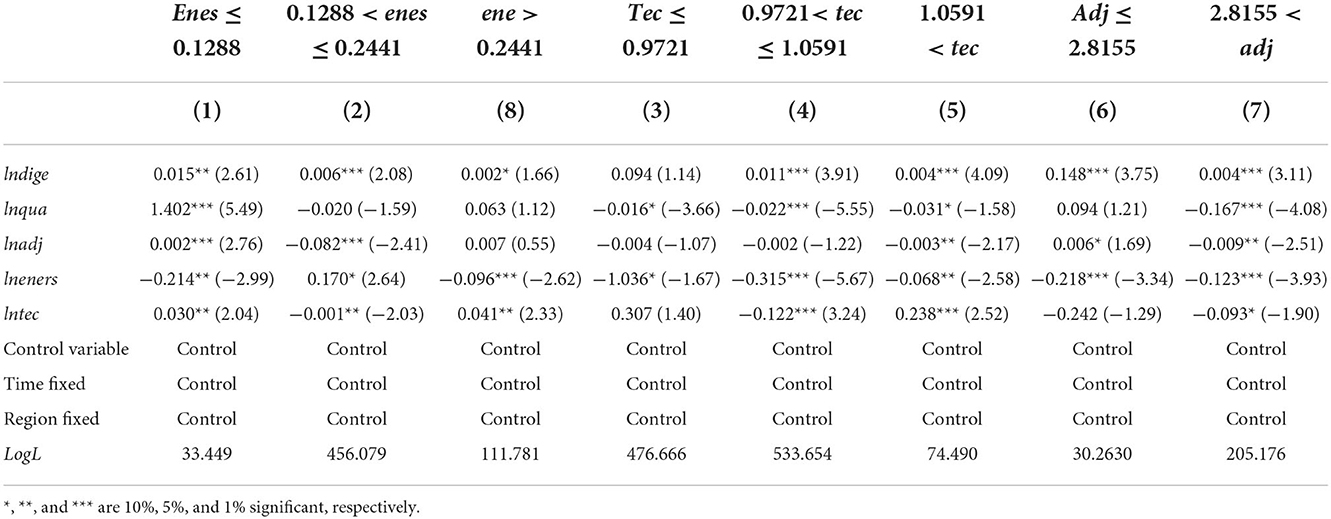
Table 10. Threshold value and parameter estimation results.
According to the threshold values in Table 9, the different regulatory intervals are divided into Table 10 by using maximum likelihood estimation (MLE) method. The first is the threshold regression results of the energy structure [models (1) and (2)]. When the energy structure is lower than 0.128 unit, the energy structure significantly inhibits the improvement of carbon emission efficiency. When the energy structure crosses the first-order threshold value of 0.1288 after reaching the second-order threshold interval of 0.2441, the energy structure has a significant positive impact on carbon emission efficiency. When the energy structure threshold value is > 0.2441, the energy structure significantly inhibits the improvement of carbon emission efficiency. This is because the fossil energy structure accounts for lower total energy consumption at a lower threshold, and the economic development level is also relatively low due to underdeveloped industries. The main reason for inhibiting the increase in carbon emissions is more from other factors. When the energy structure crosses the first-order threshold and enters the second-order threshold, the carbon emissions resulting from energy consumption at this point can be absorbed by the terrestrial ecosystem to achieve a dynamic balance, but when the energy structure crosses the second-order threshold, the energy structure is higher, and the carbon emissions arising from excessive fossil energy consumption cannot be absorbed, captured, and stored by the ecosystem, resulting in a decline in carbon emission efficiency.
Through the analysis of the threshold effect of technological progress, it is found that technological progress cannot bring about the improvement of carbon emission efficiency under the condition of low technological progress (first-order threshold value), and when technological progress is between the first-order threshold and the second-order threshold (0.9721, 1.0591), technological progress inhibits the improvement of carbon emission efficiency. When technological progress crosses the second-order threshold (1.0591), carbon emission efficiency can be improved. This is because when technological progress is at a low level, the contribution of economic growth is not the source. Due to technological progress, it is more from the extensive consumption of natural resources, which explains why the quality of industrial structure adjustment is negative for carbon emission efficiency [model (3)]. When technological progress crosses the second-order threshold value (1.0591), on the one hand, technological progress improves energy conversion efficiency and reduces energy consumption; and on the other hand, promoting the use of clean energy and improving the energy structure have all contributed to the improvement of carbon emission efficiency. From the perspective of industrial structure adjustment, there is a first threshold for industrial structure adjustment. When the industrial structure adjustment range is lower than the unit value of 2.8155, the industrial structure adjustment range has no significant impact on carbon emission efficiency. When the industrial structure adjustment range is higher than the first threshold value at 2.8155, the carbon emission efficiency is significantly suppressed, indicating that the current industrial adjustment in many regions of China is moving toward high-carbon emissions. This is because industries in many regions are still at a lower level in the value chain, and industrial structure adjustment is making them move to the middle end. The process of industries moving from the low end to the middle end will inevitably increase carbon emissions. The lack of economies of scale in the input of energy and increased carbon emissions will inevitably lead to a decline in carbon emission efficiency. It also shows that China's carbon peak has not yet arrived.
Conclusion and policy implications
Conclusion
Based on the panel data of 30 provincial-level units in China from 2007 to 2019, this article first constructs a comprehensive indicator of digital economy development from four dimensions: digital economy infrastructure, digital economy application, innovation capability, and industrial development. Carbon emission efficiency is measured from the perspective of the undesired output of economic development. Finally, the impact of digital economy development on carbon emission efficiency is analyzed theoretically. The research conclusions show that: first, the development of the digital economy has significantly promoted the improvement of carbon emission efficiency. Considering the spatial spillover effect, it is found that the direct effect of digital economy development has significantly promoted the improvement of regional carbon emission efficiency, but has not improved the carbon emission efficiency of neighboring regions. Second, the impact mechanism shows that the extent of industrial structure adjustment has no significant effect on carbon emission efficiency, while the quality of industrial structure adjustment has a significant positive impact on carbon emission efficiency; the current energy structure significantly inhibits carbon emission efficiency, while technological progress has no significant effect on carbon emission efficiency. Third, the analysis of the threshold effect shows that there is a double-threshold effect in the energy structure and technological progress, and there is a double threshold in the range of industrial structure adjustment.
To conclude, this study contributes in the following aspects:
(1) Based on the current background, this article brings the digital economy and regional carbon emission efficiency into the same research framework, and systematically analyzes the impact mechanism and promotion path of the digital economy on carbon emission efficiency; (2) it focuses on the impact of the development of the digital economy on carbon emission efficiency, explores the spatial spillover effect between them, and decomposes the spillover effect; (3) it considers the extent and quality of industrial structure adjustment, technological progress, and energy structure as the impact mechanism of carbon emission efficiency, and analyzes the spatial effect; (4) it generates unique insights based on the analysis; and (5) it provides pertinent policy recommendations based on the analysis.
Undoubtedly, this study has its limitations. (1) As the concept of the digital economy has only been clearly defined in recent years, there are still some differences in the measurement system and methods of regional digital economy development level by different scholars and institutions, and the design of the digital economy indicator system still needs to be further improved. (2) The research scale and time span of samples can be further supplemented. As the digital economy, carbon peaking, and carbon neutrality goals are focused on in recent years, there is a lack of earlier and sub-provincial data to measure the indicators.
Policy implications
Based on the analysis and findings, we propose the following implementation paths to show how to improve carbon emission efficiency and realize carbon neutrality.
First, build a digital industry development platform to promote innovation in digital economy applications. The development of the digital economy should adhere to the market-based approach and break the limitations of the digital economy in terms of capital and industry. For this purpose, relevant enterprises need to change their traditional business concepts, attach importance to the long-term planning of industrial development, and actively adjust regional enterprise organizations and business processes. In addition, with digital innovation technology at the core, strengthen theoretical research and technology development in artificial intelligence, business intelligence, machine learning, and other fields, actively promote the deep integration of technologies such as cloud computing, the Internet of Things, artificial intelligence, and truly realize the innovation of the digital economy to improve carbon emission efficiency.
Second, optimize the energy structure to develop low-carbon energy, and promote the green transformation of production models and the transformation of life. Since the current energy consumption structure generates a lot of carbon emissions, it reduces the efficiency of input and output and hinders the realization of carbon neutrality. Therefore, when adjusting and optimizing the energy structure, government departments should focus on cooperation with international organizations for development through the introduction, digestion, and absorption. International advanced technology is used to enhance independent innovation and develop renewable energy (Liu et al., 2022b), such as new-generation cellulosic ethanol, hydrogen fuel, nuclear energy, and other new technologies, thereby improving the energy efficiency of the entire production sector or lifestyle. The basic production sector should realize industrialization and IT building by promoting low-carbon energy, and achieve breakthroughs in carbon capture and sequestration technology through energy technology innovation.
Third, adapt to the needs of social development and promote the development of modern service industries. Modern service industries have the characteristics of low resource consumption, low pollution intensity, and high added value. Great importance should be attached to the development of modern service industries oriented to production and people's livelihoods, especially for new industrialization and non-material products with irrational structure, low levels, and low competitiveness. Production industries (such as information technology, scientific research, and comprehensive technical services) have low-carbon emissions intensity, and the development of these industries should be encouraged. For some carbon-intensive industries, such as various extractive industries and related mining industries (petroleum processing, non-metallic mineral industry, chemical industry, and metal products industry), their blind expansion should be restricted.
Data availability statement
The original contributions presented in the study are included in the article/supplementary material, further inquiries can be directed to the corresponding author.
Author contributions
JH: methodology, data collection and curation, and software. JH and TJ: conceptualization, writing—original draft preparation, and writing—review and editing. All authors contributed to the article and approved the submitted version.
Conflict of interest
The authors declare that the research was conducted in the absence of any commercial or financial relationships that could be construed as a potential conflict of interest.
Publisher's note
All claims expressed in this article are solely those of the authors and do not necessarily represent those of their affiliated organizations, or those of the publisher, the editors and the reviewers. Any product that may be evaluated in this article, or claim that may be made by its manufacturer, is not guaranteed or endorsed by the publisher.
Footnotes
1. ^Due to the limited space, the advanced and rationalized index structure of the industrial structure will not be repeated here, and can be obtained from the author if necessary.
References
Anselin, L. (1988). “A typology of spatial econometric models”. Spatial Econometrics: Methods and Models. (Springer), 32–40. doi: 10.1007/978-94-015-7799-1
Basu, S., and Fernald, J. (2008). Information and communications technology as a general purpose technology: evidence from u.s. industry data. Econ. Rev. 8, 146–173. doi: 10.1111/j.1468-0475.2007.00402.x
Bian, Y., Lv, K., and Yu, A. (2017). China's regional energy and carbon dioxide emissions efficiency evaluation with the presence of recovery energy: an interval slacks-based measure approach. Ann. Oper. Res. 255, 301–321. doi: 10.1007/s10479-015-2027-x
Camarero, M., Picazo-Tadeo, A. J., and Tamarit, C. (2013). Are the determinants of CO2 emissions converging among OECD countries? Econ. Lett. 118, 159–162. doi: 10.1016/j.econlet.2012.10.009
Centobelli P. Cerchione R. Esposito E. (2018), “Environmental sustainability energy-efficient supply chain management: a review of research trends proposed guidelines”. Energies 11, 275. 10.3390/en11020275
Chen, X., Benjaafar, S., and Elomri, A. (2013). The carbon-constrained EOQ. Oper. Res. Lett. 41, 172–179. doi: 10.1016/j.orl.2012.12.003
Chiou, T. Y., Chan, H. K., Lettice, F., and Chung, S. H. (2011). The influence of greening the suppliers and green innovation on environmental performance and competitive advantage in Taiwan. Transp. Res. Part E Logistics Transp. Rev. 47, 822–836. doi: 10.1016/j.tre.2011.05.016
Craig, M. T., Zhai, H.B., Jaramillo, P., and Klima, K. (2018). Trade-offs in cost and emissions reductions between flexible and normal carbon capture and sequestration under carbon dioxide emissions constraints. Int. J. Greenhouse Gas Control. 66.25–34. doi: 10.1016/j.ijggc.2017.09.003
Drake, D. F., Kleindorfer, P. R., and Van Wassenhove, L. N. (2016). Technology choice and capacity portfolios under emissions regulation. Prod. Oper. Manage. 25, 1006–1025. doi: 10.1111/poms.12523
Esenduran, G., Kemahlioglu, Ziya, E., and Swaminathan, J. M. (2017). Impact of take-back regulation on the remanufacturing industry. Prod. Oper. Manage. 26, 924–944. doi: 10.1111/poms.12673
Ferreira, A., Pinheiro, M. D., de Brito, J., and Mateus, R. (2018). Combined carbon and energy intensity benchmarks for sustainable retail stores. Energy 165, 877–889. doi: 10.1016/j.energy.2018.10.020
Findeisen, S., and Jens, S. (2008). Industry churning and the evolution of cities: evidence for Germany. J. Urban Econ. 64,326–339. doi: 10.1016/j.jue.2008.02.003
Gaspareniene, L., Remeikiene, R., Ginevičius, R., and Schieg, M. (2018). Adoption of mimic model for estimation of digital shadow economy. Technol. Econ. Develop. Economy 24, 1453–1465. doi: 10.3846/20294913.2017.1342287
Hansen, B. E. (1999). Threshold effects in non-dynamic panels: Estimation, testing, and inference. J. Econ. 93, 345–368. doi: 10.1016/S0304-4076(99)00025-1
Heryadi, M. D., and Hartono, D. (2016). Energy efficiency, utilization of renewable energies, and carbon dioxide emissions: case study of G20 countries. Int. Energy J. 16, 143–152.
Jiang, C. F., Hsuling, C., and Imran, S. (2022). Digital economy and health: does green technology matter in BRICS economies? Front. Public Health. 9, 1–12. doi: 10.3389/fpubh.2021.827915
Kannan, D., Diabat, A., Alrefaei, M., Govindan, K., and Yong, G. (2012), A carbon footprint based reverse logistics network design model. Resour. Conserv. Recycl. 67, 75–79. doi: 10.1016/j.resconrec.2012.03.005
Koronen, C., Åhman, M., and Nilsson, L. J. (2020). Data centres in future European energy systems—energy efficiency, integration and policy. Energy Efficiency 13, 129–144. doi: 10.1007/s12053-019-09833-8
LeSage, J., and Pace, R. K. (2009). Introduction to Spatial Econometrics. New York, NY: Chapman and Hall/CRC. doi: 10.1201/9781420064254
Li, D., Bae, J. H., and Rishi, M. (2022). Sustainable development and SDG-7 in Sub-Saharan Africa: balancing energy access, economic growth, and carbon emissions. Eur. J. Develop. Res. 28, 1–26. doi: 10.1057/s41287-021-00502-0
Li, J., Chen, L., Chen, Y., and He, J. (2022). Digital economy, technological innovation, and green economic efficiency—empirical evidence from 277 cities in China. MDE. Manage. Decis. Econ. 43, 616–629. doi: 10.1002/mde.3406
Li X, and Xu, H.. (2020). Effect of local government decision-making competition on carbon emissions: Evidence from China's three urban agglomerations. Bus. Strat. Env. 29, 2418– 2431. doi: 10.1002/bse.2511
Liu, B., Holmbom, M., Segerstedt, A., and Chen, W. (2015). Effects of carbon emission regulations on remanufacturing decisions with limited information of demand distribution. Int. J. Prod. Res. 53, 532–548. doi: 10.1080/00207543.2014.957875
Liu, Y., Liu, S., Shao, X., and He, Y. (2022a). Policy spillover effect and action mechanism for environmental rights trading on green innovation: evidence from China's carbon emissions trading policy. Renew. Sustain. Energy Rev. 153, 111779. doi: 10.1016/j.rser.2021.111779
Liu, Y., Yang, Y. L., Li, H. H., and Zhong, K. Y. (2022b). Digital economy development, industrial structure upgrading and green total factor productivity: empirical evidence from China's Cities. Int. J. Environ. Res. Public Health 19, 1–23. doi: 10.3390/ijerph19042414
Liu, Z. X., Zhang, Y., Wang, Y., Wei, N., and Gu, C. H. (2020). Development of the interconnected power grid in Europe and suggestions for the energy internet in China. Global Energy Interconnect. 3, 111–119. doi: 10.1016/j.gloei.2020.05.003
Luken, R., and Rompaey, F.V. (2008). Drivers and barriers to environmentally sound technology adoption by manufacturing plants in nine developing countries. J. Cleaner Prod. 16, S67–S77. doi: 10.1016/j.jclepro.2007.10.006
Nie, D., Li, Y., and Li, X. (2021). Dynamic spillovers and asymmetric spillover effect between the carbon emission trading market, fossil energy market, and new energy stock market in China. Energies. 14, 6438. doi: 10.3390/en14196438
Nunes, A. (2016). Increased productivity efforts yield few rewards in the knowledge economy. Transp. Res. Part A Policy Practice 94, 338–347. doi: 10.1016/j.tra.2016.09.025
Özdemir, Ö., and Denizel, M. (2012). Recovery decisions of a producer in a legislative disposal fee environment. Europ. J. Oper. Res. 216, 293–300. doi: 10.1016/j.ejor.2011.07.035
Schiederig, T., Tietze, F., and Herstatt, C. (2012). Green innovation in technology and innovation management—an exploratory literature review. R D Manage. 42, 180–192. doi: 10.1111/j.1467-9310.2011.00672.x
Sturgeon, T. J. (2021). Upgrading strategies for the digital economy. Global Strategy J. 11, 34–57. doi: 10.1002/gsj.1364
Sun, X., Chen, Z., Shi, T., Yang, G., and Yang, X. (2022). Influence of digital economy on industrial wastewater discharge: Evidence from 281 Chinese prefecture-level cities. J. Water Clim. Change 13, 593–606. doi: 10.2166/wcc.2021.447
Sun, X. X., Chen, Z. W., Shi, T. T., Yang, G. Q., and Yang, X. Y. (2019). Influence of digital economy on industrial wastewater discharge: evidence from 281 Chinese prefecture-level cities. J. Water Climate Change. 13, 593–606.
Tayibnapis, A. Z., Wuryaningsih, L. E., and Gora, R. (2018). The development of the digital economy in Indonesia. IJMBS Int. J. Manag. Bus. Stud. 8, 14–18.
Tone, K. (2001). A slacks-based measure of efficiency in data envelopment analysis. J. Oper. Res. 130, 498–509. doi: 10.1016/S0377-2217(99)00407-5
Tseng, S. C., and Hung, S. W. (2014). A strategic decision-making model considering the social costs of carbon dioxide emissions for sustainable supply chain management. J. Environ. Manage. 133, 315–322. doi: 10.1016/j.jenvman.2013.11.023
Wang S, and Liu, X.. (2017). China's city-level energy-related CO2 emissions: spatiotemporal patterns and driving forces. Appl. Energy 200, 204–214. doi: 10.1016/j.apenergy.2017.05.085
Wang, S. H., Tang, Yun., Du, Z, H., and Song, M. L. (2020). Export trade, embodied carbon emissions, and environmental pollution: an empirical analysis of China's high- and new-technology industries. J. Environ. Manage. 276, 111371. doi: 10.1016/j.jenvman.2020.111371
Wang, Z., Zhang, B., and Liu, T. (2016). Empirical analysis on the factors influencing national and regional carbon intensity in China. Renew. Sustain. Energy Rev. 55, 34–42. doi: 10.1016/j.rser.2015.10.077
Wu, L., Sun, L, Qi, P., and Ren, X, Sun, X. (2021). Energy endowment, industrial structure upgrading, and CO2 emissions in China: revisiting resource curse in the context of carbon emissions. Resources Policy 74, 1–12. doi: 10.1016/j.resourpol.2021.102329
Xu, S., Yang, C., Huang, Z., and Failler, P. (2022). Interaction between the digital economy and environmental pollution: New evidence from a spatial perspective. Int. J. Environ. Res. Public Health 19, 5074. doi: 10.3390/ijerph19095074
Zhang, L., Wang, J., and You, J. (2015). Consumer environmental awareness and channel coordination with two substitutable products. Eur. J. Oper. Res. 241, 63–73. doi: 10.1016/j.ejor.2014.07.043
Zhang, Z., Gong, B., Tang, J., Liu, Z., and Zheng, X. (2019). The joint dynamic green innovation and pricing strategies for a hybrid system of manufacturing and remanufacturing with carbon emissions constraints. Kybernetes. 48, 1699–1730. doi: 10.1108/K-06-2018-0339
Zhou, N., Fridley, D., McNeil, M., Zheng, N., Letschert, V., Ke, J., et al. (2011). Analysis of potential energy saving and CO2 emissions reduction of home appliances and commercial equipment in China. Energy Policy 39, 4541–4550. doi: 10.1016/j.enpol.2011.04.027
Keywords: digital economy, carbon emission efficiency, energy structure, technological progress, industrial structure adjustment
Citation: Han J and Jiang T (2022) Does the development of the digital economy improve carbon emission efficiency? Front. Ecol. Evol. 10:1031722. doi: 10.3389/fevo.2022.1031722
Received: 30 August 2022; Accepted: 11 November 2022;
Published: 07 December 2022.
Edited by:
Chuanwang Sun, Xiamen University, ChinaReviewed by:
Luigi Aldieri, University of Salerno, ItalyLixin Tian, Jiangsu University, China
Kai Liu, Shandong Normal University, China
Copyright © 2022 Han and Jiang. This is an open-access article distributed under the terms of the Creative Commons Attribution License (CC BY). The use, distribution or reproduction in other forums is permitted, provided the original author(s) and the copyright owner(s) are credited and that the original publication in this journal is cited, in accordance with accepted academic practice. No use, distribution or reproduction is permitted which does not comply with these terms.
*Correspondence: Tianhe Jiang, tianhej@njupt.edu.cn