Bioclimatic drivers of forage growth and cover in alpine rangelands
 Li Wang1
  Wenmei Ma
- 1Meteorological Bureau of Qinghai Province, Institute of Meteorological Science Research of Qinghai Province, Xining, China
- 2Meteorological Bureau of Qinghai Province, Meteorological Service Center of Qinghai Province, Xining, China
- 3School of Geographical Science, Qinghai Normal University, Xining, China
- 4QingHai Remote Sensing Center for Nature Resources, Xining, China
Context: Climate change and human activities have significant impacts on the Qinghai–Tibetan Plateau; the alpine ecosystem in this region has been degraded. A decline in forage yield reduces the livestock carrying capacity, but an unmitigated increase may lead to overfeeding and damage to vegetation. These changes have eventually led to grassland degradation and a series of ecological problems. Therefore, it is essential to examine bioclimatic factors that affect forage growth in grasslands.
Objective: To identify bioclimatic factors associated with forage growth and coverage in the Qinghai–Tibetan Plateau.
Methods: We examined how forage growth and coverage are affected by 35 bioclimatic indicators published in a global database (CMCC-BioClimInd).
Results and conclusions: We comprehensively considered the relationship between 35 indicators and forage yield and coverage and found that the combination of temperature and precipitation indicators had a very high correlation with yield and coverage. When we evaluated the relationship between each index and forage yield, forage yield was found to be significantly correlated with 16 bioclimatic indices. Forage yield was positively correlated with yearly positive precipitation (R2 = 0.49, p < 0.05), annual precipitation (R2 = 0.48, p < 0.05), and precipitation of driest quarter (R2 = 0.47, p < 0.05), and negatively correlated with temperature seasonality (R2 = 0.52, p < 0.05), precipitation seasonality (R2 = 0.39, p < 0.05), and simplified continentality index (R2 = 0.48). Forage coverage was significantly correlated with 15 bioclimatic indicators. It showed positive correlations with precipitation of driest quarter (R2 = 0.36, p < 0.05), precipitation of driest month (R2 = 0.33, p < 0.05), and annual precipitation (R2 = 0.31, p < 0.05), and negative correlations with temperature seasonality (R2 = 0.415, p < 0.05), annual temperature range, precipitation seasonality, and simplified continentality index (R2 = 0.37, p < 0.05).
Significance: We identified bioclimatic indicators that affect forage growth in the northeastern Qinghai–Tibetan Plateau, and explored the physiological and ecological mechanisms underlying forage growth. Our results provide a scientific basis for future forage management, early determination of livestock carrying capacity, rational management of animal husbandry practices, and ecological protection and restoration efforts.
1. Introduction
Rangelands account for more than 30% of global land area and provide biodiversity and wildlife habitats as well as a broad range of ecosystem services, including production of food and forage material and protection of soil and water resources (Parton et al., 2012; Schohr, 2014; Liu et al., 2021). However, climate change has had a considerable impact on global water and heat resources, resulting in significant changes in forage yield and coverage (Walther et al., 2002; Parmesan, 2006; Chen et al., 2011). Growing-season precipitation is generally recognized as the primary factor driving annual grassland forage production (Le Houérou, 1984). Accordingly, several studies have developed regression models linking precipitation and temperature to peak annual forage production (Murphy, 1970; Pitt and Heady, 1978; Chaplin-Kramer and George, 2013). These studies have reported a positive relationship between peak forage production, precipitation, and air temperature (Liu et al., 2021). A recent study on the link between microclimate and forage growth found that wetter topographic locations were more productive in a dry year (water limitation), whereas warmer topographic locations were more productive in a wet year (energy limitation; Devine et al., 2019). Guo et al. (2010) found that the combination of precipitation and temperature was the main factor affecting forage yield. Li (2014) showed that the forage growth period was accompanied by a prominent discrepancy between heat and water conditions; low levels of precipitation and higher temperatures led to higher levels of evapotranspiration, resulting in low forage yield.
The Qinghai–Tibetan Plateau has a unique climate, hydrological features, and soil development background, and hosts a typical alpine ecosystem. Alpine ecosystems are fragile and exhibit complex and sensitive responses to global climate change (Yao et al., 2017). Climate change directly affects the spatiotemporal patterns of environmental factors, such as light, temperature, and water, all of which are highly predictive of forage yield and coverage (Qin et al., 2014). Under conditions of relatively stable forage distribution and crop rotation, warmer temperatures may cause early flowering, change crop phenology, shorten the maturity, and growth periods of crops, affect the accumulation of dry matter, and reduce crop yield (Zhang, 2016). Climate change affects forage yields in alpine ecosystems, forcing farmers and herders to change crop planting structures, grazing intensity, and rotational grazing modes (Ding et al., 2013). As alpine ecosystems are more sensitive to global climate change than other ecosystems (Grabherr et al., 1994), it is important to identify the main climatic factors that affect alpine pastures.
The Qinghai Province is a typical alpine pasture region in China. Grasslands account for 47% of the land area in this region and are mainly concentrated in the southern region of the Qinghai Plateau, Qilian Mountains, and mountains on the southeast edge of the Qaidam Basin. There has been little research regarding the impact of climatic factors on forage in the northeastern Qinghai–Tibetan Plateau (Wang et al., 2013; Shen et al., 2015). Current research on the impact of climate on forage yield, coverage, and height mainly focuses on using annual or seasonal indices such as precipitation or temperature. These indices are used to express the characteristics of climate, examine its variations, and predict future changes in climate and its effects on forage yield. However, recent research suggests that it is important to utilize additional bioclimatic indicators with clearer ecological significance, such as factors related to seasonal precipitation in the wettest and coldest seasons. Utilizing more comprehensive climatic indicators that integrate hydrothermal conditions can improve our understanding of the relationship between forage availability and climate. Vegetation-climate relationships determined using simple climatic indices have some significance; however, it is important to comprehensively evaluate the responses of vegetation to climatic and other environmental factors (Ni, 1998).
With increasing availability of climate information, several global datasets of bioclimatic indicators have become popular scientific references. These include WorldClim (Hijmans et al., 2010; Fick and Hijmans, 2017), CHELSA (Karger et al., 2017), CliMond (Kriticos et al., 2012, 2014), EcoClimate (Matheus and Lima-Ribeiro, 2015), ENVIREM (Title and Bemmels, 2018), and MERRAclim (Vega et al., 2018). Among these datasets, WorldClim was the most frequently cited. The recently updated version 2.1 (January, 2020) provides 19 bioclimatic indicators. Recently, Noce et al. (2020) presented CMCC-BioClimInd, a global gridded dataset that provides 35 bioclimatic indicators (Noce et al., 2020; including 16 indicators added on the basis of the WorldClim dataset).
In the present study, we used 35 bioclimatic indicators to investigate how bioclimatic factors affect forage output and cover. We screened out the bioclimatic indicators that have significant impacts on forage grass growth, clarified how these indicators affected growth, and accounted for the vacancy by only including precipitation and temperature in the forage grass growth analysis in the northeastern Qinghai–Tibetan Plateau. In addition, we clarified the ecological significance of the latest bioclimatic indicators for forage grass growth in the northeast of the Qinghai–Tibetan plateau. Our results are useful for future forage management, early determination of livestock carrying capacity, rational arrangement of animal husbandry, and implementation of ecological protection and restoration actions.
2. Materials and methods
2.1. Study area
The study area was located in Qinghai Province, China (Figure 1), which occupies the northeast region of the Qinghai–Tibetan Plateau (geographical location 31°9′–39°9’ N and 89°35′–103°04′ E). The total land area is 7.2 × 10⁵ km2, and most of the area lies at an elevation of 3,000–5,000 m above sea level. The higher elevations lie to the west and northwest, and the lower elevations lie in the east and center of the region. Qinghai Province is connected to Gansu Province in the north and east, and lies adjacent to the Xinjiang Uygur Autonomous Region in the northwest, Tibet Autonomous Region in the south and southwest, and Sichuan Province in the southeast. The plateau has a continental climate characterized by low temperatures, large temperature differences between day and night, low levels of concentrated precipitation, high numbers of sunshine hours, and strong solar radiation.
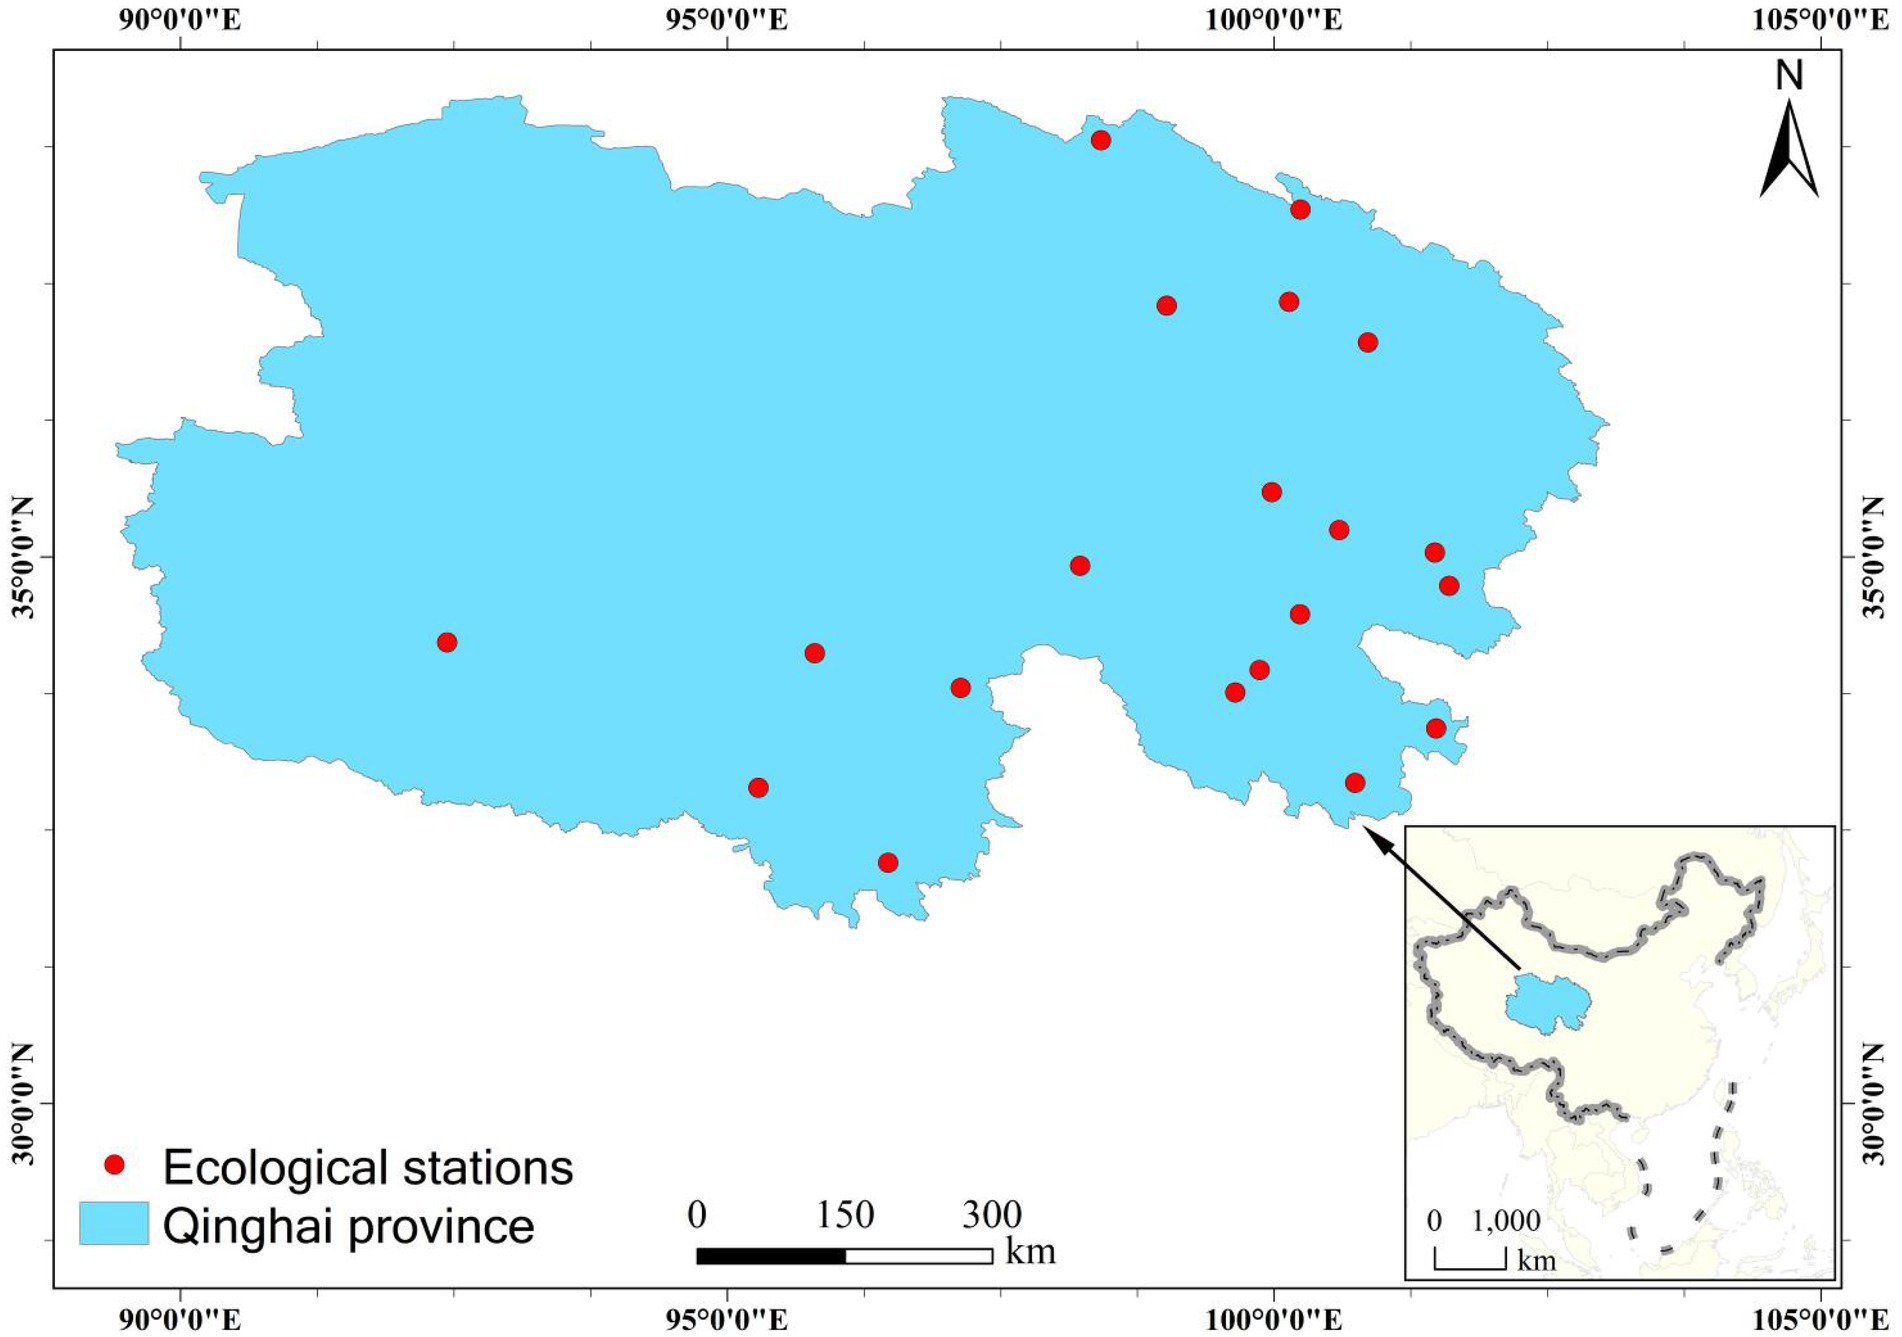
Figure 1. Geographical location and distribution of 20 ecological stations in the northeast region of the Qinghai–Tibetan Plateau.
The natural grassland in the northeastern region of the Qinghai–Tibetan Plateau covers a large land area, has a wide distribution, exhibits significant differences in natural conditions, and hosts rich and diverse grassland types. These include mountain dry grasslands, alpine dry grasslands, mountain meadows, alpine meadows, mountains, plains, deserts, alpine deserts, humid swamp meadows, moist shrubs, and sparse forests. Alpine meadows and alpine grasslands account for 44.2224 million mu, which is 80.88% of the total grassland area in the province.
2.2. Bioclimatic indices
The complete CMCC-BioClimInd dataset is available from PANGAEA.1 It consists of 805 files in NetCDF4 format with a 0.5 × 0.5°grid resolution and global coverage (except Antarctica) (Noce et al., 2020). We used the spatial analysis function in ArcGIS 10.2 to extract the simulated values of 35 bioclimatic indicators from 20 stations in the northeast region of the Qinghai–Tibetan Plateau (Table 1). Based on these data, we calculated the average values for each station; we propose that the bioclimate index data are based on the fitted value of climate data from historical periods. In future work, we will use the definitions and calculation methods to calculate the bioclimatic indicators with the measured meteorological data. Grass growth is affected by a variety of bioclimatic indicators; a single indicator cannot describe the overall situation. First, we defined the contribution percentage of each indicator through principal component analysis. It can be seen from Table 1 that the contribution of the first principal component (F1) is 58.45%, and factors such as mean temperature of the cold quarter (Bio11) and annual mean temperature (Bio1) also play a major role, mainly reflecting the role of heat on pasture growth. The second principal component (F2) mainly reflects the effect of the combination of precipitation and temperature, such as the Ellenberg quotien (Bio20) and Omboremic index (Bio23), on forage growth. The load values of Bio20 and Bio23 were 0.907 and − 0.943, respectively, including 29% of the contribution percentage.
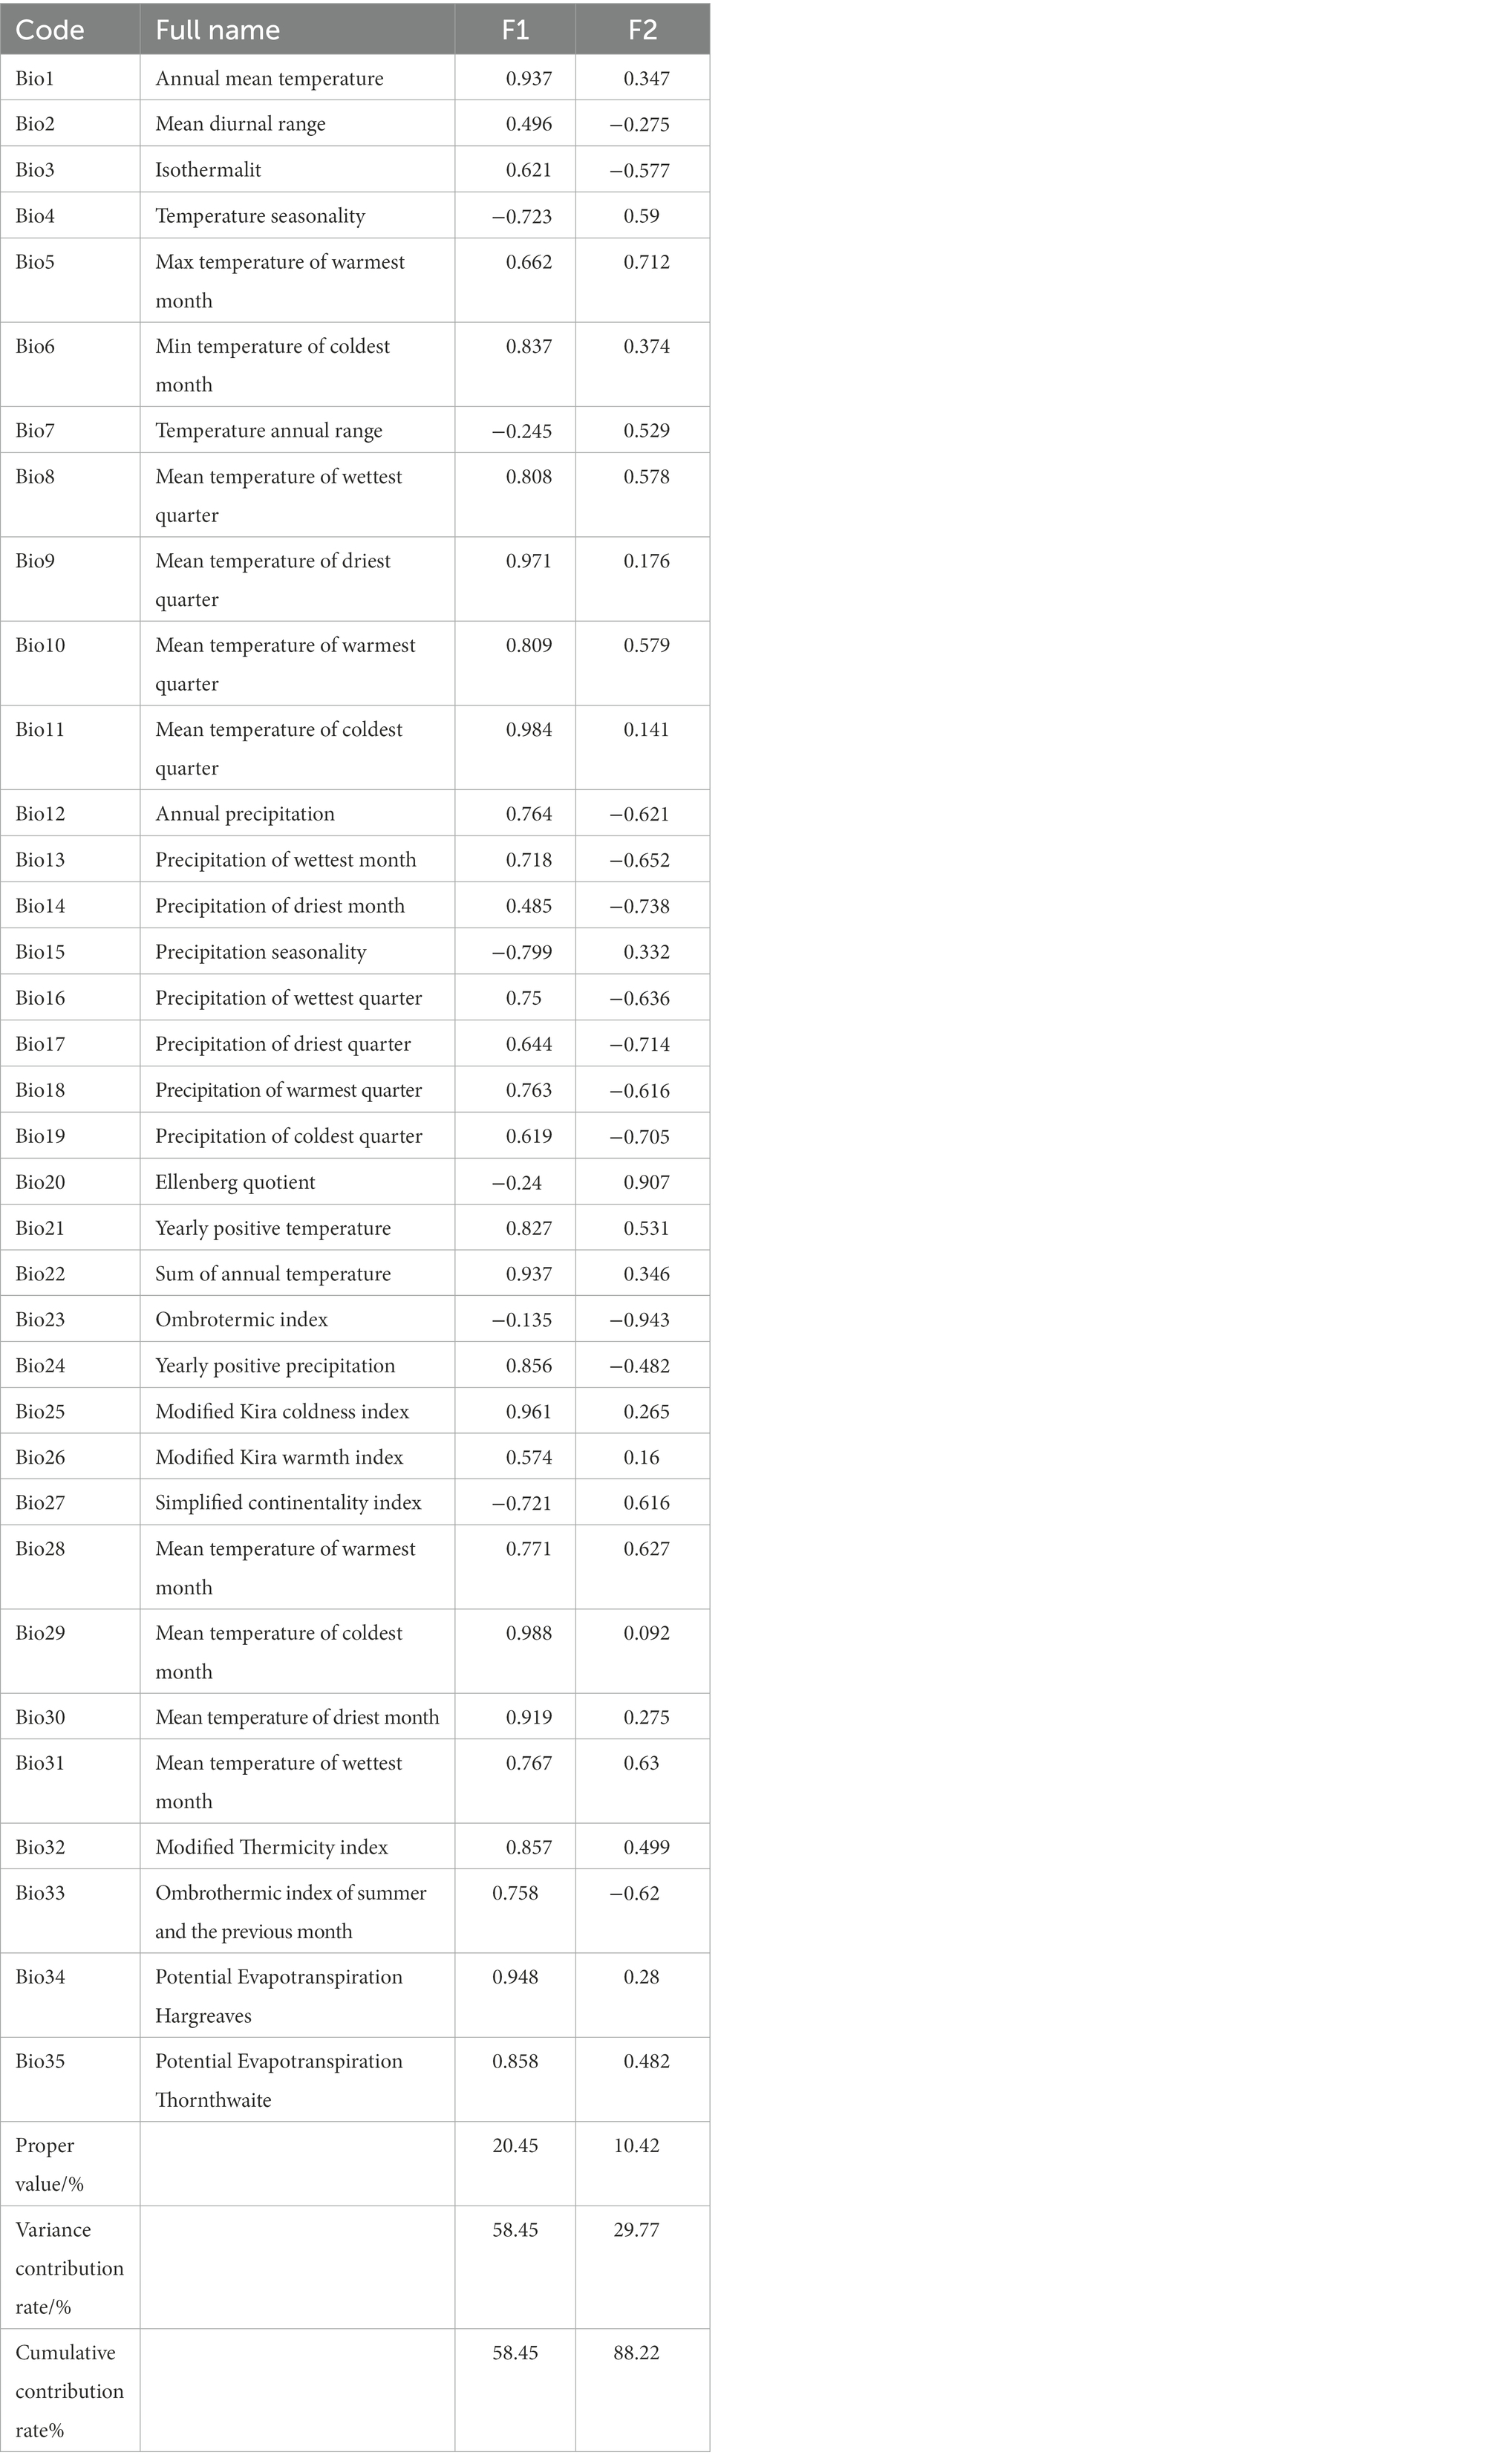
Table 1. Principal component analysis of 35 bioclimatic indexes.
2.3. Forage output and coverage
Forage data and basic meteorological variables were obtained from the ecological meteorological station built by the Qinghai Meteorological Bureau in 2002, which has recorded observations since 2003 with high-level management. Most grasslands in the study area are alpine meadows. The grasslands around Tianjun, Tongde, Tuole, and Tuotuohe stations are alpine grasslands, and those around Gangcha and Xinghai stations are temperate grasslands. Representative vegetation, terrain, soil types, and microclimatic factors were considered when selecting study sites for measuring forage cover. The observation sites covered an area of no more than 10 × 10 km2 and were located on pastures with flat terrain, no more than 20 km away from the meteorological station. The sites were enclosed by a net fence and surrounded by pile driving (height, 50 cm above the ground; the top 10 cm was painted red). A 50 × 50 m2 area in the observation field was surrounded by a 1.5-m-tall fence, and the local maximum forage yield was measured through continuous monitoring. During the forage growth period, foraging by herd animals is prohibited in this area. The parameters measured included forage growth period, yield, height, and coverage. Data collected between 2003 and 2019 were used in this study. Observations were recorded in strict accordance with the guidelines for agrometeorological observations, and data were recorded continuously.
2.4. Data analysis
To extract the simulated values of the 35 bioclimatic indicators, we used the spatial analysis function in ArcGIS 10.2. We then used simple regression models and Pearson’s correlation analyses to explore the relationships between forage output and bioclimatic indices. Finally, we selected the indicators that were significantly related to forage yield and coverage (p < 0.05) for analysis, which was performed using SigmaPlot 12.5 (Systat Software, United States) and SPSS (version 22, IBM Corp., United States).
3. Results
3.1. Relationship between forage output and bioclimatic indices
First, we analyzed the correlation between the three principal components and forage yield from an overall perspective. The correlations between principal components 1 and 3 and forage yield were not significant (p > 0.05). As shown in Figure 2, there was a strong positive correlation between forage yield and principal component 2, the combined indicators of precipitation and temperature (R2 = 0.40; p < 0.001).
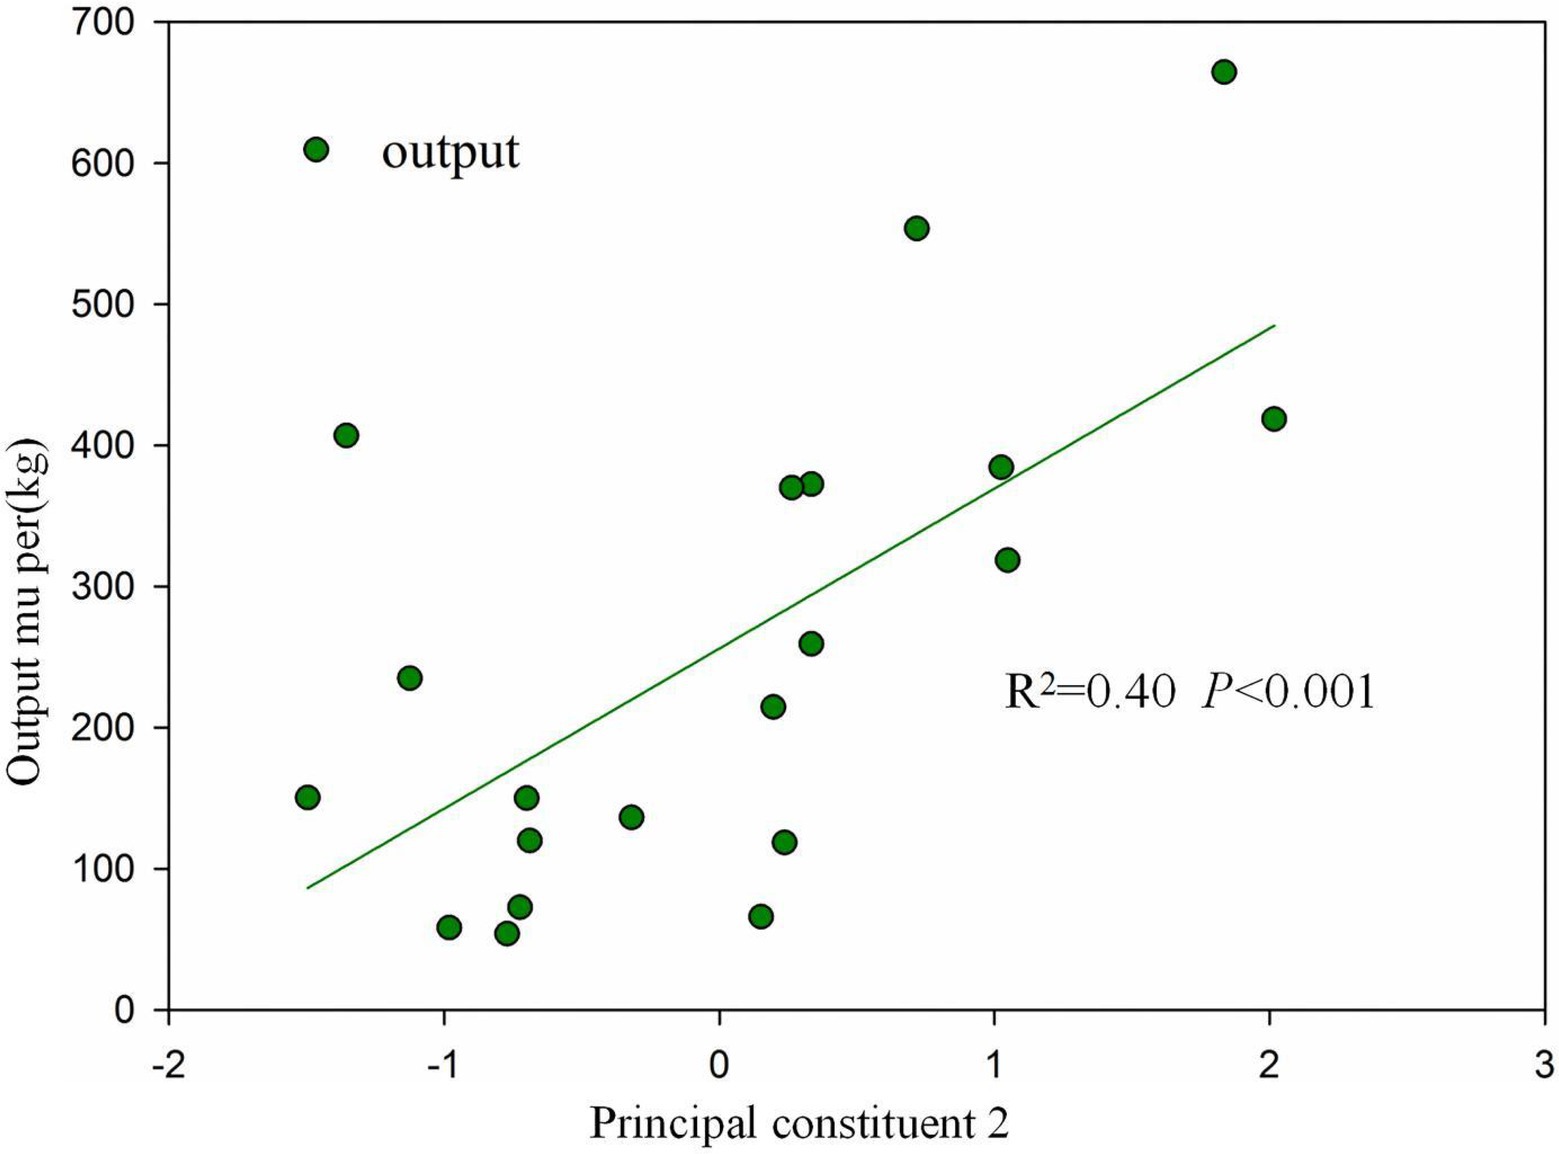
Figure 2. Relationships between forage output and Principal component 2.
We analyzed the correlation between forage yield and 35 bioclimatic indicators (Figure 3) and found significant correlations between forage yield and 16 bioclimatic indicators. Bio3 (isothermality), Bio9 (mean temperature of the driest quarter), Bio11 (mean temperature of the cold quarter), Bio12 (annual precipitation), Bio13 (precipitation in the wettest month), Bio14 (precipitation in the driest month), Bio16 (precipitation in the wettest quarter), Bio17 (precipitation in the driest quarter), Bio18 (precipitation in the winter quarter), Bio19 (precipitation in the cold quarter), Bio24 (annual positive precipitation), Bio29 (mean temperature of the coldest month), and Bio33 (ombrothermic indices of summer and the previous month) were positively correlated with forage yield, with correlation coefficients (R2) ranging from 0.23 0.49 (Figure 2). The magnitude of the correlation was in the following order: Bio24, Bio12, Bio17, Bio16, Bio33, Bio13, Bio18, Bio14, Bio19, Bio11, Bio3, and Bio9. The forage yield was most highly correlated with Bio24 (R2 = 0.49), Bio12 (R2 = 0.48), and Bio17 (R2 = 0.47). Yield was negatively correlated with Bio4 (temperature seasonality), Bio15 (precipitation seasonality), and Bio27 (simplified continuity index), with R2 values of 0.39–0.52. The forage yield was most strongly negatively correlated with Bio4 (R2 = 0.52), followed by Bio27 (R2 = 0.48).
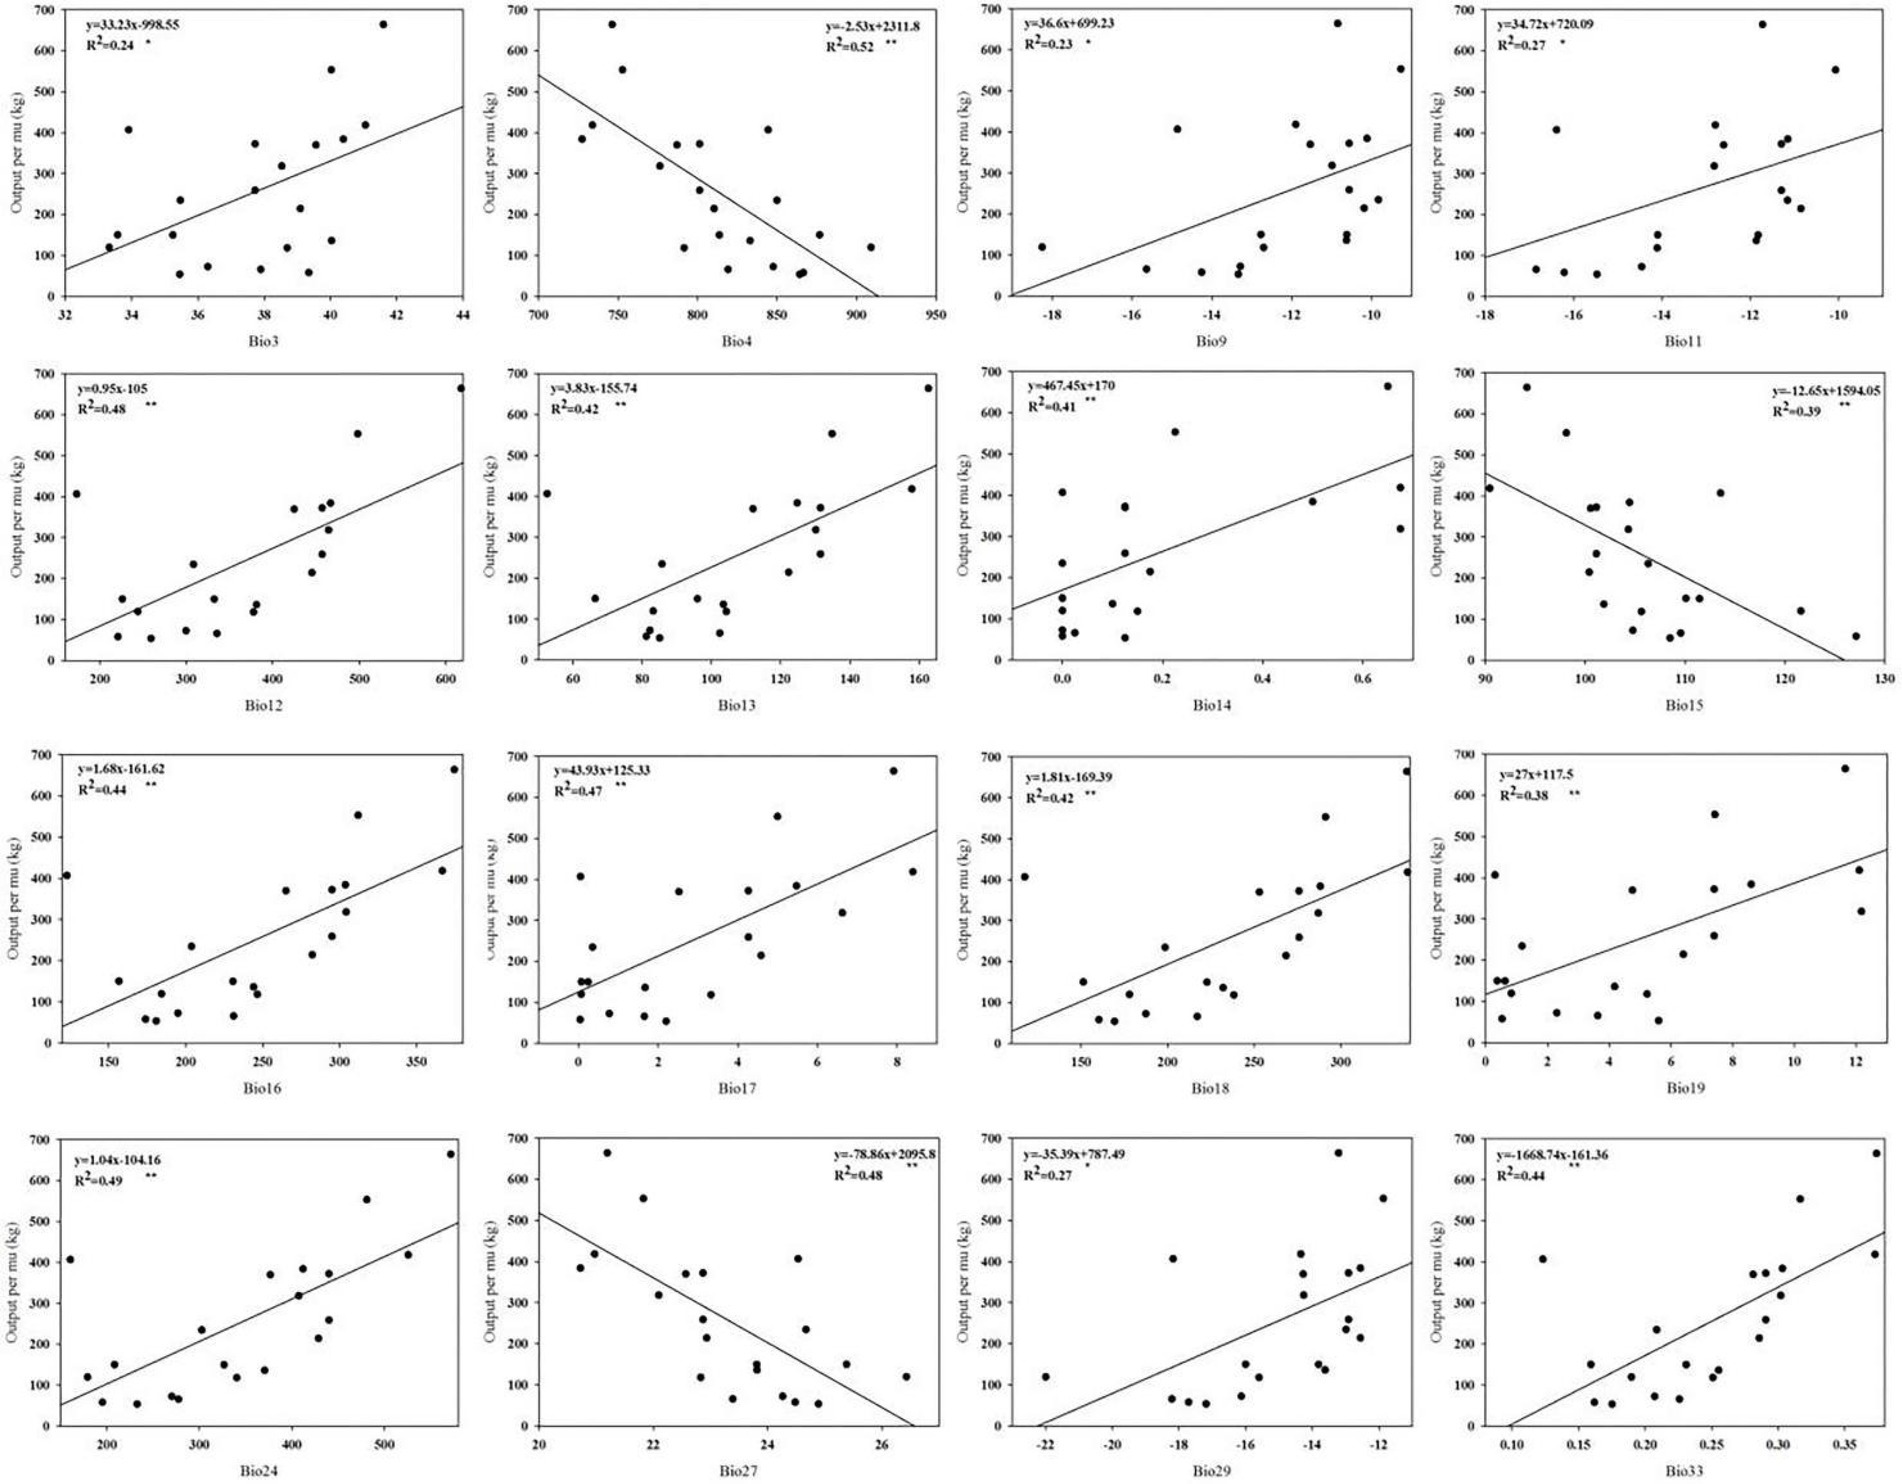
Figure 3. Relationships between forage output and 16 bioclimatic indices.
3.1. Relationship between forage cover and bioclimatic indices
First, we conducted a correlation analysis of the three principal components and grass coverage from an overall perspective. The correlation between principal components 1 and 3 and grass coverage was not significant (p > 0.05). As shown in Figure 4, there was a strong positive correlation between grass coverage and principal component 2, the combined index of precipitation and temperature (R2 = 0.30, p < 0.001).
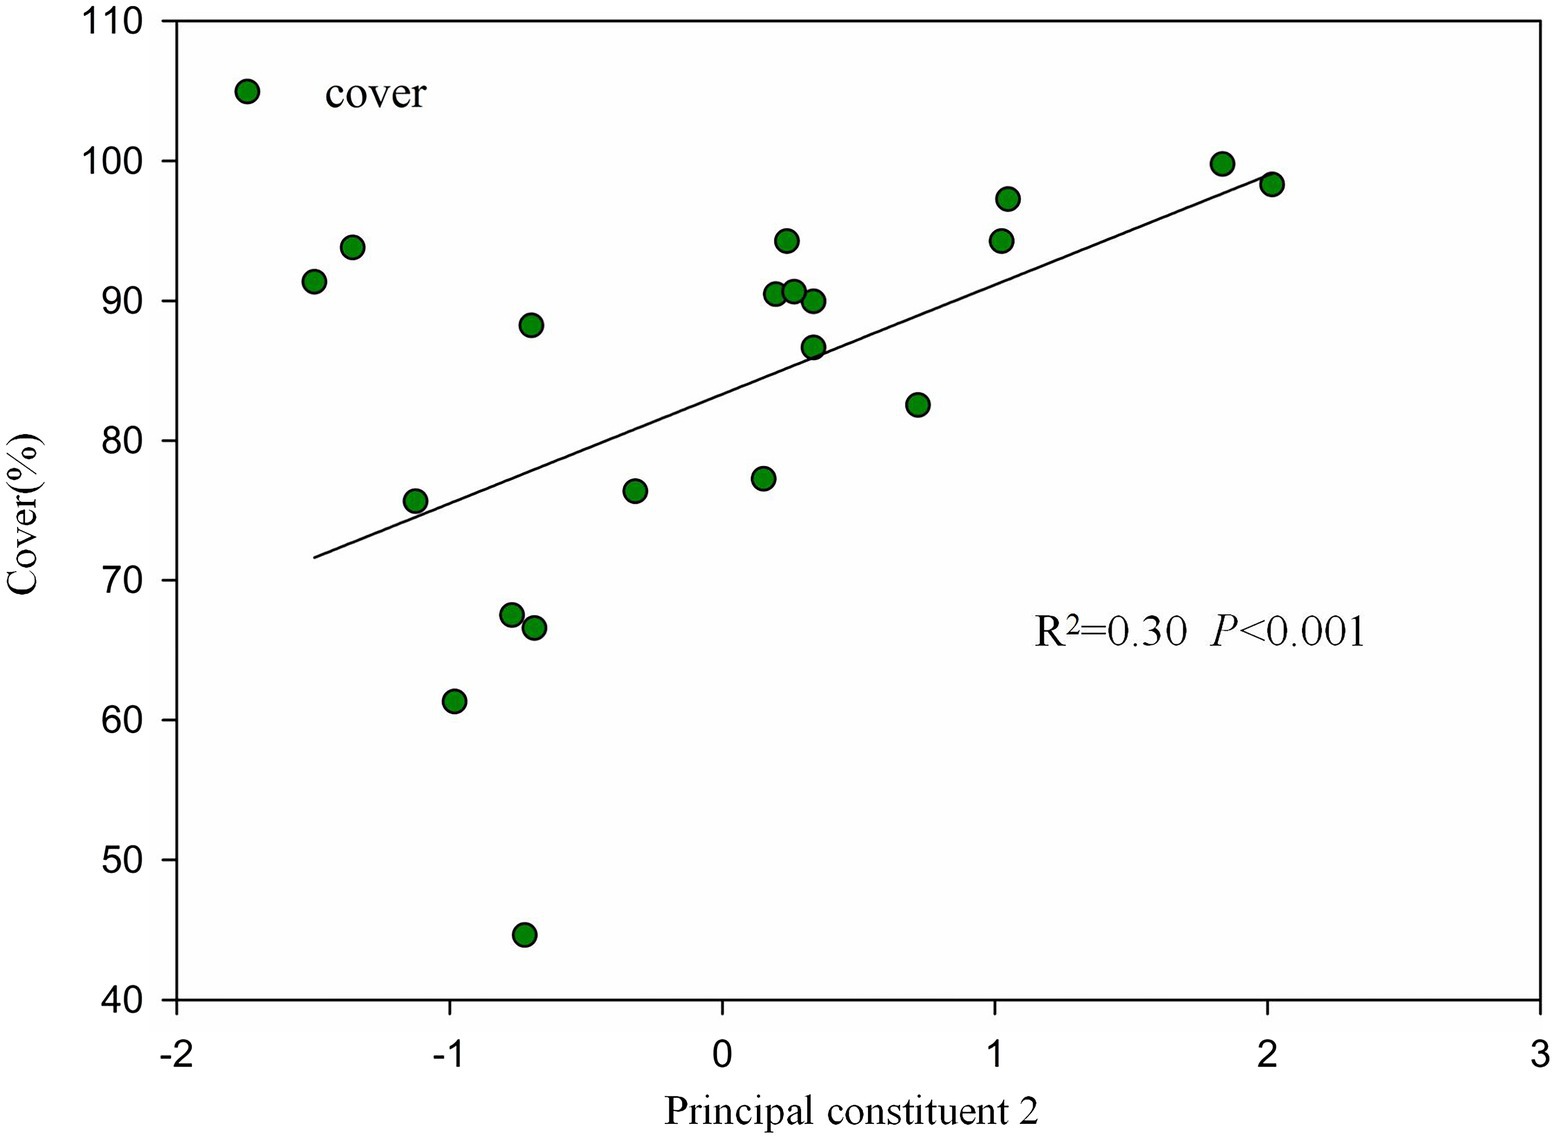
Figure 4. Relationships between forage cover and Principal component 2.
We analyzed the correlation between forage cover and 35 bioclimatic indicators (Figure 5) and found that coverage was significantly correlated with 15 bioclimatic indicators. Bio11 (mean temperature of the cold quarter), Bio12 (annual precipitation), Bio13 (precipitation in the wettest month), Bio14 (precipitation in the driest month), Bio16 (precipitation in the wettest quarter), Bio17 (precipitation in the driest quarter), Bio18 (precipitation in the winter quarter), Bio19 (precipitation in the cold quarter), Bio24 (annual positive precipitation), Bio29 (mean temperature of the cold month), and Bio33 (ombrothermic index of summer and previous month) were positively correlated with forage output, with R2 values between 0.20 and 0.36. The magnitude of the correlation was in the following order: Bio17, Bio14, Bio12, Bio24, Bio18, Bio16, Bio19, Bio33, Bio13, Bio29, and Bio11. Forage cover was most highly correlated with Bio17 (R2 = 0.36), Bio14 (R2 = 0.33), and Bio12 (R2 = 0.31). Coverage was negatively correlated with Bio4 (temperature seasonality), Bio7 (annual temperature range), Bio15 (precipitation seasonality), and Bio27 (simplified continuity index), with R2 values of 0.25–0.415. The coverage showed the highest correlation with Bio4 (R2 = 0.415), followed by Bio27 (R2 = 0.37).
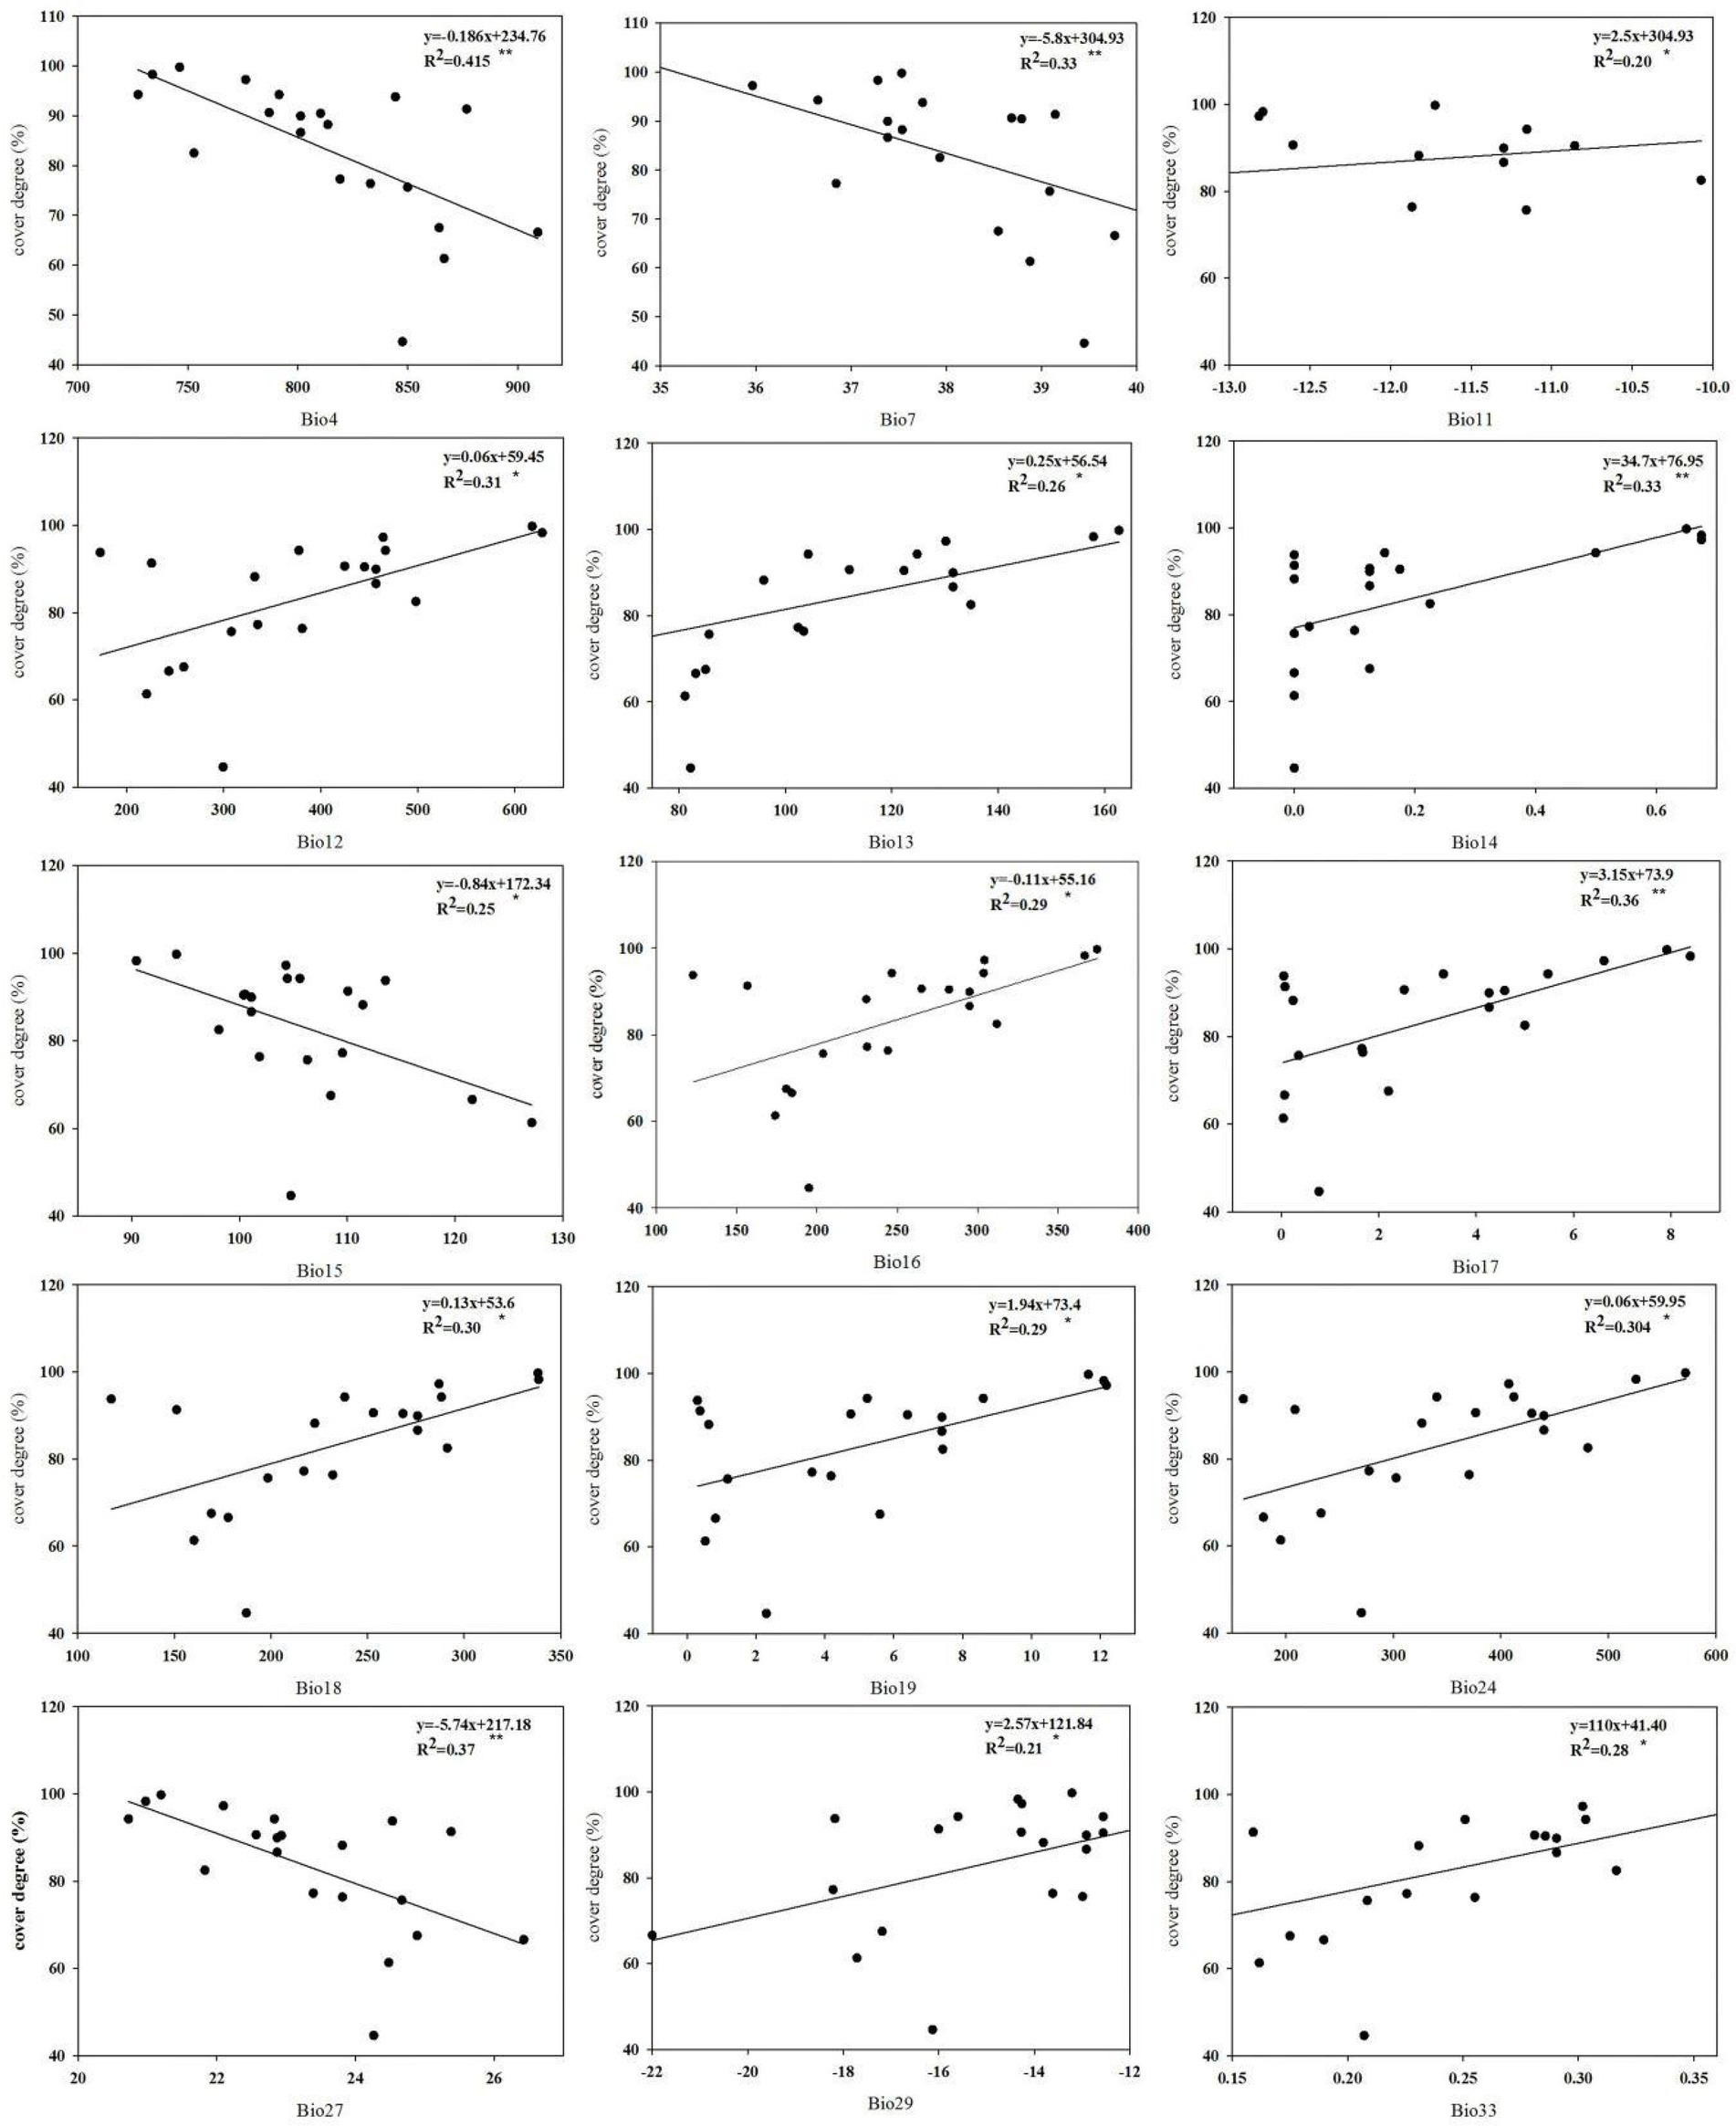
Figure 5. Relationship between forage coverage and 15 bioclimatic indices.
4. Discussion
4.1. Relationship between forage output and bioclimatic indices
We found that forage yield was significantly correlated with 16 bioclimatic indicators, and had the strongest correlations with Bio24, Bio12, and Bio17. Thus, forage yield is closely associated with annual precipitation, followed by temperature. This is consistent with the findings of previous studies (Bai et al., 2008). However, unlike previous studies, we performed a more detailed analysis and found that forage yield was more closely related to annual positive precipitation than to annual precipitation. Annual positive precipitation reflects the summed long-term averages of total precipitation (cumulative daily precipitation) for months with long-term average daily temperatures (Tg) exceeding 0°C (Rivas-Martínez et al., 2011); therefore, annual positive precipitation incorporates temperature data to some extent. The growth potential of plants is highest when favorable precipitation and temperature conditions coincide (Liu et al., 2021), and this may explain why forage yield was more closely related to positive annual precipitation in this study.
Our results also revealed a strong correlation between forage yield and precipitation during the driest season. During the driest seasons in the study region, autumn and winter, soil movement, and snow formation caused by precipitation increase the soil water content, which is conducive to plant re-emergence in spring and growth in summer (Nandintsetseg and Shinoda, 2011; Richardson et al., 2013). Schenk and Jackson (2010) analyzed plant root systems on a global scale and found that higher precipitation in winter led to deeper plant roots. This improves the water absorption capacity of roots, allowing them to meet the transpiration needs of plants.
In the present study, forage yield was negatively correlated with Bio4 (temperature seasonality), Bio15 (precipitation seasonality), and Bio27 (simplified continuity index). The high values of Bio4 and Bio27 indicated a large range of temperature variations in this region. The northeast region of the Qinghai–Tibetan Plateau is an arid area; some studies have shown that under drought conditions, exposure to intense cold and heat can aggravate water stress in plants, which depletes the available energy reserves required for rooting, transpiration, and defense responses (Harper et al., 2009). The precipitation seasonality index, which reflects the degree of change in precipitation over a given period, was negatively correlated with forage yield, indicating that greater degrees of change in precipitation were associated with lower forage yields. This is consistent with the findings of previous studies that showed that low but continuous precipitation is favorable for forage growth, while uneven precipitation is unfavorable (Liu et al., 2021). Under global change, the frequency of observed and predicted extreme weather events (temperature and precipitation) increases. Extreme temperature and extreme precipitation can indicate an increase in the temperature seasonal, precipitation seasonal, and simplified continuity indices. The results of this study showed that higher indicator values are associated with greater adverse impacts on pasture growth. In future pasture management, we can take preventive measures using extreme predictions.
According to the relationship between bioclimatic indicators and forage yield, we suggest that during the drought period, artificial rainfall and other methods should be used to supplement water availability, taking temperature into account, to achieve matching between precipitation and temperature and increase the forage yield. In addition, cold- and drought-resistant and high-yield grass species should be selected to improve grass yield and achieve a balance between grass and livestock; this would promote modernization of animal husbandry and achieve sustainable grassland ecological protection.
4.2. Relationship between forage cover and bioclimatic indices
Forage coverage was significantly correlated with 15 bioclimatic indicators and was most highly correlated with Bio17 (precipitation in the driest quarter), Bio14 (precipitation in the driest month), and Bio12 (annual precipitation). Forage coverage reflects the proportion of the study area covered by vertically projected vegetation and is the most direct representation of biomass (Wang, 2020). Several studies have reported a positive correlation between annual precipitation and aboveground biomass (Ma et al., 2008; Hu, 2010; Guo et al., 2012). In this study, forage cover was closely related to precipitation of driest month and driest quarter. This may be because precipitation during these seasons increases soil water content, which promotes plant growth in spring and summer (Nandintsetseg and Shinoda, 2011; Richardson et al., 2013). Moreover, adequate water storage before germination is beneficial for early forage growth and can increase the surface area of roots and leaves. When external temperatures become more favorable in later growth stages, plants with larger leaves, and roots can capture solar radiation and soil water more effectively (Becchetti et al., 2016). Good growth and development during the early stages also increase grass coverage, which may promote the infiltration of rainfall into the soil and increase soil water storage for subsequent use. We found a relatively weak correlation between forage cover and indicators of adequate precipitation (precipitation during the wettest season and wettest month).
Forage coverage was negatively correlated with Bio4, Bio7, Bio15, and Bio27. The magnitude of the correlation was highest for Bio4, followed by Bio27, which is consistent with the results for forage yield. This is likely because the seasonal index of temperature, annual range of temperature, and simplified continental index indicate the degree of change in temperature. Higher indices represent greater changes in temperature. When the severity of temperature change exceeds the adaptability of plants to new environmental conditions, the internal balance and stability of plants may decline, leading to serious, and irreparable damage (Siegmund et al., 2016).
The seasonal precipitation index reflects the change in precipitation within a given period. This index was negatively correlated with forage cover, indicating that a greater degree of change in precipitation is associated with lower forage cover. Duncan and Woodman(see 1975) showed that low but continuous precipitation occurs throughout the growing season and is conducive to forage growth (Duncan and Woodmansee, 1975). Liu et al. (2021) showed that in dry years, uniform rainfall promotes forage growth. In contrast, when the soil moisture is sufficient (as in wet years), areas with uniform precipitation are less favorable to forage growth than those with variable precipitation (Liu et al., 2021). These reports confirm the findings of the present study. The northeast region of the Qinghai–Tibetan Plateau experiences low precipitation; our results indicate that low levels of continuous precipitation promote forage growth, whereas uneven distribution of precipitation reduces forage growth.
Based on the relationship between bioclimatic indicators and coverage, we suggest increasing the diversity of pastures. Pasture diversity increases coverage and prevents soil erosion. When encountering extreme precipitation, the soil maintains its water storage capacity; however, herbage maintains diversity. Under certain conditions, the relationship between temperature and water can be adjusted to achieve the maximum growth rate and increase coverage through adaptation to the local environment. According to the prediction of extreme weather conditions, we also suggest changing the community structure of pastures. Some studies have found that extreme drought significantly inhibits the growth of perennial plants, but promotes the growth of annual plants.
5. Conclusion
We comprehensively considered the relationship between 35 bioclimatic indicators and forage yield and coverage, and found that the combination of temperature and precipitation indicators had a very high correlation with yield and coverage. Forage yield was significantly correlated with 16 bioclimatic indices; yearly positive precipitation, annual precipitation, and precipitation in the driest quarter showed the highest positive correlations with forage yield. Temperature seasonality, precipitation seasonality, and the simplified continentality index were negatively correlated with forage yield; temperature seasonality had the greatest negative correlation. Forage cover was correlated with 15 bioclimatic indicators, including positive correlations with precipitation in the driest quarter, precipitation in the driest month, and annual precipitation, and negative correlations with temperature seasonality, temperature annual range, precipitation seasonality, and the simplified continentality index. Temperature seasonality had the highest negative correlation with forage cover, followed by the simplified continentality index. These results reflect the complex responses of forage growth to multiple climatic and environmental factors. By establishing the relationships between 35 bioclimatic indicators and forage yield and coverage, this study screened the bioclimatic indicators that are important for forage growth in the northeast region of the Qinghai–Tibetan Plateau. We discuss the physiological and ecological mechanisms underlying the response of forage growth to the latest bioclimatic indicators. In future studies, we will build a bioclimatic index system specifically for forage growth, detail the associated principles and calculation methods, and establish a climate model for pasture growth in the northeast region of the Qinghai–Tibetan Plateau. This will provide a scientific basis for the early determination of livestock carrying capacity and reasonable animal husbandry. These results may contribute to the ecological protection and restoration of this region.
Data availability statement
The original contributions presented in the study are included in the article/supplementary material, further inquiries can be directed to the corresponding author.
Author contributions
LW and WM: designed the study and completed the manuscript. DZ: revised the manuscript. QC, LuL, and LoL contributed to the data collection and processing. All authors have read and agreed to the published version of the manuscript.
Funding
This research was supported by the Natural Science Foundation of China (grant no. 42165014).
Acknowledgments
This is a short text to acknowledge the contributions of specific colleagues, institutions, or agencies that aided the efforts of the authors.
Conflict of interest
The authors declare that the research was conducted in the absence of any commercial or financial relationships that could be construed as a potential conflict of interest.
Publisher’s note
All claims expressed in this article are solely those of the authors and do not necessarily represent those of their affiliated organizations, or those of the publisher, the editors and the reviewers. Any product that may be evaluated in this article, or claim that may be made by its manufacturer, is not guaranteed or endorsed by the publisher.
Footnotes
References
Bai, Y., Wu, J., Xing, Q., Pan, J., Huang, D., and Han, X. (2008). Primary production and rain use efficiency across a precipitation gradient on the Mongolia plateau. Ecol. Lett. 89, 2140–2153. doi: 10.1890/07-0992.1
Becchetti, T., George, M., McDougald, N., Dudley, D., Connor, M., Flavel, D., et al. (2016). Rangeland management series: annual range forage production. doi: 10.3733/ucanr.8018,
Chaplin-Kramer, R., and George, M. (2013). Effects of climate change on range forage production in the San Francisco Bay area. PLoS One 8:e57723. doi: 10.1371/journal.pone.0057723
Chen, I.-C., Hill, J. K., Ohlemuller, R., Roy, D. B., and Thomas, C. D. (2011). Rapid range shifts of species associated with high levels of climate warming. Science 333, 1024–1026. doi: 10.1126/science.1206432
Devine, S. M., O'Geen, A. T., O'Geen,, Larsen, R. E., Dahlke, H. E., Liu, H., et al. (2019). Microclimate–forage growth linkages across two strongly contrasting precipitation years in a Mediterranean catchment. Ecohydrology 12:12e2156. doi: 10.1002/eco.2156
Ding, M., Zhang, Y., Sun, X., Liu, L., Wang, Z., and Bai, W. (2013). Spatiotemporal variation in alpine grassland phenology in the Qinghai-Tibetan plateau from 1999 to 2009. Chin. Sci. Bull. 58, 396–405. doi: 10.1007/s11434-012-5407-5
Duncan, D. A., and Woodmansee, R. G. (1975). Forecasting forage yield from precipitation in California's annual rangeland. J. Range Manag. 28, 327–329. doi: 10.2307/3897788
Fick, S., and Hijmans, R. (2017). WorldClim 2: new1-km spatial resolution climate surfaces for global land areas. Int. J. Climatol. 37, 4302–4315. doi: 10.1002/joc.5086
Grabherr, G., Gottfried, M., and Pauli, H. (1994). Climate effects on mountain plants. Nature 369, 449–450. doi: 10.1038/369449a0
Guo, Q., Hu, Z., Li, S., Li, X., Sun, X., and Yu, G. (2012). Spatial variations in aboveground net primary productivity along a climate gradient in Eurasian temperate grassland: effects of mean annual precipitation and its seasonal distribution. Glob. Chang. Biol. 18, 3624–3631. doi: 10.1111/gcb.12009
Guo, L., Zhao, H., and Ji, S. (2010). Effects of climates on primary production of alpine stipa krylovii grassland. J. Northwest Agric. Forest. Univ. 38, 189–196. doi: 10.13207/j.cnki.jnwafu.2010.08.012
Hijmans, R., Cameron, S., Parra, L., Jones, P., and Jarvis, A. (2010). Very high resolution interpolated climate surfaces for global land areas. Int. J. Climatol. 20, 1965–1978. doi: 10.3390/s20051316
Harper, R. J., Smettem, K. R. J., and Carter, J. O. (2009). Drought deaths in eucalyptus globulus (labill.) plantations in relation to soils, geomorphology and climate. Plant & Soil. 324, 199–207. doi: 10.1007/s11104-009-9944-x
Hu, Z., Yu, G., Fan, J., Zhong, H., and Wang, S. (2010). Precipitation-use efficiency along a 4500-km grassland transect. Global ecology and biogeography 19, 842–851. doi: 10.1111/j.1466-8238.2010.00564.x
Karger, D. N., Conrad, J., Böhner, T., Kawohl, H., Kreft, R., Soria-Auza, N., et al. (2017). Climatologies at high resolution for the earth’s land surface areas. Sci. Data 4:170122. doi: 10.1038/sdata.2017.122
Kriticos, D. J., Jaroik, V., and Ota, N. (2014). Extending the suite of bioclim variables: a proposed registry system and case study using principal components analysis. Methods Ecol. Evol. 5, 956–960. doi: 10.1111/2041-210X.12244
Kriticos, D. J., Webber, B. L., Leriche, A., Ota, N., Macadam, I., Bathols, J., et al. (2012). Climond: global high-resolution historical and future scenario climate surfaces for bioclimatic modelling. Methods Ecol. Evol. 3, 53–64. doi: 10.1111/j.2041-210X.2011.00134.x
Le Houérou, H. N. (1984). Rain use efficiency: a unifying concept in arid-land ecology. J. Arid Environ. 7, 213–247. doi: 10.1016/S0140-1963(18)31362-4
Li, X. (2014). Influence of climate change on the growth and development of dominant forages in Inner Mongolia grassland. Dissertation/master’s thesis. [China (IL)]: Inner Mongolia Agricultural University.
Liu, H., Jin, L., Roche, M., O'Geen, A., and Dahlgren, R. A. (2021). Understanding spatial variability of forage production in California grasslands: delineating climate, topography and soil controls. Environ. Res. Lett. 16:014043. doi: 10.1088/1748-9326/abc64d
Ma, W., Yang, Y., He, J., Zeng, H., and Fang, J. (2008). Above-and belowground biomass in relation to environmental factors in temperate grasslands, Inner Mongolia. Sci China C Life Sci 51, 263–270. doi: 10.1007/s11427-008-0029-5
Matheus, S., and Lima-Ribeiro, (2015). Ecoclimate: a database of climate data from multiple models for past, present, and future for macroecologists and biogeographers. Biodiver. Inform. 10, 1–21. doi: 10.17161/bi.v10i0.4955
Murphy, A. H. (1970). Predicted forage yield based on fall precipitation in California annual grasslands. J. Range Manag. 23:363. doi: 10.2307/3896168
Nandintsetseg, B., and Shinoda, M. (2011). Seasonal change of soil moisture in Mongolia: its climatology and modelling. Int. J. Climatol. 31, 1143–1152. doi: 10.1002/joc.2134
Ni, J. (1998). Indexes of vegetation-climate Classificateon and its applications. Chin. J. Ecol. 17, 34–45. doi: 10.13292/j.1000-4890.1998.0071
Noce, S., Caporaso, L., and Santini, M. (2020). A new global dataset of bioclimatic indicators. Sci. Data 7:398. doi: 10.1038/s41597-020-00726-5
Parmesan, C. (2006). Ecological and evolutionary responses to recent climate change. Annu. Rev. Ecol. Evol. Syst. 37, 637–669. doi: 10.1146/annurev.ecolsys.37.091305.110100
Parton, W., Morgan, J., Smith, D., Grosso, S. D., Prihodko, L., Dan, L. C., et al. (2012). Impact of precipitation dynamics on net ecosystem productivity. Glob. Chang. Biol. 18, 915–927. doi: 10.1111/j.1365-2486.2011.02611.x
Pitt, M. D., and Heady, H. F. (1978). Responses of annual vegetation to temperature and rainfall patterns in northern California. Ecology 59, 336–350. doi: 10.2307/1936378
Qin, D., Zhou, B., and Xiao, C. (2014). Progress in studies of cryospheric changes and their impacts on climate of China. J. Meteorol. Res. 28, 732–746. doi: 10.1007/s13351-014-4029-z
Richardson, A. D., Keenan, T. F., Migliavacca, M., Ryu, Y., Sonnentag, O., and Toomey, M. (2013). Climate change, phenology, and phenological control of vegetation feedbacks to the climate system. Agric. For. Meteorol. 169, 156–173. doi: 10.1016/j.agrformet.2012.09.012
Rivas-Martínez, S., Rivas Sáenz, S., and Penas, A. (2011). Worldwide bioclimatic classification system. Glob. Geob. 1, 1–638. doi: 10.5616/gg110001
Schenk, H. J., and Jackson, R. B. (2010). Rooting depths, lateral root spreads and below-ground/above-ground allometries of plants in water-limited ecosystems. J. Ecol. 90, 480–494. doi: 10.1046/j.1365-2745.2002.00682.x
Schohr, T. K. (2014). Sustaining multifunctional working rangelands: Social, economic, and ecological insights into rancher decision-making. [dissertation/master’s thesis]. [California (IL)]: University of California
Shen, M., Piao, S., Dorji, T., Qiang, L., Nan, C., Chen, X., et al. (2015). Plant phenological responses to climate change on the Tibetan plateau: research status and challenges. Natl. Sci. Rev. 2, 454–467. doi: 10.1093/nsr/nwv058
Siegmund, J., Wiedermann, M., Donges, J., and Donner, R. (2016). Impact of climate extremes on flowering dates of four shrub species. Biogeosciences 13, 5541–5555. doi: 10.5194/bg-13-5541-2016
Title, P. O., and Bemmels, J. B. (2018). ENVIREM: an expanded set of bioclimatic and topographic variables increases flexibility and improves performance of ecological niche modeling. Ecography 41, 291–307. doi: 10.1111/ecog.02880
Vega, G. C., Pertierra, L. R., and Olalla-Tárraga, M. Á. (2018). Erratum: MERRAclim, a high-resolution global dataset of remotely sensed bioclimatic variables for ecological modelling. Sci. Data 5:180070. doi: 10.1038/sdata.2018.70
Walther, G. R., Post, E., Convey, P., Menzel, A., Parmesan, C., Beebee, T. J. C., et al. (2002). Ecological responses to recent climate change. Nature 416, 389–395. doi: 10.1038/416389a
Wang, C., Meng, F., Li, X., Jiang, L., Bai, L., and Wang, S. (2013). Responses of alpine grassland ecosystem on Tibetan plateau to climate change: A mini review. Chin. J. Ecol. 32, 1587–1595. doi: 10.13292/j.1000-4890.2013.0255
Wang, B. (2020). Study on ecological evaluation, monitoring and protection of meadow steppe in Inner Mongolia. [dissertation/master’s thesis] [China (IL)]: Inner Mongolia Agricultural University.
Yao, T., Piao, S., Shen, M., Gao, J., Yang, W., Zhang, G., et al. (2017). Chained impacts on modern environment of interaction between westerlies and Indian monsoon on Tibetan plateau. Bull. Chin. Acad. Sci. 32, 976–984. doi: 10.16418/J.ISSN.1000-3045.2017.09.007
Keywords: Qinghai–Tibetan plateau, Forage, output, coverage, bioclimatic index
Citation: Wang L, Ma W, Zhou D, Chen Q, Liu L and Li L (2023) Bioclimatic drivers of forage growth and cover in alpine rangelands. Front. Ecol. Evol. 10:1076005. doi: 10.3389/fevo.2022.1076005
Edited by:
Zhongqing Yan, Chinese Academy of Forestry, ChinaReviewed by:
Zhenming Zhang, Beijing Forestry University, ChinaJi-Zhong Wan, Qinghai University, China
Copyright © 2023 Wang, Ma, Zhou, Chen, Liu and Li. This is an open-access article distributed under the terms of the Creative Commons Attribution License (CC BY). The use, distribution or reproduction in other forums is permitted, provided the original author(s) and the copyright owner(s) are credited and that the original publication in this journal is cited, in accordance with accepted academic practice. No use, distribution or reproduction is permitted which does not comply with these terms.
*Correspondence: Wenmei Ma, ✉ maxiaolu0607@126.com