Spatiotemporal Dynamics of Ecosystem Services and the Driving Factors in Urban Agglomerations: Evidence From 12 National Urban Agglomerations in China
 Ming Shao1
  Chensong Lin
- 1School of Landscape Architecture, Beijing Forestry University, Beijing, China
- 2College of Urban and Environmental Sciences, Peking University, Beijing, China
- 3Beijing Laboratory of Urban and Rural Ecological Environment, Beijing Municipal Education Commission, Beijing, China
The natural environment provides multiple ecosystem services for urban development and human quality of life. Given that current cities interact with each other and form urban agglomerations, understanding the spatiotemporal changes in ecosystem services and the driving forces is crucial for sustainable urban development. Using 12 national-level urban agglomerations as a case study, this paper quantifies the spatial patterns of multiple ecosystem service values from 2000 to 2015 and assesses how natural and socioeconomic factors contribute to such changes by using ordinary least squares (OLS) and geographically weighted regression (GWR). The results show the following: (1) spatial discrepancies of ecosystem services exist both in and between urban agglomerations, and ecosystem service values are reduced in more than 70% of urban agglomerations at a rate ranging from 0.02 to 4.27%; (2) elevation, precipitation, and fraction of woodland have positive impacts on ecosystem service values in urban agglomerations; while gross domestic product (GDP), population, and proportion of built-up area have negative effects; (3) both natural and social driving factors impact the ecosystem services of different urban agglomeration in different ways, according to the differences in their driving degrees. We categorized 12 urban agglomerations in China into six typical types: natural-factor dominated, socioeconomic-factor dominated, policy dominated, balanced, natural-factor inclined, and socioeconomic-factor inclined. Our results can be used to inform decision makers and urban planners to propose explicit location strategies to balance natural protection and socioeconomic development and ultimately promote sustainable urbanization across the nation.
Introduction
With the continuous growth of urbanization, the marginal benefits brought by the individual spatial expansion of cities will be greatly reduced (Han et al., 2019). Clustered urban agglomeration development has been adopted as a major form for all countries to enhance urban competitiveness (Fang, 2015; Shi et al., 2020). Scholars from Great Britain, France, the Soviet Union, Germany, and China formed various concepts of urban agglomeration based on the situations of their home countries. Examples include “Metropolitan Regions” (Fawcett, 1932), “Megalopolis” (Gottmann, 1957), “Ecumenopolis” (Doxiadis, 1970), and “City-region” (Ng and Tang, 2013), which feature different research perspectives with respect to demographic, economic, society, function, industry, and the natural environment. Until the end of the 20th century, the United Nations (UN) officially used “urban agglomeration” to describe the phenomenon of urban development (Fang and Yu, 2017). Currently, most scholars refer to an “urban agglomeration” as a metropolitan area led by one or two cores of megacities that exert impacts on several peripheral cities and towns economically, socially, and ecologically via multiple infrastructures with regards to transportation, energy, communication, logistics, and natural ecosystems, ultimately creating a clustered regional complex (Song, 2010; Fang and Yu, 2017; Liu et al., 2018; Sun and Zhao, 2018; Chen et al., 2019; Wang J. et al., 2019; He, 2020). In 2006, China’s 11th 5-Year Plan proposed that urban agglomeration would be one of the key national strategies for the country’s long-term urbanization (NPC, 2006). The subsequent 13th Five-Year Plan (2015–2020) further specified the strategic layout of nineteen major urban agglomerations to be established in the future (NPC, 2016). The urban agglomeration model has become an important national development strategy for China to enhance the international competitiveness of cities.
Although an urban agglomeration is advantageous in terms of optimizing urban-rural resources and regional industrial structures (Cao, 2015; Wang and Cui, 2017; Tian, 2019), their rapid expansion of built-up areas can easily lead to many problems such as ecosystem degradation, habitat disturbance and environmental pollution in surrounding natural systems (Ma et al., 2021). Through assessing the environmental vulnerability of the Yangtze River Urban Agglomeration during 2005 and 2017, Peng et al. (2019) identified that the driving factors of the ecological environment vulnerability of the Yangtze River city group included natural, socioeconomic and policy factors. Based on longitudinal studies on China’s 342 cities during 2001 and 2016, Fan et al. (2019) found that China’s urban agglomeration development was strongly associated with peripheral air pollution and that this association was gradually growing. Liu’s research on the Changchun urban agglomeration revealed that highly clustered urbanization exerted ecological and environmental pressure due to increasing industrial investment and urban sprawl (Liu et al., 2017).
In 2005, the UN published The Millennium Ecosystem Assessment (Dooley, 2005; Carpenter et al., 2006) with the World Health Organization and United Nations Environment Program, in which the term “ecosystem service” was proposed to define the overall benefits humans obtain from the natural environment and ecosystem and subsequently established a mechanism to comparatively study the linkage between human wellbeing and the natural system. Scholars evaluate the interrelationship between urban agglomerations and natural ecosystems by adopting the concept of “ecosystem services.” For example, Haase explored the spatiotemporal dynamics of ecosystem services in the Leipzig-Halle Region, Germany, and identified how external factors impact each individual ecosystem service, based on which an adaptive integrated multiscale framework is proposed for regional development (Haase et al., 2012). Sun et al. (2018) analyzed how ecosystem services respond to urban sprawl in the Atlanta Metropolitan area from 1985 to 2010 and simulated the development trend of ecosystem services in 2030. Chen W. et al. (2020) explored how natural and social driving factors affect the ecosystem services in the Yangtze River Urban Agglomeration in China during 1995 and 2015. The present empirical evidence relying on the concept of ecosystem services not only generates academic knowledge about how urban agglomerations and natural ecosystems interact with each other and the underlying mechanism but also informs decision makers and urban planners with supportive references for spatially sensitive policy and planning interventions.
A burgeoning number of studies have evaluated ecosystem services in China’s urban agglomerations. Zhang et al. (2015) quantitively assessed how the value of ecosystem services changed in urban agglomerations along the coast of the Bohai Rim during 2000 and 2010. Li Z. et al. (2019) investigated the spatiotemporal patterns and cold/hot spots of ecosystem services in the Yangtze River Delta Urban Agglomeration in 2000. Gao et al. (2019) calculated the ecosystem service benefits and losses in the Yangtze River Delta urban agglomeration. These quantified evaluations of the ecosystem services of different urban agglomerations provide reference information and theoretical support for crafting urban agglomeration-related strategies and policies. In addition to monitoring the spatiotemporal dynamics of different ecosystem service values, emerging literature has begun to analyze the potential driving factors of ecosystem services. Liu et al. (2020) investigated how landscape patterns affected urban agglomerations in the Yangtze River and proposed that cross-regional collaborative governance among different regions is necessary to improve the development of ecosystem services in the entire region. Peng et al. (2019) explored the linkages between human activities and ecosystem services in Yangtze River Urban Agglomeration and revealed the heterogeneous effects of natural and social factors on different cities within the agglomeration at different time periods. Chen et al. (2019) assessed the interaction between ecosystem services and driving factors with respect to socioeconomic and policy making and provided recommendations for adaptive land-use models.
However, most research that has explored the driving factors of ecosystem services has focused on individual urban agglomerations (Cao, 2015; Zhang et al., 2015; Chen et al., 2019; Li T. et al., 2019; Li Z. et al., 2019; Peng et al., 2019; Liu et al., 2020). Due to the varying research time periods, methods, and objectives, it is difficult to compare the changing characteristics of ecosystems and driving factors in different urban agglomerations. In the practical realm, spatially explicit information of different urban agglomerations is needed to better inform policy makers to promote location-sensitive development strategies and planning. Therefore, this study comparatively examines 12 recently established urban agglomerations in China using consistent quantification methods to understand how natural and social driving factors affect the ecosystem services among different urban agglomerations and to provide reference information for location-sensitive policies and planning.
The objectives of this study are (1) to evaluate the ecosystem services of 12 major urban agglomerations in 2000, 2005, 2010, and 2015 using a quantitative approach and analyze the spatiotemporal dynamics, (2) to understand how natural and social driving factors influence the ecosystems of the 12 major urban agglomerations and the spatial characteristics, and (3) to provide location-sensitive policy and planning recommendations based on the analytical results.
Materials and Methods
Study Area
The State Council of China’s 13th Five-Year Plan (2015–2020) proposed nineteen urban agglomerations to be established in the future. Before June 2020, the development guidelines of 12 urban agglomerations were approved by the State Council and National Development and Reform Commission with specific planning borders and development objectives and were thus included in this study (NDRC, 2016). The 12 urban agglomerations are the middle reaches of the Yangtze River Urban Agglomeration (MRTR), Beijing-Tianjin-Hebei Urban Agglomeration (BTH), Harbin-Changchun Urban Agglomeration (HC), Chengdu-Chongqing urban agglomeration (CC), Yangtze River Delta urban agglomeration (YRD), Central Plain Urban Agglomerations (CP), Beibu Gulf urban agglomeration (BG), Guanzhong Plain Urban Agglomeration (GP), Hohhot-Baotou-Ordos-Yulin Urban Agglomeration (HBOY), Lanzhou-Xining Urban Agglomeration (LX), Guangdong-Hong Kong-Macau Greater Bay Area (GHM), and Yunnan Central Urban Agglomeration (YC). Detailed information on the selected urban agglomerations is in Figure 1 and Table 1.
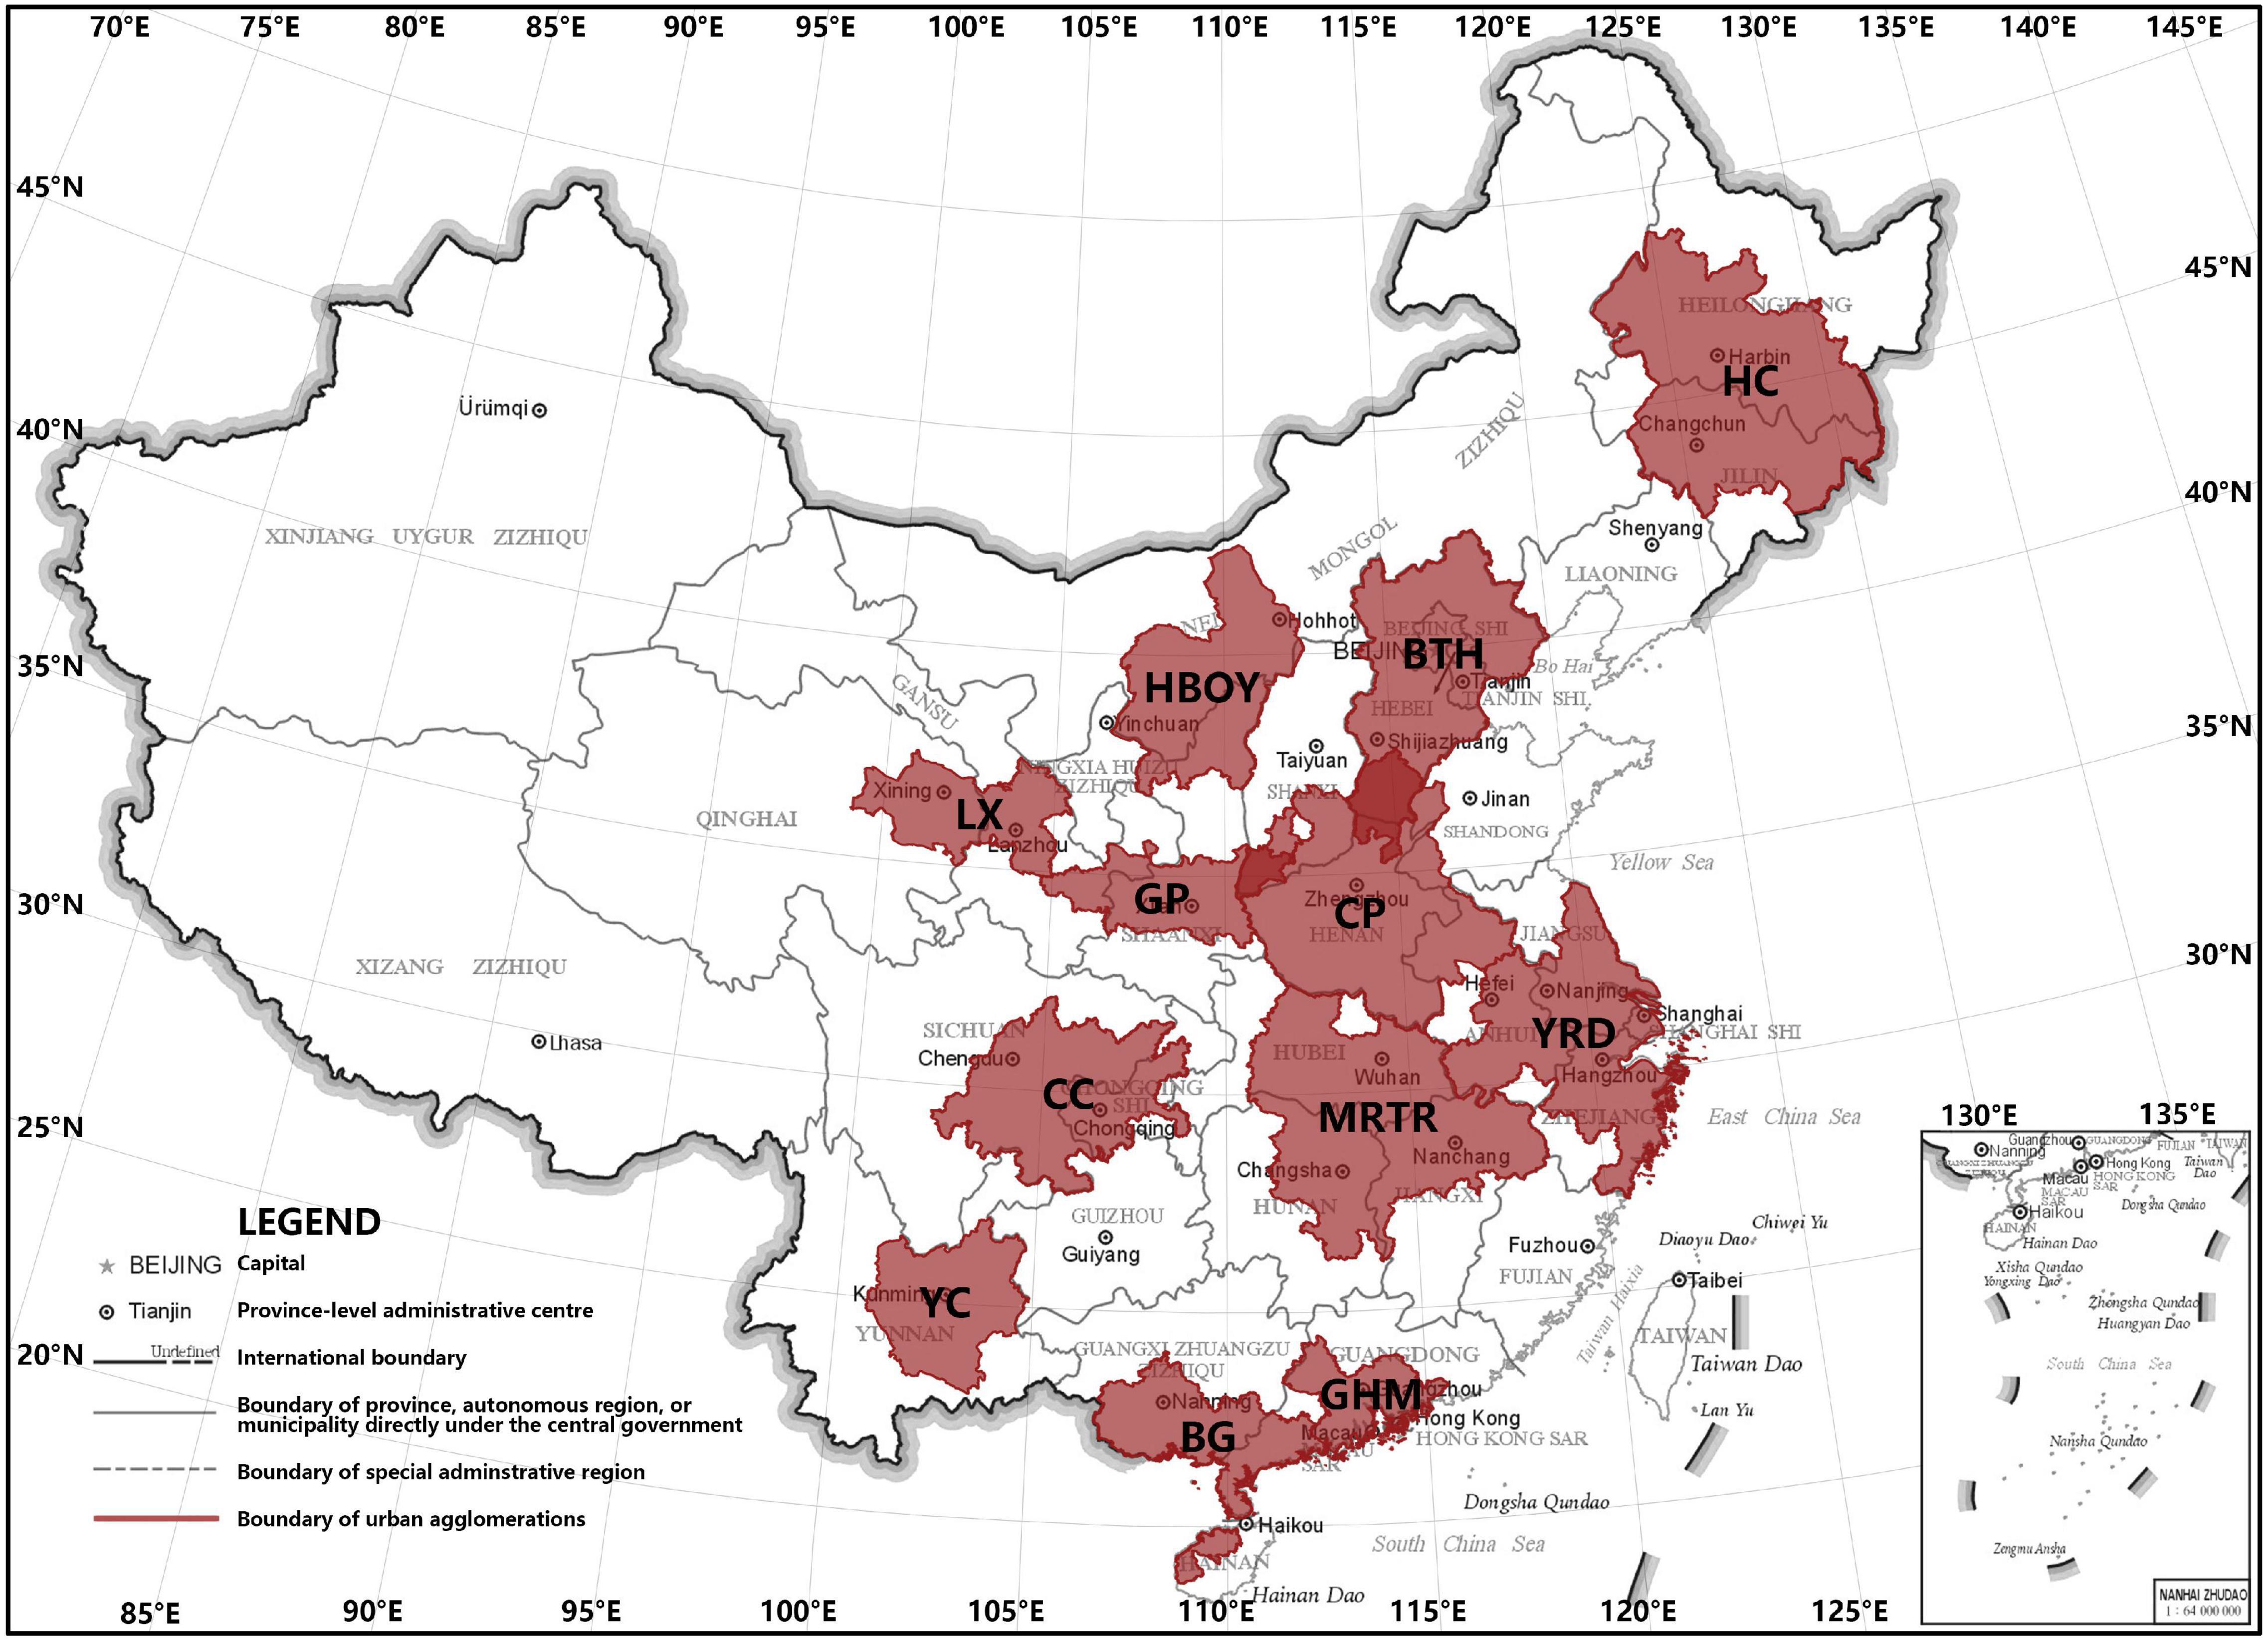
Figure 1. Location distribution map of China’s existing urban agglomerations. MRTR, middle reaches of the Yangtze River Urban Agglomeration; BTH, Beijing-Tianjin-Hebei Urban Agglomeration; HC, Harbin-Changchun Urban Agglomeration; CC, Chengdu-Chongqing urban agglomeration; YRD, Yangtze River Delta urban agglomeration; CP, Central Plain Urban Agglomeration; BG, Beibu Gulf urban agglomeration; GP, Guanzhong Plain Urban Agglomeration; HBOY, Hohhot-Baotou-Ordos-Yulin Urban Agglomeration; LX, Lanzhou-Xining Urban Agglomeration; GHM, Guangdong-Hong Kong-Macau Greater Bay Area; YC, Yunnan Central Urban Agglomeration.
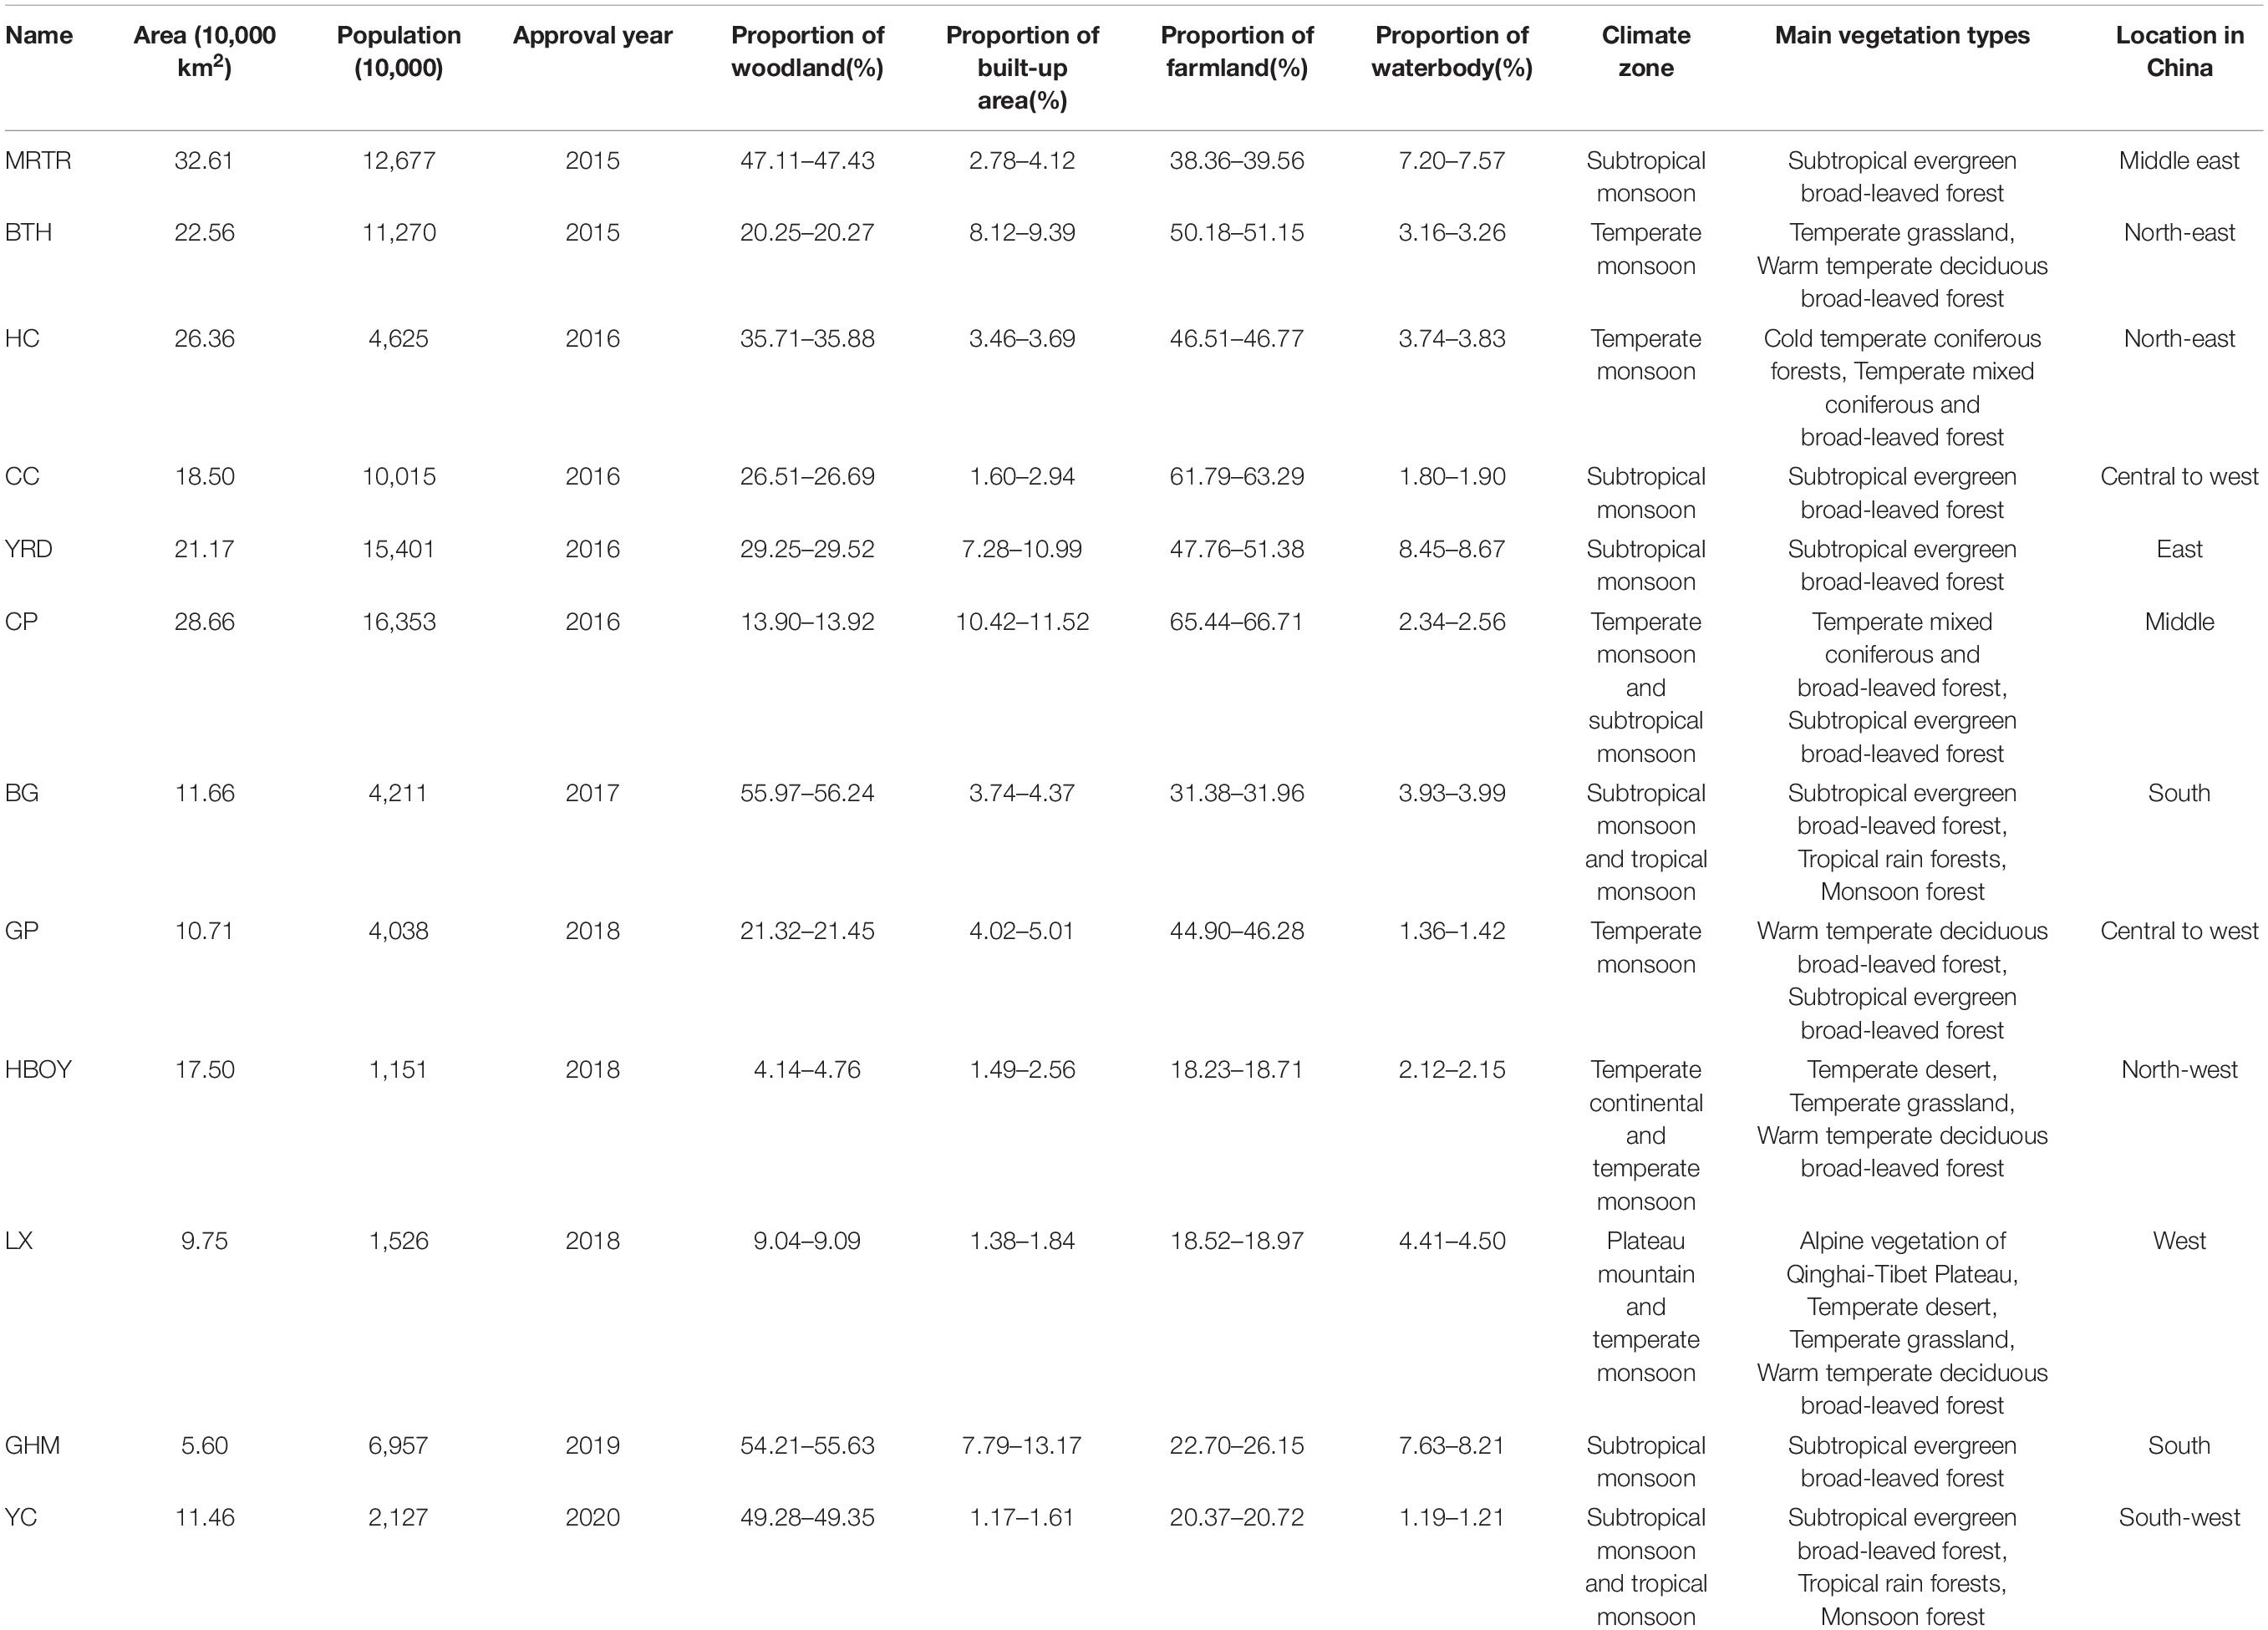
Table 1. Overview of China’s existing urban agglomerations.
Data Collection
The study utilizes multiple data, including the administrative borders of each urban agglomeration, land-use maps, economic data of agricultural production, and driving factor data. Following previous studies (Gao and Wang, 2019; Sun et al., 2019; Chen J. et al., 2020; Dai et al., 2020; Luo et al., 2020), driving factors are in two categories—natural and social factors—the former includes elevation, vegetation coverage, precipitation, and temperature, and the latter refers to GDP per unit, population density, and urban built area ratio within the entire administrative border. Detailed data sources and descriptions are provided in Table 2.
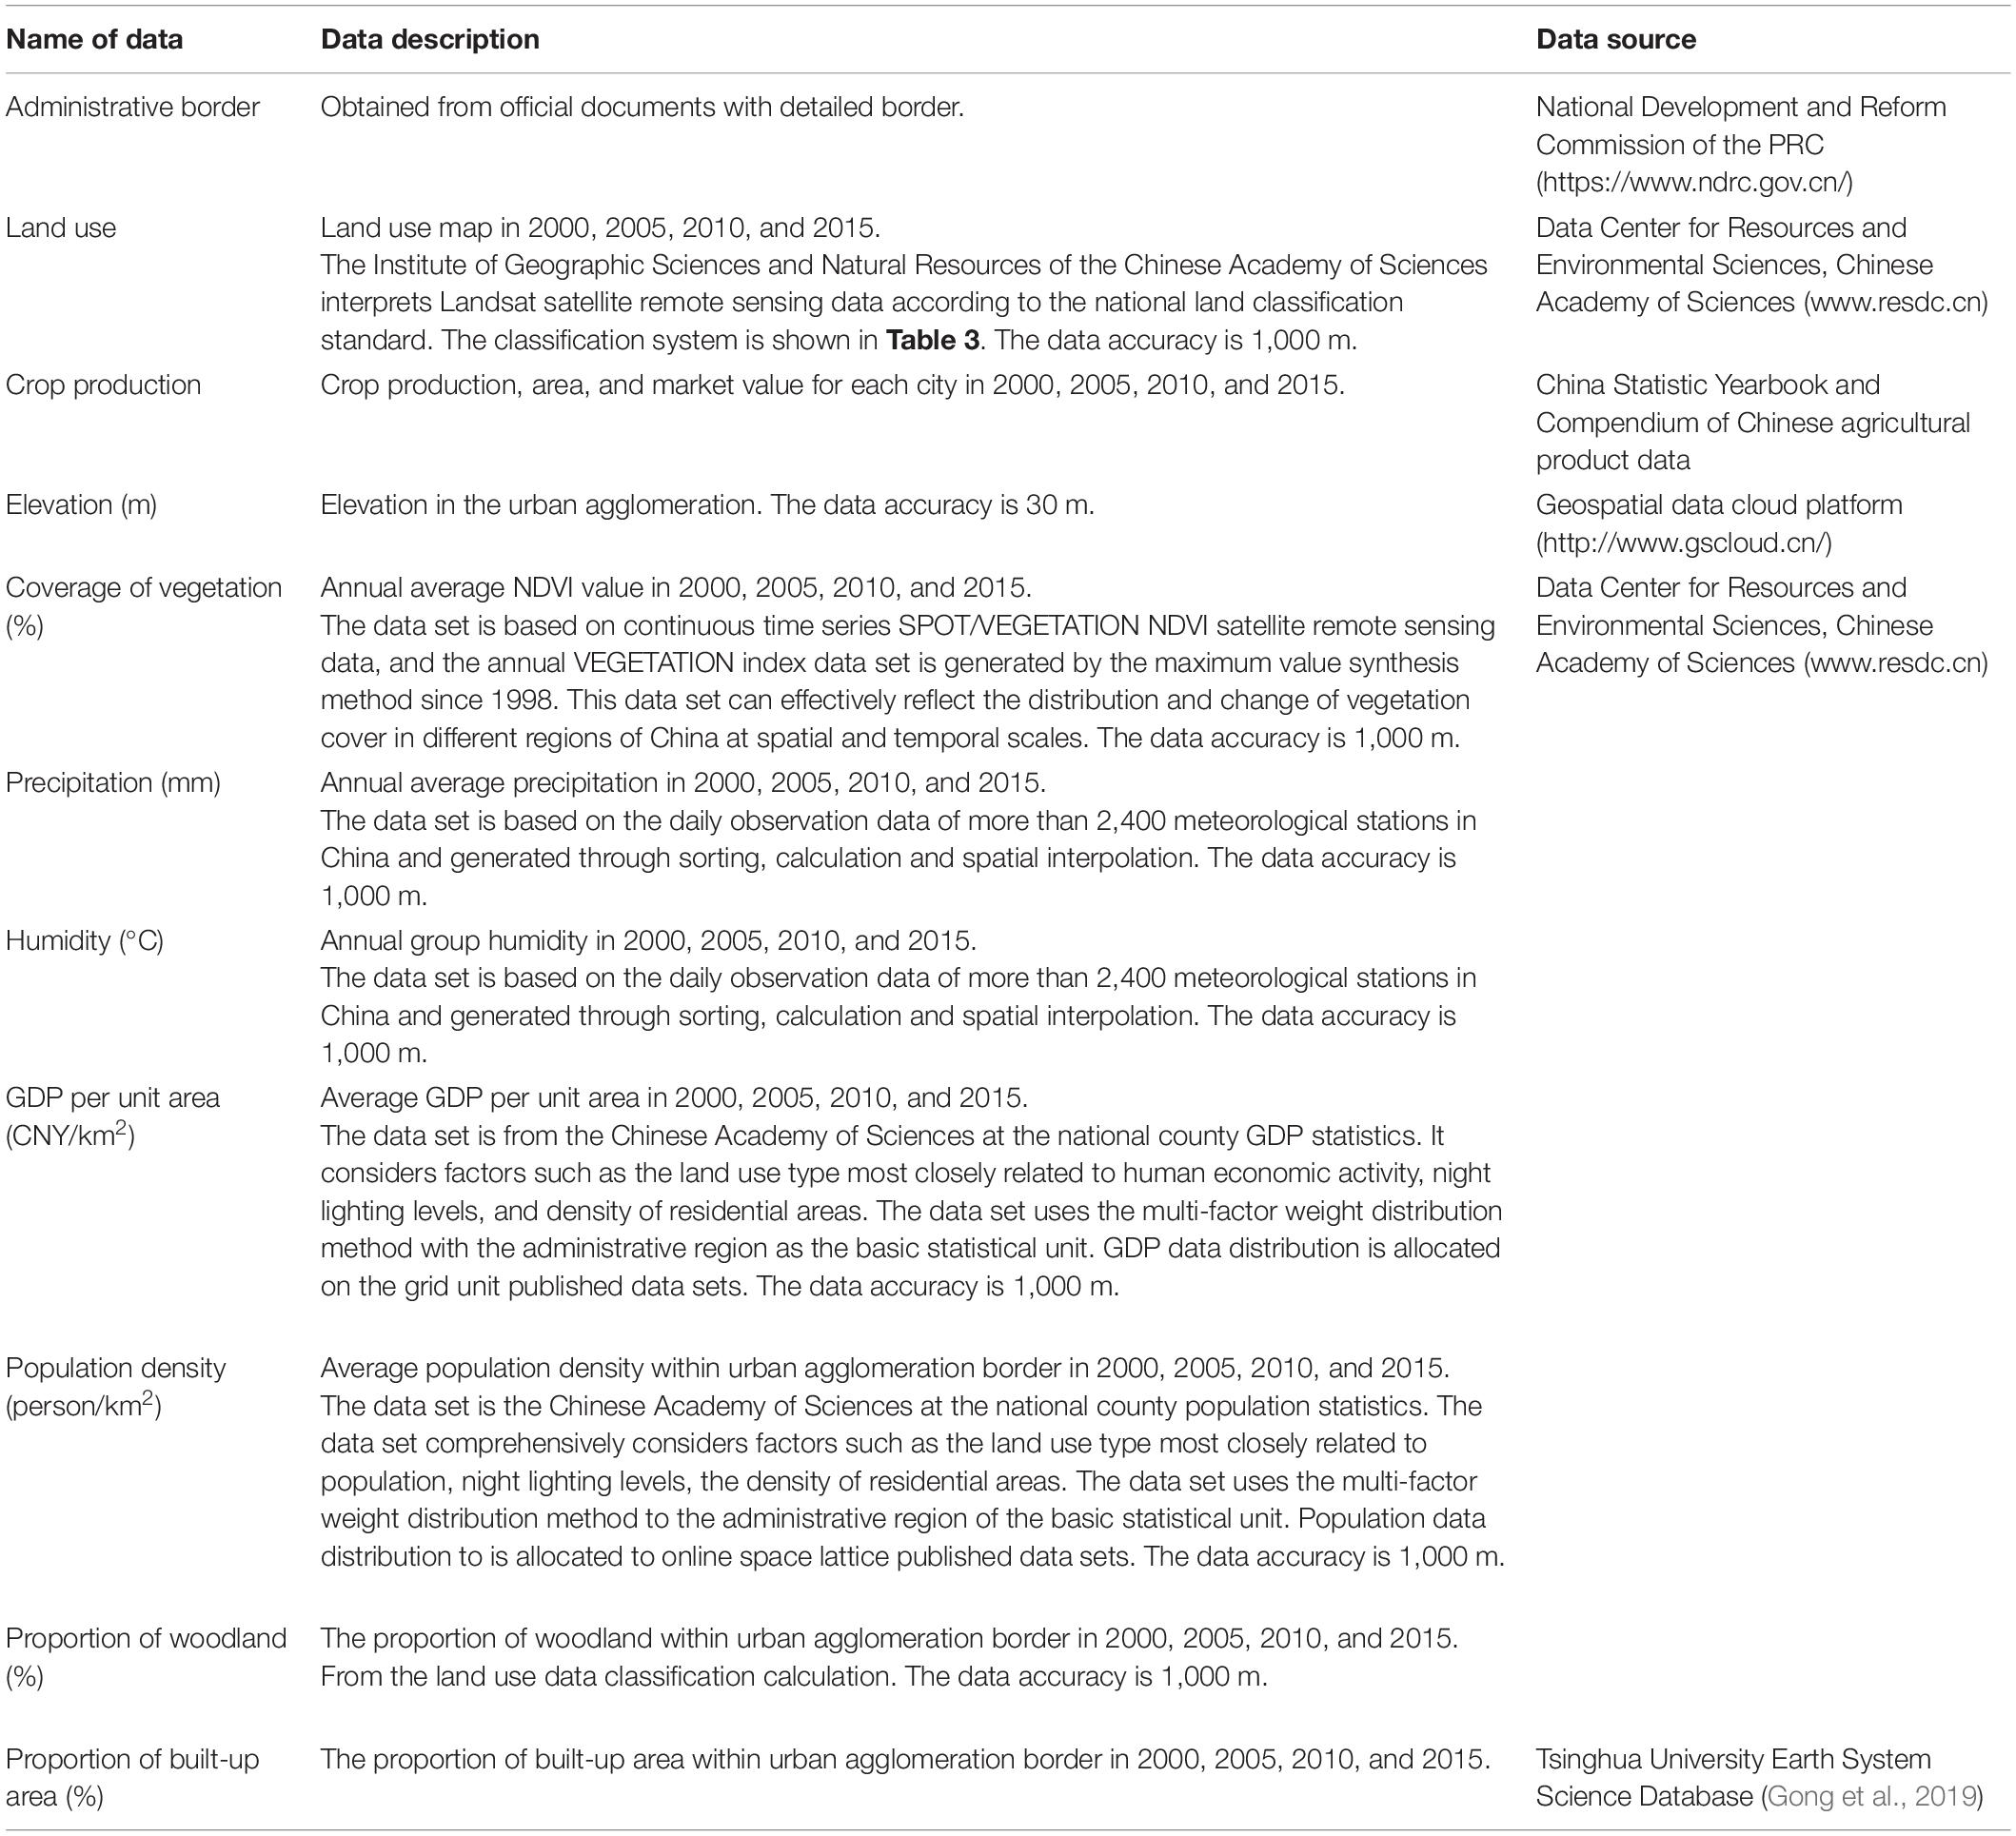
Table 2. Summary of data sources.
Data Collection
Assessment of Ecosystem Service Values
Constanza estimated the current economic value of 17 ecosystem services worldwide based on published studies and a few original calculations in 1997 (Costanza et al., 1997), which established a first approximation of the relative magnitude of global ecosystem services and made the potential values of different ecosystems more apparent for further studies. Later, Xie et al. adjusted the methods based on China’s socioeconomic and natural ecosystem conditions and widely adopted them in many studies and practices (Xie et al., 2003; Jie et al., 2014; Zhang et al., 2015; Kang et al., 2018; Zhou et al., 2018; Hu et al., 2019).
Following Xie’s approach, this study defines one ecosystem service value equal to 1/7 of the average market value per unit area yield of grain in China (Yu et al., 2005). This measurement is based on an ecological assets value table and adjusted price value by biomass, which was established via consultation of professional ecologists and adjusted through experiments. The approach can be used to evaluate the entire regional ecosystem in a consistent manner. The ecosystem service value is calculated by the following equations:
In Equation (1), ESV is the total ecosystem service value, Sx refers to the area of xth ecosystem area, Cxy is the xth ecosystem’s yth service value equivalent coefficient, a is the number of ecosystems, b is the number of ecosystem services, M is one unit standard ecosystem service value equivalent factor, Sdg, Sxm, andSym refer to area ratios of Chinese rice, wheat, and corn, respectively, and Mdg, Mxm and Mym are the market values of the three crops.
The reasons why our study covers the periods of 2000, 2005, 2010, and 2015 are as follows. In the 1990s, due to the introduction of land-use reform and integration of the private sector in the land market, China’s urbanization grew at a significant rate. This led to a surge in the built-up area, industrial scale, and volume of revenues of Chinese cities, which was usually at the cost of cities’ natural resources (Gaubatz, 1999). Even though rapid urbanization brings economic development, the country’s government realized that the negative impacts on the natural resources and structures of cities were irreversible. Many national-level guidelines were proposed in the early twenty-first century to promote healthy urban development. In the 10th Five-Year Plan proposed in 2000, the central government promoted the coordinating development of large, middle, and small cities as a prototype of urban agglomeration. The 2005 11th Year Plan established integrated urban-rural development, demanding large cities to lead the development of small cities. The 2010 plan stressed the development of urban agglomerations and proposed a “three vertical and two horizontal” pattern of urbanization at the national scale. That being said, during 2000 and 2015, the top-down national policy promoted the stable development of urban agglomerations. Therefore, the study of the state of urban agglomerations in this period can exclude the influence of extreme policies under special circumstances to better reflect the spontaneous evolution characteristics of various urban agglomerations.
In addition, this study calculated the value equivalent factor of ecosystem services in 2000, 2005, 2010, and 2015 based on the China Statistical Yearbook and Compilation of Cost-Benefit Data of Agricultural Products in China, weighting the inflation and market fluctuation in each different year (NBS, 2020), and it used the average values in the 4 years for the standard value equivalent factor of ecosystem service: the value equivalent factor of one standard unit of ecosystem service is 1359.84 CNY per ha. The coefficient of ecosystem service value per unit in China’s urban agglomeration is calculated according to Xie et al.’s research (Xie et al., 2003, 2008).
Ordinary Least Squares Model
We used ordinary least squares (OLS) regression to identify the factors that significantly impact ecosystem services within urban agglomerations, and factor screening was conducted based on significance and adjusted R2. The calculation formula is as follows (Li and Zhao, 2019; Ketema et al., 2020; Zhong et al., 2020):
In Equation 3, yi is the ecosystem service value at i, β is the interception, βk is the coefficient of the kth driving factor, xik is the value of the kth driving factor at i, and εi is the error term.
Geographically Weighted Regression
The OLS model is an aspatial regression model. It cannot effectively capture spatial variations in how driving factors impact ecosystem service values when there is of the potential of spatial autocorrelation (Li et al., 2017; Lyu et al., 2019; Huang et al., 2020; Shao et al., 2020).
Therefore, in this study, OLS was performed first to gain the overall associations between driving factors and ecosystem services, followed by spatial regression models, such as geographically weighted regression (GWR), to further explain the local variances (Fotheringham et al., 2002). GWR considers that the spatial variances can be easily visualized to identify the spatial patterns of the relationships, thereby better informing planners and decision makers (Tooke et al., 2010).
In Equation 4, β0(Ui, Vi) is the intercept at (Ui, Vi), βk(Ui, Vi) is the coefficient of the kth driving factor at (Ui, Vi), xk(Ui, Vi) is the value of the kth driving factor at (Ui, Vi), and εi is the residual. In Equation 5, XT is the matrix transpose operation of driving factors, and W(Ui, Vi) is the distance weight matrix. In Equation 6, h is the bandwidth of AIC, and dij is the distance between i and j.
The OLS and GWR were performed in the ArcGIS 10.6 platform.
Results and Discussion
Ecosystem Service Values in Different Urban Agglomerations
Based on Tables 3,4 the values of ecosystem services in the 12 urban agglomerations (at the county-level administration) in 2000, 2005, 2010, and 2015 can be found in Figure 2.
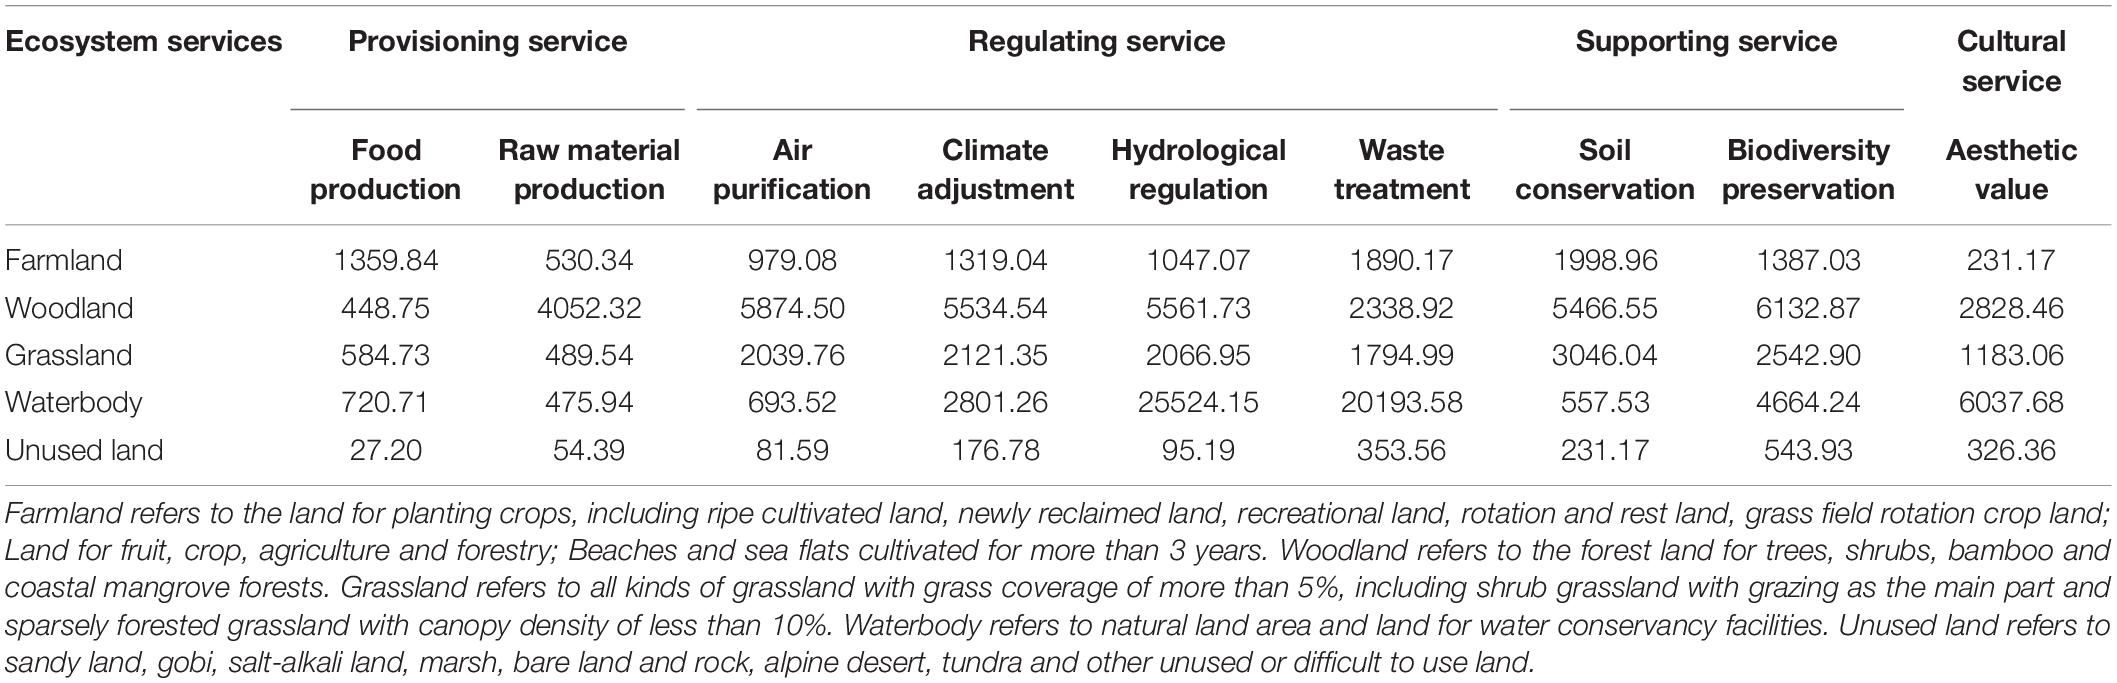
Table 3. The coefficient of ecosystem service value per unit area in China’s urban agglomerations [CNY/(Ha * year)].
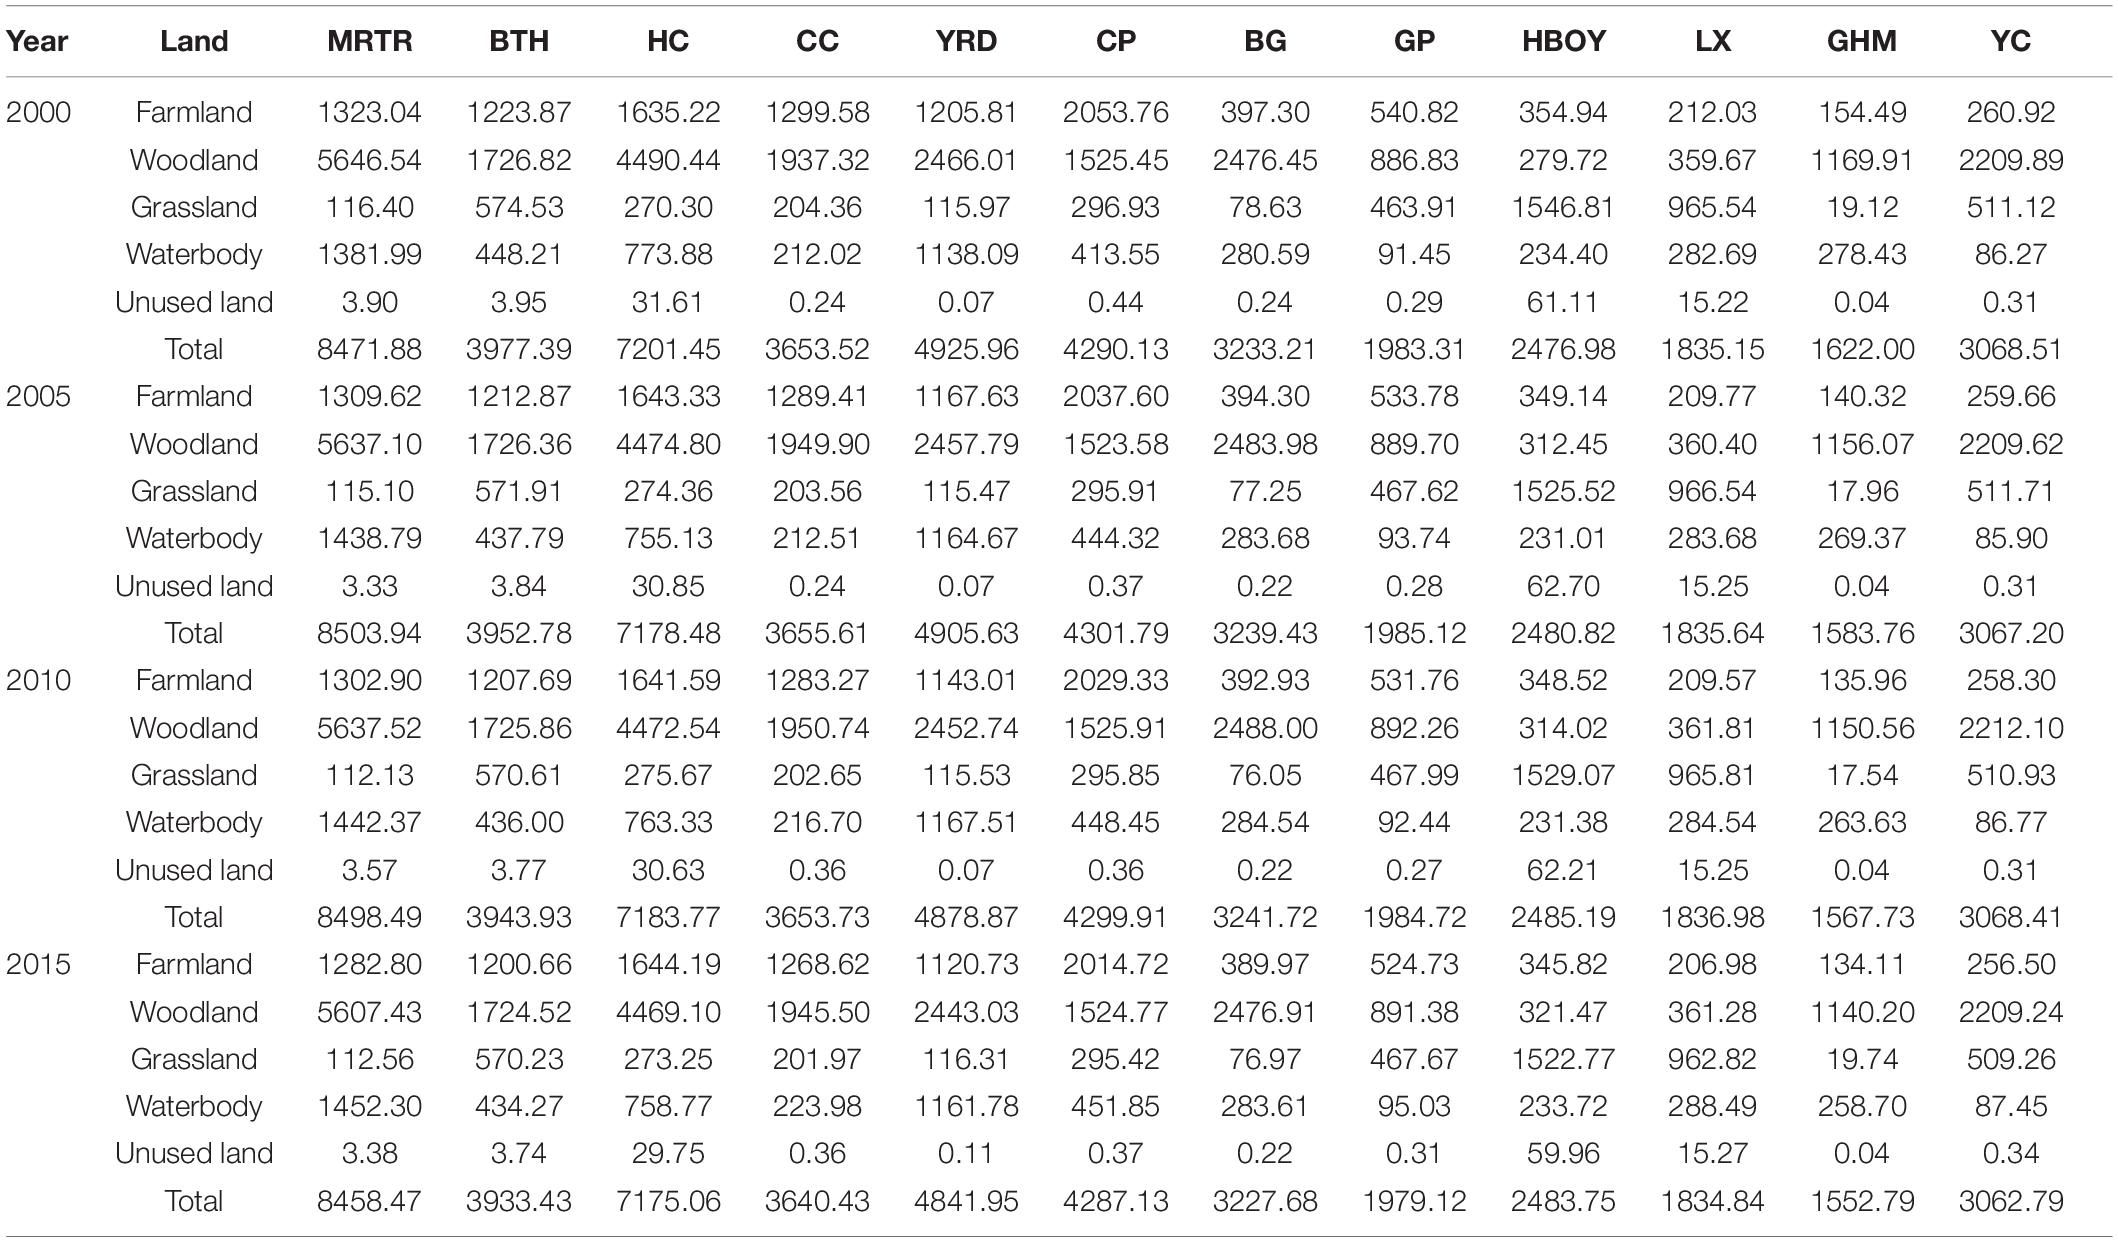
Table 4. Trends of different ecosystem services in 12 urban agglomerations in China during 2000–2015 (Unit: 100 million CNY).
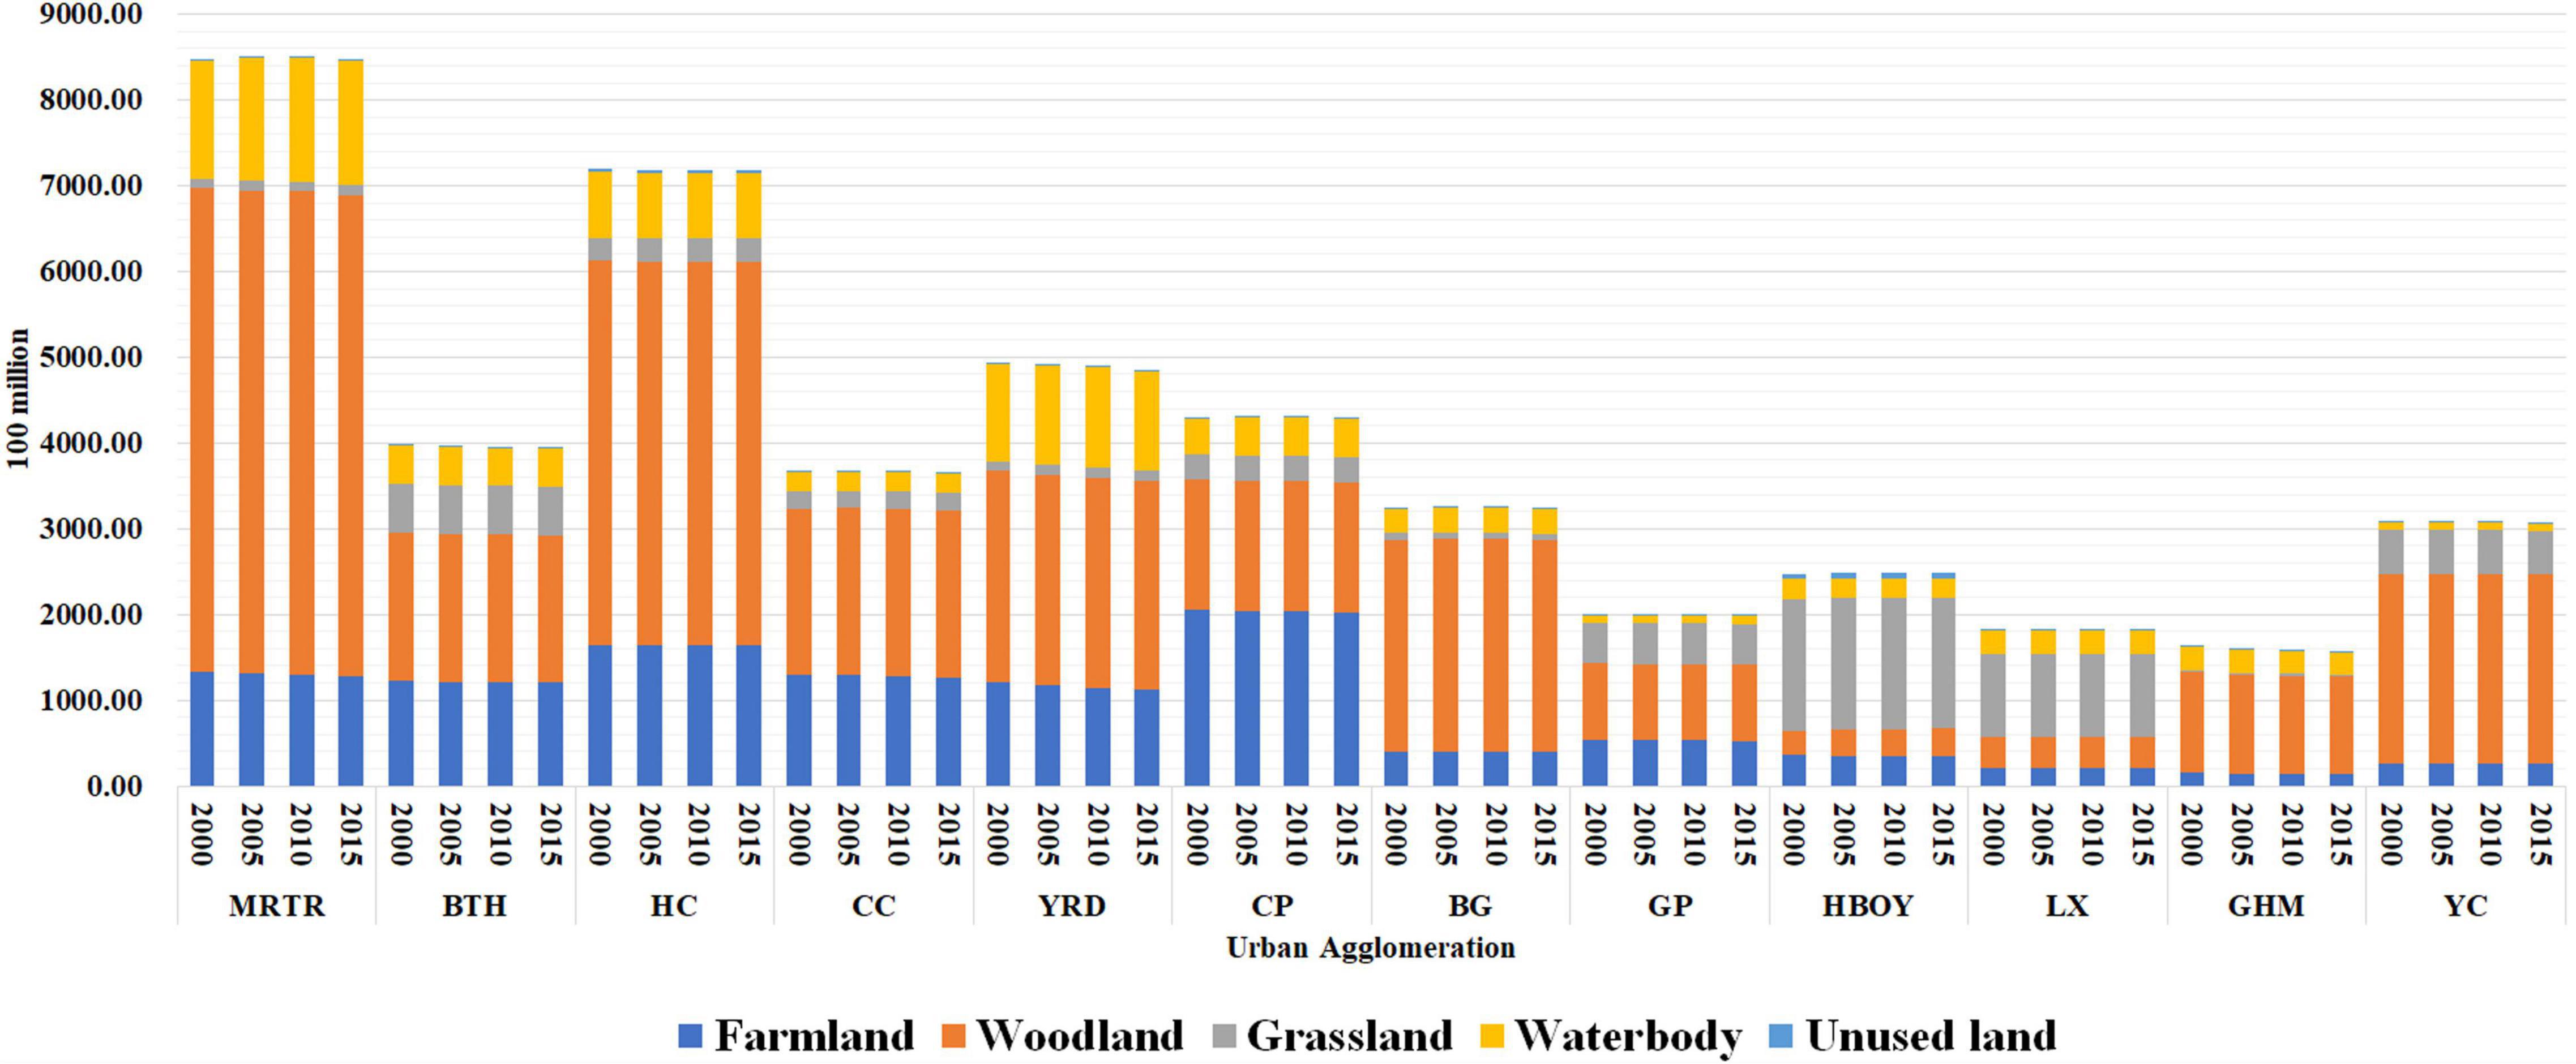
Figure 2. The trend of different ecosystem services in 12 urban agglomerations in China during 2000–2015.
With regard to the total value of ecosystem services, urban agglomerations with larger areas tend to have higher ecosystem service values. In most cases, the total value is highest in the MRTR, and the lowest value is in the GHM (see Figure 2).
With regard to the ratio of ecosystem services’ values, cropland, woodland, and grassland are the three dominant components of ecosystem services values, and their ratios vary in different urban agglomerations. The MRTR, HC, CC, YRD, BG, GHM, and YC urban agglomerations have woodland as the primary provider of their ecosystem services. The ratios of ecosystem services from woodland ranged from 49.60 to 76.95%. Ecosystem services in BTH and GP are also mainly provided by woodland ecosystems, and the ratios ranged from 43.36 to 44.99%. Cropland and grassland ecosystem services occupy approximately 14.34–30.77% of the total ecosystem services in these areas. Cropland ecosystems are the major providers of ecosystem services in the CP urban agglomeration, with ratios ranging from 46.96 to 47.87%. In HBOY and LX, the ecosystem service values were largely derived from grassland, with ratios ranging between 52.47 and 62.45%.
The total values of ecosystem services significantly decreased in all 12 urban agglomerations between 2000 and 2015. In addition to a small increase observed in HBOY, the total values of ecosystem services in the remaining urban agglomerations declined by values ranging from 0.02 to 4.27%.
A few urban agglomerations increased in ecosystem service value based on certain land-use types, while the majority of ecosystem service values from different land uses were reduced in most urban agglomerations. BTH experienced reductions in all types of ecosystem service values, among which the reduction rates ranged from 0.13 to 5.40%. The MRTR and CP urban agglomerations had increased ecosystem services related to waterbodies and decreased ecosystem services derived from other land-use types, with reduction rates ranging from 0.05 to 15.88%. HBOY raised the ecosystem service of forestland, and GHM had their ecosystem service of grassland increased, as the rest of the ecosystem services from other land uses were reduced with rates ranging from 0.29 to 13.19%. HC increased the ecosystem services from farmland and grassland, BG increased the ecosystem services derived from waterbodies and forestland, YC increased the ecosystem services from waterbodies and unused land, and the ecosystem services from the other land-use types in these areas declined by 0.03 to 6.30%. Ecosystem services derived from farmland and grassland in CC and LX and farmland and forestland in YRD decreased by 0.28 to 7.06%. In GP, the major reduction came from ecosystem services derived from farmland, with a reduction ratio of 2.89%.
Considering the widely ranging areas of different county units, we calculated the ecosystem service values per unit area to compare the different urban agglomerations (see Figures 3, 4).
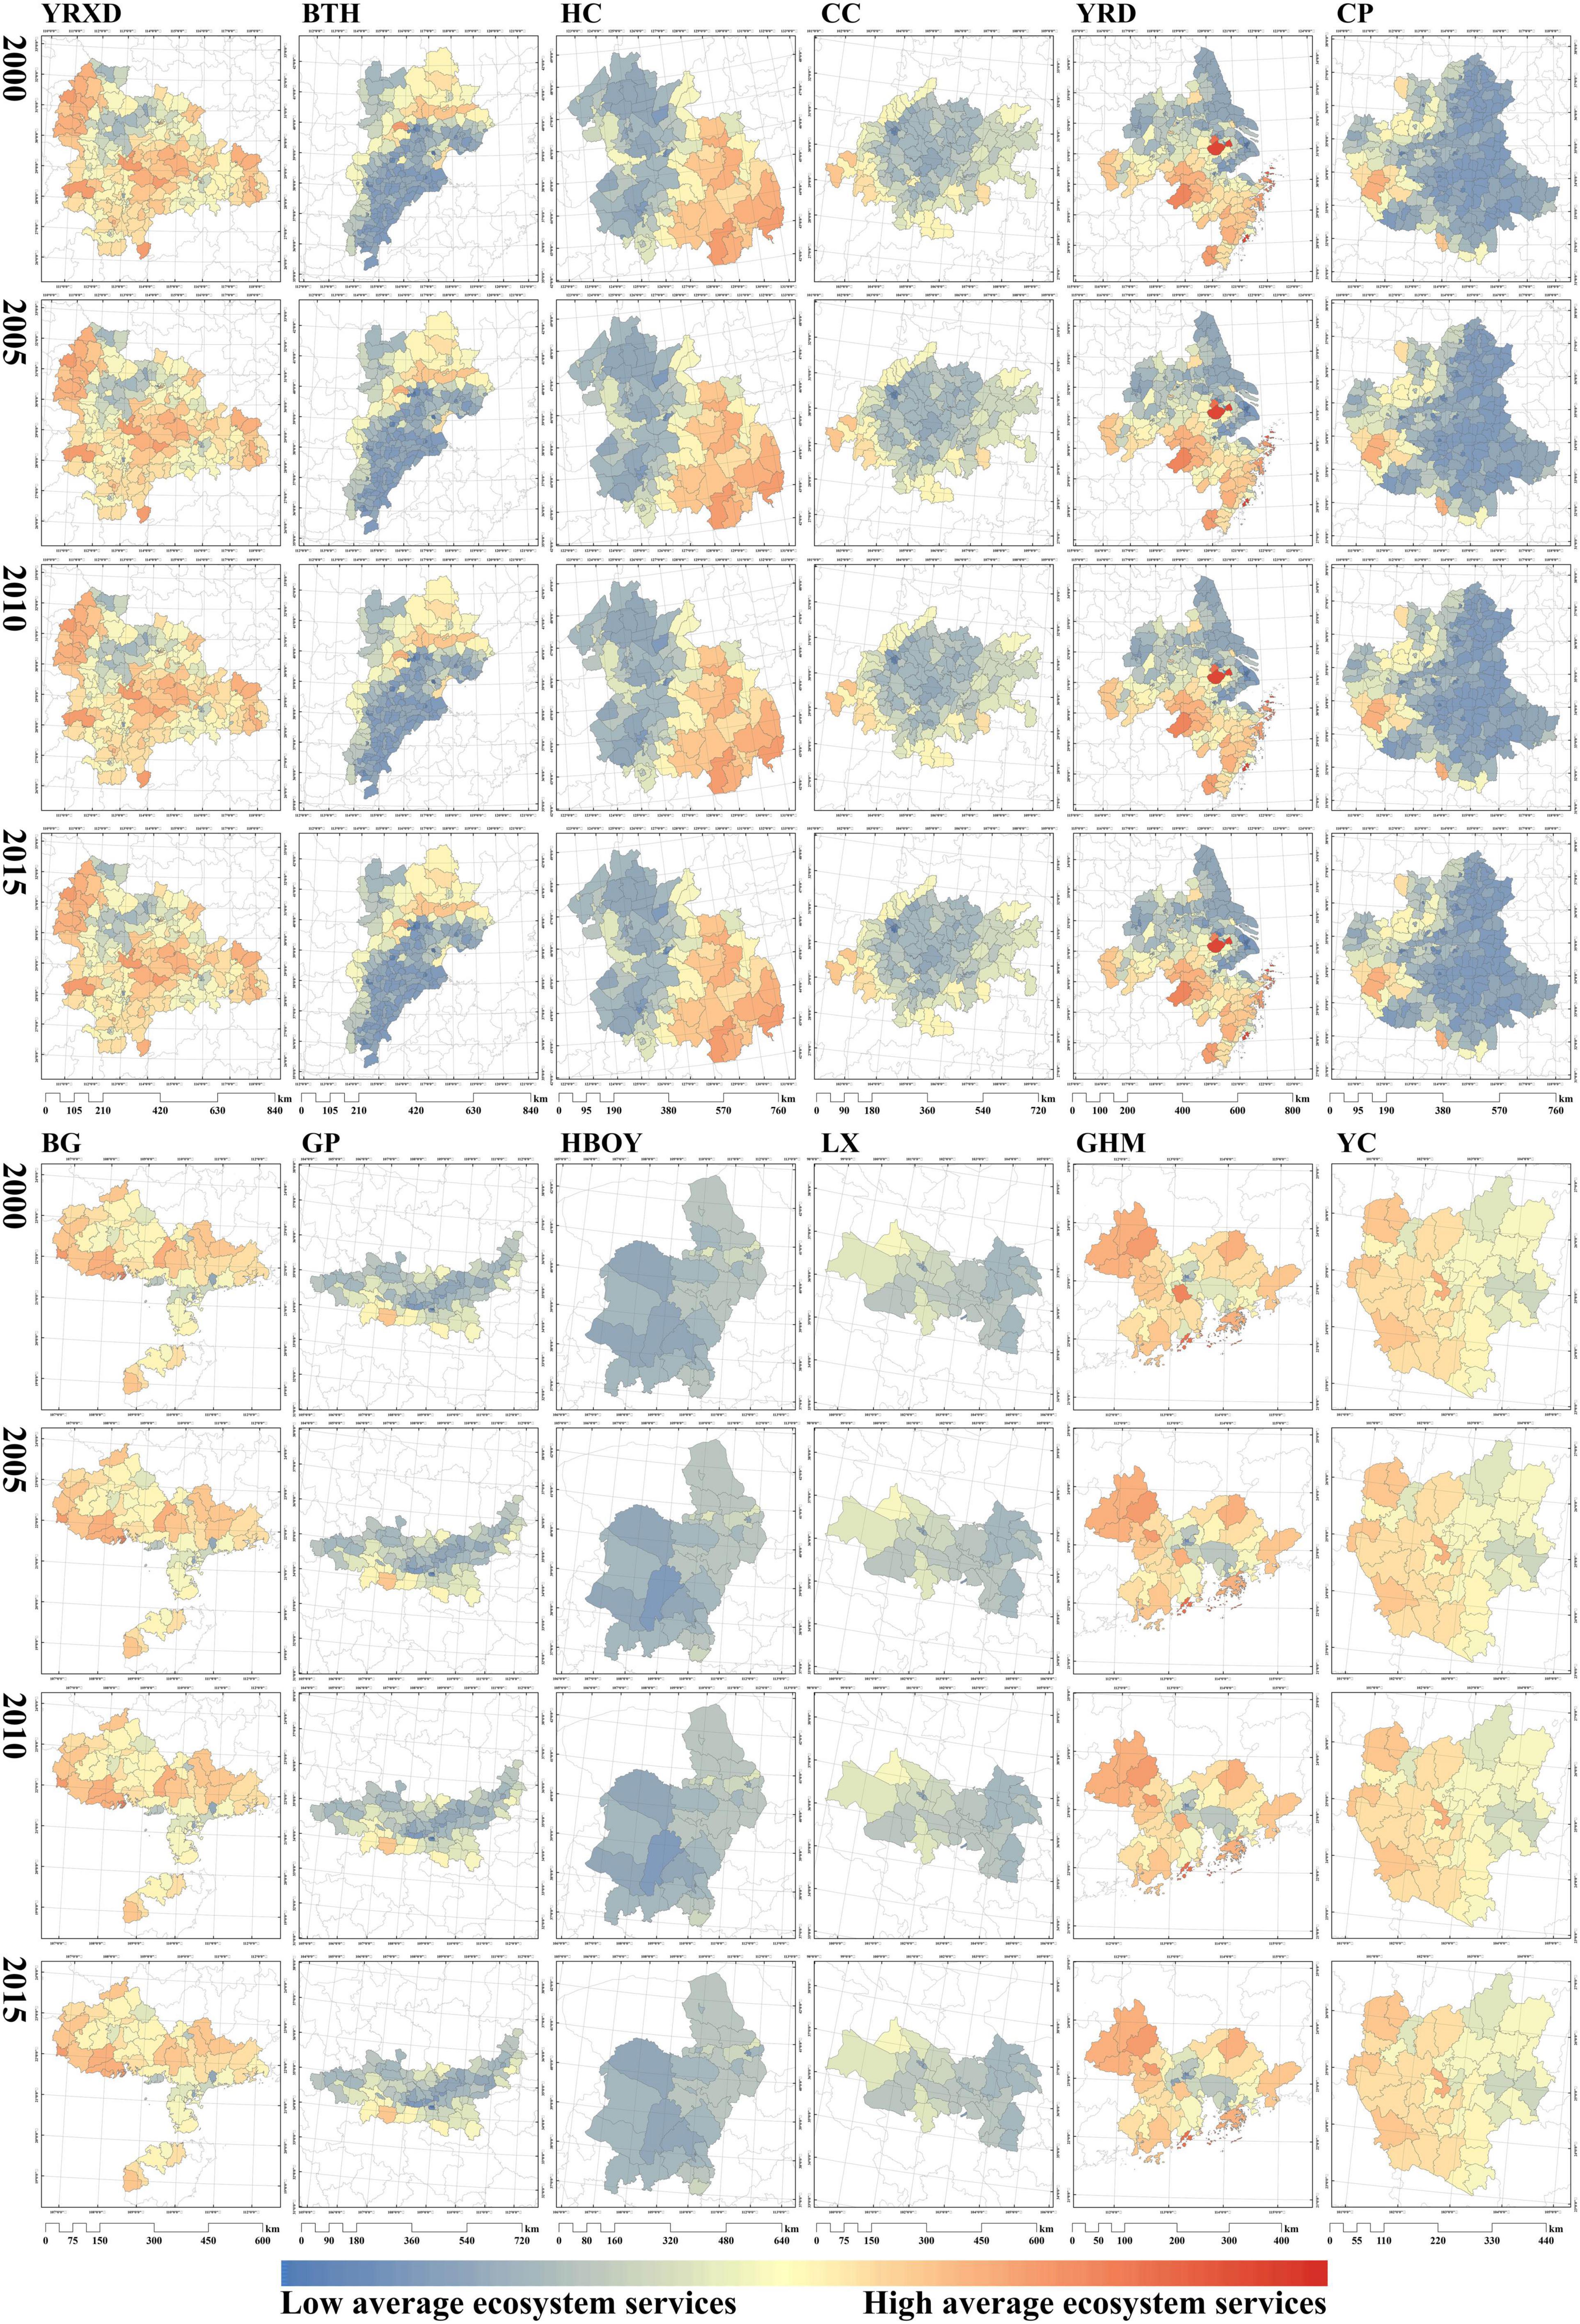
Figure 3. Evolution of ecosystem service value per unit area of cities, counties, and districts in China’s existing urban agglomerations from 2000 to 2015 (10,000 CNY/km2).
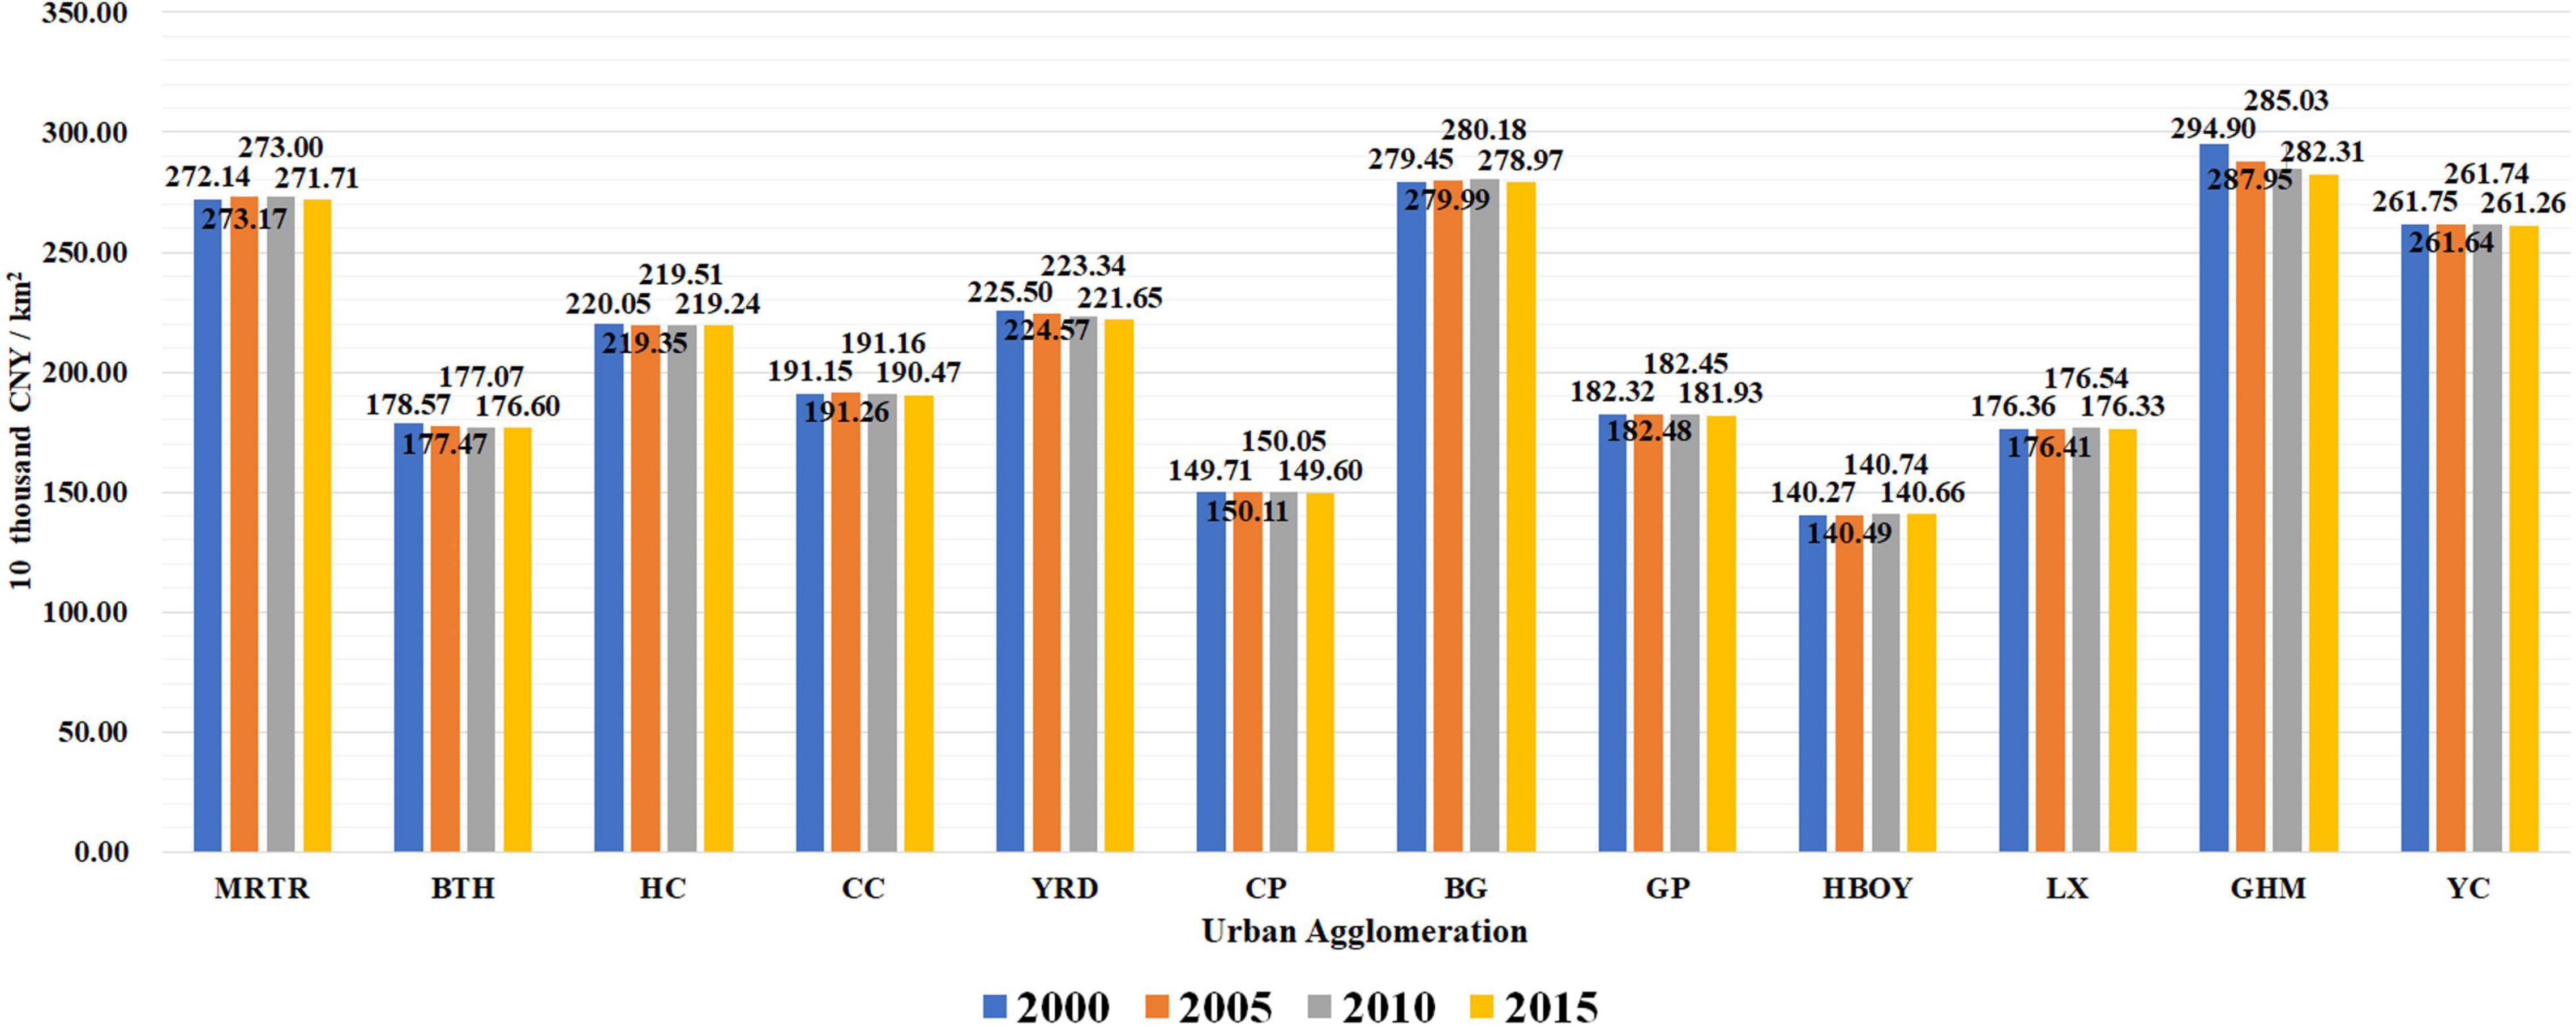
Figure 4. Changes in ecosystem service value per unit area in 12 urban agglomerations during 2000–2015 (10,000 CNY/km2).
Ecosystem service values per unit area ranged significantly, from the lowest 140.49 in HBOY (2005) to the highest 294.90 in GHM (2000).
Heterogeneous spatial patterns of ecosystem service values per unit area were identified across the 12 urban agglomerations. In the MRTR, BG, GHM, and YC, the values of ecosystem services were low in the central core and gradually increased with distance from the core area. The BTH, HC, YRD, and CP agglomerations also had a core city with low ecosystem service values intruding peripheral forestland and grassland where the values were high. The CC, GP, HBOY, and LX presented lower ecosystem service values in general, with only a few exceptions at the outskirts of cities within the urban agglomerations.
Apart from the heterogeneity of spatial patterns of ecosystem services values within individual urban agglomerations, the difference in ecosystem services in different urban agglomerations prevailed. Most urban agglomerations in the northeastern coastal area of China showed higher values than others. Interestingly, our results indicated that more developed urban agglomerations tended to have higher ecosystem service values. This result provides empirical evidence that urban development and the integrity of ecosystem services are not mutually exclusive.
As cities continue to expand their footprints, more than 70% of areas within each urban agglomeration reduced their ecosystem service values from 2000 to 2015, and the reduction ratio was continually increasing. Taking GHM as an example, the results in Figure 4 show that GHM has a significant decreasing trend of ecosystem services (294.90–282.31, -4.27%). According to the development status of GHM in Table 1, changes in built-up area, changes in forest area and special location seem to be related to the trend of decreasing ecosystem services. At the same time, according to the results of Figure 3, this decrease does not only occur around the core areas of urban agglomeration. So we assume that natural and social conditions might contribute to the heterogeneity of ecosystem services within urban agglomerations. The following contents try to identify such impacts.
Driving Factors on Ecosystem Services in Different Urban Agglomerations
Identifying Driving Factors
Although all 12 urban agglomerations experienced declines in ecosystem services to some extent, it is unknown what driving factors were responsible and how they affected such declines. Following previous studies (Liu et al., 2018; Gao and Wang, 2019; Lyu et al., 2019; Sun et al., 2019; Chen J. et al., 2020; Dai et al., 2020; Luo et al., 2020), we aim to adopt eight typical driving factors (see Table 5) related to the natural environment and social conditions that might potentially impact the decline in the ecosystem services of the case study urban agglomerations.
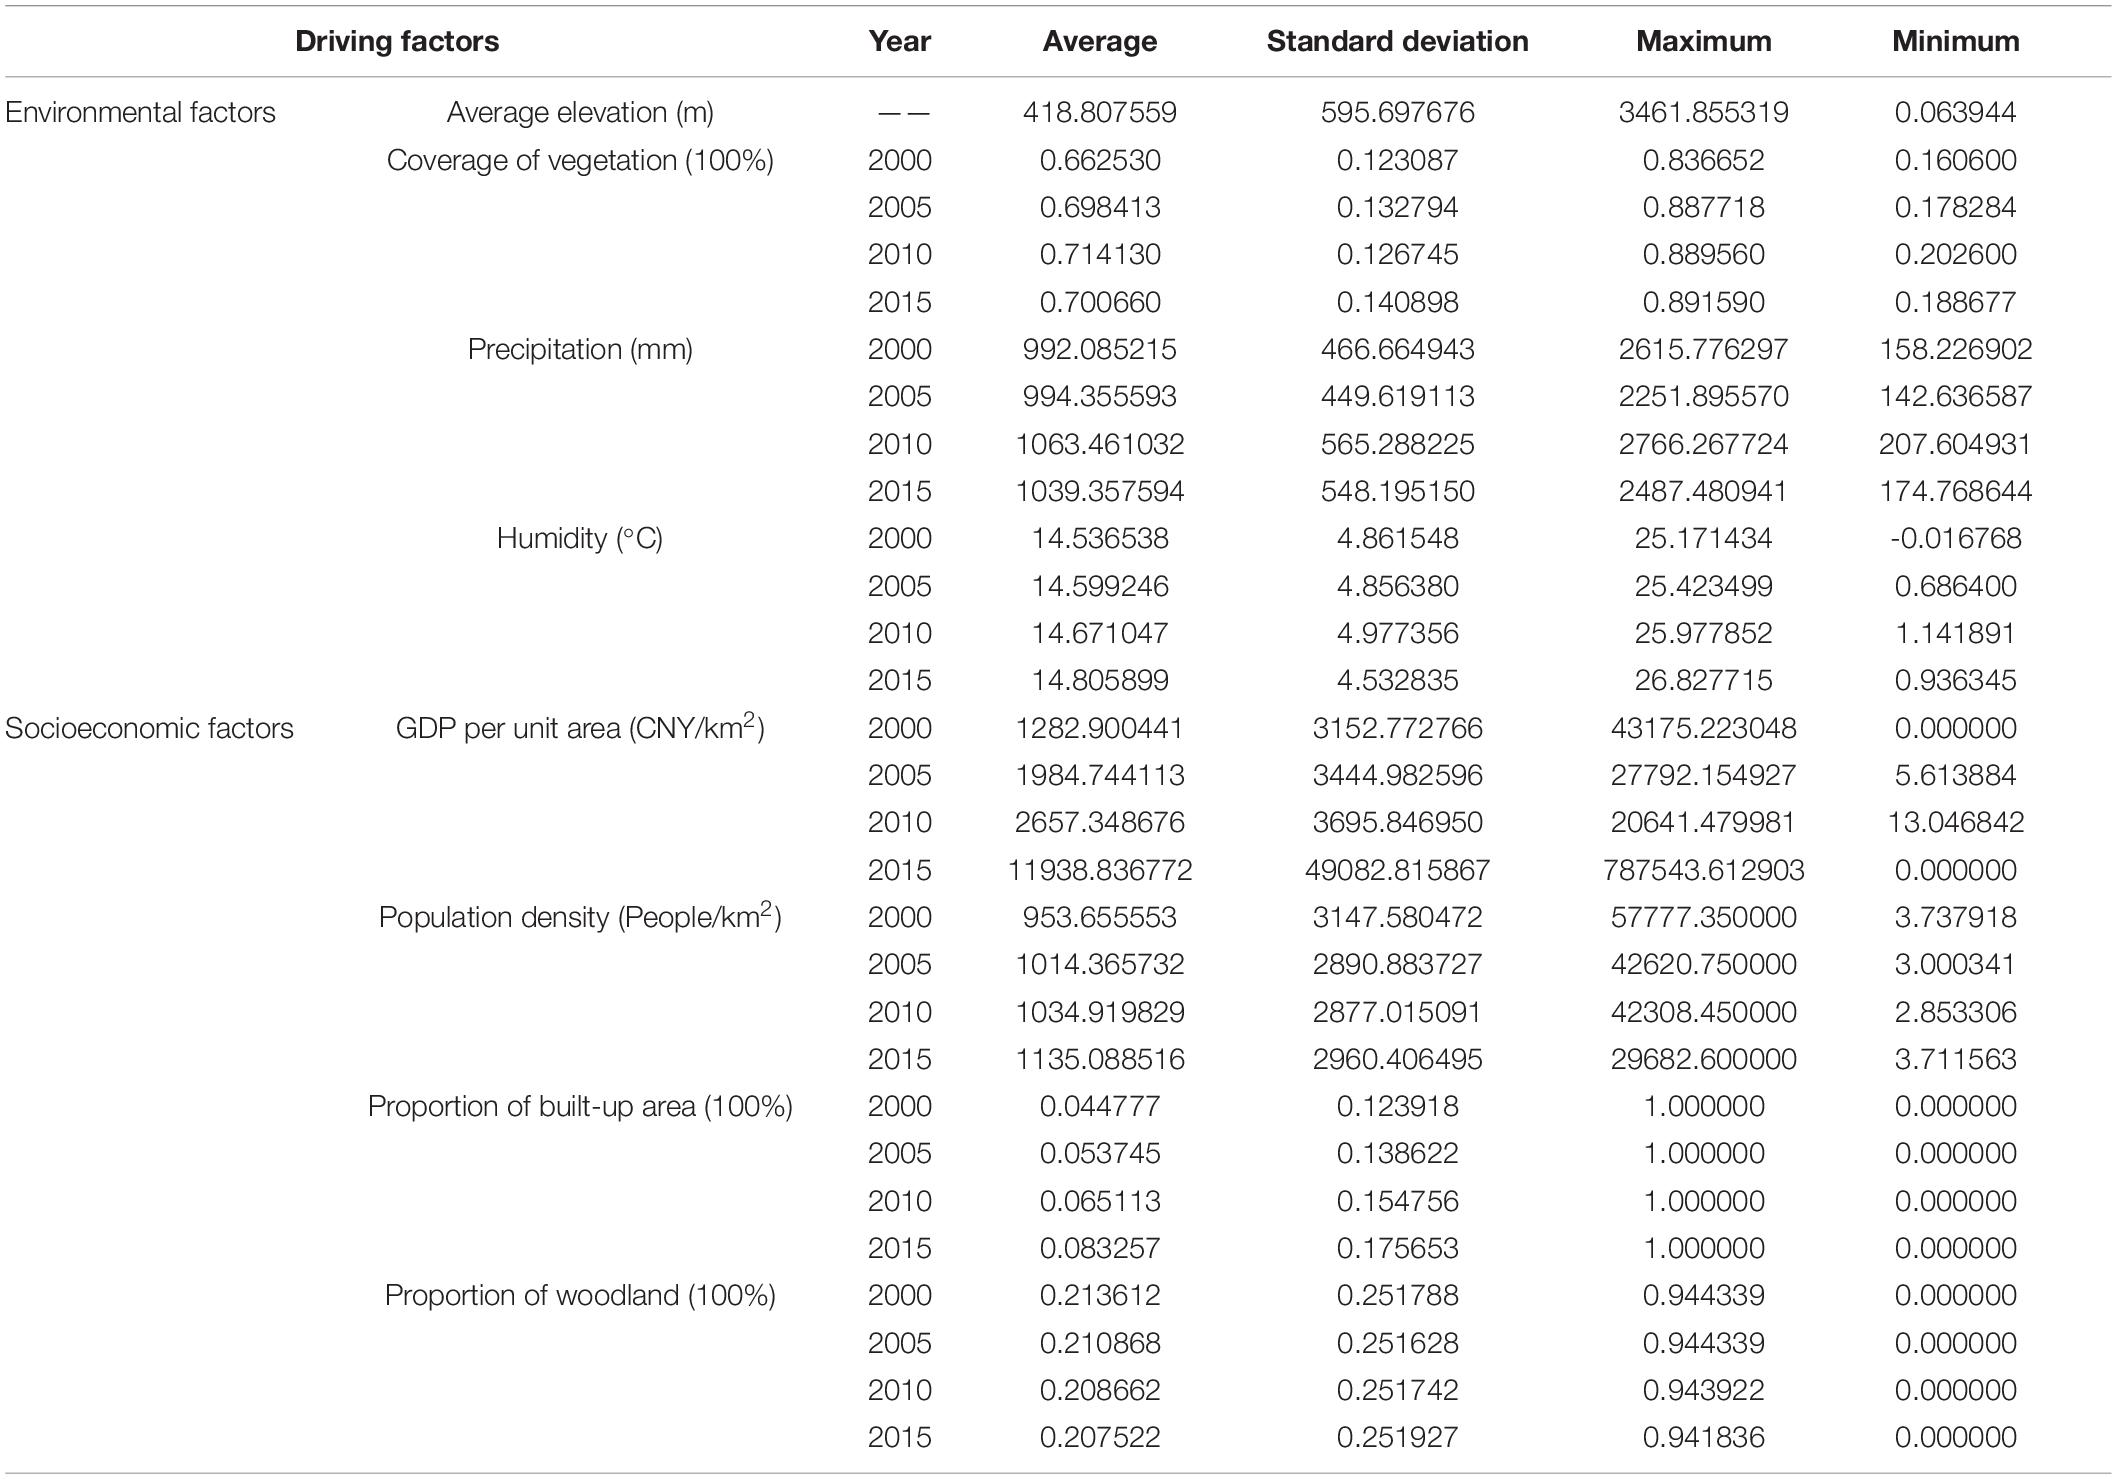
Table 5. Statistical analysis table of driving factors.
Table 6 presents the results of OLS and GWR. The OLS, as an aspatial model, returns only a global coefficient that cannot reflect spatial variances compared with GWR. The adjusted R2 in OLS ranged from 0.0197 to 0.5285, while the values of GWR ranged from 0.3275 to 0.7478. The adjusted R2 in each GWR model was higher than that in OLS. The AIC value in GWR was lower than that in OLS by more than 3%, suggesting that the GWR can provide better explanatory power for the driving factors.
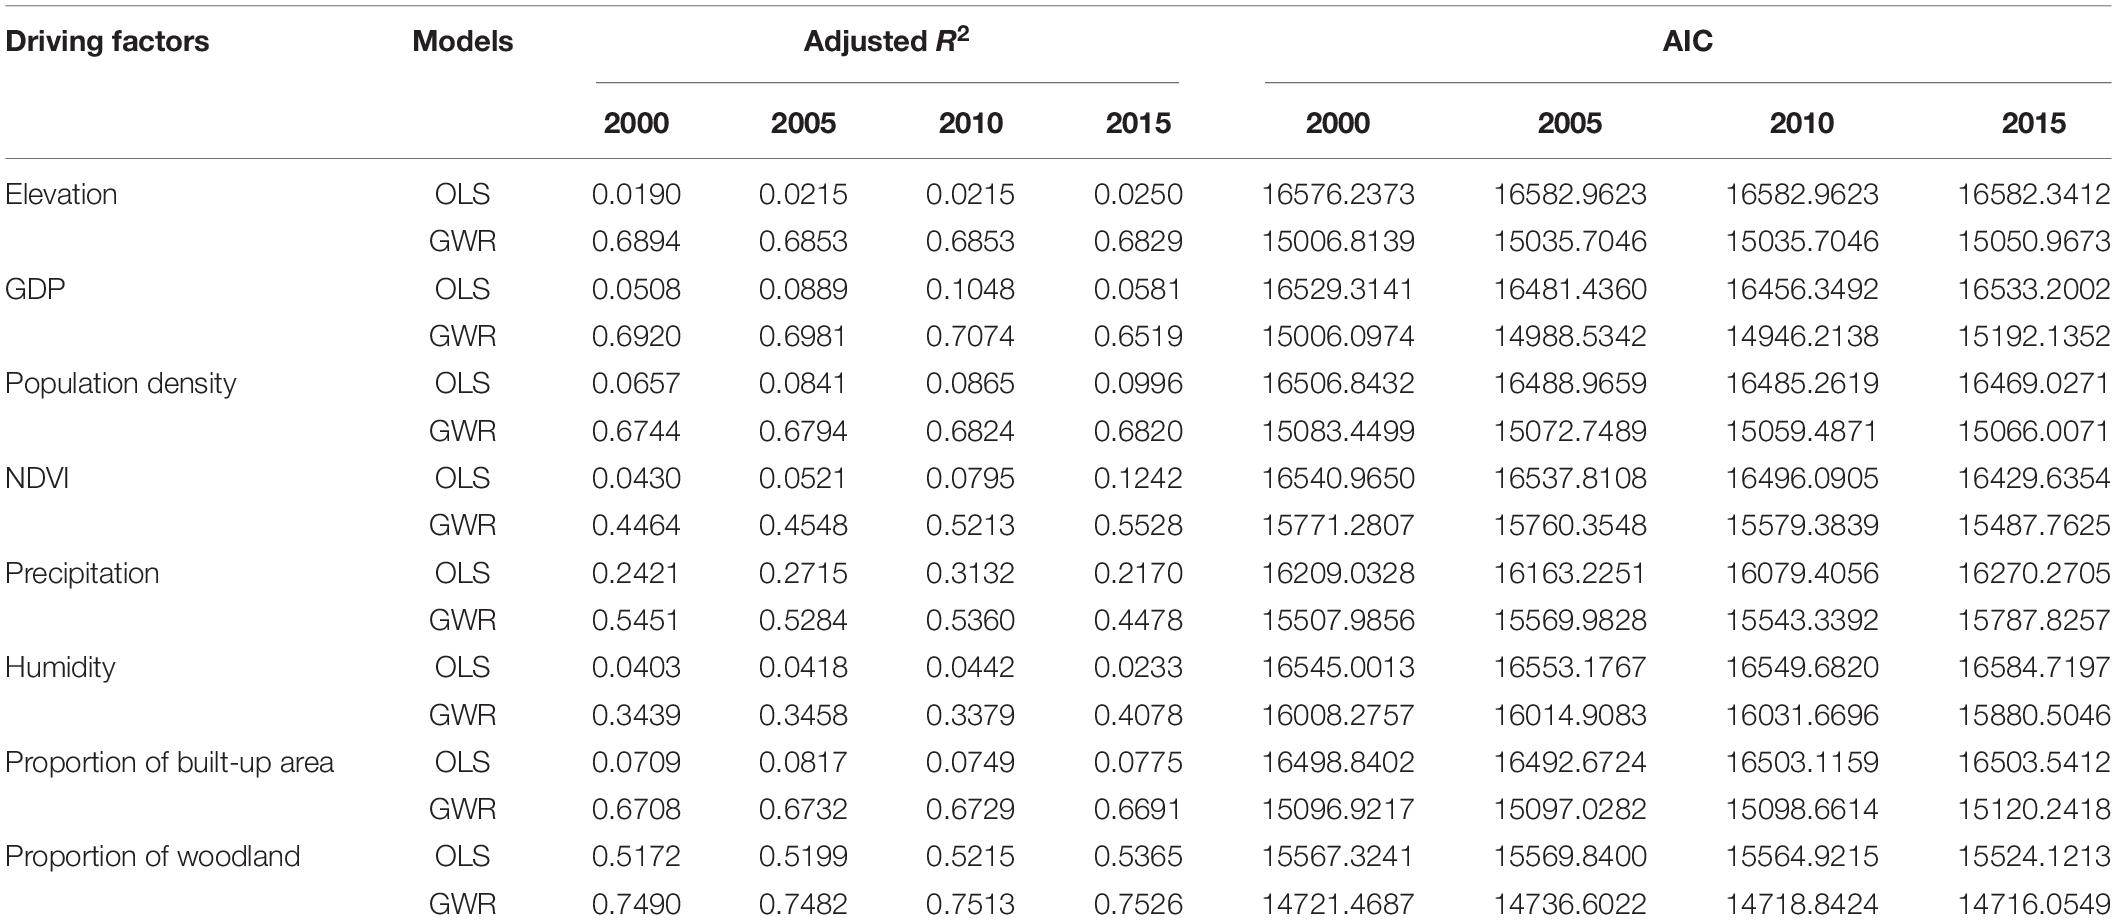
Table 6. Comparison between the geographically weighted regression (GWR) and ordinary least squares (OLS).
Measuring the Strength of Driving Factors
The normalized difference vegetation index (NDVI) and temperature factors had lower explanatory power (adjusted R2 < 0.5), indicating that their impacts on ecosystem service values were minimal; thus, they were excluded from our mapping visualization. To identify the strength of the six factors’ impacts on ecosystem service values, their regression coefficients were visualized into ten categories.
Figure 5 shows that elevation has positive impacts on ecosystem services except in the northeastern parts of HC, HBOY, and southern parts of YC. The impact gradually decreases from the central city to the periphery in each urban agglomeration. Coastal urban agglomerations such as the YRD, GHM, and BG tend to be more influenced by elevation than are hinterland agglomerations.
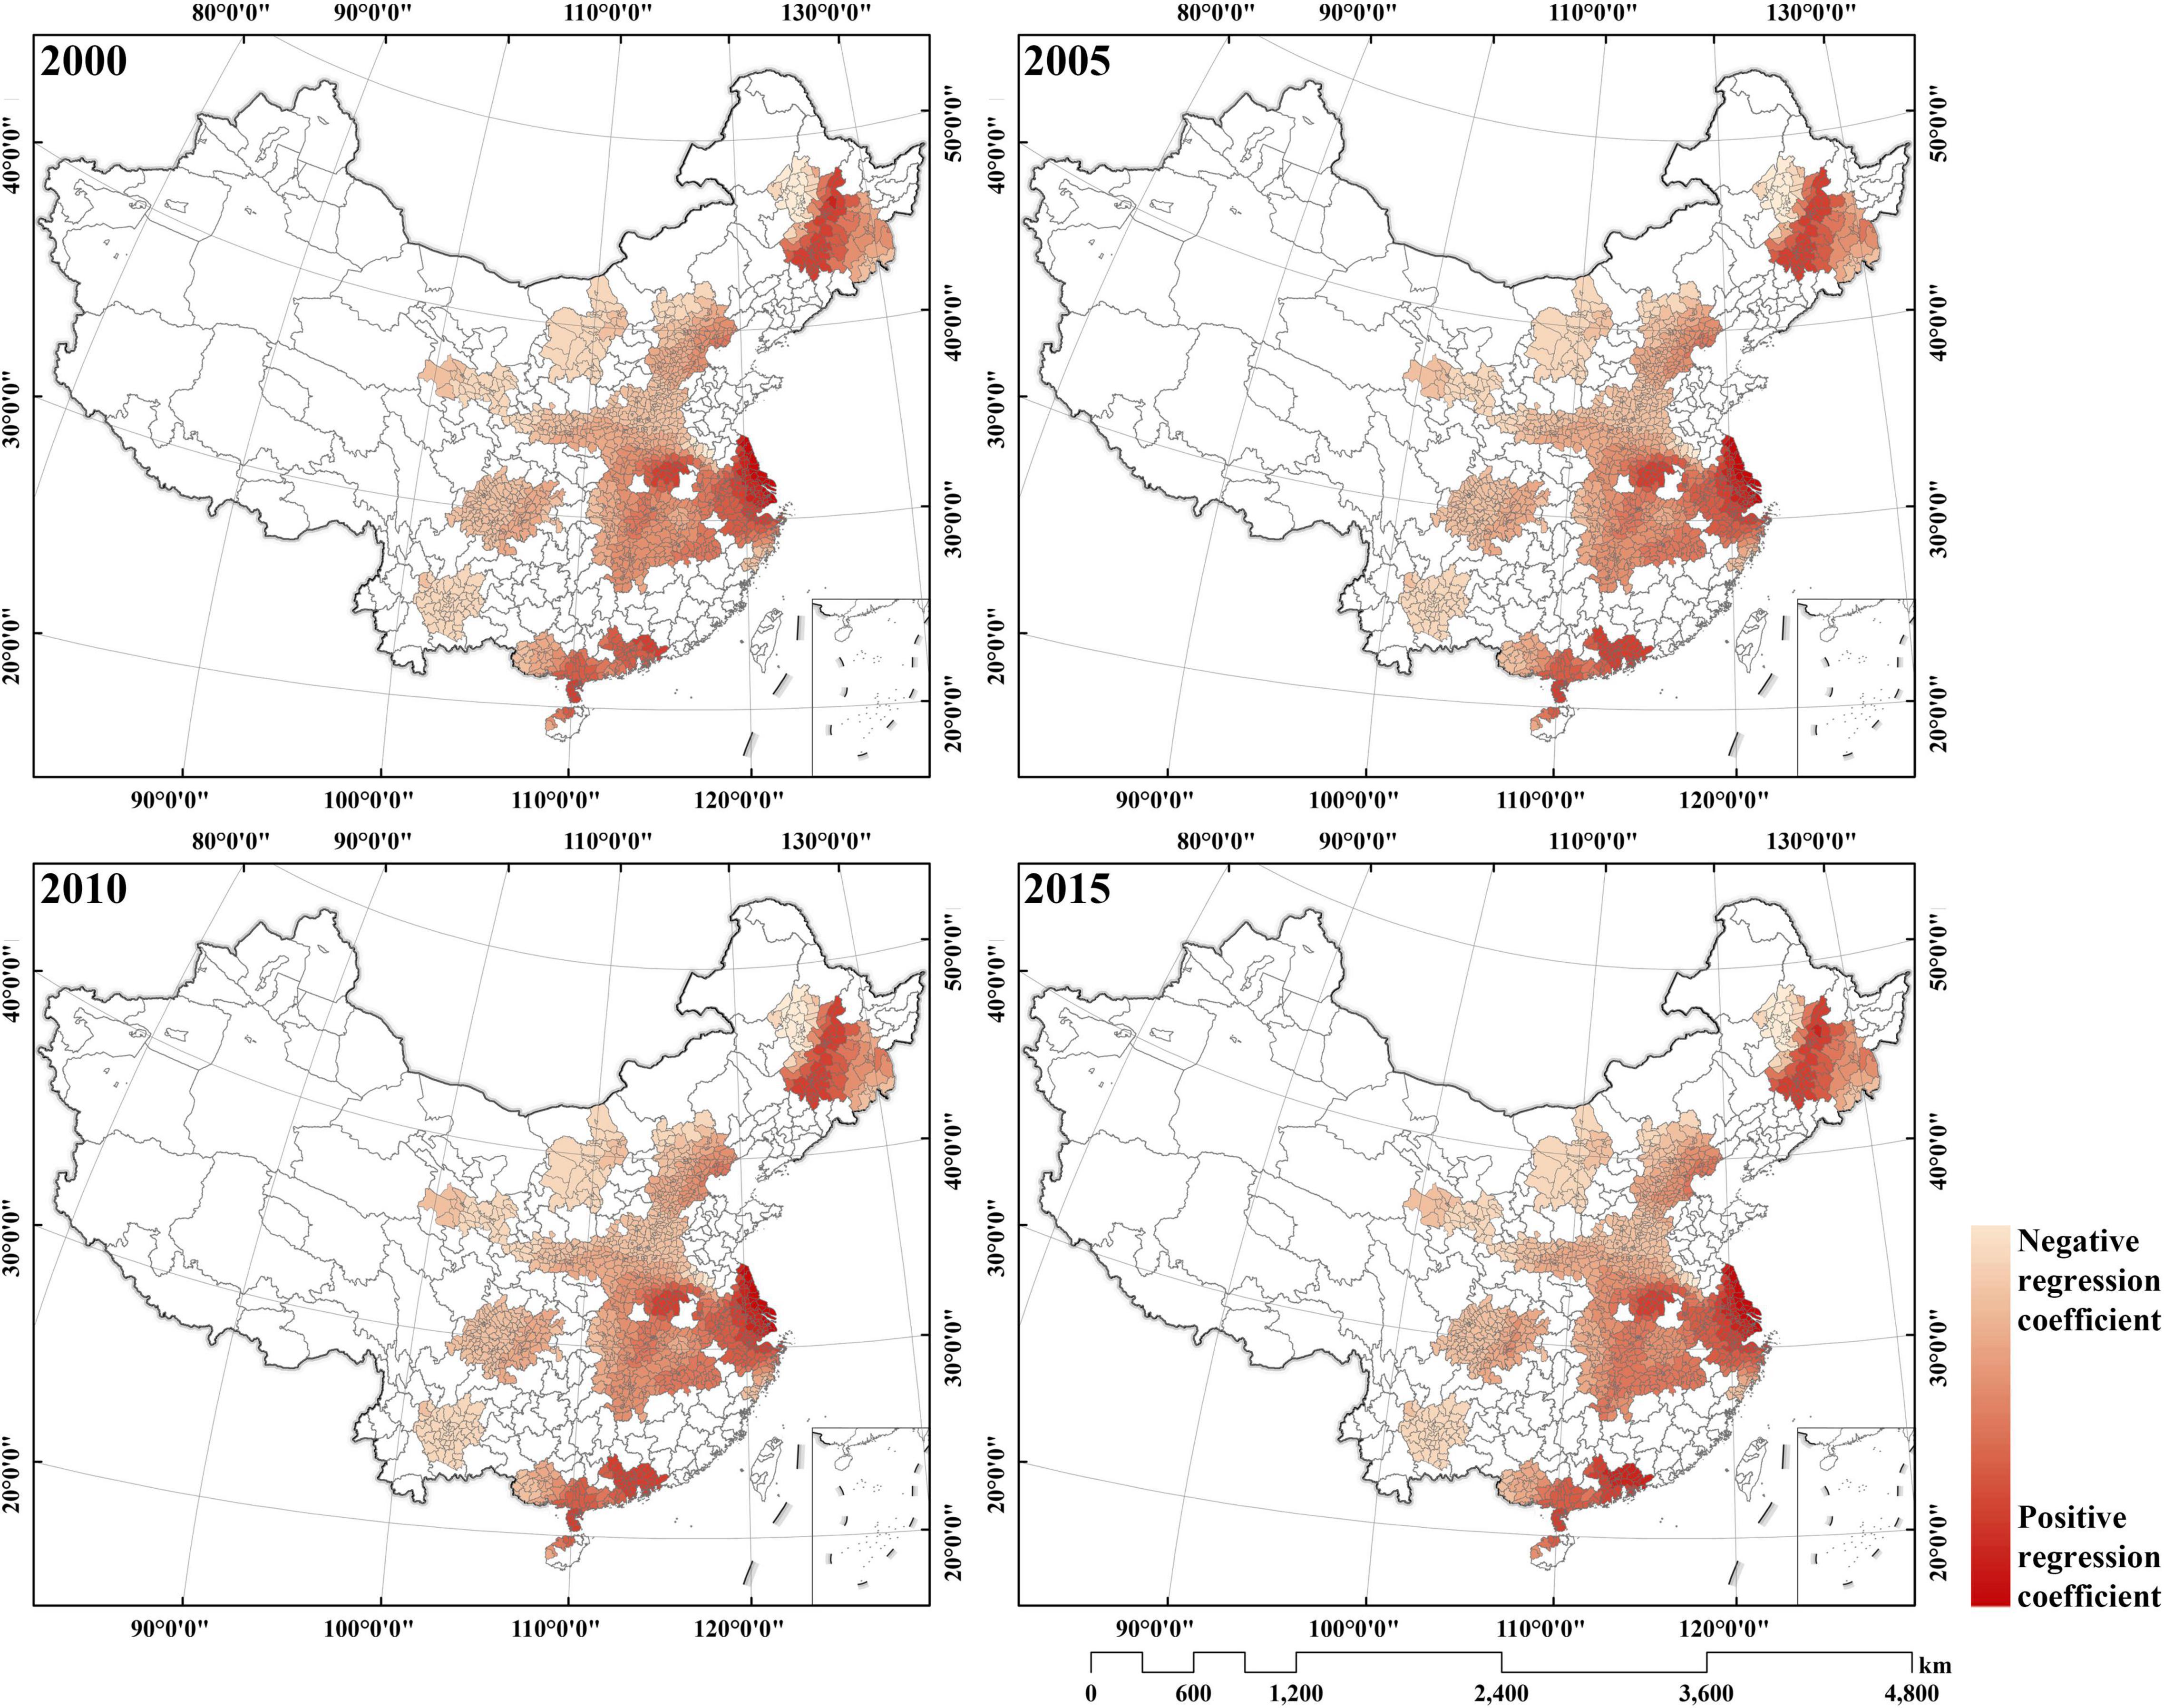
Figure 5. Spatial distributions of the DEM coefficients of GWR models in typical urban agglomerations in China.
The main reason for the different impacts of elevation on urban agglomeration is subject to the topography of China, where it is higher in the northwest than in the southwest. The HC, HBOY, and YC are affected by the Inner Mongolian Plateau, Loess Plateau, and Yunnan-Guizhou Plateau, respectively. The higher elevations often bring about negative impacts on ecosystem environments. For example, the HBOY has a low-west, high-east topography. As elevation rises, the climate type transitions from continental climate and monsoon climate of medium latitudes to plateau mountain climate, which has low temperature, less precipitation, and intense solar radiation, thus limiting the ecosystem (Wu et al., 2021). In the area where the monsoon climate is dominant, low elevation coastal regions, such as the YRD, GHM, and BG, a higher elevation often means there are more vegetated hilly areas than agricultural lands—the former present higher biodiversity and have more potential for ecosystem services (Bai et al., 2020). An example case is the YRD, where the flat plain area is largely built up, and the ecological protection area is constrained to shallow mountain areas that are hard to develop (Song et al., 2019).
Figure 6 maps how the GDP impacts the ecosystem service values in 12 urban agglomerations. As seen, in most areas (except HBOY and northwestern HC), the higher GDP leads to lower ecosystem service values. The strength of the impact gradually increases from the central city to the periphery in each urban agglomeration. The HBOY, LX, and parts of HC tend to be more influenced by GDP.
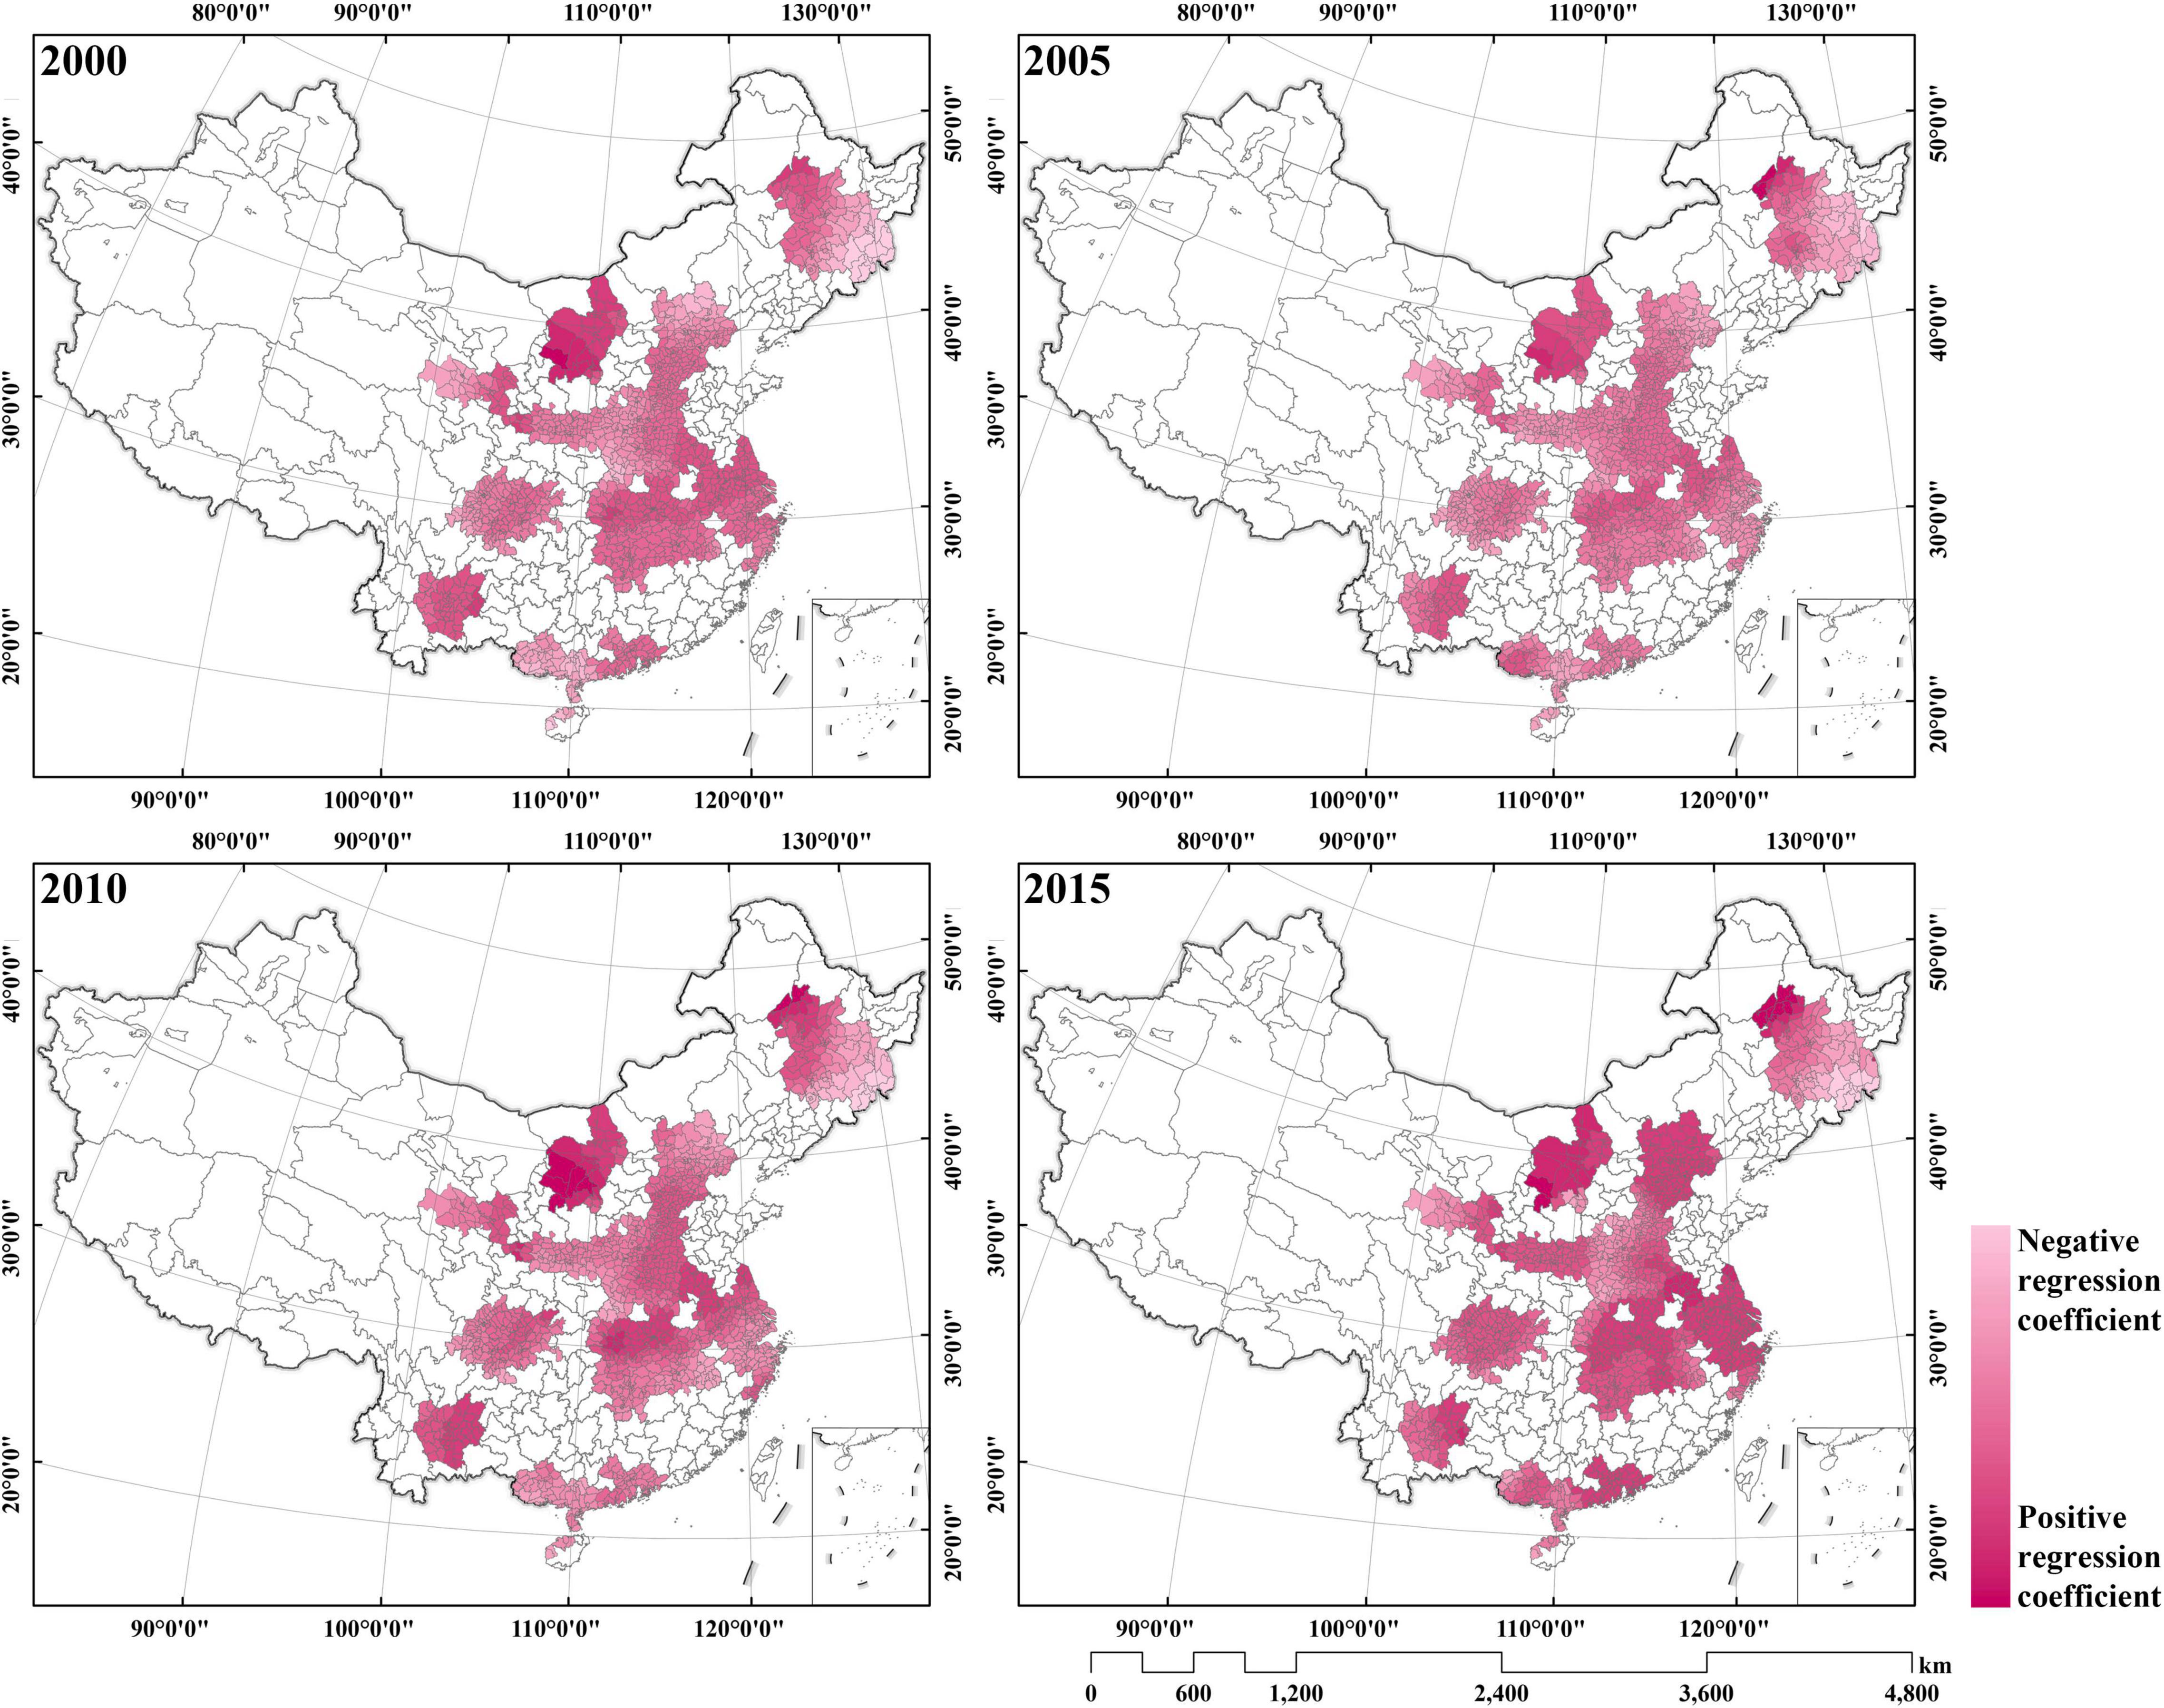
Figure 6. Spatial distributions of the GDP coefficients of GWR models in typical urban agglomerations in China.
The industrial structure of an urban agglomeration might be attributable to the heterogeneous impacts of GDP. The YRD, BTH, and MRTR were established earlier than the others, and their GDP is gradually derived from the less-polluted tier-three industry with high technology and service industry rather than from tier two, i.e., the manufacturing industry. The former is known to be less threatening to the environment. For example, the structure of GDP in BTH relies more on high-tech and service industries than on manufacturing industries; the former demands less land space and poses less stress on the environment (Li et al., 2015). In contrast, in hinterland China, urban agglomerations such as LX were transferred from tier one industry to tier two industry. Their GDP relies more on manufacturing and mining industries and subsequently increases the burdens on ecosystems through excessive mining activity and heavy pollution (An et al., 2008; Ma et al., 2019). In addition, pollution-generating, tier two industries are often located at the outskirt of an urban agglomeration, and thus, the ecosystem service values in peripheral areas are more reduced than those in the central city.
In Figure 7, the population factor negatively impacts the ecosystem service values in the 12 urban agglomerations except in HBOY. The strength of the impact gradually declines from the central city to the periphery in each urban agglomeration. Regarding the spatial heterogeneity across the country, the GHM, HC, and BG are more negatively impacted by population than the others, while the HBOY is positively impacted more than the other agglomerations.
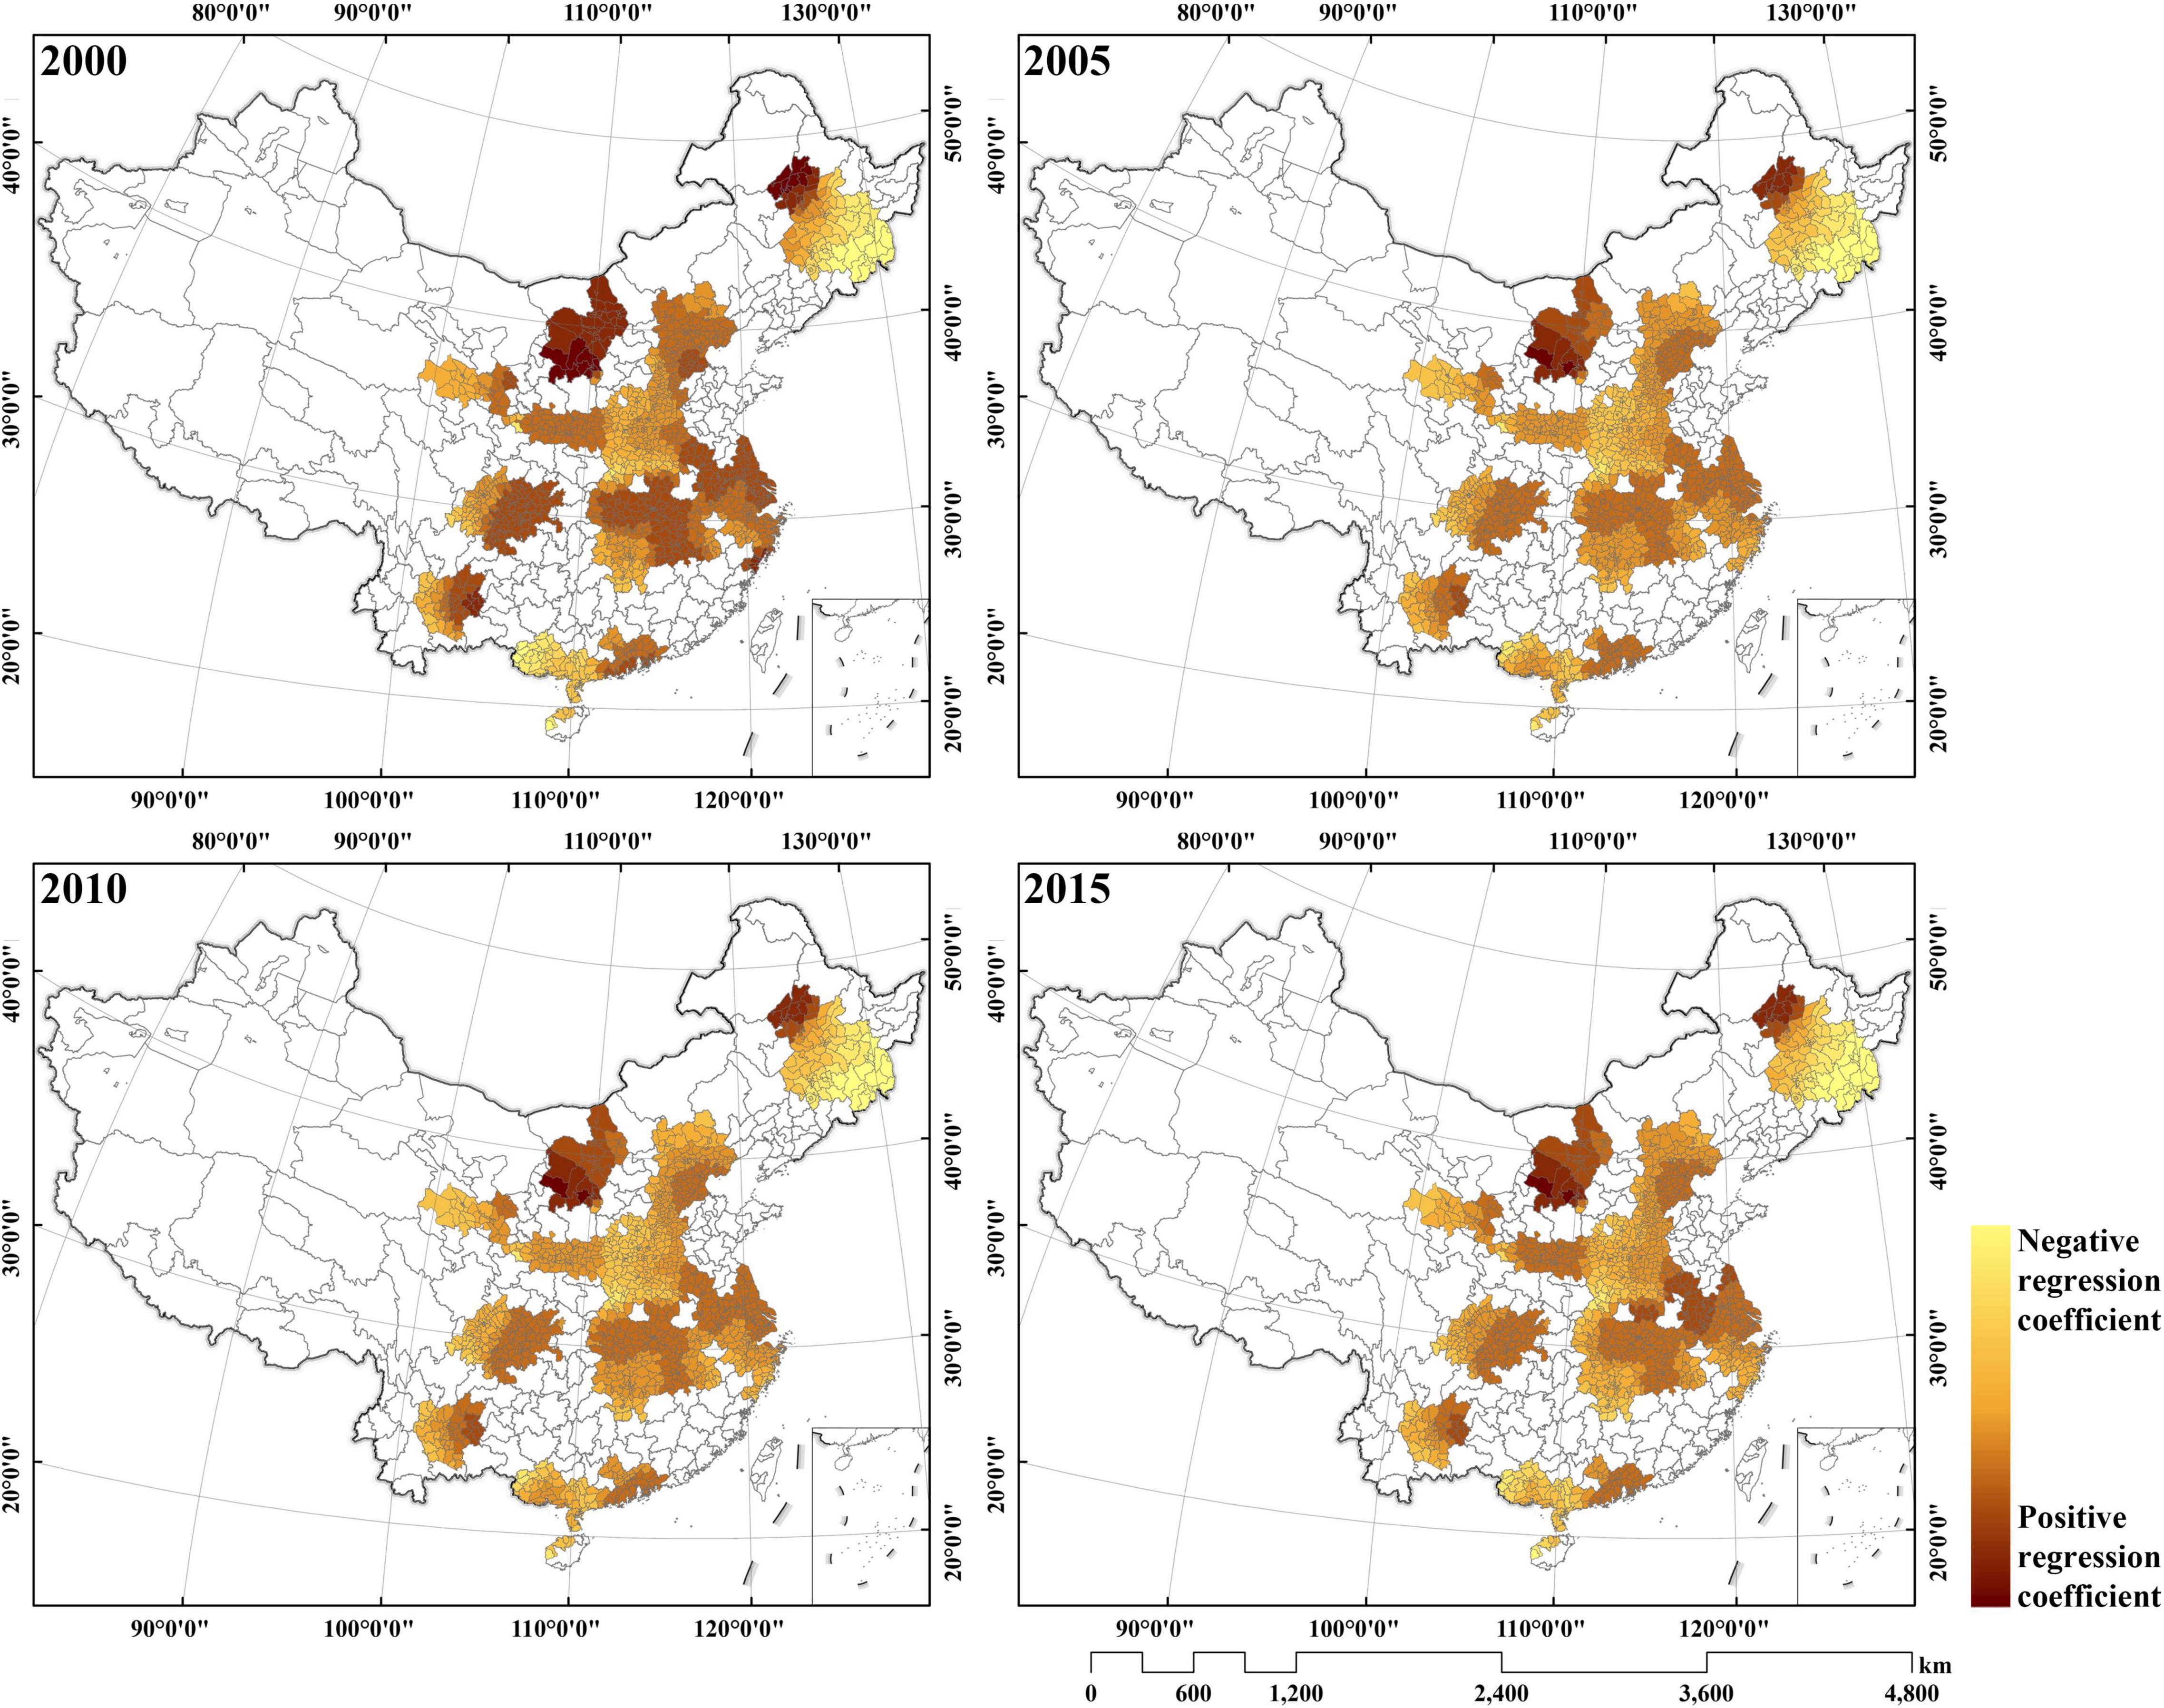
Figure 7. Spatial distributions of the population coefficients of GWR models in typical urban agglomerations in China.
Higher population density is related to a higher level of human activity, such as agricultural production, industrial construction, and recreational activities, which negatively impacts ecosystem services. An example case is the GHM. It has multiple high-density clusters, such as Guangzhou, Shenzhen, Hong Kong, and Macau, where the environmental pollution caused by household garbage and the service industry has a very serious impact on the ecosystem service values of the peripheral areas of the core-level cities (Bi et al., 2020). Within each urban agglomeration, a higher population density also yields negative impacts on the ecosystem service values. For example, the high-density urban core and low-density mountainous areas in the periphery have distinct differences in ecosystem services in the BTH (Xie et al., 2017), where the former has a low ecosystem services value, and the latter has higher values.
As shown in Figure 8, precipitation can positively affect ecosystem services except in the YC, BTH, HBOY, and GHM. The strength of the impact gradually increases from the central city to the periphery in each urban agglomeration. Across the nation, northern and southwestern agglomerations (e.g., HC and CC are statistically significant) showed a positive association, while the central agglomerations (e.g., YC is statistically significant) showed a negative sign.
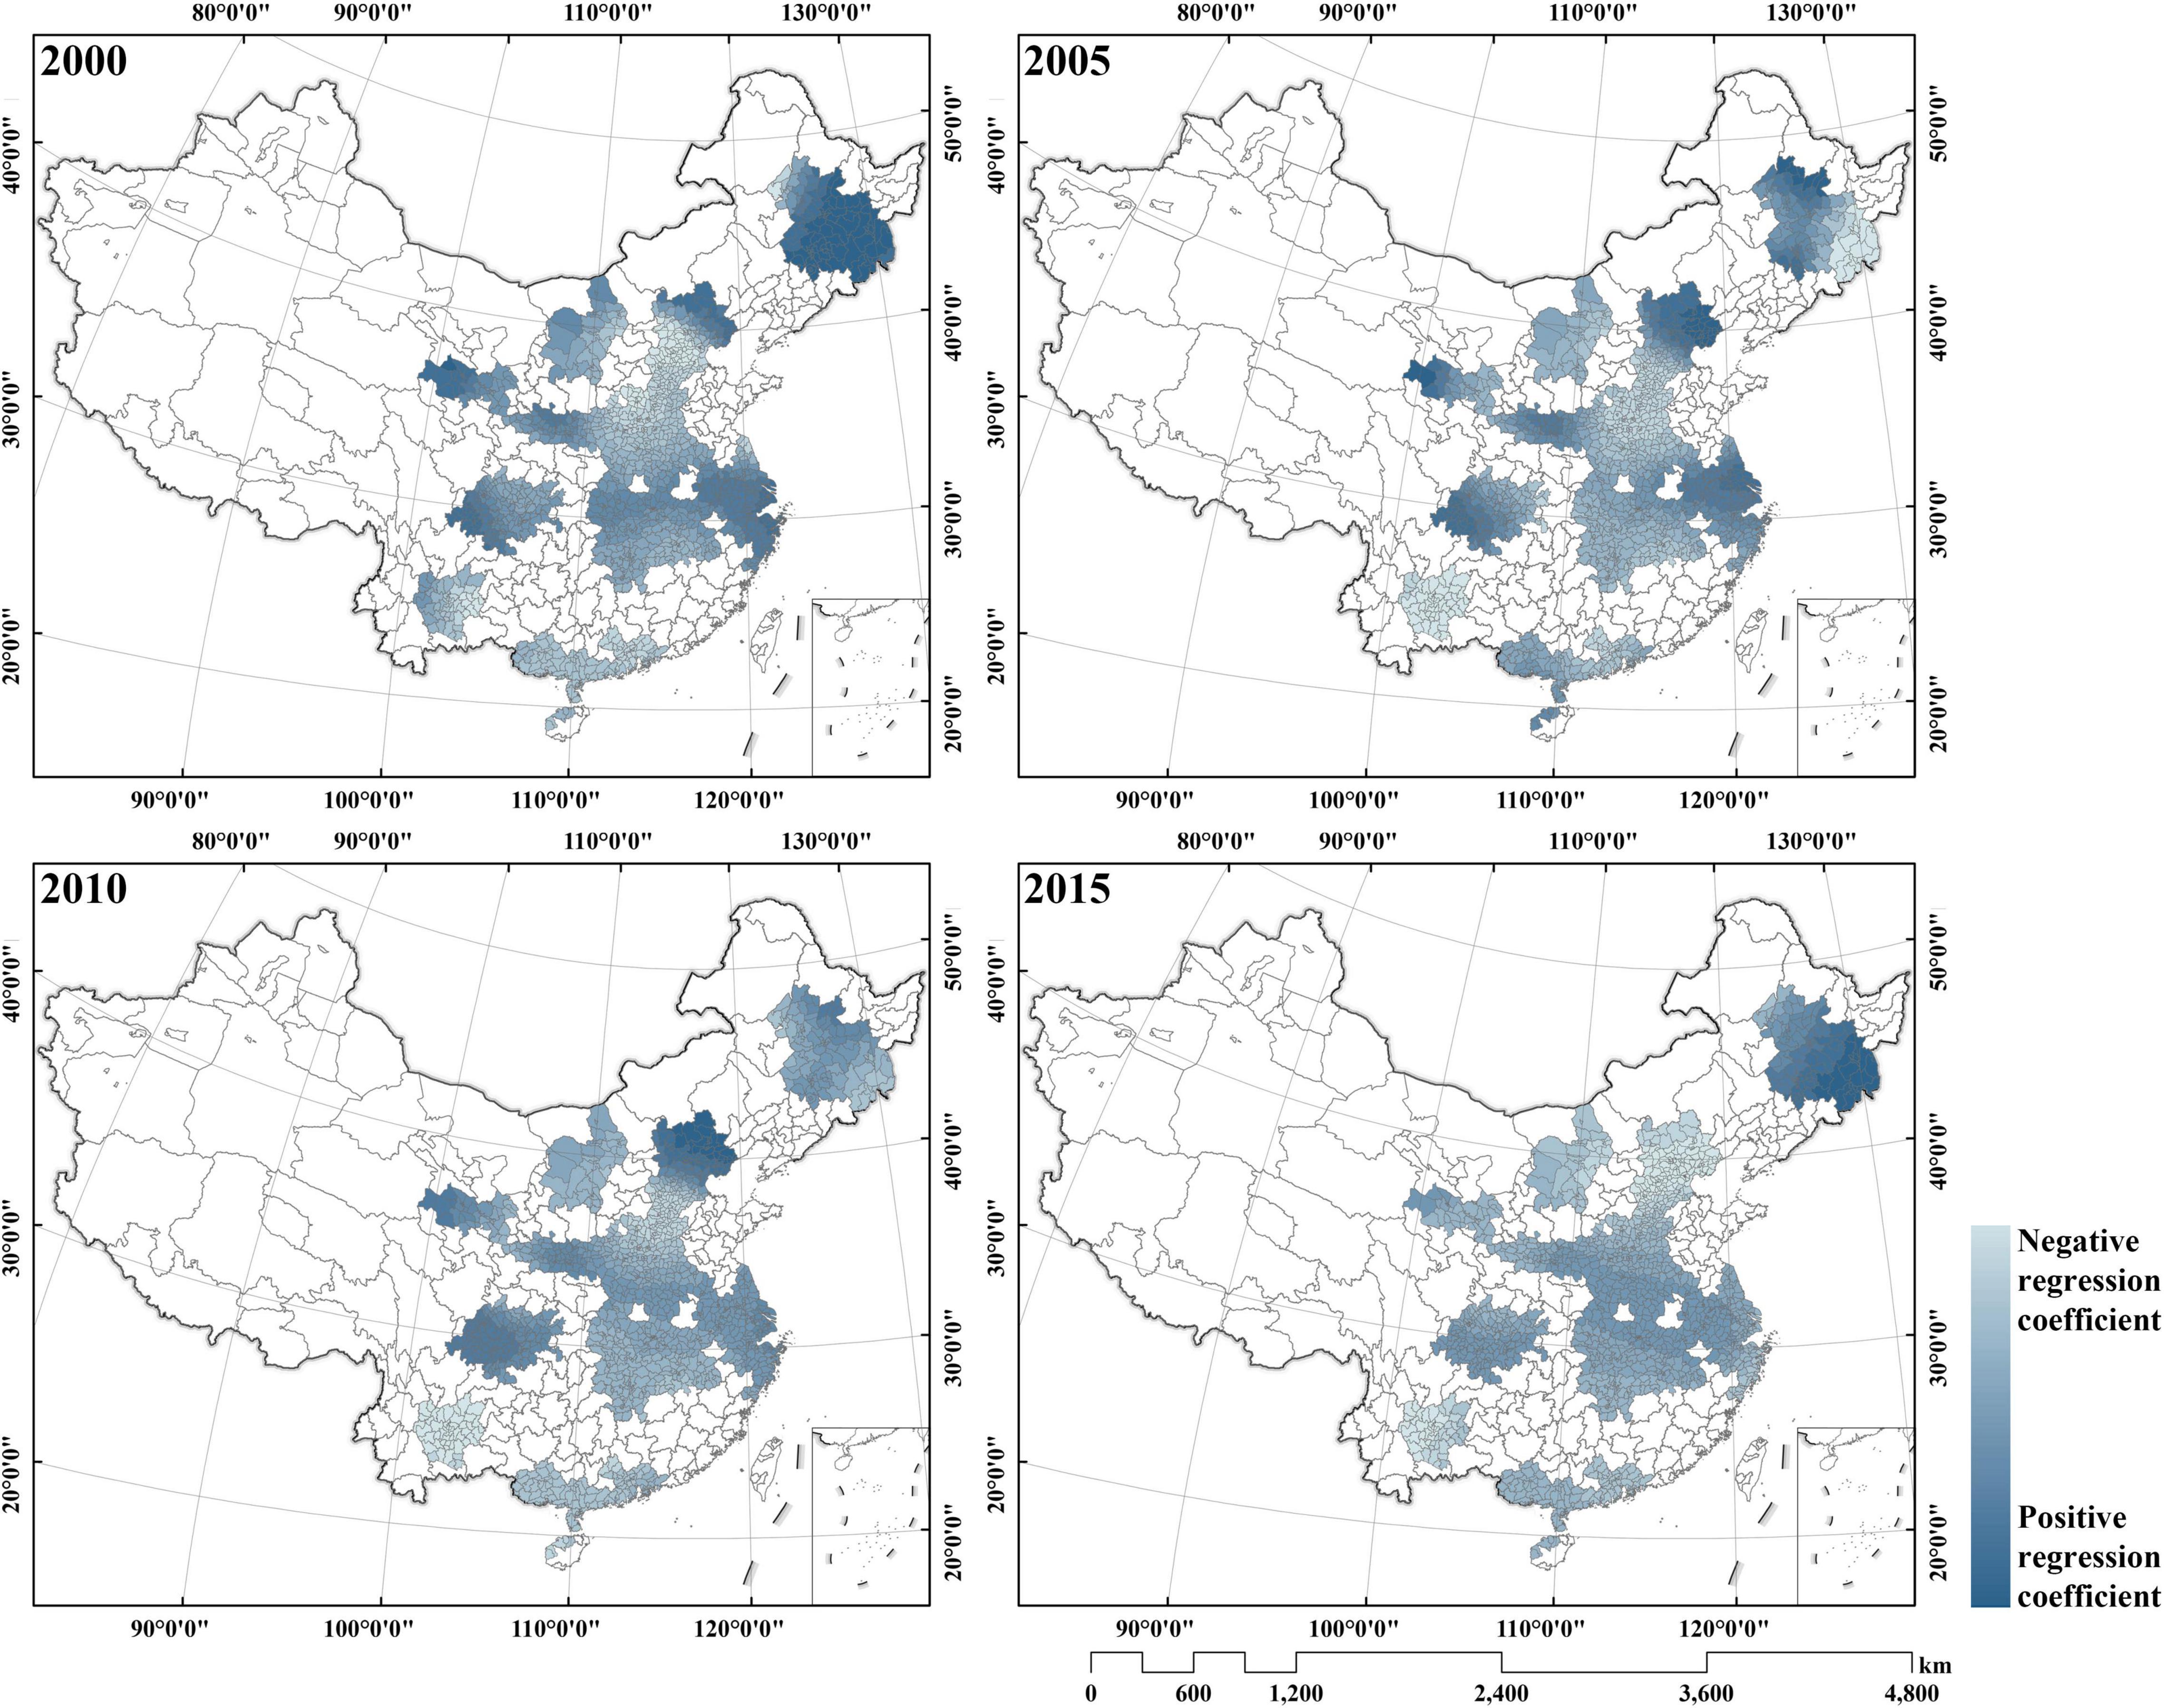
Figure 8. Spatial distributions of the Rain coefficients of the GWR models in typical urban agglomerations in China.
The nationwide heterogeneous impacts of precipitation on ecosystem services are because the central urban agglomerations are located in warm temperate deciduous broad-leaved forest or subtropical evergreen broad-leaved forest zones with higher biodiversity, and the basin terrain contains more water, which subsequently contributes to higher ecosystem service values. However, subject to precipitation intensity and geographical conditions, other urban agglomerations with higher annual precipitation might cause flooding issues (Lan et al., 2004). For example, the YC often suffers from concentrated precipitation in a short period of time and leads to frequent flood disasters, which further increase the chances of ecological disasters such as landslides that damage overall ecosystem service values.
In Figure 9, the ratio of constructed land use can negatively impact ecosystem services with a few exceptions in the western areas of HBOY. The strength of the impact gradually increases from the central city to the periphery in each urban agglomeration. There is little regional disparity regarding the impacts of construction land use across the country.
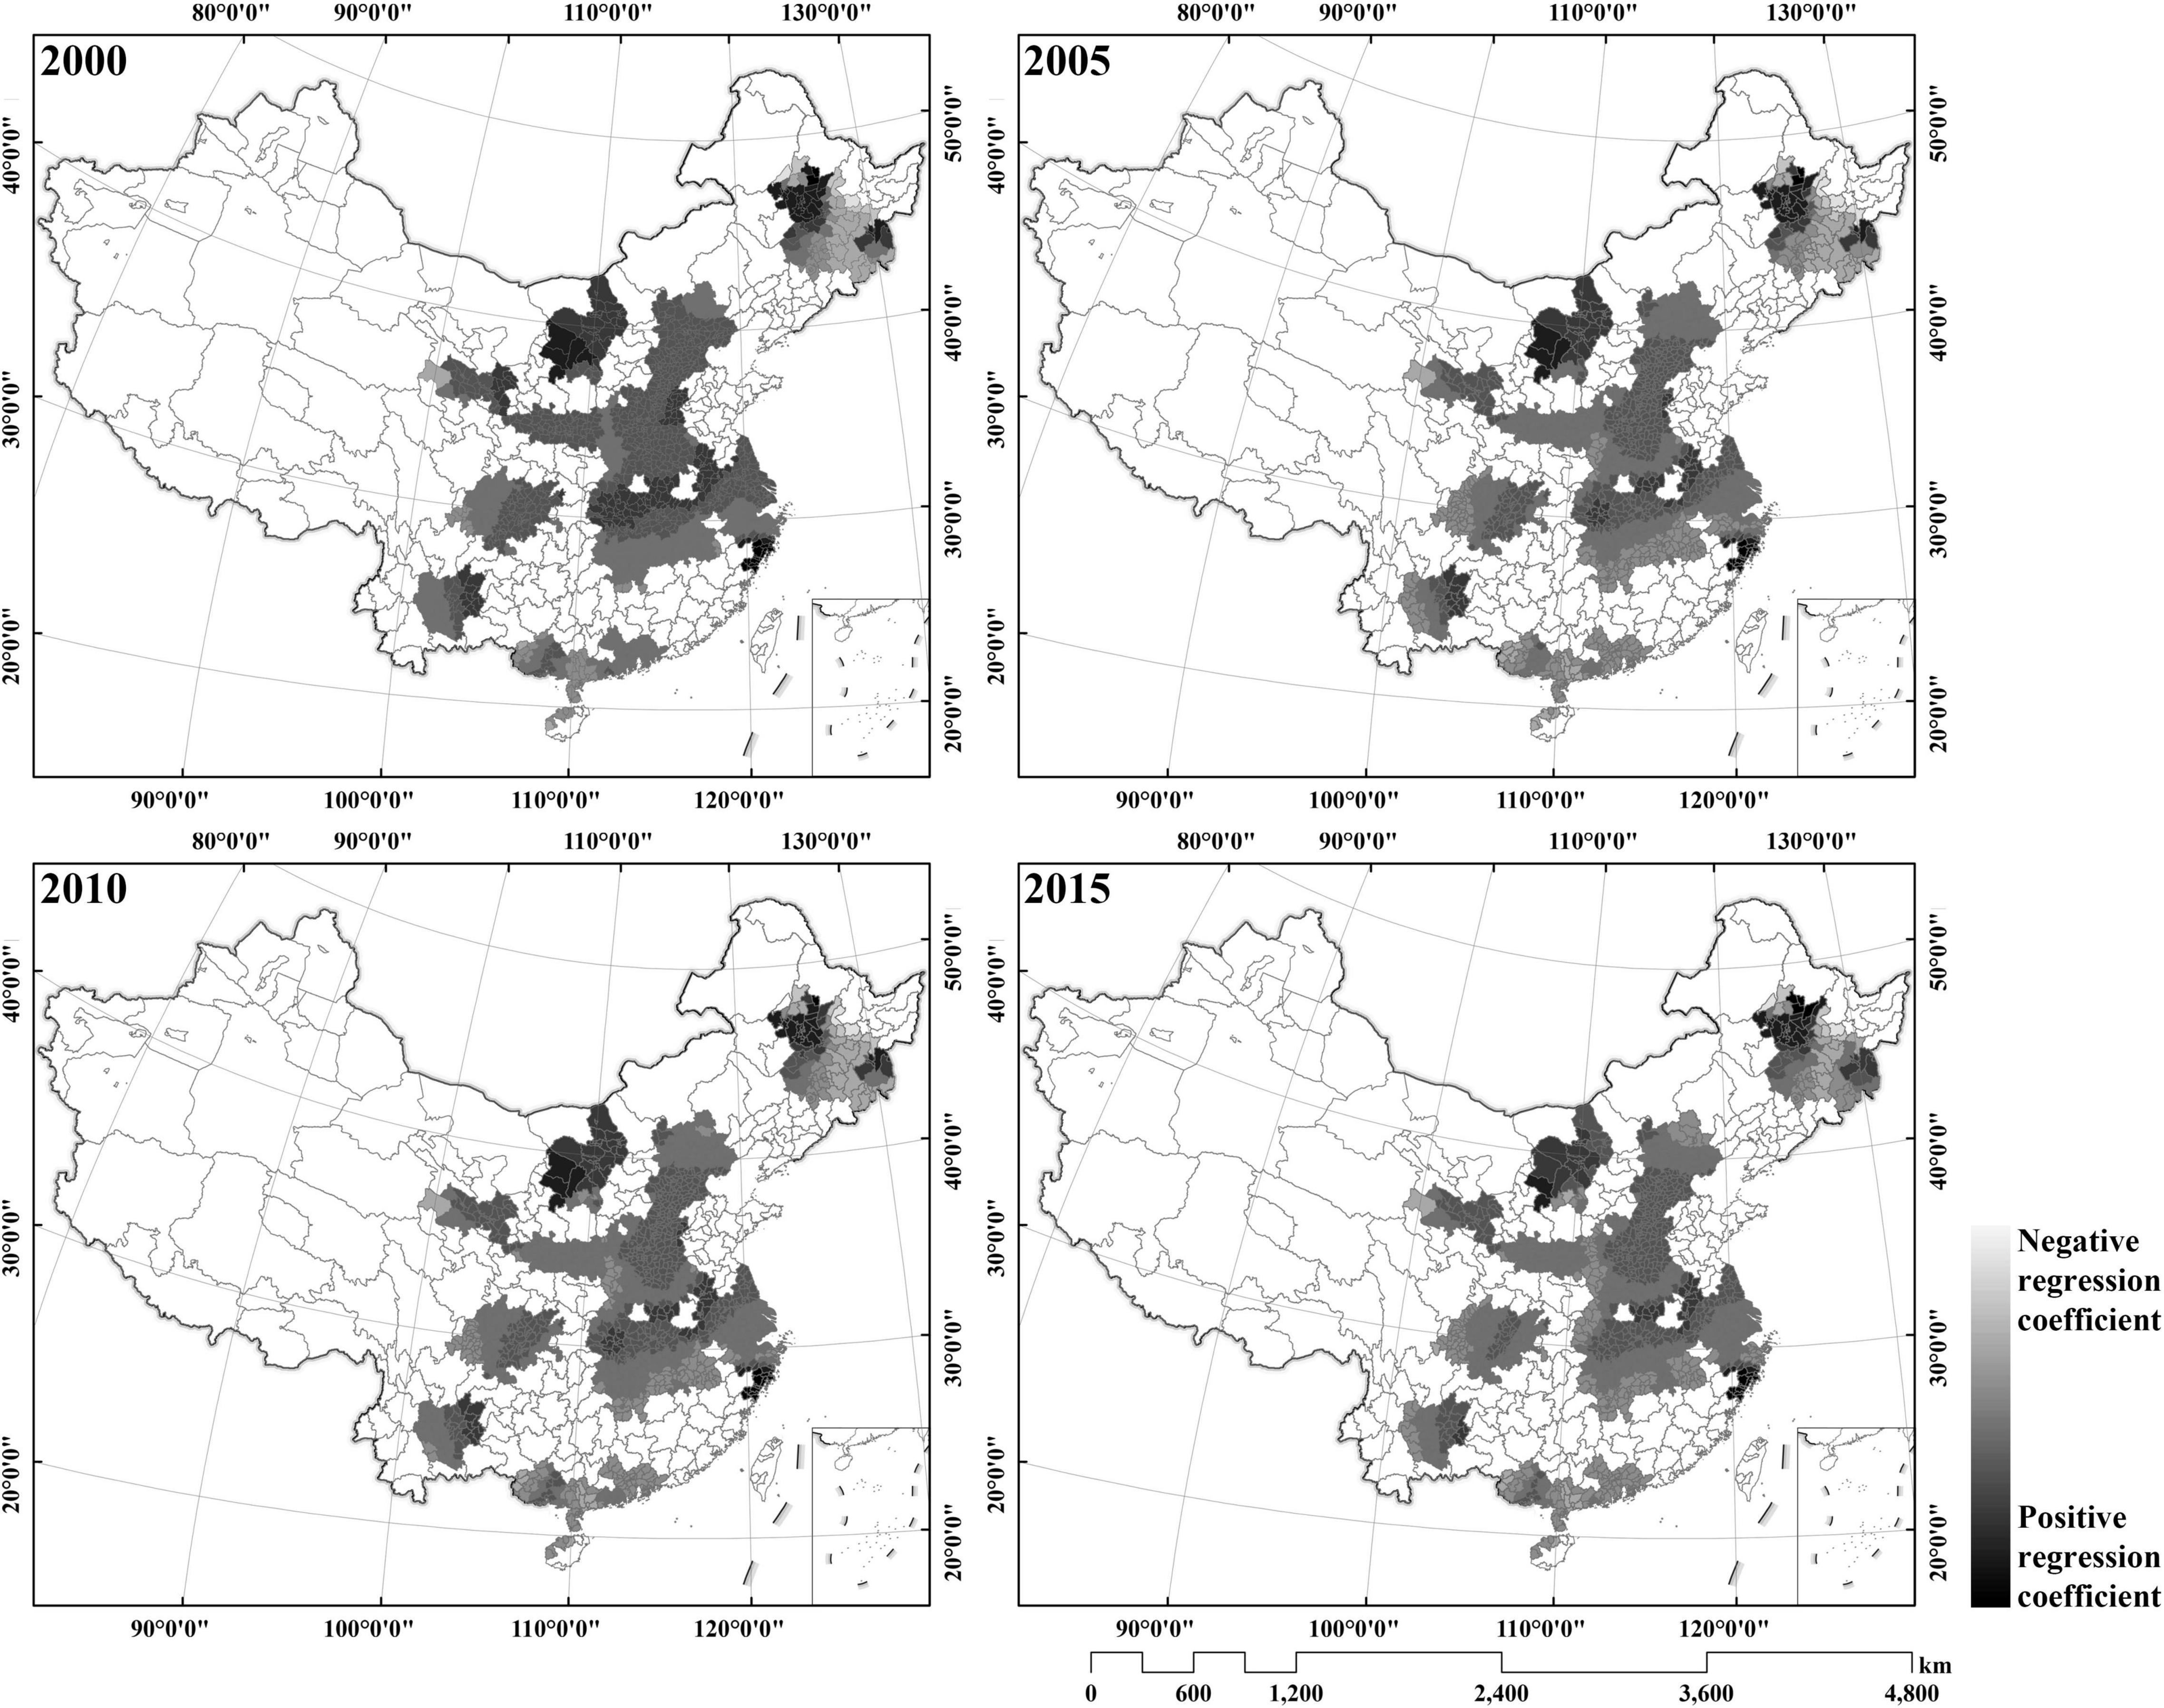
Figure 9. Spatial distributions of the city-area coefficients of the GWR models in typical urban agglomerations in China.
The discrepancy in the impacts of built-up areas on ecosystem services across different urban agglomerations is related to the varying levels of built-up area expansion into nearby natural environments, thus causing different levels of disturbances and pressures. Except for Beijing, Tianjing, and Shanghai in the BTH, MRTR, and YRD, most cities in the urban agglomerations in China are at an infant stage of development, and their urban development footprints are expanding. Such expansion is prevalent at the outskirts of cities and thereby intrudes and disturbs existing green-blue spaces such as farmland, grassland, woodland, and waterbodies around the core cities within individual urban agglomerations (Wang Z. et al., 2019). At the national scale, the difference in built-up areas’ effects on ecosystem services is due to the governments’ urban planning and industrial guidance. Most decision makers prioritize areas for urban and industrial development over spatial connectivity between the natural environment and urban development, which leads to an encroachment on ecological space, the destruction of ecological structure at the urban fringe, and reductions in biological habitats.
In Figure 10, the ratio of forestland yields a positive impact on ecosystem service values in all 12 urban agglomerations. The strength of the impact gradually declines from the central city to the periphery in each urban agglomeration. From Northwest to Southeast China, the impacts of the forestland use ratio gradually increased. The BTH, CP, and YRD in south-coastal and eastern China show higher impacts of the forestland use ratio.
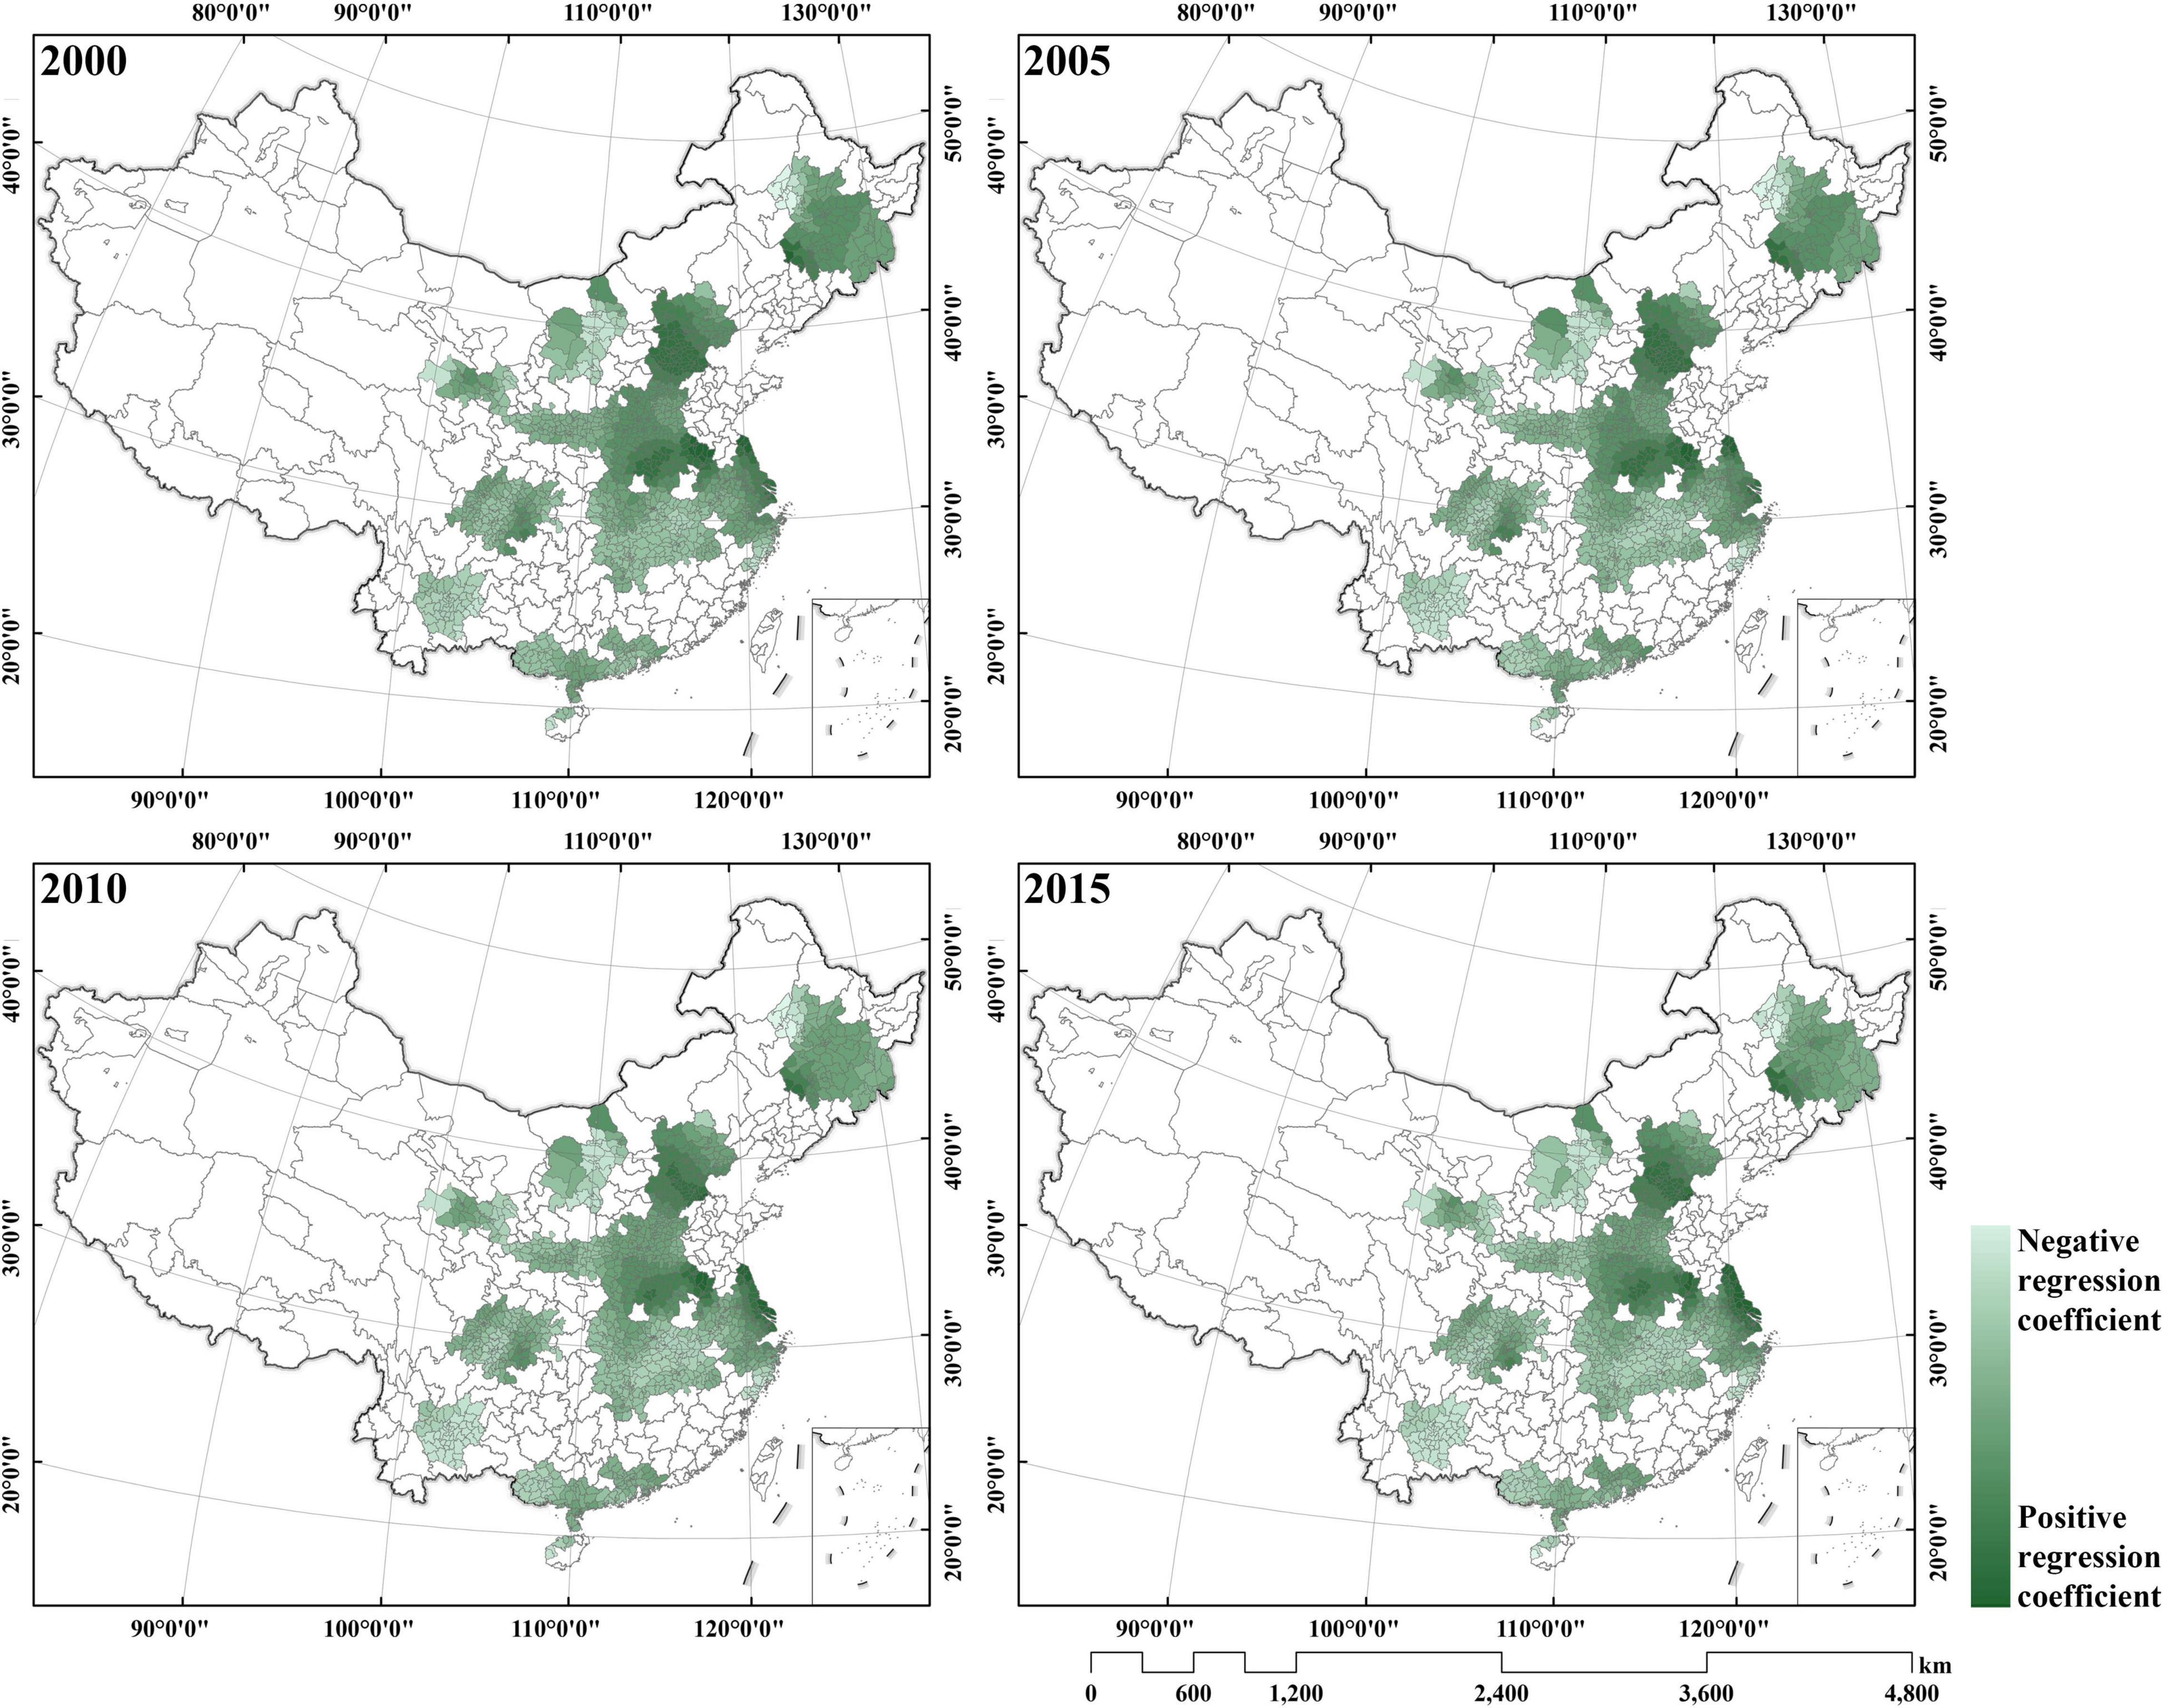
Figure 10. Spatial distributions of the forest-area coefficients of the GWR models in typical urban agglomerations in China.
Forest ecosystems often have the highest biodiversity with the most complete community structure, and they are considered one of the most complete ecosystems. From the northwest to the east, the forest structures in China gradually change from temperate grassland to subtropical evergreen broad-leaved forest, their forest biodiversity and community structure complexity are increasing, and subsequent outputs of ecosystem services are raised. Within each urban agglomeration, forestland in mountainous areas is a major provider of ecosystem services (Fujii et al., 2017). For example, by regulating the micro climate and conserving water and soil, Xishan Mountain in western BTH improved ecosystem quality in the northwestern part of the urban agglomeration (Wu et al., 2015).
Policy Recommendations
Elevation, precipitation, and fraction of woodland have positive impacts on ecosystem service values on urban agglomerations, while GDP, population, and proportion of built-up area negatively affect ecosystem service values. The impacts of elevation and fraction of woodland are gradually increasing, as the effects of GDP, population, and proportion of built-up area are declining and transitioned to positive in the most recent year. The effects of precipitation vary in each year.
As seen in Table 7, the six types of urban agglomeration are based on how the ecosystem services are impacted by environmental and socioeconomic factors: natural-factor dominated, socioeconomic-factor dominated, policy dominated, balanced, natural-factor inclined, and socioeconomic-factor inclined.
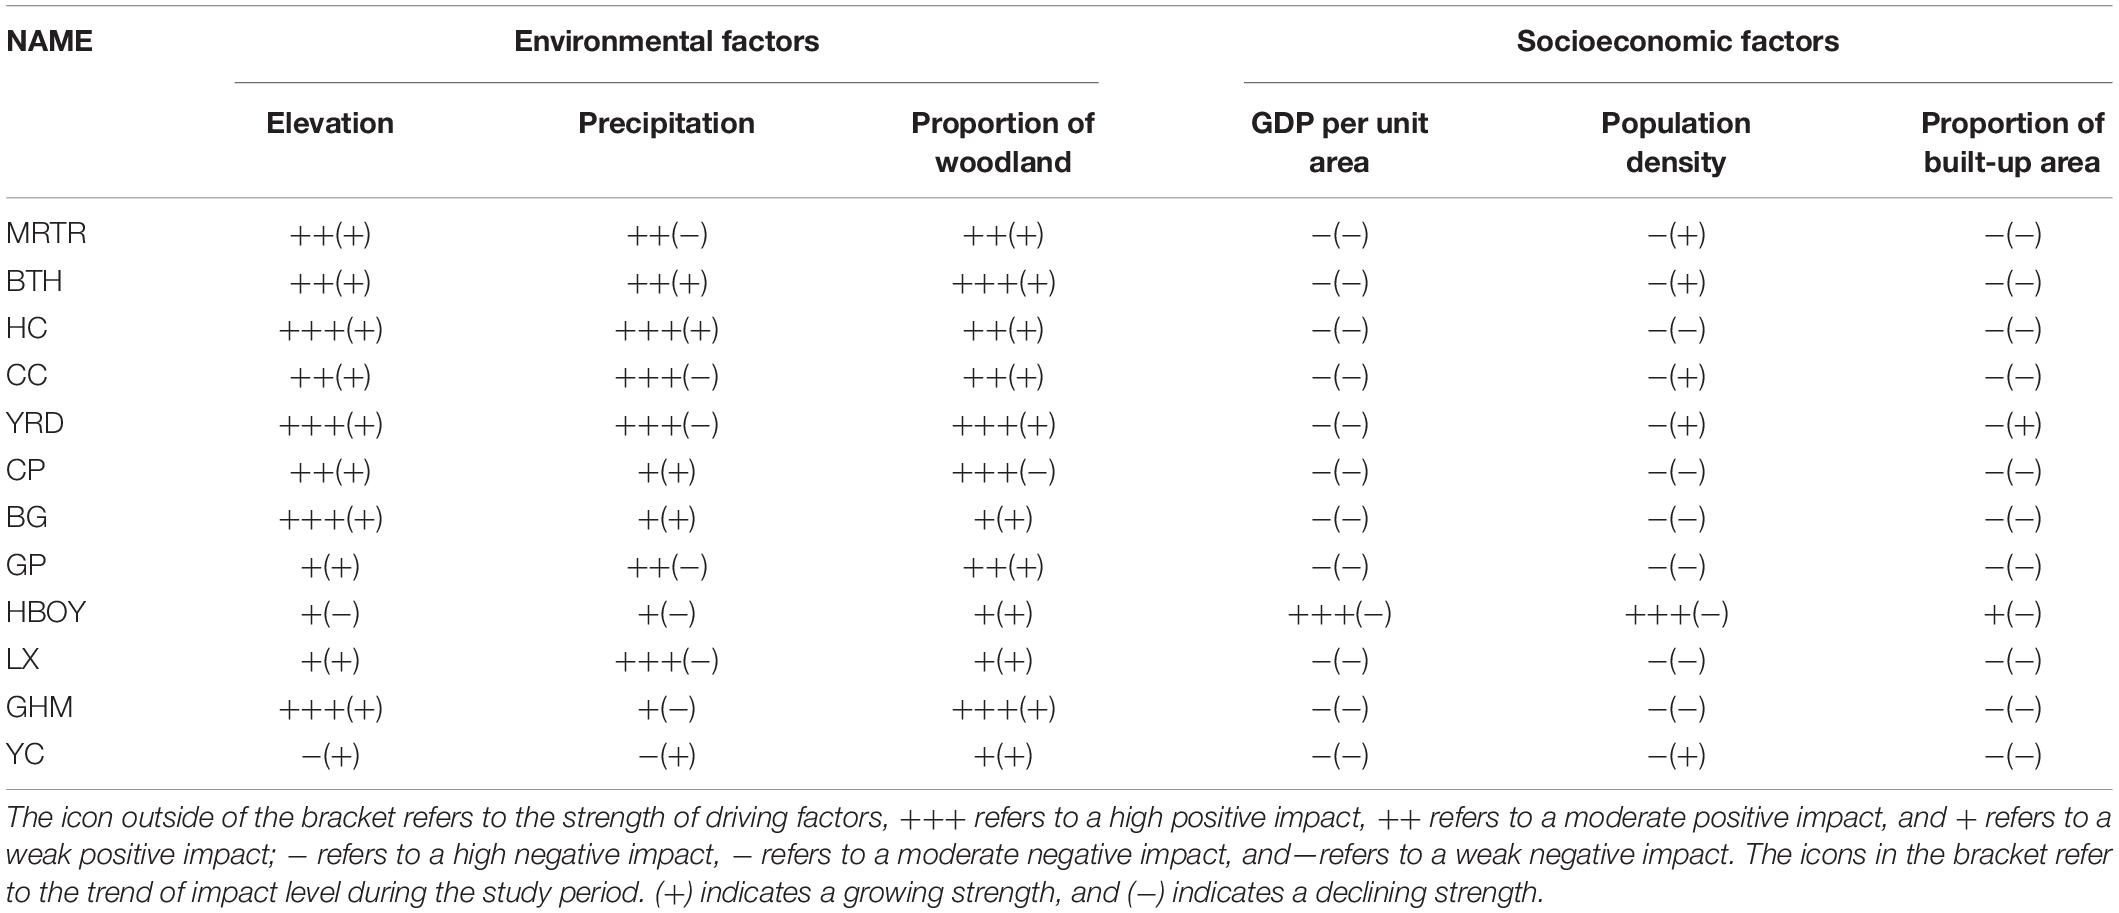
Table 7. Summary of driving factors on ecosystem services in each urban agglomeration.
Urban agglomerations with ecosystem services largely driven by natural factors often present fully developed urban patterns. They consist of large cities with stabilized industrial structures and fully developed urban structures. These cities’ industrial structures tend not to be significantly restructured during urban development, where minor adjustments are more common in urban agglomeration planning. In other words, socioeconomic factors do not play a major role in affecting ecosystem services. Instead, the changes in natural factors such as precipitation and temperature associated with geographical conditions impact ecosystem services more. Taking YRD as an example, its internal industrial structure and population scale tend to be stable with the core city Shanghai, including Nanjing, Hangzhou, Hefei and other first-tier cities. Its special topography located in the middle and lower reaches of the Yangtze River flood plain has a stronger influence on the development of its urban agglomeration. Therefore, YRD should both make full use of the plain area space within the border and consider strengthening the existing urban space and industrial transformation that could pose less burden on natural conditions.
Urban agglomerations driven largely by socioeconomic factors are still transitioning period to fully developed ones. These cases are mostly led by heavy industries (e.g., manufacturing and energy), while their natural conditions are minimally changed. Urban expansion to accommodate multiple industries is a core cause of ecosystem changes. For example, HBOY’s natural environment is homogenous, but the social, industrial and economic development of each city and county within the urban agglomeration are highly differentiated. This is because HBOY is located in northwest China, where the core cities, including Hohhot, Baotou, Ordos, and Yulin, heavily rely on secondary industries. Therefore, in the medium and long-term construction process, HBOY should reasonably plan the urban space and industrial development intensity on the basis of taking the best use of existing economic and industrial models while ensuring less damage to the current ecosystem.
Those urban agglomerations impacted by both natural and socioeconomic factors are increasing and are major focuses of urban agglomeration construction in China to balance the development across different regions in China (e.g., GHM, CC, HC, and GP). These urban agglomerations have well-developed core cities with respect to urban structure and industrial patterns, and the latter also have strong locational characteristics such as major functions (e.g., Hong Kong in the GHM is a financial center, Chengdu in the HC is a logistic hub, Harbin in the HC is a manufacturing base, and Xi’an in the GP is a leading tourism area). Meanwhile, the natural conditions vary widely within these urban agglomerations, which affect the ecosystem services within each. Development in these areas should balance the major goals of economic development and curb potential ecological crises. Ecosystem compensation mechanisms should be established by carefully utilizing internal ecological resources, adjusting industrial structures, and controlling urban expansion and economic development at a reasonable pace. Taking CC as an example, the GNP of its core cities, Chengdu and Chongqing, far exceeds that of the non-core cities within the urban agglomeration. Meanwhile, Chengdu, and Chongqing are located in mountainous areas that call for different development from those urban agglomerations in the plains. CC is recommended to consider developing third-tier industry in the inner core cities to promote the efficient economic development of current land use. Those non-core cities should stress expanding urban land use carefully and more efficiently to reach a harmonious development of the city and nature.
Despite being dominated by natural factors, some urban agglomerations also appear to be impacted by one or two socioeconomic drivers. These cases are often led by relatively developed core cities, but peripheral cities are less developed with regard to industrial structure and development modes. Decision makers should highlight the advantages of natural conditions such as geographical bases and climatic characteristics to protect existing natural resources and consider reasonable development of non-core cities with proper industrial structure and population planning (e.g., MRTR, BTH, CP). Taking BTH as an example, the urban agglomeration is surrounded by the Xishan mountains and Bohai Bay; meanwhile, the congregation effect of the core cities of Beijing and Tianjin is significant. However, the peripheral 13 cities in Hebei province are uneven regarding the economic development levels (Li et al., 2021). Thus, the subsequent development should first highlight the role of the core cities of Beijing and Tianjin in terms of natural environment protection. The strong economic power of the core cities can provide complementary revenues for neutralizing the environmental damage due to less developed peripheral cities in Hebei province.
Some urban agglomerations are impacted mostly by socioeconomic drivers and one or two natural factors at the same time (e.g., BG). Their core cities are developing in a single mode, making them highly impacted by socioeconomic factors. In addition, geographical conditions, such as widely varying elevations and climate features, foster higher biodiversity and subsequently affect the internal ecosystem service values. These urban agglomerations should address the industrial characteristics and structures of core and node cities by coordinating the ecosystem and land-use resources and mitigating the negative impacts of industrial development. For instance, the BG urban agglomeration is underdeveloped, and the core city of Nanning is still in the process of urban expansion. However, the BG is located among complicated geographical conditions where the wide range of elevations and rich biodiversity are strongly sensitive to urban expansion. Therefore, the priority of the Beibu Gulf urban agglomeration is to arrive at a rational urban plan to highlight the preservation of the ecosystem and carefully select regional locations for intensive economic development.
Some urban agglomerations were in the early stage of development with less intensive construction activities when the policy was proposed. This type of urban agglomeration is more policy-oriented, in which the differentiation degree between core city and node city is not obvious. The characteristics of socioeconomic and industrial development structure are unclear, and the urban land use agglomeration degree is not strong due to the influence of national macro-strategic layout on the ecological service function of urban agglomeration. In YC, for example, Lanzhou and Xining cities have a similar development stage. In addition, due to the limited traffic condition, the cities are less connected, showing less identifiable urban agglomeration structures. Therefore, YC should first consider how to strengthen connections between cities, in which the government should take the lead while considering how to strengthen control of the natural environment and living environment simultaneously.
Conclusion
With the growing level of urbanization, urban agglomerations are becoming a major form of urban development and should be considered in national-level spatial planning. Understanding the spatiotemporal dynamics of ecosystem services and the driving factors is necessary to provide decision makers with reference information for promoting explicit location strategies and guidelines for urban development. Using multiple data sources, this study quantified the values of ecosystem services in 12 typical urban agglomerations in China from 2000 to 2015. Furthermore, the potential driving factors are identified through GWR and OLS.
(1) The ecosystem service values were heterogeneous among individual urban agglomerations due to the internal variances in natural conditions and urbanization patterns. Spatial discrepancies also existed across different urban agglomerations in China because of the different locations and contexts. Most southern coastal urban agglomerations had higher ecosystem service values than those in the hinterland. From 2000 to 2015, the overall ecosystem service values declined in more than 70% of urban agglomerations, with reduction rates ranging from 0.02 to 4.27%. Such reductions were more common in the central areas of urban agglomerations.
(2) Elevation, precipitation, and fraction of woodland had positive impacts on ecosystem service values in urban agglomerations, while GDP, population, and proportion of built-up area had negative effects. The impacts of elevation and fraction of woodland were gradually increasing, while the effects of GDP, population, and proportion of built-up area were declining and transitioned to positive in the most recent year. The effects of precipitation varied each year.
(3) The driving factors impacted the ecosystem services of different urban agglomerations in different ways. Although the MRTR, BTH, and CP were impacted mostly by natural factors, one or two socioeconomic factors influenced the ecosystem service values. The ecosystem service values in the HBOY and BG were largely driven by socioeconomic factors, but the latter was also driven by elevation. The GHM, CC, HC, and GP had ecosystem services affected by both socioeconomic and natural factors. In the LX and YC, the development of ecosystem services was largely affected by policies, with minor impacts from socioeconomic and natural factors.
Data Availability Statement
The original contributions presented in the study are included in the article/supplementary material, further inquiries can be directed to the corresponding author/s.
Author Contributions
MS and CL: conceptualization, methodology, writing—review, and editing. CL: data curation and funding acquisition. MS: formal analysis, software, and writing—original draft. CL and FL: project administration and supervision. MS, LW, and CL: validation. MS and LW: visualization. All authors have read and agreed to the published version of the manuscript.
Funding
This work was supported by the Fundamental Research Funds for the Central Universities (No. 2021ZY38); Research and Development Plan of Beijing Municipal Science and Technology Commission (Grant No. D171100007117003); Special Fund for Beijing Common Construction Project.
Conflict of Interest
The authors declare that the research was conducted in the absence of any commercial or financial relationships that could be construed as a potential conflict of interest.
Publisher’s Note
All claims expressed in this article are solely those of the authors and do not necessarily represent those of their affiliated organizations, or those of the publisher, the editors and the reviewers. Any product that may be evaluated in this article, or claim that may be made by its manufacturer, is not guaranteed or endorsed by the publisher.
References
An, X., Ma, A., and Liu, D. (2008). A GIS-based study for optimizing the total emission control strategy in Lanzhou city. Environ. Model Assess. 13, 491–501. doi: 10.1007/s10666-007-9096-4
Bai, Y., Guo, C., Degen, A. A., Ahmad, A. A., Wang, W., Zhang, T., et al. (2020). Climate warming benefits alpine vegetation growth in Three-River Headwater Region, China. Sci. Total Environ. 742:140574. doi: 10.1016/j.scitotenv.2020.140574
Bi, M., Xie, G., and Yao, C. (2020). Ecological security assessment based on the renewable ecological footprint in the guangdong-hong kong-macao greater bay area, china. Ecol. Indic. 116:106432. doi: 10.1016/j.ecolind.2020.106432
Cao, Y. (2015). Forces driving changes in urban construction land of urban agglomerations in China. J. Urban Plan. Dev. 141:5014011.
Carpenter, S. R., Defries, R., Dietz, T., Mooney, H. A., Polasky, S., Reid, W. V., et al. (2006). Millennium ecosystem assessment: research needs. Science 314, 257–258. doi: 10.1126/science.1131946
Chen, J., Wang, D., Li, G., Sun, Z., Wang, X., Zhang, X., et al. (2020). Spatial and temporal heterogeneity analysis of water conservation in Beijing-Tianjin-Hebei urban agglomeration based on the geodetector and spatial elastic coefficient trajectory models. GeoHealth 4:e2020GH000248.
Chen, S., Li, G., Xu, Z., Zhuo, Y., Wu, C., and Ye, Y. (2019). Combined impact of socioeconomic forces and policy implications: spatial-temporal dynamics of the ecosystem services value in Yangtze River delta, China. Sustainability 11:2622. doi: 10.3390/su11092622
Chen, W., Chi, G., and Li, J. (2020). Ecosystem services and their driving forces in the middle reaches of the yangtze river urban agglomerations, China. Int. J. Environ. Res. Public Health 17:3717. doi: 10.3390/ijerph17103717
Costanza, R., D’Arge, R., de Groot, R., Farber, S., Grasso, M., Hannon, B., et al. (1997). The value of the world’s ecosystem services and natural capital. Nature 387, 253–260.
Dai, X., Wang, L., Huang, C., Fang, L., Wang, S., and Wang, L. (2020). Spatio-temporal variations of ecosystem services in the urban agglomerations in the middle reaches of the Yangtze River, China. Ecol. Indic. 115:106394. doi: 10.1016/j.ecolind.2020.106394
Fan, Q., Yang, S., and Liu, S. (2019). Asymmetrically spatial effects of urban scale and agglomeration on haze pollution in china. Int. J. Environ. Res. Public Health 16:4936. doi: 10.3390/ijerph16244936
Fang, C. (2015). Important progress and future direction of studies on China’s urban agglomerations. J. Geogr. Sci. 25, 1003–1024. doi: 10.1007/s11442-015-1216-5
Fang, C., and Yu, D. (2017). Urban agglomeration: an evolving concept of an emerging phenomenon. Landsc. Urban Plan. 162, 126–136. doi: 10.1016/j.landurbplan.2017.02.014
Fawcett, C. B. (1932). Distribution of the urban population in great britain, 1931. Geogr. J. 79, 100–116. doi: 10.2307/1785089
Fotheringham, A. S., Brunsdon, C., and Charlton, M. (2002). Geographically Weighted Regression: The Analysis of Spatially Varying Relationships. Chichester: Wiley.
Fujii, H., Sato, M., and Managi, S. (2017). Decomposition analysis of forest ecosystem services values. Sustainability 9:687. doi: 10.3390/su9050687
Gao, J., and Wang, L. (2019). Embedding spatiotemporal changes in carbon storage into urban agglomeration ecosystem management — a case study of the Yangtze River Delta, China. J. Clean Prod. 237:117764. doi: 10.1016/j.jclepro.2019.117764
Gao, J., Yu, Z., Wang, L., and Vejre, H. (2019). Suitability of regional development based on ecosystem service benefits and losses: a case study of the yangtze river delta urban agglomeration, China. Ecol. Indic. 107:105579. doi: 10.1016/j.ecolind.2019.105579
Gaubatz, P. (1999). China’s urban transformation: patterns and processes of morphological change in Beijing, Shanghai and Guangzhou. Urban Stud. 36, 1495–1521. doi: 10.1080/0042098992890
Gong, P., Li, X., and Zhang, W. (2019). 40-Year (1978–2017) human settlement changes in China reflected by impervious surfaces from satellite remote sensing. Sci. Bull. 64, 756–763. doi: 10.1016/j.scib.2019.04.024
Gottmann, J. (1957). Megalopolis or the urbanization of the northeastern seaboard. Econ. Geogr. 33, 189–200. doi: 10.2307/142307
Haase, D., Schwarz, N., Strohbach, M., Kroll, F., and Seppelt, R. (2012). Synergies, trade-offs, and losses of ecosystem services in urban regions: an integrated multiscale framework applied to the Leipzig-Halle region, Germany. Ecol. Soc. 17:22.
Han, J., Gao, M., and Sun, Y. (2019). Research on the measurement and path of urban agglomeration growth effect. Sustainability 11:5179. doi: 10.1016/j.envres.2021.112097
He, Z. (2020). Spatial-temporal fractal of urban agglomeration travel demand. Phys. A 549:124503. doi: 10.1016/j.physa.2020.124503
Hu, M., Li, Z., Wang, Y., Jiao, M., Li, M., and Xia, B. (2019). Spatio-temporal changes in ecosystem service value in response to land-use/cover changes in the Pearl River Delta. Resour. Conserv. Recycle 149, 106–114. doi: 10.1016/j.resconrec.2019.05.032
Huang, X., Huang, X., Liu, M., Wang, B., and Zhao, Y. (2020). Spatial-temporal dynamics and driving forces of land development intensity in the western China from 2000 to 2015. Chinese Geogr. Sci. 30, 16–29.
Jie, Z., Jiang-Feng, L. I., and Xiao-Wei, Y. A. (2014). Spatio-temporal dynamics of ecosystem service value in Wuhan Urban Agglomeration. Chinese J. Appl. Ecol. 25, 883–891.
Kang, P., Chen, W., Hou, Y., and Li, Y. (2018). Linking ecosystem services and ecosystem health to ecological risk assessment: a case study of the Beijing-Tianjin-Hebei urban agglomeration. Sci. Total Environ. 636, 1442–1454. doi: 10.1016/j.scitotenv.2018.04.427
Ketema, H., Wei, W., Legesse, A., Wolde, Z., Temesgen, H., Yimer, F., et al. (2020). Quantifying smallholder farmers’ managed land use/land cover dynamics and its drivers in contrasting agro-ecological zones of the East African Rift. Glob. Ecol. Conserv. 21:e898.
Lan, H. X., Zhou, C. H., Wang, L. J., Zhang, H. Y., and Li, R. H. (2004). Landslide hazard spatial analysis and prediction using GIS in the Xiaojiang watershed, Yunnan, China. Eng. Geol. 76, 109–128.
Li, C., and Zhao, J. (2019). Investigating the spatiotemporally varying correlation between urban spatial patterns and ecosystem services: a case study of Nansihu Lake Basin, China. Isprs. Int. J. Geo Inf. 8:346. doi: 10.3390/ijgi8080346
Li, F., Yao, N., Liu, D., Liu, W., Sun, Y., Cheng, W., et al. (2021). Explore the recreational service of large urban parks and its influential factors in city clusters – experiments from 11 cities in the beijing-tianjin-hebei region. J. Clean. Prod. 314:128261. doi: 10.1016/j.jclepro.2021.128261
Li, H., Guo, S., Cui, L., Yan, J., Liu, J., and Wang, B. (2015). Review of renewable energy industry in Beijing: development status, obstacles and proposals. Renew. Sustain. Energy Rev. 43, 711–725. doi: 10.1016/j.rser.2014.11.074
Li, H., Peng, J., Yanxu, L., and Yi Na, H. (2017). Urbanization impact on landscape patterns in Beijing City, China: a spatial heterogeneity perspective. Ecol. Indic. 82, 50–60. doi: 10.1016/j.ecolind.2017.06.032
Li, T., Li, J., and Wang, Y. (2019). Carbon sequestration service flow in the guanzhong-tianshui economic region of china: how it flows, what drives it, and where could be optimized? Ecol. Indic. 96, 548–558. doi: 10.1016/j.ecolind.2018.09.040
Li, Z., Sun, Z., Tian, Y., Zhong, J., and Yang, W. (2019). Impact of land Use/Cover change on Yangtze River delta urban agglomeration ecosystem services value: temporal-spatial patterns and cold/hot spots ecosystem services value change brought by urbanization. Int. J. Environ. Res. Public Health 16:123. doi: 10.3390/ijerph16010123
Liu, C., Wang, T., and Guo, Q. (2018). Factors aggregating ability and the regional differences among china’s urban agglomerations. Sustainability 10:4179. doi: 10.3390/su10114179
Liu, L., Chen, X., Chen, W., and Ye, X. (2020). Identifying the impact of landscape pattern on ecosystem services in the middle reaches of the Yangtze River urban agglomerations, China. Int. J. Environ. Res. Public Health 17:5063. doi: 10.3390/ijerph17145063
Liu, Y., Zhang, J., Li, C., Zhou, G., Fu, Z., and Liu, D. (2017). Influential intensity of urban agglomeration on evolution of eco-environmental pressure: a case study of changchun, china. Chinese Geogr. Sci. 27, 638–647. doi: 10.1007/s11769-017-0891-9
Luo, Q., Zhou, J., Li, Z., and Yu, B. (2020). Spatial differences of ecosystem services and their driving factors: a comparation analysis among three urban agglomerations in china’s yangtze river economic belt. Sci. Total Environ. 725, 138452. doi: 10.1016/j.scitotenv.2020.138452
Lyu, R., Clarke, K. C., Zhang, J., Feng, J., Jia, X., and Li, J. (2019). Spatial correlations among ecosystem services and their socio-ecological driving factors: a case study in the city belt along the Yellow River in Ningxia, China. Appl. Geogr. 108, 64–73.
Ma, L., Chen, M., Fang, F., and Che, X. (2019). Research on the spatiotemporal variation of rural-urban transformation and its driving mechanisms in underdeveloped regions: gansu province in western China as an example. Sustain. Cities Soc. 50:101675.
Ma, Q., Li, Y., and Xu, L. (2021). Identification of green infrastructure networks based on ecosystem services in a rapidly urbanizing area. J. Clean. Prod. 300, 126945. doi: 10.1016/j.jclepro.2021.126945
NBS (2020). China Statistical Yearbook & National Agricultural Product Cost - Benefit Data Collection. Available online at http://www.stats.gov.cn/tjsj/ndsj/2020/indexch.htm [Accessed March 17, 2022].
NDRC (2016). Outline Of The Urban Agglomeration Plan. Available online at http://www.gov.cn/xinwen/2017-01/05/5156816/files/4e3c18bb7f2d4712b7264f379e7cb416.pdf [Accessed March 17, 2022].
Ng, M. K., and Tang, W. (2013). Urban system planning in China: a case study of the pearl river delta. Urban Geogr 20, 591–616.
NPC (2006). Outline Of The Eleventh Five-Year Plan. Available online at: http://www.gov.cn/ztzl/2006-03/16/content_228841.htm [Accessed March 17, 2022].
NPC (2016). Outline of the 13th Five-Year Plan. Available online at: http://www.gov.cn/xinwen/2016-03/17/content_5054992.htm [Accessed March 17, 2022].
Peng, B., Huang, Q., Elahi, E., and Wei, G. (2019). Ecological environment vulnerability and driving force of Yangtze River urban agglomeration. Sustainability 11:6623. doi: 10.3390/su11236623
Shao, Y., Yuan, X., Ma, C., Ma, R., and Ren, Z. (2020). Quantifying the spatial association between land use change and ecosystem services value: a case study in xi’an, china. Sustainability 12:4449. doi: 10.3390/su12114449
Shi, Q., Yan, X., Jia, B., and Gao, Z. (2020). Freight Data-Driven research on evaluation indexes for urban agglomeration development degree. Sustainability 12:4589. doi: 10.3390/su12114589
Song, F., Yang, X., and Wu, F. (2019). Suitable pattern of the natural environment of human settlements in the lower reaches of the Yangtze River. Atmosphere 10:200. doi: 10.3390/atmos10040200
Song, J. (2010). Agglomeration economies of china’s three major urban agglomerations, 1994–2008. Intl. Area Rev. 13, 25–58. doi: 10.1177/223386591001300402
Sun, W., Li, D., Wang, X., Li, R., Li, K., and Xie, Y. (2019). Exploring the scale effects, trade-offs and driving forces of the mismatch of ecosystem services. Ecol. Indic. 103, 617–629. doi: 10.1016/j.ecolind.2019.04.062
Sun, X., Crittenden, J. C., Li, F., Lu, Z., and Dou, X. (2018). Urban expansion simulation and the spatio-temporal changes of ecosystem services, a case study in Atlanta Metropolitan area, USA. Sci. Total Environ. 622-623, 974–987. doi: 10.1016/j.scitotenv.2017.12.062
Sun, Y., and Zhao, S. (2018). Spatiotemporal dynamics of urban expansion in 13 cities across the Jing-Jin-Ji Urban Agglomeration from 1978 to 2015. Ecol. Indic. 87, 302–313. doi: 10.1016/j.ecolind.2017.12.038
Tian, M. (2019). The difference between economic globalization and new urban agglomeration. Ekoloji 28, 3919–3926.
Tooke, T. R., Klinkenber, B., and Coops, N. C. (2010). A geographical approach to identifying vegetation-related environmental equity in Canadian cities. Environ. Plan. B 37, 1040–1056. doi: 10.1068/b36044
Wang, J., Zhou, W., Pickett, S. T., Yu, W., and Li, W. (2019). A multiscale analysis of urbanization effects on ecosystem services supply in an urban megaregion. Sci Total Environ. 662, 824–833. doi: 10.1016/j.scitotenv.2019.01.260
Wang, L. J., and Cui, W. J. (2017). Difference analysis of the impact of economic globalization on new urban agglomeration based on numerical analysis. Agro Food Ind. Hi Tech 28, 327–330.
Wang, Z., Liang, L., Sun, Z., and Wang, X. (2019). Spatiotemporal differentiation and the factors influencing urbanization and ecological environment synergistic effects within the Beijing-Tianjin-Hebei urban agglomeration. J. Environ. Manag. 243, 227–239. doi: 10.1016/j.jenvman.2019.04.088
Wu, J. S., Cao, Q. W., Shi, S. Q., Huang, X. L., and Lu, Z. Q. (2015). Spatio-temporal variability of habitat quality in Beijing-Tianjin-Hebei Area based on land use change. Chinese J. Appl. Ecol. 26, 3457–3466.
Wu, Y. B., Zhu, B., Eissenstat, D. M., Wang, S., Tang, Y., and Cui, X. (2021). Warming and grazing interact to affect root dynamics in an alpine meadow. Plant Soil 459, 109–124. doi: 10.1007/s11104-020-04681-3
Xie, G. D., Lu, C. X., Leng, Y. F., Zheng, D. U., and Li, S. C. (2003). Ecological assets valuation of the Tibetan Plateau. J. Nat. Resour. 18, 189–196.
Xie, G. D., Zhen, L., Lu, C., Xiao, Y., and Chen, C. (2008). Expert knowledge based valuation method of ecosystem services in China. J. Nat. Resour. 23, 911–919.
Xie, H., He, Y., and Xie, X. (2017). Exploring the factors influencing ecological land change for China’s Beijing-Tianjin-Hebei Region using big data. J. Clean. Prod. 142, 677–687.
Yu, G., Lu, C., and Xie, G. (2005). Progress in ecosystem services of grassland. Resour. Sci. 27, 172–179.
Zhang, Y., Zhao, L., Liu, J., Liu, Y., and Li, C. (2015). The impact of land cover change on ecosystem service values in urban agglomerations along the coast of the Bohai Rim, China. Sustainability 7, 10365–10387. doi: 10.3390/su70810365
Zhong, Y., Lin, A., He, L., Zhou, Z., and Yuan, M. (2020). Spatiotemporal dynamics and driving forces of urban land-use expansion: a case study of the yangtze River economic belt, China. Remote Sens. 12:287. doi: 10.3390/rs12020287
Keywords: urban agglomeration, ecosystem service, driving factor, spatiotemporal dynamics, urban ecology
Citation: Shao M, Wu L, Li F and Lin C (2022) Spatiotemporal Dynamics of Ecosystem Services and the Driving Factors in Urban Agglomerations: Evidence From 12 National Urban Agglomerations in China. Front. Ecol. Evol. 10:804969. doi: 10.3389/fevo.2022.804969
Received: 29 October 2021; Accepted: 07 March 2022;
Published: 06 May 2022.
Edited by:
Emily J. Flies, University of Tasmania, AustraliaReviewed by:
Ling Yao, Institute of Geographic Sciences and Natural Resources Research (CAS), ChinaIan Douglas, The University of Manchester, United Kingdom
Copyright © 2022 Shao, Wu, Li and Lin. This is an open-access article distributed under the terms of the Creative Commons Attribution License (CC BY). The use, distribution or reproduction in other forums is permitted, provided the original author(s) and the copyright owner(s) are credited and that the original publication in this journal is cited, in accordance with accepted academic practice. No use, distribution or reproduction is permitted which does not comply with these terms.
*Correspondence: Chensong Lin, linchensong@bjfu.edu.cn